ADVISORY – ALLEGHENY COUNTY – Lt. Gov. Austin Davis, Department of Aging to Announce New Initiative to Make the Commonwealth Friendlier, More Welcoming for Older Adults
Lt. Gov. Austin Davis will join Pennsylvania Department of Aging Secretary Jason Kavulich and local leaders to highlight current initiatives in Southwest PA to create age-friendly communities – all with the goal of encouraging more cities, towns, and neighborhoods in the Commonwealth to ensure older Pennsylvanians have the services and support they need to age with dignity.
The event will feature presentations on what an age-friendly community looks like, the successes of these communities, and what it means for older Pennsylvanians.
The Department of Aging has incorporated the development of age-friendly communities throughout Pennsylvania as part of Aging Our Way, PA – the 10-year strategic plan that will help transform service delivery to ensure all Pennsylvanians can live healthy, fulfilling lives as they age. The Age-Friendly PA initiative will support existing communities and encourage new communities to participate throughout the Commonwealth.
WHO: Lt. Gov. Austin Davis Secretary of Aging Jason Kavulich Congresswoman Summer Lee Senator Nick Pisciottano Rich Fitzgerald, executive director, Southwestern Pennsylvania Commission Mary Esther Van Shura, AARP executive council member Paul Winkler, Southwest PA Partnership for Aging board member Dr. Megan Nagel, Penn State regional chancellor Dr. Elizabeth Farmer, dean, University of Pittsburgh School of Social Work Laura Poskin, executive director, Age-Friendly Greater Pittsburgh
WHEN: Thursday, April 17, 2025, at 2:30 PM
WHERE: Penn State Greater Allegheny 4000 University Dr. McKeesport, 15132 *Ostermayer Room in the Student Community Center
MEDIA RSVP: Media interested in attending must RSVP with the name of photographer/reporter to agingcomms@pa.gov
MEDIA CONTACT: Jack Eilber, Revenue, agingcomms@pa.gov
MORRISVILLE, Vt., April 16, 2025 (GLOBE NEWSWIRE) — Union Bankshares, Inc. (NASDAQ – UNB) today announced results for the three months ended March 31, 2025 and declared a regular quarterly cash dividend. Consolidated net income for the three months ended March 31, 2025 was $2.5 million, or $0.55 per share, compared to $2.4 million, or $0.53 per share, for the same period in 2024.
Balance Sheet
Total assets were $1.52 billion as of March 31, 2025 compared to $1.42 billion as of March 31, 2024, an increase of $107.2 million, or 7.6%. Loan demand was strong in 2024 and through the first three months of 2025 resulting in an increase of $128.0 million, or 12.3 %, to reach $1.16 billion as of March 31, 2025 including $4.1 million in loans held for sale, compared to $1.04 billion as of March 31, 2024, with $3.4 million in loans held for sale. Despite the economic uncertainty in the future, asset quality remains strong with minimal past due loans and net recoveries of $1 thousand for each of the periods ended March 31, 2025 and March 31, 2024.
In addition to the balance sheet growth in loans, qualifying residential loans of $25.8 million were sold to the secondary market for the three months ended March 31, 2025 compared to sales of $21.7 million for the three months ended March 31, 2024.
Total deposits were $1.18 billion as of March 31, 2025 compared to deposits of $1.17 billion as of March 31, 2024, and included brokered deposits of $31.0 million and $101.5 million for the respective periods. Borrowed funds consisted of Federal Home Loan Bank advances of $240.7 million as of March 31, 2025 compared to $115.7 million as of March 31, 2024. There were also $35.0 million in advances from the Federal Reserve’s Bank Term Funding Program outstanding as of March 31, 2024.
The Company had total equity capital of $70.1 million and a book value per share of $15.44 as of March 31, 2025 compared to $63.8 million and a book value of $14.12 per share as of March 31, 2024. Total equity capital is reduced by accumulated other comprehensive loss as it relates to the fair market value adjustment for investment securities. Accumulated other comprehensive loss as of March 31, 2025 was $31.4 million compared to $34.9 million as of March 31, 2024.
Income Statement
Consolidated net income was $2.5 million for the first quarter of 2025 compared to $2.4 million for the first quarter of 2024, an increase of $84 thousand, or 3.5%. Interest income increased $2.7 million, or 17.1%, to $18.3 million for the three months ended March 31, 2025 compared to $15.6 million for the three months ended March 31, 2024, due to an increase in yield on earning assets and an increase in volume for the comparison periods. Similarly, interest expense increased $1.4 million, or 21.3%, to $8.0 million for the three months ended March 31, 2025 compared to $6.6 million for the three months ended March 31, 2024 due to an increase in rates paid on customer deposits and higher rates on wholesale funding and to a lesser extent an increase in volumes. As a result of these changes during the comparison periods, net interest income increased $1.3 million, or 14.0%.
Credit loss expense of $235 thousand was recorded for the three months ended March 31, 2025 compared to a benefit of $230 thousand recorded for the three months ended March 31, 2024. The increase in expense was to support loan growth and was not due to a deterioration in credit quality. Management continues to assess the adequacy of the Allowance for Credit Losses quarterly.
Noninterest income decreased $127 thousand,or 4.9% to $2.4 million for the three months ended March 31, 2025 compared to $2.6 million for the same period in 2024. The decrease was due to prepayment penalties of $117 thousand received in the first quarter of 2024 that did not recur in 2025, an increase in the loss on investment securities related to deferred compensation plans of $130 thousand, partially offset by an increase in gains on sale of qualifying loans to the secondary market of $102 thousand. Noninterest expenses increased $601 thousand, or 6.5%, to $9.8 million for the three months ended March 31, 2025 compared to $9.2 million for the same period in 2024. The increase during the comparison period was due to increases of $358 thousand in salaries and wages, $92 thousand in employee benefits, $83 thousand in occupancy expenses, and $106 thousand in equipment expenses, partially offset by a decrease of $38 thousand in other expenses. Income tax expense was $150 thousand for the three months ended March 31, 2025 a decrease of $15 thousand compared to income tax expense of $165 thousand for the three months ended March 31, 2024.
Dividend Declared
The Board of Directors declared a cash dividend of $0.36 per share for the quarter payable May 1, 2025 to shareholders of record as of April 26, 2025.
About Union Bankshares, Inc.
Union Bankshares, Inc., headquartered in Morrisville, Vermont, is the bank holding company parent of Union Bank, which provides commercial, retail, and municipal banking services, as well as, wealth management services throughout northern Vermont and New Hampshire. Union Bank operates 18 banking offices, three loan centers, and multiple ATMs throughout its geographical footprint.
Since 1891, Union Bank has helped people achieve their dreams of owning a home, saving for retirement, starting or expanding a business and assisting municipalities to improve their communities. Union Bank has earned an exceptional reputation for residential lending programs and has been recognized by the US Department of Agriculture, Rural Development for the positive impact made in lives of low to moderate home buyers. Union Bank is consistently one of the top Vermont Housing Finance Agency mortgage originators and has also been designated as an SBA Preferred lender for its participation in small business lending. Union Bank’s employees contribute to the communities where they work and reside, serving on non-profit boards, raising funds for worthwhile causes, and giving countless hours in serving our fellow residents. All of these efforts have resulted in Union receiving and “Outstanding” rating for its compliance with the Community Reinvestment Act (“CRA”) in its most recent examination. Union Bank is proud to be one of the few independent community banks serving Vermont and New Hampshire and we maintain a strong commitment to our core traditional values of keeping deposits safe, giving customers convenient financial choices and making loans to help people in our local communities buy homes, grow businesses, and create jobs. These values–combined with financial expertise, quality products and the latest technology–make Union Bank the premier choice for your banking services, both personal and business. Member FDIC. Equal Housing Lender.
Forward-Looking Statements
Statements made in this press release that are not historical facts are forward-looking statements. Investors are cautioned that all forward- looking statements necessarily involve risks and uncertainties, and many factors could cause actual results and events to differ materially from those contemplated in the forward-looking statements. When we use any of the words “believes,” “expects,” “anticipates” or similar expressions, we are making forward-looking statements. The following factors, among others, could cause actual results and events to differ from those contemplated in the forward-looking statements: uncertainties associated with general economic conditions; changes in the interest rate environment; inflation; political, legislative or regulatory developments; acts of war or terrorism; the markets’ acceptance of and demand for the Company’s products and services; technological changes, including the impact of the internet on the Company’s business and on the financial services market place generally; the impact of competitive products and pricing; and dependence on third party suppliers. For further information, please refer to the Company’s reports filed with the Securities and Exchange Commission atwww.sec.govor on our investor page atwww.ublocal.com.
London, UK, April 16, 2025 (GLOBE NEWSWIRE) — AgriDex, a global marketplace for agriculture, launches Loam, a next-generation payments platform to transform cross-border transactions in the agricultural sector. Loam leverages digital payments powered by stablecoins to deliver fast, low-cost, and reliable settlements. It is targeting a $40 million transaction volume by the end of the year.
Traditional systems, reliant on banks and intermediaries, often burden agricultural businesses with slow settlements and high fees. For every tonne of cocoa shipped from Nigeria to Rotterdam, roughly 12.6% of the total trade cost is spent on transaction costs, taking weeks to process payments. This directly impacts the price and availability of food and farmers’ revenues.
Loam disrupts this model, making cross-border payment accessible for farmers, producers, and traders. It eliminates financial bottlenecks and enables near-instant global payments and automated invoice processing. Loam settles transactions in under 5 seconds with fees below 0.5%, empowering agricultural businesses to scale faster and more efficiently.
“Agriculture is one of the few industries in which every country actively participates, regardless of economic or political differences. Unlike other commodities, agricultural goods are universally traded because food security is a global priority. Loam ensures its solution is relevant and widely applicable and allows seamless cross-border transactions, helping producers, traders, and buyers operate more efficiently. Better payments mean a stronger food supply chain,”– said Henry Duckworth, CEO and Founder of AgriDex.
Designed to be user-friendly, Loam offers an intuitive experience so farmers can deposit, withdraw, and transact using simple interfaces and PIN-based security—no technical expertise is required. Loam supports multi-currency payments and ensures all transactions occur within a secure, verified network of users, creating a trusted environment for smaller farmers and traders.
About AgriDex AgriDex is creating a seamless, transparent, and cost-efficient global marketplace for agriculture. It has partnered with some of the world’s largest food producers and traders and tokenized trades involving wine, olive oil, cocoa, coffee, and livestock. By leveraging the Solana blockchain, AgriDex enables cheap and instant settlement and supply chain transparency across the entire agricultural value chain. The company has raised $9M from leading industry investors, including Portal Ventures, Endeavour Ventures, and its customers. For more information, please visit https://agridex.com/
Posted on Apr 16, 2025 in Latest Department News, Newsroom
STATE OF HAWAIʻI
KA MOKU ʻĀINA O HAWAIʻI
DEPARTMENT OF AGRICULTURE
ʻOIHANA MAHIʻAI
JOSH GREEN, M.D. GOVERNOR
KE KIAʻĀINA
SHARON HURD CHAIRPERSON
HAWAIʻI BOARD OF AGRICULTURE
DEAN M. MATSUKAWA DEPUTY TO THE CHAIRPERSON
HAWAIʻI BOARD OF AGRICULTURE
HDOA CONTINUES COCONUT RHINOCEROS BEETLE TREATMENTS IN KONA
FOR IMMEDIATE RELEASE
NR25-08
April 15, 2025
HONOLULU – The Hawai‘i Department of Agriculture (HDOA), with the assistance of the County of Hawai‘i Public Works Department, have been working collaboratively since January 2025 to combat the coconut rhinoceros beetle (CRB) after detections in the Kona area. The HDOA and Hawai‘i County crews completed the latest round of treatments on palm trees last week at Ellison Onizuka Kona International Airport in the continuing effort to protect the island from CRB infestations.
“The staff of the Department of Agriculture remains dedicated to stopping the further spread of the coconut rhinoceros beetle, with emphasis in areas that are not known to be infested,” said Sharon Hurd, chairperson of the Hawai‘i Board of Agriculture. “We truly appreciate the concern and assistance of Mayor Kimo Alameda and the county’s public works crew in providing the resources to prevent CRB from taking hold on Hawai‘i Island. We also appreciate all the various agencies and organizations that work tirelessly in the fight against invasive species.”
Mayor Alameda emphasized the importance of the state and county working collaboratively to protect the island from the invasive species. “The introduction of the coconut rhinoceros beetle is a major concern, and we are committed to doing everything we can—alongside HDOA and our other partners—to stop its spread,” he said.
In September 2024, HDOA Plant Pest Control (PPC) personnel found a single CRB in a trap during routine monitoring in Waikoloa. This was the first detection of CRB on the island since October 2023 when a Waikoloa resident found six grubs (larvae) in a decaying palm tree stump. Increased surveillance continued throughout the island and more intensely on the Kona side.
In January 2025, Mayor Alameda and the County of Hawai‘i offered their resources and assistance to HDOA, including the use of their 75-foot boom truck to treat the crowns of palm trees. On January 14, the team treated a total of 38 trees in the Waikoloa area via crown treatments and 24 trees were treated via an injection system which provides systemic protection against CRB. HDOA’s Pesticides Branch was also at the site to assist. So far, there have been no further detections of CRB in Waikoloa.
On March 3, 2025, the Big Island Invasive Species Committee (BIISC) reported one adult CRB in a detection trap along the boundary of the Ellison Onizuka Kona International Airport. A day later, two more adult CRBs were found in traps at the Natural Energy Laboratory of Hawai‘i (NELHA).
After the detections, HDOA, county crews and airport staff targeted treatments at the airport over a period of three days in March. The county provided the use of two boom trucks and the team treated 128 trees on the airport grounds and injected 12 more trees that were inaccessible to the boom trucks. So far, there have been no further detections at the airport.
Last week, on April 7 and 8, crews began work at NELHA and treated 58 trees via crown treatments with about 14 trees treated via injections due to their close proximity to water.
All palms that were treated were tagged and surrounded with yellow tape to indicate treatment. Coconuts from treated trees should not be consumed. Questions regarding pesticide use may be addressed to HDOA’s Pesticides Branch at 808-973-9402.
Surveillance for CRB continues around Hawai‘i Island by HDOA, BIISC, University of Hawai‘i, the County of Hawai‘i and the state Department of Health Vector Control Branch.
Residents on all islands are asked to be vigilant when purchasing mulch, compost and soil products, and to inspect bags for evidence of entry holes.CRB grubs breed in decomposing plant and animal waste. An adult beetle is about 2-inches long, all black and has a single horn on its head.
Residents may go to the CRB Response website at: https://www.crbhawaii.org/ to learn more about how to detect the signs of CRB damage and how to identify CRB life stages. Reports of possible CRB infestation may also be made to the state’s toll-free Pest Hotline at 808-643-PEST (7378).
# # #
Attachments: Photos: Waikoloa treatment – boom truck Waikoloa injection Waikoloa treatment ground (treated trees marked with yellow tape and tagged) CRB crown treatment – Kona Airport (Ellison Onizuka Kona International Airport) CRB crown treatment Kona Airport2 (Ellison Onizuka Kona International Airport) CRB injection – Kona Airport (Ellison Onizuka Kona International Airport) Treated trees
Media Contact: Janelle Saneishi Public Information Officer Hawaiʻi Department of Agriculture Phone: 808-973-9560 Cell: 808-341-5528 Email:[email protected] Website:http://hdoa.hawaii.govAloha,
Janelle Saneishi
Public Information Officer
Hawai‘i Department of Agriculture ph: (808) 973-9560 email: [email protected]
Website: https://hdoa.hawaii.gov/
Confidentiality Notice: This e-mail message, including any attachments, is for the sole use of the intended recipient(s) and may contain confidential and/or privileged information. Any review, use, disclosure, or distribution by unintended recipients is prohibited. If you are not the intended recipient(s), please contact the sender by reply e-mail and destroy all copies of the original message.
What you need to know: California today filed a lawsuit challenging President Trump’s authority to unilaterally enact tariffs, which have created economic chaos, driven up prices, and harmed the state, families, and businesses.
SACRAMENTO – Governor Gavin Newsom and California Attorney General Rob Bonta today filed a lawsuit in federal court challenging President Trump’s use of emergency powers to enact broad-sweeping tariffs that hurt states, consumers, and businesses. The lawsuit argues that President Trump lacks the authority to unilaterally impose tariffs through the International Economic Emergency Powers Act, creating immediate and irreparable harm to California, the largest economy, manufacturing, and agriculture state in the nation.
These tariffs have disrupted supply chains, inflated costs for the state and Californians, and inflicted billions in damages on California’s economy, the fifth largest in the world.
“President Trump’s unlawful tariffs are wreaking chaos on California families, businesses, and our economy — driving up prices and threatening jobs. We’re standing up for American families who can’t afford to let the chaos continue.”
Governor Gavin Newsom
“The President’s chaotic and haphazard implementation of tariffs is not only deeply troubling, it’s illegal. As the fifth largest economy in the world, California understands global trade policy is not just a game. Californians are bracing for fallout from the impact of the President’s choices — from farmers in the Central Valley, to small businesses in Sacramento, and worried families at the kitchen table — this game the President is playing has very real consequences for Californians across our state. I am proud to go to bat alongside Governor Newsom to fight for California’s vibrant economy, businesses, and residents.”
Attorney General Rob Bonta
The lawsuit, filed in the United States District Court for the Northern District of California, requests the court to declare the tariffs imposed by President Trump void and enjoin their implementation.
The President lacks authority to enact unilateral tariffs
The lawsuit argues that President Trump lacks the authority to unilaterally impose tariffs against Mexico, China, and Canada or create an across-the-board 10% tariff. The President’s use of the International Economic Emergency Powers Act (IEEPA) to enact tariffs is unlawful and unprecedented.
The IEEPA gives the President authority to take certain actions if he declares a national emergency in response to a foreign national security, foreign policy, or economic threat. The law, which was enacted by Congress in 1977, specifies many different actions the President can take, but tariffs aren’t one of them. In fact, this is the first time a president has attempted to rely on this law to impose tariffs.
Supreme Court precedent
The lawsuit invokes the U.S. Supreme Court’s major questions doctrine, which holds that in novel matters of vast economic and political significance, federal agencies and the executive branch must have clear and specific authorization from Congress. In recent years, the Court has applied this standard to strike down major initiatives, including President Obama’s Clean Power Plan and President Biden’s student loan forgiveness program, ruling that novel executive actions with broad impacts on the national economy cannot rest on vague statutory authority.
It is difficult to imagine a more economically significant set of actions than the one Trump is taking on tariffs, which have inflicted hundreds of billions of dollars in economic losses on a whim, using a statute that doesn’t mention tariffs. The Court, applying this doctrine even-handedly, will find that such expansive action absent congressional approval is a clear violation of the law.
California is the backbone of the nation’s economy
California’s gross domestic product was $3.9 trillion in 2023, making it 50% bigger than the GDP of the nation’s next-largest state, Texas. The state drives national economic growth and also sends over $83 billion more to the federal government than it receives in federal funding. California is the leading agricultural producer in the country and is also the center for manufacturing output in the United States, with over 36,000 manufacturing firms employing over 1.1 million Californians. The Golden State’s manufacturing firms have created new industries and supplied the world with manufactured goods spanning aerospace, computers and electronics, and, most recently, zero-emission vehicles.
The Golden State is global leader in two-way trade
California engaged in nearly $675 billion in two-way trade in 2024, supporting millions of jobs throughout the state. California’s economy and workers rely heavily on this trade activity, particularly with Mexico, Canada, and China – our top 3 trade partners. Over 40% of California imports come from these countries, totaling $203 billion of the more than $491 billion in goods imported by California in 2024. These countries are also our top three export destinations, buying nearly $67 billion in California exports, which was over one-third of the state’s $183 billion in exported goods in 2024.
Tariffs irreparably harm California businesses and consumers
As the largest economy in the nation, the largest agriculture state in the nation, and the largest U.S. trading partner, the harm of the tariffs on the state of California is immense. President Trump’s policies have already inflicted hundreds of billions of dollars in economic losses.
Tariffs have an outsized impact on California businesses, including its more than 60,000 small business exporters.
Standing up for California families and businesses
Governor Newsom has responded quickly to help reduce negative impacts from the Trump tariffs on California’s economy and maintain California’s strong partnerships worldwide. Today’s lawsuit follows the Governor’s recent announcement of California’s goal to create new strategic trade relationships with international partners aimed at strengthening shared economic resilience and protecting California’s manufacturers, workers, farmers, businesses, and supply chains. The Governor has also announced a new international campaign to help maintain the strong tourism partnership between California and Canada.
More opposition to President Trump’s tariffs
U.S. Senator Ted Cruz (R-Texas): “Listen, I love President Trump, I’m his strongest supporter, and I think he’s doing incredible things as president. But here’s one thing to understand, a tariff is a tax.”
U.S. Senator Rand Paul (R-Kentucky): “Every dollar collected in tariff revenue comes straight out of the pockets of American consumers.”
U.S. Senator Lisa Murkowski (R-Alaska): “And if the global implications of these tariffs have shown us nothing else, it’s that measures that are as important as these should be considered by the 535 elected individuals that are in tune with the American people, rather than vesting that with just one individual acting unilaterally.”
Ben Shapiro, political commentator: “The idea that this is inherently good and makes the American economy strong is wrongheaded; it is untrue…”
U.S. Chamber of Commerce: “What we have heard from business of all sizes, across all industries, from around the country is that these broad tariffs are a tax increase that will raise prices for American consumers and hurt the economy.”
National Retail Federation: “American consumers could lose between $46 billion and $78 billion in spending power each year if new tariffs on imports to the United States are implemented.”
The Wall Street Journal Editorial Board: “The dumbest trade war in history.”
Recent news
Apr 15, 2025
News What you need to know: The passage of Proposition 1 by California voters adds rocket fuel to Governor Gavin Newsom’s transformational overhaul of the state’s behavioral health system. These reforms refocus existing funds to prioritize Californians with the most…
Apr 15, 2025
News What you need to know: The First Partner released the final report of a working group tasked with developing recommendations for policymakers, healthcare providers, law enforcement, and the judicial system in order to better support survivors of sexual assault….
Apr 15, 2025
News What you need to know: Preliminary data suggests property and violent crimes in California were down in 2024. Sacramento, California – As the state continues to invest in the safety and security of California communities, new data suggests violent and property…
Question for written answer E-001444/2025 to the Commission Rule 144 Kristian Vigenin (S&D)
The management of infectious diseases in livestock and breeding animals remains a major challenge for animal health, farmers’ well-being and sustainable agriculture. Current protocols often involve the culling of entire herds or flocks, even in situations where more targeted, science-based responses might be possible. This approach can be unnecessarily distressing for farmers, financially damaging, and ethically troubling – especially when less drastic alternatives may exist through advances in veterinary science.
The outbreaks of small ruminant plague (PPR) in Bulgaria in 2018 and 2024 further underscore the urgent need for more effective, nuanced, and evidence-based disease response strategies.
1.Is the Commission planning any new initiatives focused on improving the management of infectious diseases in livestock, particularly through financing research into alternative solutions such as vaccines, treatments and disease monitoring systems?
2.Is there any intention to review and potentially revise the existing EU protocols for handling diseased animals, in order to allow for more flexible and evidence-based approaches that could reduce the reliance on mass culling?
3.Why was the issue of infectious disease management not more prominently addressed in the recently published Vision for Agriculture and Food[1], and will the Commission consider integrating this dimension more explicitly in future strategic planning?
Question for written answer E-001457/2025 to the Commission Rule 144 Billy Kelleher (Renew), Barry Andrews (Renew), Cynthia Ní Mhurchú (Renew), Barry Cowen (Renew), Maria Walsh (PPE), Lynn Boylan (The Left), Aodhán Ó Ríordáin (S&D)
Three EU nationals – two Irish and one Polish – have been ordered to leave Germany over their participation in pro-Palestinian protests.
The authorities have claimed that the three individuals involved constitute a threat to public safety and should therefore leave Germany as soon as possible.
They have been told to leave Germany by 21 April 2025 or face deportation. All three participated in a pro-Palestinian protest at Berlin’s Free University in October 2024.
None of these three EU nationals has been convicted of any crime and any charges against them are demonstration-related and of ‘no serious character’.
Freedom of expression and freedom of assembly are both guaranteed in the Charter of Fundamental Rights of the European Union and in the European Convention on Human Rights.
Can the Commission therefore answer the following:
1.Does it believe that the actions of the Berlin authorities violate Articles 6 and 21 of the Charter of Fundamental Rights of the European Union and Article 45 of the TFEU?
2.What actions will the Commission undertake to ensure that all EU citizens have their rights protected?
Source: United States Senator for North Dakota John Hoeven
04.16.25
Senator, Secretary Will Meet with ND Ag Producers, Participate in Technology Demonstrations at Grand Farm
FARGO, N.D. – Senator John Hoeven today announced that he will host Agriculture Secretary Brooke Rollins in North Dakota on Tuesday, April 22. Hoeven, who serves as chairman of the Senate Agriculture Appropriations Committee and a senior member of the Senate Agriculture Committee, invited Rollins to the state during her confirmation process earlier this year so she could:
Get direct feedback from the state’s ag producers as work proceeds on the next farm bill.
Learn firsthand about North Dakota’s leadership in precision agriculture technologies.
To this end, Hoeven and Rollins will meet with local commodity groups and producers at North Dakota State University (NDSU) and participate in an agriculture technology demonstration at Grand Farm. Specific event details, including times and locations, will be released in the coming days.
“Our farmers, ranchers and agri-businesses have built North Dakota into a world leader in production agriculture,” said Senator Hoeven. “Their feedback will be invaluable to Secretary Rollins as she works with us to keep the farm in the farm bill. At the same time, this visit will enable her to see the exciting new developments in precision agriculture that are happening right here in the Red River Valley. This is a tremendous opportunity to showcase the partnerships we’ve worked to craft between Grand Farm, NDSU and others and secure key support for strengthening such initiatives.”
Source: US State of California Department of Justice
Tariffs threaten California’s economy, people, small businesses
STANISLAUS COUNTY — California Attorney General Rob Bonta and Governor Gavin Newsom today filed a lawsuit challenging President Trump’s unlawful use of power to impose tariffs and direct the Department of Homeland Security (DHS) and Customs and Border Patrol (CPB) to implement and enforce those tariffs without the consent of Congress. Since early February, the Trump Administration has issued over a dozen executive orders under the International Emergency Economic Powers Act of 1977 (IEEPA) to impose tariffs that have sent shockwaves through financial markets, businesses, and consumers in every corner of the globe. In the lawsuit today, Attorney General Bonta and Governor Newsom challenge the President’s use of the IEEPA to levy those tariffs, arguing that the IEEPA does not authorize the President to impose these tariffs. The emergency tariffs challenged under the lawsuit are projected to, at a minimum, shrink the U.S. economy by $100 billion annually, increase inflation by 1.3%, and cost the average American family $2,100. The economic impact of the President’s unlawful tariffs could have resounding impacts on California’s economy, budget, and consumers. California is a significant and frequent purchaser of goods impacted by the tariffs and the projected increase in cost to the state is significant.
“The President’s chaotic and haphazard implementation of tariffs is not only deeply troubling, it’s illegal. As the fifth largest economy in the world, California understands global trade policy is not just a game,” said Attorney General Rob Bonta. “Californians are bracing for fallout from the impact of the President’s choices — from farmers in the Central Valley, to small businesses in Sacramento, and worried families at the kitchen table — this game the President is playing has very real consequences for Californians across our state. I am proud to go to bat alongside Governor Newsom to fight for California’s vibrant economy, businesses, and residents.”
“President Trump’s unlawful tariffs are wreaking chaos on California families, businesses, and our economy — driving up prices and threatening jobs,” said Governor Gavin Newsom.“We’re standing up for American families who can’t afford to let the chaos continue.”
California is the nation’s largest importer and second-largest exporter. The President’s tariffs will impact California’s businesses, including its ports and small businesses that rely on trade. California’s agricultural sector, which exports goods around the world, will also face particularized challenges as other countries impose retaliatory tariffs and decrease trade in response to President Trump’s tariffs. Furthermore, the tariffs directly harm California’s ability to contract, purchase, and sell goods. These effects are already too real: vendors who contract with California have indicated that they will pass their increased costs from President Trump’s tariffs on to the state directly.
Claiming authority under the IEEPA, President Trump has issued multiple executive orders to impose, pause, re-start, and modify 25% tariffs on Mexico and Canada and a universal 10% tariff on every other U.S. trading partner. Separately and in addition, the President’s actions have goaded China into a full-blown trade war, with tariffs reaching 145% on Chinese goods, and China imposing reciprocal 125% tariffs on U.S. goods. Additionally, President Trump has imposed individualized reciprocal tariffs of up to 50% on nearly 90 specific countries; they are currently paused for 90 days before going into effect. Once the 90-day “pause” expires, the harms will only compound further. And new tariffs are being contemplated or announced nearly every day.
To justify his tariffs, the President has declared national emergencies and extended prior declared emergencies beyond the bounds of reason. But with or without emergencies, the President does not have the power to levy tariffs under the IEEPA.
The impacts of President Trump’s dizzying array of tariff plans have already wreaked havoc on our financial systems: the U.S. stock market suffered the largest two-day loss in its history in the two days following the announcement of President Trump’s most sweeping tariffs. These actions and the near-daily threats to impose new tariffs have already inflicted and continue to inflict serious financial harms on California.
The complaint filed today alleges that the Constitution expressly gives the authority to impose tariffs to Congress, not the President, and the IEEPA does not provide the required congressional authorization for President Trump to impose tariffs — Congress enacted the IEEPA to limit Presidential authority and to prevent Presidential abuse of power — not to give the President these powers. The complaint asks the court to declare that tariff orders made under the purported authority of the IEEPA are unlawful and void and to halt DHS and CPB from implementing and enforcing these orders.
Source: United States House of Representatives – Representative Eric Burlison (R-Missouri 7th District)
WASHINGTON—House Committee on Oversight and Government Reform Chairman James Comer (R-Ky.) and Subcommittee on Economic Growth, Energy Policy, and Regulatory Affairs Chairman Eric Burlison (R-Mo.) are examining the Biden Administration’s abuse of the Endangered Species Act (ESA) and its impact on energy costs. In a letter to the National Marine Fisheries Service (NOAA Fisheries) Acting Assistant Administrator Emily Menashes, the lawmakers request a briefing on the agency’s compliance with President Trump’s National Energy Emergency declaration as part of the Committee’s larger investigation into the Biden Administration’s detrimental energy policies.
“The Endangered Species Act (ESA) requires NOAA Fisheries to consult the Secretary of Commerce on whether a species should be listed as endangered or otherwise. Environmentalist groups abused the ESA and regulations promulgated under its authority by filing a litany of lawsuits to create regulatory delays on infrastructure projects they oppose and to influence NOAA Fisheries’ decisions,” wrote the lawmakers. “Under the Biden Administration, NOAA Fisheries tailored ESA policies to conform with these groups’ demands.”
The Biden Administration raised the bar for delisting a species from endangered status and sought to designate more habitats as critical habitats, even when endangered species living in those habitats are no longer found in those locations. By doing so, the Biden Administration prioritized the interests of environmental groups over the needs of local communities. The environmental groups exploited the ESA to stifle development and delay necessary energy infrastructure projects. In some cases, the actions of a few radical environmentalists have resulted in tens of millions of dollars in costs that must be borne by local communities. In other cases, environmental groups have used the ESA to delay oil leases in the Gulf of America, drastically curtail the amount of water available to farmers in Agriculture, and trample on the rights of ranchers across the west. To end this abuse, President Trump is prioritizing American energy independence and demanding reform of the ESA.
“President Trump’s National Energy Emergency declaration mandates the ESA Committee convene and identify ‘obstacles to domestic energy infrastructure specifically when deriving from implementation of the ESA’ or other relevant laws. ESA Committee members will propose regulatory reforms, consider species listings, and improve the interagency consultation process,” continued the lawmakers. “Importantly, this process is intended to give impacted states and local communities a voice in deciding whether a federal action is in the interest of the public and its national or regional significance. To help inform the Committee’s understanding of NOAA Fisheries role in addressing energy costs, we request a staff-level briefing regarding efforts to comply with President Trump’s declaration of a National Energy Emergency as soon as possible.”
Source: United States Senator for Illinois Dick Durbin
April 15, 2025
SPRINGFIELD – U.S. Senate Democratic Whip Dick Durbin (D-IL) today held a roundtable in Springfield with labor leaders, senior advocates, retirees, and small business owners to discuss the need to use tax dollars wisely to fulfill the promise of critical programs like Social Security, instead of cutting taxes for billionaires and raising prices forAmerican families and small businesses via tariffs.
More than two million Illinoisans depend on the Social Security Administration (SSA) to deliver essential benefits and services, yet customers experience long wait times over the phone and increased time to process disability benefits, while staffing levels at SSA offices continue to decrease. The Trump Administration’s threats to cut tax payer-funded SSA services would further prevent Illinoisans from receiving their benefits.
“Illinoisans are questioning whether or not they’ll continue to have access to their hard-earned benefits and essential services, while also being crushed by President Trump’s other economic policies, such as his outlandish tariffs,” said Durbin. “Today’s discussion with seniors, small business owners, and labor leaders in Springfield made it clear—these policies do nothing to ‘Make America Great Again,’ they are only making it harder for Illinoisans to get by.”
Durbin spoke on the Senate floor about the impact President Trump’s tariffs will have on small businesses, manufacturers, consumers, and workers in Illinois, which received $127 billion of imports from China, Canada, and Mexico in 2023. Durbin also joined fellow U.S. Senate Committee on Agriculture member U.S. Senator Amy Klobuchar (D-MN) and 17 of their colleagues in a letter to ask U.S. Trade Representative Ambassador Jamieson Greer for information on how the Trump Administration’s tariffs will impact farmers across the nation.
-30-
Source: United States Senator for Wyoming Cynthia Lummis
Washington, D.C. — U.S. Senator Cynthia Lummis (R-WY) and Senator Mark Kelly (D-AZ) introduced the Interactive Federal Review Act, bipartisan legislation to bring 21st-century technology to the outdated federal environmental review process and speed up the delivery of vital highway infrastructure.
“Hardworking American taxpayers send trillions to Washington, only for outdated permitting policies and decades-old technology to delay building the very infrastructure they rely on,” said Lummis. “I’m proud to work across the aisle to deliver cutting-edge solutions to modernize how we build roads and bridges in Wyoming — saving time, saving money, and ultimately delivering safer, more efficient transportation for people throughout the Cowboy State.”
The legislation would direct the Federal Highway Administration (FHWA) to select at least ten highway infrastructure projects to demonstrate the use of advanced interactive, digital, cloud-based platforms to conduct environmental analysis, and engage the public. These tools allow real-time, concurrent agency reviews, and transparent public participation — replacing the slow-moving exchange of static documents and PDFs.
Although the bill calls for 10 demonstration projects, its impact reaches far beyond that. The legislation also requires the Department of Transportation to issue guidance on best practices, laying the foundation for the broader adoption of modern technologies in federally funded infrastructure projects nationwide.
Full text of the bill can be found here.
After twelve weeks of tireless work under the Gold Dome, the 2025 Legislative Session has officially come to a close. My Senate Republican colleagues and I fought each day to protect your freedoms, defend your wallets, and invest in the values that make our state strong. We passed bold, conservative legislation that will support communities across the state, empower families, and ensure taxpayer dollars are spent effectively.
Our most significant achievement was the passage of House Bill 68, the balanced state budget for Fiscal Year 2025-2026. On Friday, the General Assembly fulfilled its constitutional duty by sending the state’s budget to Governor Kemp’s desk. Our budget priorities fund essential services across our state and reflects our commitment to conservative governance. We’re cutting taxes, funding school choice, and strengthening law and order in our state prisons. Our budget prioritized the gang prosecution task force, strengthens our anti-human trafficking prosecutors, and boosts school safety initiatives that will protect our children from those who wish to cause harm. This budget isn’t just numbers; it’s a roadmap of Republican priorities that put Georgians first.
This year, Senate Republicans advanced key legislation to benefit hardworking Georgians. HB 112 delivers tax rebates up to $500 for families and HB 111 will reduce our state income tax rate, empowering all Georgians to keep more of their hard-earned money. Before we gaveled out for the year, the Senate gave final passage to SB 1 to protect women’s sports and ensure female athletes are able to compete on a level playing field.
I was proud to author and carry Governor Kemp’s key priority, delivering meaningful tort reform to balance our civil justice system and stop frivolous lawsuits that burdened our small businesses, farmers, and job creators. We also prioritized assistance for those affected by Hurricane Helene, allocating millions in disaster aid and created catastrophe savings accounts to encourage responsible storm preparation and establishes tax incentives for Georgians to prepare for future natural disasters. These priorities send a clear message: Georgia takes care of its own, and Senate Republicans will ensure it stays that way.
School safety was one of our top priorities for the 2025 Legislative Session. House Bill 268 will require schools to implement panic alert systems and require campus mapping to assist first responders in the face of danger, and imposes serious consequences for threats against our students, teachers, and school personnel. HB 268 will also hold those who want to do students harm accountable when they commit acts of violence, because the safety of our schools will never be up for negotiation. At the same time, HB 268 supports mental health programs, suicide prevention and youth violence reduction to guarantee students in crisis get the help they need.
We also prioritized education, passing key pieces of legislation to improve our public schools. SR 237 will build a stronger workforce pipeline, establish mentorship programs, and improve training for our educators. HB 37 ensures our educators fully understand their retirement benefits, ensuring Georgia remains competitive when recruiting future educators. HB 150, the Combating Threats from China Act, increases transparency around foreign influence in our universities. Finally, HB 371 increases capital outlay funding cap for schools and upgrades Georgia’s playgrounds to meet modern accessibility standards. Because every child deserves a safe place to play and learn.
This session, we fought hard to protect your rights in the courtroom and restore integrity to our judicial system. SB 259, “Ridge’s Law,” ensures families can seek a second opinion when child abuse is alleged, a crucial safeguard against unjust state interference. I was especially proud to support HB 582, the Georgia Survivor Justice Act, which gives victims of domestic violence a voice in court when they act in self-defense. Justice must consider context, and survivors deserve our full support when they take a stand against abuse.
Senate Republicans stood firmly to support our veterans, law enforcement and emergency responders. HB 266 eliminates state taxes on military retirement income and incentivizes donations to law enforcement foundations. We also passed SR 8 and SR 231, renaming intersections in honor of fallen officers Deputy Brandon Cunningham and Officer Jeremy Labonte. Their sacrifice will never be forgotten.
During our final week under the Gold Dome, we proudly recognized Mercer University. It was an honor to welcome the future leaders from an incredible educational institution to the Senate Chamber as we concluded our legislative business.
On Sine Die, we also approved several key study committees, including the Senate Study Committee to Combat Chronic Absenteeism, an issue I’m deeply committed to addressing during the interim. Earlier this session, I was proud to author and carry Senate Bill 123, which will prevent students from being expelled for missing school and require schools to develop ways of intervening with chronically absent students. Although SB 123 will take the initial steps towards solving the problem of chronic absenteeism, this crisis persists with hundreds of thousands of Georgia children still missing significant parts of their education, putting their growth, learning, opportunities and future success at risk. With this study committee, we will have a vital opportunity to dig into the underlying issues and return to the Gold Dome next year with meaningful solutions that support our students.
Though the 2025 Session may be over, my service to Senate District 18 continues year-round. Whether it’s legislation, budget priorities, or individual constituent needs, I’m here to serve you — every day, in every season. Although we have finished the 2025 legislative session, my door is always open.
Let’s keep Georgia strong, safe and free.
# # # #
Sen. John F. Kennedy serves as the President Pro Tempore of the Georgia State Senate. He represents the 18th Senate District, which includes Crawford, Monroe, Peach and Upson counties, as well as portions of Bibb and Houston counties. He may be reached at (404) 656-6578 or by email at John.Kennedy@senate.ga.gov.
For all media inquiries, reach out to SenatePressInquiries@senate.ga.gov.
On Monday, 14 April at 21:16hrs police were called to Hillingdon Street, SE17 following reports of a stabbing.
Officers attended the scene alongside the London Ambulance Service who treated a 21-year-old man for stab injuries.
Sadly, despite their best efforts, he was pronounced dead on scene.
Detective Chief Inspector Kate Blackburn said: “I am leading the investigation into the fatal stabbing of a 21-year-old man that took place at 21:16hrs on Monday, 14 April.
“On Monday, we received multiple 999 calls, to Hillingdon Street, SE17 reporting that a young man had been stabbed and a number of people were seen carrying knives.
“On arrival, officers found a 21-year-old man who had sustained serious stab injuries .He was treated by the London Ambulance Service before he was sadly pronounced dead on scene.
“I can now name the victim as Giovanny Rendon Bedoya from Walworth. His next of kin has been informed and they are currently being supported by specialist officers. Our thoughts remain with them at this incredibly difficult time.
“Following the incident, we immediately made six arrests. Out of the six people arrested, three have been no further actioned and three have been bailed pending further enquiries.
“I would now like to appeal to the public for information. Please, if you saw, heard or have any footage following this incident then please come forward. Your information can significantly help our detectives with their investigation.
“We believe there were many people in the area who saw the group, who haven’t yet come forward to speak to police.
“Were you in the Hillingdon Street area on Monday evening? Did you see anyone acting suspiciously? Did you see anyone carrying a knife? If so please contact police.”
Detective Superintendent Emma Bond who is Acting BCU Commander for Lambeth and Southwark policing added: “I recognise that this incident has caused deep concern across our communities.
“I want to reassure you all today that we are working around the clock to find the perpetrators of this attack and to bring them to justice.
“You can expect to see an increased police presence in the coming days and we have more neighbourhood officers on patrol in the surrounding areas this week.
If anyone has any concerns then please do approach these officers, or their local neighbourhood teams, as we are here to help.
“I want to reiterate what DCI Blackburn has said, and urge anyone who has any information about this incident to contact us on via 101 stating CAD7392/14APR. Alternatively, to remain 100% anonymous you can call Crimestoppers on 0800 555 111.
“Thank you all for your support and our thoughts and prayers go out the family and friends of the victim involved.”
Africa is home to a rich variety of incredible indigenous crops and foods – from nutrient-dense grains and legumes to unique fruits and leafy greens. Despite their value, many of these foods are often overlooked, under-celebrated, and under-consumed in favour of imported or commercial alternatives.
Over the years, we’ve published several articles that shine a light on these traditional foods.
In this piece, we highlight some of those stories, celebrating the power and promise of Africa’s indigenous foods.
Special sorghum
Modern food systems often harm both health and the environment. These systems promote cheap, processed foods that contribute to poor nutrition and disease. At the heart of the food system’s problems is a lack of diversity. Power is consolidated in the hands of a few mega-corporations and the world relies on four main staple crops – wheat, rice, maize and soybean – to meet most food needs.
In South Africa, for instance, healthy diets remain unaffordable for many, and traditional crops like sorghum have declined.
For thousands of years, people from all over the world have eaten insects. Today about 2.5 billion people – many of whom live in Africa – eat insects. To date, 470 African edible insects have been scientifically recorded. Grasshoppers and termites are among some of the favourites.
Many of Africa’s local pulses – such as beans, lentils and cowpeas – are highly nutritious, affordable and climate-resilient foods. As researcher Nokuthula Vilakazi explained, they can play a vital role in addressing malnutrition and food insecurity in Africa.
Rich in protein, fibre, and essential vitamins and minerals, pulses are especially valuable for tackling both chronic hunger and hidden hunger caused by poor diets.
Once viewed as outdated or poor people’s food, traditional vegetables and local foods in Kenya are now experiencing a resurgence.
This is because traditional vegetables – like spider plant, leaf amaranth and cassava leaves – have proven to be more nutritious than commonly eaten exotics, like cabbage.
The leaves of cassava, a major vegetable in central African nations, are rich in proteins. A single serving, or 100 grams of the leaves, can provide up to three times the recommended daily intake of vitamin A in children and adults.
The fruit pulp of the baobab can supply as much as 10 times the amount of vitamin C as an orange, by weight.
Botanist Patrick Maundu explained how a nationwide effort has promoted the nutritional and cultural value of indigenous foods since the mid-1990s. This initiative improved seed availability, linked farmers to markets, and helped restore pride in local food culture.
– Africa’s superfood heroes – from teff to insects – deserve more attention – https://theconversation.com/africas-superfood-heroes-from-teff-to-insects-deserve-more-attention-254396
Source: The Conversation – Africa – By Vinothan Naidoo, Associate Professor of Public Policy and Administration, University of Cape Town
South Africa’s multi-party government of national unity (GNU), which emerged in the wake of the May 2024 elections, marked a turning point in the country’s political history. It took South Africans back to the 1990s, when the country showed that political opponents could find common cause.
The formation of the government of national unity expressed the hope that the country could do it again.
But just nine months into its term, the good will and pragmatism which marked its formation have worn thin. A major budget impasse between the two major actors, the African National Congress (ANC) and the Democratic Alliance (DA), threatens the coalition.
South Africans have long been accustomed to viewing the world of politics, governance and bureaucracy through the lens of a top-down “strong” state – a vicious apartheid state, an East Asia style developmental state, or a collusive “predatory state”.
But as recent analyses we co-authored with others have detailed, the vision of a top-down politically cohesive state no longer fits South Africa’s realities.
The government of national unity promised the hope that the country was embracing an approach that is key to success for almost all inclusive constitutional democracies. That is – abandon “all or nothing” confrontation, and instead pursue pragmatic bargains to achieve mutually agreeable policy outcomes.
At the most basic level, the government of national unity achieved this, at least for a while. The sharing of cabinet ministries between multiple parties created a diverse platform for executive power-sharing that was not dictated by a single dominant party, and which prevented the risks of parties building institutional fiefdoms.
In our view, failure to overcome deeply ingrained political differences could set off a downward spiral in the country.
Achievements on the governance front
On governance, the government of national unity created the space to pursue two sets of gains.
The first comprises the potential benefit of bringing together unlikely bedfellows.
The former opposition parties brought into a power-sharing arrangement were bound to be performance-driven, given the country’s long deteriorating government performance and ethical integrity. They had made “good governance” and criticism of the ANC central to their political brands.
New “outsider” eyes brought into formerly cloistered and factionalised ANC-run departments created the possibility of a new urgency to perform.
It’s too soon to tell whether this is happening, but anecdotal evidence suggests there are some green shoots.
The second governance gain comprises the crucial task of building a capable and professional state bureaucracy. The challenges include being able to pay the public sector wage bill, fostering a culture of delivery, and consolidating the bloated network of government departments.
Based on their party manifestos and public utterances, members of the government all aim to professionalise the public service.
Detailed technical work is already happening on issues such as training and competency assessment, transferring powers of appointment from politicians to senior public servants, and instituting checks in the recruitment and selection process. The National Assembly’s recent adoption of the Public Service Commission Bill forms part of this agenda.
The government of national unity has struggled to create effective mechanisms to translate agreement on a broad agenda of policy priorities into specific outcomes. This came at a higher cost than expected.
Still, it has made gains in challenging policy areas. These gains have repeatedly been undermined by the perverse determination of sections within both the ANC and the DA to engage in brinkmanship.
On health, both parties agree on the principle of universalising access. They differ on how to achieve this. But at least one seemingly intractable sticking point has been resolved. Both sides agree that private medical aid schemes need to be retained as part of a broader strategy of pursuing health system reform.
On basic education, the public spat over the Basic Education Laws Amendment Bill overshadows the potential to agree on balancing the autonomy of school governing bodies with the oversight role of provincial departments.
On land expropriation, the emotive rhetoric which followed the signing of the Expropriation Bill and the unwelcome and toxic intervention of international actors has overshadowed technical concerns which can be resolved.
On pro-growth policies: Operation Vulindlela, a joint Presidency and National Treasury initiative to unblock constraints in targeted economic sectors, has made significant strides. It has laid the groundwork for new rounds of growth-supporting infrastructural reforms and has the potential to build cohesion in the government of national unity. However, the DA’s attempt to lobby for a greater role in the strategic oversight of Operation Vulindlela in exchange for supporting the budget risks souring relations with the ANC.
What now?
A thriving inclusive society depends on powerful actors visibly committed to co-operation.
For all of the challenges confronting the government of national unity, it was built on a foundation of pragmatism. For the sake of South Africa’s future, it remains vital to build on this foundation. Obsolete top-down governing approaches must go. Pathways to performance must be lifted above political grandstanding. Constructive solutions should supersede ideological rigidity. South Africa has done it before. It can do it again.
– South Africa’s coalition government is at risk of crumbling: why collapse would carry a heavy cost – https://theconversation.com/south-africas-coalition-government-is-at-risk-of-crumbling-why-collapse-would-carry-a-heavy-cost-254302
Africa is home to a rich variety of incredible indigenous crops and foods – from nutrient-dense grains and legumes to unique fruits and leafy greens. Despite their value, many of these foods are often overlooked, under-celebrated, and under-consumed in favour of imported or commercial alternatives.
Over the years, we’ve published several articles that shine a light on these traditional foods.
In this piece, we highlight some of those stories, celebrating the power and promise of Africa’s indigenous foods.
Special sorghum
Modern food systems often harm both health and the environment. These systems promote cheap, processed foods that contribute to poor nutrition and disease. At the heart of the food system’s problems is a lack of diversity. Power is consolidated in the hands of a few mega-corporations and the world relies on four main staple crops – wheat, rice, maize and soybean – to meet most food needs.
In South Africa, for instance, healthy diets remain unaffordable for many, and traditional crops like sorghum have declined.
For thousands of years, people from all over the world have eaten insects. Today about 2.5 billion people – many of whom live in Africa – eat insects. To date, 470 African edible insects have been scientifically recorded. Grasshoppers and termites are among some of the favourites.
Many of Africa’s local pulses – such as beans, lentils and cowpeas – are highly nutritious, affordable and climate-resilient foods. As researcher Nokuthula Vilakazi explained, they can play a vital role in addressing malnutrition and food insecurity in Africa.
Rich in protein, fibre, and essential vitamins and minerals, pulses are especially valuable for tackling both chronic hunger and hidden hunger caused by poor diets.
Once viewed as outdated or poor people’s food, traditional vegetables and local foods in Kenya are now experiencing a resurgence.
This is because traditional vegetables – like spider plant, leaf amaranth and cassava leaves – have proven to be more nutritious than commonly eaten exotics, like cabbage.
The leaves of cassava, a major vegetable in central African nations, are rich in proteins. A single serving, or 100 grams of the leaves, can provide up to three times the recommended daily intake of vitamin A in children and adults.
The fruit pulp of the baobab can supply as much as 10 times the amount of vitamin C as an orange, by weight.
Botanist Patrick Maundu explained how a nationwide effort has promoted the nutritional and cultural value of indigenous foods since the mid-1990s. This initiative improved seed availability, linked farmers to markets, and helped restore pride in local food culture.
In a step to strengthen flood resilience in the region last week experts and stakeholders met to share skills.
More than 50 natural flood management (NFM) experts, land managers, and policymakers gathered in Kirkby Malham on Friday 11 April for the first Yorkshire NFM Community of Practice (CoP) Monitoring Skill Share – a practical and collaborative event designed to improve how we monitor NFM’s impact across the region.
Supported by Ousewem and the Environment Agency, the event brought together academics, consultants, and practitioners to share knowledge, test equipment, and explore how monitoring can drive better land management, funding decisions, and long-term resilience.
A shift from data collection to decision-making
From leaky dams in the Dales to river restoration in the Skell Valley, the morning presentations covered a wide range of real-world case studies – including Ousewem’s own approach, which blends landowner-led visual tools with technical data collection to feed into catchment-scale modelling.
Dr Steph Bond, Impact Translation Fellow at iCASP, said:
There’s often uncertainty around why data is being collected or what happens to it. This event helped shift the conversation from just collecting data to using it effectively.”
The afternoon offered hands-on demonstrations at a local site, where attendees used flow monitoring equipment and discussed practical challenges such as data storage, maintenance, and accessibility.
From learning to action
A pre-event survey revealed the wide variety of monitoring methods already in use – from drone footage to simple stage boards. Learning from the day will now feed into a shared resource for the Yorkshire NFM Community of Practice, including:
An inventory of equipment and local support contacts
Tips on setting up and maintaining kit
A draft letter to Defra on improving monitoring support in future funding rounds
Mark Henderson, Flood Risk Manager at City of York Council, said:
We see monitoring not as a tick-box exercise, but as a decision-making tool that shapes investment, policy, and long-term resilience.
“Sponsoring this event reflects Ousewem’s commitment to evidence-led NFM – and to working openly with others to improve outcomes across the region.”
Cllr Jenny Kent, Executive Member for Environment and Climate Emergency at City of York Council, added:
Nature-based solutions are central to York’s long-term climate resilience strategy.
“To unlock private and public investment in nature-based solutions, we need rigorous data and regional collaboration. Events like this skill share show the value of working collaboratively across sectors to build the evidence we need to invest with confidence. I’m proud that Ousewem, led by City of York Council, is helping to lead that charge.”
What’s next for Ousewem
The Skill Share is just one part of Ousewem’s broader investment in NFM evidence gathering. Upcoming initiatives include:
The next in Ousewem’s video series exploring how monitoring can strengthen decision-making – featuring footage from the Skill Share event.
Living Lab student research, such as Owain Wells’ study of how leaky dams influence upper catchment flows.
Soil aeration trials in Crimple Beck upstream of Burn Bridge, where we’re inviting local farmers to explore how improved soil structure can boost water storage and flood resilience.
Get involved
Would you like to join a future NFM Community of Practice meeting or take part in our next trial?
Contact iCASP@leeds.ac.uk with ‘NFM Community of Practice’ in the subject line or reach out to Ousewem for more on our soil aeration initiative.
For more information or to explore collaboration opportunities, please contact the Ousewem team at ousewem@york.gov.uk.
FRESNO, Calif., April 16, 2025 (GLOBE NEWSWIRE) — FFB Bancorp (the “Company”) (OTCQX: FFBB), the parent company of FFB Bank (the “Bank”), today reported net income of $8.10 million, or $2.55 per diluted share, for the first quarter of 2025, an increase of 4% from the $7.79 million, or $2.46 per diluted share, reported for the first quarter of 2024. The Bank reported $9.72 million, or $3.05 per diluted share, for the fourth quarter of 2024. All results are unaudited.
First Quarter 2025 Highlights: As of, or for the quarter ended March 31, 2025, compared to the quarter ended March 31, 2024:
Pre-tax, pre-provision income increased 10% to $12.01 million.
Net income increased 4% to $8.10 million.
Return on average equity (“ROAE”) was 18.83%.
Return on average assets (“ROAA”) was 2.14%.
Net interest margin expanded 20 basis points to 5.35% from 5.15%.
Operating revenue (net interest income, before the provision for credit losses, plus non-interest income) increased 21% to $28.48 million.
Total assets increased 12% to $1.56 billion.
Total portfolio of loans increased 18% to $1.09 billion.
Total deposits increased 10% to $1.32 billion.
Shareholder equity increased 26% to $174.71 million.
Book value per common share increased 27% to $55.52.
The Company’s tangible common equity ratio was 11.20%, while the Bank’s regulatory leverage capital ratio was 14.66%, and the total risk-based capital ratio was 21.09% at March 31, 2025.
“In spite of the general market headwinds, and the constant noise surrounding potential policy changes, our first quarter 2025 results still came in quite strong because the team was able to stay focused on the basics,” said Steve Miller, President & CEO. “The loan portfolio increased $21 million, deposits grew $36 million, and total assets grew $56 million. In addition, we were able to record strong earnings while improving our book value per common share through our strategic share repurchase program.”
“During the quarter we have made consistent progress on the matters outlined in our consent order, although ultimate compliance will be determined by our regulators. The team has been diligent in working with our regulators to complete the necessary steps to meet consent order timelines. We have confidence we can continue to address these items going forward.”
Linda Emtman and Miles Mahoney Join Board of Directors of FFB Bancorp and FFB Bank:
Linda Emtman and Miles Mahoney have been appointed to the Board of Directors for the Company and Bank, expanding the number of directors for both boards to 11 from 9.
Ms. Emtman was a Principal in Financial Services at Ernst & Young in San Francisco until her retirement. She is on the executive leadership team of the American Heart Association, and an Ambassador at the Bay Area Cor Vitae Society. Ms. Emtman is a graduate of the University of Washington where she earned her bachelor’s degree in Business Administration and completed her Master Deal Maker certification at the Wharton School.
Mr. Mahoney is the President of U2 Science Labs, Inc, an advanced analytics and data science platform, in Orange County and the Founder and Managing Partner of Irish Acquisitions, Inc. He has served as a board member of a number of different organizations over a 15-year period. Mr. Mahoney is a graduate of Montana State University where he earned his bachelor’s degree in Business Administration & Finance and completed his MBA at the Pepperdine Graziadio School of Business.
“We are delighted to welcome Linda and Miles to our Company’s Board of Directors and look forward to working with them as we pursue our mission to grow our franchise. They bring a wealth of experience and a broad depth of knowledge that will help propel us forward for future success,” said Mark Saleh, Chairman of the Boards. “Recently, one of our founding board members, Al Smith, passed away. He was instrumental in the early development of our brand. His commitment to the bank and creative ideas will be missed.”
Update on Stock Repurchase Program:
On January 22, 2025, the Company announced that it had authorized a plan to utilize up to $15.0 million of capital to repurchase shares of the Company’s common stock. As of March 31, 2025, the Company has repurchased 41,915 shares, at an average price of $81.60, totaling $3.42 million. This represents approximately 1.78% of total shareholders’ equity at March 31, 2025.
Under the terms of the repurchase plan, the Company may repurchase shares of the Company’s common stock from time to time, through December 31, 2025, in open market purchases or privately negotiated transactions. Repurchases under the plan may also be made pursuant to a trading plan under Securities and Exchange Commission Rule 10b5-1 under the Securities Exchange Act of 1934, which would permit shares to be repurchased by the Company when the Company might otherwise be precluded from doing so because of self-imposed trading blackout periods or other regulatory restrictions. The timing, manner, price and exact amount of any repurchases by the Company will be determined at the Company’s discretion and depend on various factors including the performance of the Company’s stock price, general market and economic conditions, applicable legal and regulatory requirements, availability of funds, and other relevant factors. Through December 31, 2025, the repurchase plan may be discontinued, suspended or restarted at any time.
Results of Operations
Quarter endedMarch 31, 2025:
Operating revenue, consisting of net interest income before the provision for credit losses and non-interest income, increased 21% to $28.48 million for the first quarter of 2025, compared to $23.61 million for the first quarter a year ago, and increased 1% from $28.25 million from the fourth quarter of 2024.
Net interest income, before the provision for credit losses, increased 17% to $18.90 million for the first quarter of 2025, compared to $16.14 million for the same quarter a year ago, and remained consistent with the $18.81 million reported last quarter. “The increase in net interest income compared to prior year was primarily driven by loan portfolio growth,” said Bhavneet Gill, Chief Financial Officer. “We have also seen some relief in funding costs as a result of the FOMC rate cuts from the second half of 2024.”
The Company’s net interest margin (“NIM”) increased by 20 basis points to 5.35% for the first quarter of 2025, compared to 5.15% for the first quarter of 2024, and increased 11 basis points from 5.24% for the preceding quarter. “Our yield on earning assets increased 8 basis points in the first quarter primarily from changes within the loan portfolio. Additionally, the expansion of NIM was buoyed by a 4 basis point decrease in the cost to fund earning assets as average non-interest bearing deposits increased $11.68 million quarter-over-quarter,” noted Gill.
The yield on earning assets was 6.31% for the first quarter of 2025, compared to 6.15% for the first quarter a year ago, and 6.24% for the previous quarter. The cost to fund earning assets decreased to 0.96% for the first quarter of 2025 compared to 1.00% for the previous quarter, and 1.00% for the same quarter a year earlier.
Total non-interest income was $9.58 million for the first quarter of 2025, compared to $7.47 million for the first quarter of 2024, and $9.44 million for the previous quarter. The increase in non-interest income, from the first quarter of 2024, was driven by higher merchant services revenue and a reduction in loss on sale of investments, partially offset by lower gain on sale of loans revenue. The quarter-over-quarter increase in non-interest income was attributed to higher merchant services revenue due to seasonal activity, partially offset by a reduction in the gain on sale of loans revenue.
Merchant services revenue increased 30% to $7.86 million for the first quarter of 2025, compared to $6.07 million from the first quarter of 2024. The increase was primarily due to higher volume across all merchant business lines and higher gross revenue related to FFB Payments. Merchant services revenue increased from $7.56 million when compared to the fourth quarter of 2024 as a result of an increase in processing volume during the quarter, primarily due to seasonal activity. First quarter 2025 ISO Partner Sponsorship volumes include $2.78 billion in volume for the ISO partners being exited in the second quarter of 2025. First quarter 2025 ISO Partner Sponsorship revenue includes $990,000 in revenue from the ISO partners being exited in the second quarter of 2025. “These ISO exits were the right decision to help ensure we are aligned with our partners in regard to best in class oversight. We anticipate replacing this volume and revenue through growth in FFB Payments and with our remaining ISO partners as we move forward,” said Miller.
Merchant ISO Processing Volumes(in thousands)
Source
Q1 2025
Q4 2024
Q3 2024
Q2 2024
Q1 2024
ISO Partner Sponsorship
$
5,007,998
$
4,891,643
$
4,556,868
$
4,391,365
$
3,763,289
FFB Payments- Sub-ISO Merchants
21,551
22,950
24,661
24,414
19,370
FFB Payments – Direct Merchants
97,095
91,133
64,512
76,059
77,349
Total volume
$
5,126,644
$
5,005,726
$
4,646,041
$
4,491,838
$
3,860,008
Merchant ISO Processing Revenues(in thousands)
Source of Revenue
Q1 2025
Q4 2024
Q3 2024
Q2 2024
Q1 2024
Net Revenue*:
ISO Partner Sponsorship
$
2,410
$
2,535
$
2,284
$
2,156
$
2,183
Gross Revenue:
FFB Payments- Sub-ISO Merchants
745
764
810
795
672
FFB Payments – Direct Merchants
4,709
4,262
2,476
3,117
3,213
5,454
5,026
3,286
3,912
3,885
Gross Expense:
FFB Payments- Sub-ISO Merchants
616
638
723
675
518
FFB Payments – Direct Merchants
2,558
2,511
1,766
1,989
1,842
3,174
3,149
2,489
2,664
2,360
Net Revenue:
FFB Payments- Sub-ISO Merchants
129
126
87
120
154
FFB Payments – Direct Merchants
2,151
1,751
710
1,128
1,371
FFB Payments Net Revenue
2,280
1,877
797
1,248
1,525
Net Merchant Services Income:
$
4,690
$
4,412
$
3,081
$
3,404
$
3,708
*ISO Partnership Sponsorship is recognized net of expense in Merchant Services Income. FFB Payments revenues are recognized gross in Merchant Services Income and Merchant Services expenses are recognized in Non-Interest Expense.
Total deposit fee income increased 7% to $849,000 for the first quarter of 2025, compared to $796,000 for the first quarter of 2024, and decreased 1% from $856,000 for the previous quarter.
There was a $261,000 gain on sale of loans during the first quarter of 2025, compared to a gain on sale of loans of $451,000 during the first quarter 2024, and a gain on sale of loans of $929,000 in the previous quarter. There was no loss on sale of investments during the first quarter of 2025, compared to a $373,000 loss during the first quarter of 2024, and a $482,000 loss in the previous quarter.
Non-interest expense increased 30% to $16.47 million for the first quarter of 2025, compared to $12.70 million for the first quarter 2024, and increased 24% from $13.27 million from the previous quarter. The increases on a year-over-year and quarterly comparison were driven by increases in salaries and employee benefits expense.
Salaries and employee benefits increased 22% to $8.06 million for the first quarter of 2025, compared to $6.58 million for the first quarter 2024. Total salaries and employee benefits increased 56% from $5.18 million in the previous quarter. The quarterly increase in salaries and employee benefits expense is partially attributed to $1.96 million in non-recurring reductions to performance bonus and ESOP accruals recognized in the fourth quarter of 2024. The balance of the increase was primarily the result of expense associated with full-time employees hired in the fourth quarter of 2024 and the first quarter of 2025. Full-time employees increased to 175 at March 31, 2025, compared to 147 full-time employees a year earlier, and 168 full-time employees from the previous quarter.
“Over the last few quarters, we’ve made intentional investments in people and technology to ensure that the bank can efficiently scale moving forward, and specifically to support our payment ecosystem, product development, regional expansion, and compliance/risk management initiatives. We continue to see elevated legal, audit, and technology related expenses mostly related to addressing the Consent Order,” said Miller.
Occupancy and equipment expenses decreased 8% from a year ago, representing 2% of non-interest expense, and decreased 14% from the preceding quarter. Merchant operating expense totaled $3.17 million for the first quarter of 2025, compared to $2.36 million for the first quarter of 2024 and $3.15 million for the preceding quarter. The change in merchant operating expense is attributed to fluctuations in volume and revenue for the FFB Payments lines of business. Merchant operating expenses include interchange fees, chargebacks, partnership fees, and other card brand fees.
Other operating expense increased 45% or $1.51 million to $4.88 million from a year earlier and increased 8% or $351,000 from the previous quarter. The year-over-year increase was driven by increases of $252,000 in data and software related expense, $355,000 in professional fees, $262,000 in marketing expense, $111,000 in regulatory assessment expense, and $321,000 in operational losses. The increase in data and software expense and professional fees, which include legal, audit, and consulting fees, are primarily due to actions taken to enhance the Company’s AML/CFT, compliance, and merchant services programs.
The efficiency ratio was 57.83% for the first quarter of 2025, compared to 52.96% for the same quarter a year ago, and 46.19% for the preceding quarter. The efficiency ratio can fluctuate period over period based on changes in merchant services’ gross revenues and associated expenses. The Company also calculates an adjusted efficiency ratio where the merchant services’ gross expense, which is included in non-interest expense, is netted against merchant services’ revenue in non-interest income. The adjusted efficiency ratio was 52.54% for the first quarter of 2025, compared to 47.82% for the same quarter a year ago, and 39.57% for the previous quarter.
Balance Sheet Review
Total assets increased 12% to $1.56 billion at March 31, 2025, compared to $1.40 billion at March 31, 2024, and increased 4% compared to December 31, 2024.
The total portfolio of loans increased 18%, or $165.66 million, to $1.09 billion, compared to $926.78 million at March 31, 2024, and increased $21.36 million, from $1.07 billion at December 31, 2024.
Commercial real estate loans increased 28% year-over-year to $696.63 million, representing 64% of total loans at March 31, 2025. The CRE portfolio includes approximately $282.54 million in multi-family loans originated by the Southern California team that the Company may consider selling at some point in the future for liquidity and concentration management. The multi-family portfolio includes $84.52 million in short-term bridge loans for transitional projects of multi-family properties. The short-term bridge loans are conservatively underwritten with minimum DSCR and liquidity requirements. The bank continues to market our bridge loan product in a more measured approach, keeping to our conservative underwriting standards. The real estate construction and land development loan portfolio decreased 84% from a year ago to $12.65 million, representing 1% of total loans, while residential RE 1-4 family loans totaled $17.15 million, or 2% of loans, at March 31, 2025.
The commercial and industrial (C&I) portfolio increased 16% to $260.06 million, at March 31, 2025, compared to $224.55 million a year earlier, and decreased 3% from $267.95 million at December 31, 2024. C&I loans represented 24% of total loans at March 31, 2025. Agriculture loans represented 10% of the loan portfolio at March 31, 2025. At March 31, 2025, the SBA, USDA, and other government agencies guaranteed loans totaled $61.37 million, or 5.6% of the loan portfolio.
Investment securities totaled $313.83 million at March 31, 2025, compared to $328.91 million a year earlier, and decreased $8.36 million from $322.19 million at December 31, 2024. The investment portfolio consists of mortgage-backed and municipal securities, both tax exempt and taxable, treasury securities as well as other domestic debt. At March 31, 2025, the Company had a net unrealized loss position on its investment securities portfolio of $24.50 million, compared to a net unrealized loss of $25.89 million at December 31, 2024. The Company’s investment securities portfolio had an effective duration of 5.61 years at March 31, 2025, compared to 5.32 years at December 31, 2024.
Total deposits increased 10%, or $119.85 million, to $1.32 billion at March 31, 2025, compared to $1.20 billion from a year earlier, and increased $36.00 million from $1.28 billion at December 31, 2024. The quarter-over-quarter increase in deposit balances is primarily attributed to an increase in interest bearing checking accounts. Non-interest bearing demand deposits increased 10% to $825.40 million at March 31, 2025, compared to $751.64 million at March 31, 2024, and decreased $3.10 million from $828.51 million at December 31, 2024. Non-interest bearing demand deposits represented 63% of total deposits at March 31, 2025.
Included in non-interest bearing deposits are $89.98 million from ISO partners for merchant reserves, $135.48 million from ISO partners for settlement, and $9.63 million in ISO partner operating accounts. These deposits represent 28.5% of non-interest bearing deposits and 17.8% of total deposits. Included in the $235.09 million in ISO partner deposits as of March 31, 2025 are $137.82 million in deposits for ISO partners being exited in the second quarter of 2025. The Bank plans to replace these non-interest bearing deposits with growth from new Bank customers in its markets and from the existing ISO partners it will continue to support. In the short-term, the new deposit growth will likely be made up of a higher percentage of interest bearing deposits.
There was $10.00 million in short-term borrowings at March 31, 2025, compared to no borrowings at December 31, 2024, or March 31, 2024. The Company primarily utilizes FHLB advances and the Federal Reserve discount window for short-term borrowings. The following table summarizes the Company’s primary and secondary sources of liquidity which were available at March 31, 2025:
Liquidity Source(in thousands)
March 31, 2025
December 31, 2024
Cash and cash equivalents
$
103,071
$
63,415
Unpledged investment securities, fair value
104,732
118,957
FHLB advance capacity
338,036
304,077
Federal Reserve discount window capacity
130,590
166,475
Correspondent bank unsecured lines of credit
70,000
91,500
$
746,429
$
744,424
The total primary and secondary liquidity of $746.43 million at March 31, 2025 represents an increase of $2.0 million in primary and secondary liquidity quarter-over-quarter. On-balance sheet cash and cash equivalents increased as a result of deposit growth in the quarter.
Shareholders’ equity increased 26% to $174.71 million at March 31, 2025, compared to $138.72 million from a year ago, and grew 4% from $168.39 million at December 31, 2024. Book value per common share increased 27% to $55.52, at March 31, 2025, compared to $43.69 at March 31, 2024, and increased 5% from $53.02 at December 31, 2024. The tangible common equity ratio was 11.20% at March 31, 2025, compared to 9.94% a year earlier, and 11.20% at December 31, 2024. Additionally, book value improved as a result of quarterly net income and a reduction in shares outstanding.
At the Bank level, unrealized losses and gains reflected in AOCI are not included in regulatory capital. As a result, Tier-1 capital at the Bank for regulatory purposes was $226.64 million at quarter end excluding the unrealized loss. The regulatory leverage capital ratio was 14.66% for the current quarter, while the total risk-based capital ratio was 21.09%, exceeding regulatory minimums to be considered well-capitalized.
Asset Quality
Nonperforming assets increased to $15.37 million, or 0.98% of total assets, at March 31, 2025, compared to $9.89 million, or 0.66% of total assets, from the preceding quarter. Of the $15.37 million nonperforming loans, $11.37 million are covered by SBA guarantees. Total delinquent loans increased to $19.12 million at March 31, 2025, compared to $8.32 million at December 31, 2024.
Past due loans 30-60 days were $17.53 million at March 31, 2025, compared to $4.89 million at December 31, 2024, and $3.22 million at March 31, 2024. This increase in 30-60 days past due loans is the result of three multi-family loans, which are real estate secured, totaling $11.55 million to a related group of borrowers. There were $1.54 million past due loans from 60-90 days at March 31, 2025, compared to $2.45 million at December 31, 2024 and $1.95 million in past due loans from 60-90 days a year earlier. Past due loans 90+ days at quarter end totaled $46,000 at March 31, 2025, compared to $1.33 million, at March 31, 2024. Of the $19.12 million in past due loans at March 31, 2025, $2.75 million were purchased government guaranteed loans, which are guaranteed by the SBA for the full payment of the principal plus interest.
Delinquent Loan Summary
Organic
Purchased Govt. Guaranteed
Total
(in thousands)
Delinquent accruing loans 30-59 days
$
16,147
$
1,386
$
17,533
Delinquent accruing loans 60-89 days
218
1,319
1,537
Delinquent accruing loans 90+ days
—
46
46
Total delinquent accruing loans
$
16,365
$
2,751
$
19,116
Non-Accrual Loan Summary
Organic
Purchased Govt. Guaranteed
Total
(in thousands)
Loans on non-accrual
$
15,366
$
—
$
15,366
Non-accrual loans with SBA guarantees
11,371
—
11,371
Net Bank exposure to non-accrual loans
$
3,995
$
—
$
3,995
There was a $1.16 million provision for credit losses in the first quarter of 2025, compared to $378,000 provision for credit losses in the first quarter a year ago, and a $1.67 million provision for credit losses booked in the fourth quarter of 2024. The provision recorded during the first quarter of 2025 is the result of loan portfolio growth and a $5.47 million increase in non-accrual loans which were individually evaluated in the allowance for credit losses. The increase in non-accrual loans was primarily related to SBA loans.
“We watch the SBA portfolio very closely since rates have increased so rapidly over the last two years, putting pressure on borrowers. A majority of the loans within the portfolio are floating rate loans tied to WSJ Prime and reset quarterly. Borrowers saw a 50bps reduction in their rates on January 1, 2025 and additional rate relief is expected during the second half of 2025,” added Miller. “The ratio of allowance for credit losses to the total, non-guaranteed, loan portfolio was 1.25%, as of March 31, 2025, and our total non-guaranteed exposure on these SBA loans is $42.80 million spread over 222 loans.”
“We incurred net charge offs of $167,000 during the current quarter, compared to $4,000 in net recoveries in the first quarter a year ago, and $1.29 million in net charge offs in the previous quarter,” said Miller. “Our loan portfolio increased 18% from a year ago with commercial real estate (“CRE”) loans representing 64% of the total loan portfolio. Within the CRE portfolio, there are $52.45 million in loans for CRE office as shown in the table below. Since the majority of our CRE office exposure is concentrated in the Central Valley, we are experiencing less volatility than city center CRE markets. Our credit metrics remain strong as we continue to maintain conservative underwriting standards.”
(in thousands)
CRE Office Exposure of March 31, 2025
Region
Owner-Occupied
Non-Owner Occupied
Total
Central Valley
$
27,314
$
13,544
$
40,858
Southern California
2,271
352
2,623
Other California
4,492
3,948
8,440
Total California
34,077
17,844
51,921
Out of California
—
527
527
Total CRE Office
$
34,077
$
18,371
$
52,448
The ratio of allowance for credit losses to total loans was 1.18% at March 31, 2025, compared to 1.12% a year earlier and 1.10% at December 31, 2024. The Company individually evaluates non-accrual loans in the allowance for credit losses which has resulted in carrying a higher level of reserve.
About FFB Bancorp
FFB Bancorp, formerly Communities First Financial Corporation, a bank holding company established in 2014, is the parent company of FFB Bank, founded in 2005 in Fresno, California. As a leading SBA Lender in California’s Central Valley and one of the few direct acquiring banks in the United States, FFB Bank offers clients a range of personal and business checking accounts, payment processes, and loan programs. Among the Bank’s awards and accomplishments, it was ranked #1 on American Banker’s list of the Top 20 Publicly Traded Banks under $2 Billion in Assets for 2024. For 2025, the Bank was also ranked by S&P Global as the #34 best performing community bank under $3 billion in assets. The Company has also received recognition as part of the OTCQX Best 50 Companies for 2019, 2023, and 2024. For additional information, you can visit the Company’s website at www.ffb.bank or by contacting a representative at 559-439-0200.
Forward Looking Statements
This earnings release may contain forward-looking statements. Forward-looking statements provide current expectations or forecasts of future events and are not guarantees of future performance, nor should they be relied upon as representing management’s views as of any subsequent date. The forward-looking statements are based on managements’ expectations and are subject to a number of risks and uncertainties. Although management believes that the expectations reflected in such forward-looking statements are reasonable, actual results may differ materially from those expressed or implied in such statements. Risks and uncertainties that could cause actual results to differ materially include, without limitation, the Company’s ability to effectively execute its business plans; the impact of the Consent Order on our financial condition and results of operations; changes in general economic and financial market conditions; changes in interest rates; and, in particular, actions taken by the Federal Reserve to try and control inflation; changes in the competitive environment; continuing consolidation in the financial services industry; new litigation or changes in existing litigation; losses, customer bankruptcy, claims and assessments; changes in banking regulations or other regulatory or legislative requirements affecting the Company’s business; international developments; and changes in accounting policies or procedures as may be required by the Financial Accounting Standards Board or other regulatory agencies. The Company undertakes no obligation to release publicly the results of any revisions to the forward-looking statements included herein to reflect events or circumstances after today, or to reflect the occurrence of unanticipated events. The Company claims the protection of the safe harbor for forward-looking statements contained in the Private Securities Litigation Reform Act of 1995.
Member FDIC
Select Financial Information and Ratios
For the Quarter Ended:
March 31, 2025
December 31, 2024
March 31, 2024
BALANCE SHEET- ENDING BALANCES:
Total assets
$
1,560,376
$
1,504,128
$
1,395,095
Total portfolio loans
1,092,441
1,071,079
926,781
Investment securities
313,826
322,186
328,906
Total deposits
1,320,381
1,284,377
1,200,529
Shareholders equity, net
174,711
168,392
138,716
INCOME STATEMENT DATA
Operating revenue
28,476
28,247
23,610
Operating expense
16,467
13,270
12,701
Pre-tax, pre-provision income
12,009
14,977
10,909
Net income after tax
8,098
9,718
7,790
SHARE DATA
Basic earnings per share
$
2.56
$
3.06
$
2.46
Fully diluted EPS
$
2.55
$
3.05
$
2.46
Book value per common share
$
55.52
$
53.02
$
43.69
Common shares outstanding
3,146,727
3,175,817
3,175,048
Fully diluted shares
3,175,178
3,189,949
3,170,981
FFBB – Stock price
$
76.50
$
97.97
$
82.99
RATIOS
Return on average assets
2.14
%
2.53
%
2.32
%
Return on average equity
18.83
%
23.11
%
23.27
%
Efficiency ratio
57.83
%
46.19
%
52.96
%
Adjusted efficiency ratio
52.54
%
39.57
%
47.82
%
Yield on earning assets
6.31
%
6.24
%
6.15
%
Yield on investment securities
4.36
%
4.34
%
4.47
%
Yield on portfolio loans
6.81
%
6.95
%
6.68
%
Cost to fund earning assets
0.96
%
1.00
%
1.00
%
Cost of interest-bearing deposits
2.60
%
2.69
%
2.57
%
Net Interest Margin
5.35
%
5.24
%
5.15
%
Equity to assets
11.20
%
11.20
%
9.94
%
Net loan to deposit ratio
82.74
%
83.39
%
77.20
%
Full time equivalent employees
175
168
147
BALANCE SHEET- AVERAGES
Total assets
1,531,573
1,529,439
1,347,625
Total portfolio loans
1,076,848
1,038,215
925,561
Investment securities
325,699
333,135
315,820
Total deposits
1,300,550
1,299,069
1,149,117
Shareholders equity, net
174,410
167,268
134,621
Consolidated Balance Sheet (unaudited)
March 31, 2025
December 31, 2024
March 31, 2024
(in thousands)
ASSETS
Cash and due from banks
$
83,033
$
43,905
$
37,360
Interest bearing deposits in banks
20,038
19,510
53,556
CDs in other banks
1,724
1,723
1,693
Investment securities
313,826
322,186
328,906
Loans held for sale
—
—
—
Construction & land development
12,649
26,522
77,318
Residential RE 1-4 family
17,146
16,846
16,114
Commercial real estate
696,625
669,285
545,358
Agriculture
104,616
90,017
63,281
Commercial and industrial
260,063
267,948
224,551
Consumer and other
1,342
461
159
Portfolio loans
1,092,441
1,071,079
926,781
Deferred fees & discounts
(3,946
)
(4,200
)
(4,181
)
Allowance for credit losses
(12,913
)
(11,834
)
(10,407
)
Loans, net
1,075,582
1,055,045
912,193
Non-marketable equity investments
8,890
8,891
7,357
Cash value of life insurance
12,496
12,402
12,119
Accrued interest and other assets
44,787
40,466
41,911
Total assets
$
1,560,376
$
1,504,128
$
1,395,095
LIABILITIES AND EQUITY
Non-interest bearing deposits
$
825,404
$
828,508
$
751,636
Interest checking
109,555
62,034
54,659
Savings
54,686
55,219
52,090
Money market
218,940
212,322
220,559
Certificates of deposits
111,796
126,294
121,585
Total deposits
1,320,381
1,284,377
1,200,529
Short-term borrowings
10,000
—
—
Long-term debt
38,046
38,007
39,638
Other liabilities
17,238
13,352
16,212
Total liabilities
1,385,665
1,335,736
1,256,379
Common stock
35,693
38,436
36,910
Retained earnings
156,235
148,138
121,780
Accumulated other comprehensive loss
(17,217
)
(18,182
)
(19,974
)
Shareholders’ equity
174,711
168,392
138,716
Total liabilities and shareholders’ equity
$
1,560,376
$
1,504,128
$
1,395,095
Consolidated Income Statement (unaudited)
Quarter ended:
(in thousands)
March 31, 2025
December 31, 2024
March 31, 2024
INTEREST INCOME:
Loan interest income
$
18,069
$
18,131
$
15,372
Investment income
3,499
3,631
3,512
Int. on fed funds & CDs in other banks
574
504
255
Dividends from non-marketable equity
132
137
129
Total interest income
22,274
22,403
19,268
INTEREST EXPENSE:
Int. on deposits
2,891
3,115
2,518
Int. on short-term borrowings
31
12
149
Int. on long-term debt
451
464
464
Total interest expense
3,373
3,591
3,131
Net interest income
18,901
18,812
16,137
PROVISION FOR CREDIT LOSSES
1,164
1,671
378
Net interest income after provision
17,737
17,141
15,759
NON-INTEREST INCOME:
Total deposit fee income
849
856
796
Debit / credit card interchange income
191
196
167
Merchant services income
7,864
7,562
6,068
Gain on sale of loans
261
929
451
Loss (gain) on sale of investments
—
(482
)
(373
)
Other operating income
410
374
364
Total non-interest income
9,575
9,435
7,473
NON-INTEREST EXPENSE:
Salaries & employee benefits
8,056
5,177
6,582
Occupancy expense
353
411
383
Merchant services operating expense
3,174
3,149
2,360
Other operating expense
4,884
4,533
3,376
Total non-interest expense
16,467
13,270
12,701
Income before provision for income tax
10,845
13,306
10,531
PROVISION FOR INCOME TAXES
2,747
3,588
2,741
Net income
$
8,098
$
9,718
$
7,790
ASSET QUALITY
March 31, 2025
December 31, 2024
March 31, 2024
(in thousands)
Delinquent accruing loans 30-60 days
$
17,533
$
4,886
$
3,220
Delinquent accruing loans 60-90 days
1,537
2,449
1,950
Delinquent accruing loans 90+ days
46
987
1,332
Total delinquent accruing loans
$
19,116
$
8,322
$
6,502
Loans on non-accrual
$
15,366
$
9,894
$
7,156
Other real estate owned
—
—
—
Nonperforming assets
$
15,366
$
9,894
$
7,156
Delinquent 30-60 / Total Loans
1.60
%
0.46
%
0.35
%
Delinquent 60-90 / Total Loans
0.14
%
0.23
%
0.21
%
Delinquent 90+ / Total Loans
—
%
0.09
%
0.14
%
Delinquent Loans / Total Loans
1.75
%
0.78
%
0.70
%
Non-accrual / Total Loans
1.41
%
0.92
%
0.77
%
Nonperforming assets to total assets
0.98
%
0.66
%
0.51
%
Year-to-date charge-off activity
Charge-offs
$
167
$
1,287
$
—
Recoveries
—
35
4
Net charge-offs (recoveries)
$
167
$
1,252
$
(4
)
Annualized net loan losses to average loans
0.06
%
0.12
%
—
%
CREDIT LOSS RESERVE RATIOS:
Allowance for credit losses
$
12,913
$
11,834
$
10,407
Total loans
$
1,092,441
$
1,071,079
$
926,781
Purchased govt. guaranteed loans
$
16,081
$
16,323
$
19,642
Originated govt. guaranteed loans
$
45,285
$
42,737
$
38,228
ACL / Total loans
1.18
%
1.10
%
1.12
%
ACL / Loans less 100% govt. gte. loans (purchased)
1.20
%
1.12
%
1.15
%
ACL / Loans less all govt. guaranteed loans
1.25
%
1.17
%
1.20
%
ACL / Total assets
0.83
%
0.79
%
0.75
%
SELECT FINANCIAL TREND INFORMATION
For the Quarter Ended:
March 31, 2025
December 31, 2024
September 30, 2024
June 30, 2024
Mar. 31, 2024
BALANCE SHEET- PERIOD END
Total assets
$
1,560,376
$
1,504,128
$
1,512,241
$
1,443,723
$
1,395,095
Loans held for sale
—
—
—
—
—
Loans held for investment
1,092,441
1,071,079
998,222
969,764
926,781
Investment securities
313,826
322,186
345,428
345,491
328,906
Non-interest bearing deposits
825,404
828,508
826,708
731,030
751,636
Interest bearing deposits
494,977
455,869
460,241
437,927
448,893
Total deposits
1,320,381
1,284,377
1,286,949
1,168,957
1,200,529
Short-term borrowings
10,000
—
—
68,000
—
Long-term debt
38,046
38,007
37,967
39,678
39,638
Total equity
191,928
186,574
176,350
167,286
158,690
Accumulated other comprehensive loss
(17,217
)
(18,182
)
(12,715
)
(18,646
)
(19,974
)
Shareholders’ equity
174,711
168,392
163,635
148,640
138,716
QUARTERLY INCOME STATEMENT
Interest income
$
22,274
$
22,403
$
21,404
$
20,887
$
19,268
Interest expense
3,373
3,591
3,617
3,581
3,131
Net interest income
18,901
18,812
17,787
17,306
16,137
Non-interest income
9,575
9,435
7,616
7,423
7,473
Gross revenue
28,476
28,247
25,403
24,729
23,610
Provision for credit losses
1,164
1,671
762
291
378
Non-interest expense
16,467
13,270
12,735
13,285
12,701
Net income before tax
10,845
13,306
11,906
11,153
10,531
Tax provision
2,747
3,588
3,343
3,077
2,741
Net income after tax
8,098
9,718
8,563
8,076
7,790
BALANCE SHEET- AVERAGE BALANCE
Total assets
$
1,531,573
$
1,529,439
$
1,477,259
$
1,704,255
$
1,347,604
Loans held for sale
—
—
—
—
—
Loans held for investment
1,076,848
1,038,215
982,152
954,871
925,561
Investment securities
325,699
333,135
343,096
334,416
315,820
Non-interest bearing deposits
850,426
838,748
822,200
758,977
755,603
Interest bearing deposits
450,124
460,321
432,143
440,147
393,514
Total deposits
1,300,550
1,299,069
1,254,343
1,199,124
1,149,117
Short-term borrowings
2,856
951
—
10,053
9,562
Long-term debt
38,028
37,989
39,479
39,660
39,620
Shareholders’ equity
174,410
167,268
161,363
141,881
134,621
Contact: Steve Miller – President & CEO Bhavneet Gill – EVP & CFO (559) 439-0200
Two students in the UConn landscape architecture program won awards from the Connecticut chapter of the American Society of Landscape Architects (CTASLA) for their community-centered ideas.
Brendan Pugmire ‘25 (CAHNR) and Matthew Bacon ‘25 (CAHNR) were the winners of the 2025 CTASLA Honor Award and Merit Award, respectively.
“It’s very special,” Pugmire says. “It’s very validating to all of the hard work I put into this project to have it recognized at a professional level by my peers.”
Both Pugmire and Bacon developed their projects as part of their junior-year coursework.
“We’re excited and proud of them for achieving these awards, for being recognized,” Jill Desimini, director and associate professor of landscape architecture, says. “We have a growing collaboration with the Connecticut Chapter of the ASLA, and it just highlights the caliber of student work, of teaching, and the types of projects we’ve been able to achieve.”
The landscape architecture program is part of the Department of Plant Science and Landscape Architecture in the College of Agriculture, Health and Natural Resources.
Pugmire’s project titled “Rooted in Time” introduces features to the 180-year-old Brookside Farm in East Lyme to revitalize the site, developed as part of his Design III course with Mariana Fragomeni, assistant professor of landscape architecture.
“The thing about historic restoration is that most projects were not made with modern-day technology and features,” Pugmire says. “So, for me it was about trying to find the happy medium between historic preservation and the modern functionality we see with newer landscapes.”
Pugmire’s design includes an orchard that would revive the farm’s history of growing apples.
It also develops the Brookside Barn into a historical attraction with exhibits of antique farming equipment and other artifacts.
The third element of “Rooted in Time” is a tea garden and kitchen where visitors would pick edible plants like hibiscus, beebalm, and lavender to make fresh teas.
“All of these plants are either native or cultivated,” Pugmire says. “So, they still add to the local ecology.”
Developed as part of his Design III course with Mariana Fragomeni, assistant professor of landscape architecture, Brendan Pugmire ’25 (CAHNR) revitalizes an 180-year-old farm in East Lyme, CT. (Contributed photo)
The plan for the garden includes plants that would bloom in multiple seasons and trees to offer year-round appeal.
Bacon’s project “Pollinator Pathways” presents a plan to use part of the Northeast Science Quad on the UConn Storrs campus as a biodiverse native pollinator garden.
“I wanted to create something that looked very natural and attracted pollinators,” Bacon says.
This project was completed as part of his Planting Design class with Sohyun Park, associate professor of landscape architecture.
Given that there is a laboratory less than a foot below the ground, this limited what plants Bacon could use in his design. The site is also largely in the shade, leading Bacon to choose native plants that could tolerate both less-than-ideal conditions like indigo, ferns, poppies, and grasses.
Bacon chose specific plants to attract pollinators as well, like milkweed for monarchs, and other plants for hummingbirds, bees, and beetles.
“This is the first project that I’ve done that is this style of planting and really going super in-depth with plant species, so it was cool to get recognition for that,” Bacon says.
The site plan also includes bird houses and “pollinator hotels” for bees, benches, and a rain garden.
Any student or first-year graduate attending UConn or living in Connecticut is eligible to enter the contest. UConn students have won these awards in the past, Desimini says. Developing plans for real-world projects in the community is a cornerstone of the nationally accredited landscape architecture program. It provides students with unique experience that helps them hit the ground running in the job market.
Students can also enter their projects for national awards.
“We hope that this will build the confidence of our students and that more students will apply for awards and recognition in the future,” Desimini says. “We feel really good about their projects and the curriculum.”
This work relates to CAHNR’s Strategic Vision area focused on Fostering Sustainable Landscapes at the Urban-Rural Interface.
When we think about intelligent animals, farm species aren’t usually the first to spring to mind. We may picture tool-using primates or puzzle-solving crows. But my recent research suggests that sheep, goats and alpacas – staples of the barnyard – deserve more credit.
In two separate studies, I tested how these animals learn, remember and make sense of the world around them. The findings reveal not only that we’ve underestimated their cognitive abilities, but also that there are important differences between species.
Of the three, goats came out on top – outperforming both sheep and alpacas in tasks testing memory and problem-solving.
Initial testing focused on spatial memory, which is the ability to remember the location of something important, like food. In the wild, this is a important survival skill. Animals need to recall where to find water, food or shelter.
I set up a simple experiment. Each animal had to locate food hidden in one of several buckets in a small arena. Once they’d learned where the food was, I changed the positions and tested how quickly and accurately they could relocate it.
Goats appeared to show the strongest spatial memory, finding the food faster and making fewer errors than the others. Sheep also performed well, although they made more mistakes than the goats. The alpacas, however, struggled to complete the tasks within the time limit.
They’re cute but they lack some of the brain power of their goat counterparts. Siam Stock/Shutterstock
This stronger spatial memory in goats could be linked to their evolutionary history. They have adapted to forage across wide, rocky landscapes and they have probably developed a sharp memory to help them navigate efficiently and return to good food sources.
The second study looked at more complex cognitive skills: object permanence, numerical competence and categorisation – all central to making sense of a changing world.
You may have tested object permanence without realising it, for example, if you’ve ever played peekaboo with a baby. This skill is knowing that an object still exists even when it’s hidden from view. It seems easy, but this ability is an important developmental milestone for humans. Other animals use object permanence to track food, predators, prey, or their own young. It’s an essential skill for survival.
So, for this experiment, I placed food under a cup and gradually made the task harder. I added empty cups, or switched the positions of the cups so the animal had to mentally track the hidden reward.
The goats again excelled at this task. They showed a higher awareness of object permanence than the sheep and alpacas, demonstrating the ability to mentally reconstruct where the hidden object was concealed.
In other tasks, all three could tell the difference between larger and smaller quantities of food, usually picking the container with more treats. But when it came to grouping shapes that looked similar, they all found it equally difficult.
Smarter than we think
Together, these studies offer evidence to dispute the idea that farm animals are not intellectually gifted. Each species has different strengths. But my research suggests that goats understand, remember and process information with greater efficiency in the abilities tested than sheep and alpacas.
Understanding how animals think isn’t just an academic exercise either – it has real-world implications. If we know more about an animal’s cognitive abilities, we can design better environments and improve their welfare. We can also better predict how they’ll behave when grazing or adapting to new surroundings.
For instance, animals with poorer spatial memory may need extra help navigating a field or enclosure. Those with higher cognitive skills may benefit from more stimulating environments that allow them to explore and solve problems.
There may be more going on in the barnyard than we often assume. So, next time you’re at a petting zoo or walking past a farm, don’t be fooled by the woolly coats and demeanour. Especially when it comes to the goats – they may just be outsmarting everyone.
Megan Quail does not work for, consult, own shares in or receive funding from any company or organisation that would benefit from this article, and has disclosed no relevant affiliations beyond their academic appointment.
In a step to strengthen flood resilience in the region last week experts and stakeholders met to share skills.
More than 50 natural flood management (NFM) experts, land managers, and policymakers gathered in Kirkby Malham on Friday 11 April for the first Yorkshire NFM Community of Practice (CoP) Monitoring Skill Share – a practical and collaborative event designed to improve how we monitor NFM’s impact across the region.
Supported by Ousewem and the Environment Agency, the event brought together academics, consultants, and practitioners to share knowledge, test equipment, and explore how monitoring can drive better land management, funding decisions, and long-term resilience.
A shift from data collection to decision-making
From leaky dams in the Dales to river restoration in the Skell Valley, the morning presentations covered a wide range of real-world case studies – including Ousewem’s own approach, which blends landowner-led visual tools with technical data collection to feed into catchment-scale modelling.
Dr Steph Bond, Impact Translation Fellow at iCASP, said:
There’s often uncertainty around why data is being collected or what happens to it. This event helped shift the conversation from just collecting data to using it effectively.”
The afternoon offered hands-on demonstrations at a local site, where attendees used flow monitoring equipment and discussed practical challenges such as data storage, maintenance, and accessibility.
From learning to action
A pre-event survey revealed the wide variety of monitoring methods already in use – from drone footage to simple stage boards. Learning from the day will now feed into a shared resource for the Yorkshire NFM Community of Practice, including:
An inventory of equipment and local support contacts
Tips on setting up and maintaining kit
A draft letter to Defra on improving monitoring support in future funding rounds
Mark Henderson, Flood Risk Manager at City of York Council, said:
We see monitoring not as a tick-box exercise, but as a decision-making tool that shapes investment, policy, and long-term resilience.
“Sponsoring this event reflects Ousewem’s commitment to evidence-led NFM – and to working openly with others to improve outcomes across the region.”
Cllr Jenny Kent, Executive Member for Environment and Climate Emergency at City of York Council, added:
Nature-based solutions are central to York’s long-term climate resilience strategy.
“To unlock private and public investment in nature-based solutions, we need rigorous data and regional collaboration. Events like this skill share show the value of working collaboratively across sectors to build the evidence we need to invest with confidence. I’m proud that Ousewem, led by City of York Council, is helping to lead that charge.”
What’s next for Ousewem
The Skill Share is just one part of Ousewem’s broader investment in NFM evidence gathering. Upcoming initiatives include:
The next in Ousewem’s video series exploring how monitoring can strengthen decision-making – featuring footage from the Skill Share event.
Living Lab student research, such as Owain Wells’ study of how leaky dams influence upper catchment flows.
Soil aeration trials in Crimple Beck upstream of Burn Bridge, where we’re inviting local farmers to explore how improved soil structure can boost water storage and flood resilience.
Get involved
Would you like to join a future NFM Community of Practice meeting or take part in our next trial?
Contact iCASP@leeds.ac.uk with ‘NFM Community of Practice’ in the subject line or reach out to Ousewem for more on our soil aeration initiative.
For more information or to explore collaboration opportunities, please contact the Ousewem team at ousewem@york.gov.uk.
Nairobi (Agenzia Fides) – “We are left wondering where will the poor go and who will stand for them. What we are doing is wrong and we are completely destroying our country through corruption”, Msgr. Dominic Kimengich, Bishop of Eldoret said after leading a Palm Sunday service on Sunday, April 13. “Corruption has reached saddening levels where Kenyans have to buy jobs and those in positions are using public offices to amass for themselves. If we continue going that way, we are just destroying our country”, the Bishop remarked.Msgr. Kimengich added that the taxes paid by Kenyans should be used to provide essential public services and generate jobs in the public sector.The Bishop of Eldoret regretted that insecurity is still a major problem in Kerio Valley with the re-emergence of banditry.”The government should not allow a few people to take us back with killing of innocent people in Kerio Valley,” he said. In the past two months, at least ten people—including two police officers – have been killed in attacks by bandits in that region. Insecurity has devastating economic and social consequences: pastures, livestock, and crops, particularly mangoes, the local main export, are affected. Furthermore, the poor condition of the roads discourages middlemen and transporters, who prefer to avoid the area. As a result, many farmers are unable to market their produce and are forced to let the fruit rot on the trees.Added to this is criminal activity, schools in the area were closed in December. To address the situation, President William Ruto announced in January the creation of a military training camp in the region, with the aim of strengthening security. (L.M.) (Agenzia Fides, 16/4/2025)
Share:
Source: The Conversation – Africa – By Vinothan Naidoo, Associate Professor of Public Policy and Administration, University of Cape Town
South Africa’s multi-party government of national unity (GNU), which emerged in the wake of the May 2024 elections, marked a turning point in the country’s political history. It took South Africans back to the 1990s, when the country showed that political opponents could find common cause.
The formation of the government of national unity expressed the hope that the country could do it again.
But just nine months into its term, the good will and pragmatism which marked its formation have worn thin. A major budget impasse between the two major actors, the African National Congress (ANC) and the Democratic Alliance (DA), threatens the coalition.
South Africans have long been accustomed to viewing the world of politics, governance and bureaucracy through the lens of a top-down “strong” state – a vicious apartheid state, an East Asia style developmental state, or a collusive “predatory state”.
But as recent analyses we co-authored with others have detailed,
the vision of a top-down politically cohesive state no longer fits South Africa’s realities.
The government of national unity promised the hope that the country was embracing an approach that is key to success for almost all inclusive constitutional democracies. That is – abandon “all or nothing” confrontation, and instead pursue pragmatic bargains to achieve mutually agreeable policy outcomes.
At the most basic level, the government of national unity achieved this, at least for a while. The sharing of cabinet ministries between multiple parties created a diverse platform for executive power-sharing that was not dictated by a single dominant party, and which prevented the risks of parties building institutional fiefdoms.
In our view, failure to overcome deeply ingrained political differences could set off a downward spiral in the country.
Achievements on the governance front
On governance, the government of national unity created the space to pursue two sets of gains.
The first comprises the potential benefit of bringing together unlikely bedfellows.
The former opposition parties brought into a power-sharing arrangement were bound to be performance-driven, given the country’s long deteriorating government performance and ethical integrity. They had made “good governance” and criticism of the ANC central to their political brands.
New “outsider” eyes brought into formerly cloistered and factionalised ANC-run departments created the possibility of a new urgency to perform.
It’s too soon to tell whether this is happening, but anecdotal evidence suggests there are some green shoots.
The second governance gain comprises the crucial task of building a capable and professional state bureaucracy. The challenges include being able to pay the public sector wage bill, fostering a culture of delivery, and consolidating the bloated network of government departments.
Based on their party manifestos and public utterances, members of the government all aim to professionalise the public service.
Detailed technical work is already happening on issues such as training and competency assessment, transferring powers of appointment from politicians to senior public servants, and instituting checks in the recruitment and selection process. The National Assembly’s recent adoption of the Public Service Commission Bill forms part of this agenda.
The government of national unity has struggled to create effective mechanisms to translate agreement on a broad agenda of policy priorities into specific outcomes. This came at a higher cost than expected.
Still, it has made gains in challenging policy areas. These gains have repeatedly been undermined by the perverse determination of sections within both the ANC and the DA to engage in brinkmanship.
On health, both parties agree on the principle of universalising access. They differ on how to achieve this. But at least one seemingly intractable sticking point has been resolved. Both sides agree that private medical aid schemes need to be retained as part of a broader strategy of pursuing health system reform.
On basic education, the public spat over the Basic Education Laws Amendment Bill overshadows the potential to agree on balancing the autonomy of school governing bodies with the oversight role of provincial departments.
On land expropriation, the emotive rhetoric which followed the signing of the Expropriation Bill and the unwelcome and toxic intervention of international actors has overshadowed technical concerns which can be resolved.
On pro-growth policies: Operation Vulindlela, a joint Presidency and National Treasury initiative to unblock constraints in targeted economic sectors, has made significant strides. It has laid the groundwork for new rounds of growth-supporting infrastructural reforms and has the potential to build cohesion in the government of national unity. However, the DA’s attempt to lobby for a greater role in the strategic oversight of Operation Vulindlela in exchange for supporting the budget risks souring relations with the ANC.
What now?
A thriving inclusive society depends on powerful actors visibly committed to co-operation.
For all of the challenges confronting the government of national unity, it was built on a foundation of pragmatism. For the sake of South Africa’s future, it remains vital to build on this foundation. Obsolete top-down governing approaches must go. Pathways to performance must be lifted above political grandstanding. Constructive solutions should supersede ideological rigidity. South Africa has done it before. It can do it again.
The authors do not work for, consult, own shares in or receive funding from any company or organisation that would benefit from this article, and have disclosed no relevant affiliations beyond their academic appointment.
Headline: Streamlining detection engineering in security operation centers
Security operations centers (SOCs) exist to protect organizations from cyberthreats by detecting and responding to attacks in real time. They play a crucial role in preventing security breaches by detecting adversary activity at every stage of an attack, working to minimize damage and enabling an effective response. To accomplish this mission, SOC operations can be broken down into four operating phases:
Each of these operating phases has a distinct role to play, and well-defined processes or procedures ensure a seamless handover of findings from one phase to the next. In practice, SOC processes and procedures at each operational phase often require continuous improvement over time.
Assessment observations: Common SOC issues
During our involvement in SOC technical assessments, adversary emulations, and incident response readiness projects across different regions, we evaluated each operating phase separately. Based on our assessments, we observed common challenges, weak practices, and recurring issues across these four key SOC capabilities.
Log collection
There are three main issues we have observed at this stage:
Lack of visibility coverage based on the MITRE DETT&CT framework – customers do not practice maintaining a visibility coverage matrix. Instead, they often maintain log source data as an Excel or similar spreadsheet that is not easily tracked. This means they don’t have a systematic approach to what data they are feeding into the SIEM and which TTPs can be detected in their environment. And in most cases, maintaining a continuous visibility matrix is also a challenge because log sources may disappear over time for a variety of reasons: agent termination, changes in log destination settings, device (e.g., firewall) replacement. This only leads to the degradation of the log visibility matrix.
Inefficient use of data for correlation – in many cases, relevant data is available to detect threats, but there are no correlation rules in place to leverage it for threat detection.
Correlation exists, but lacks the necessary data fields – while some rule sets are properly configured with the right logic to detect threats, the required data fields from log sources are missing, preventing the rules from being triggered. This critical issue can only be detected through a data quality assessment.
Detection
At this stage, we have seen the following issues during assessment procedures:
Over-reliance on vendor-provided rules – many customers rely heavily on the default rule sets in their SIEM and only tune them when alerts are triggered. Since the default content is not optimized, it often generates thousands of alerts. This reactive approach leads to excessive alert fatigue, making it difficult for analysts to focus on truly meaningful alerts.
Lack of detection alignment with the threat profile – the absence of a well-defined organizational threat profile prevents customers from focusing on the threats that are most likely to target them. Instead, they adopt a scattered approach to detection, like shooting in the dark rather than prioritizing relevant threats.
Poor use of threat intelligence feeds – we have encountered cases where endpoint logs do not contain file hash data. The log sources only provide filenames or file paths, but not the actual hash values, making it difficult for the SOC to correlate threat intelligence (TI) feeds that rely on file hashes. As a result, TI feeds are not operational because the required data field is not ingested into the SIEM.
Analytics deployment errors – one of the most challenging issues we see is when a well-designed detection rule is deployed incorrectly, causing threat detection to fail despite having the right analytics in place. We have found that there is no structured process for reviewing and validating rule deployments.
Triage and investigation
The most typical issues at this stage are:
Lack of a documented triage procedure – analysts often rely on generic, high-level response playbooks sourced from the internet, especially from unreliable sources, which slows or hinders the process of qualifying alerts as potential incidents. Without a structured triage procedure, they spend more time investigating each case instead of quickly assessing and escalating threats.
Unattended alerts – we also observed that many alerts were completely ignored by analysts. This likely stems from either a lack of skill in linking multiple alerts into a single incident, or analysts being swamped with high-severity alerts, causing them to overlook other relevant alerts.
Difficulty in correlating alerts – as noted in the previous observation, one of the biggest challenges is linking related alerts into a single incident. The lack of alert correlation makes it harder to see the full attack pattern, leading to disorganized alert diagnosis.
Default use of alert severity – SIEM default rules don’t take into account the context of the target system. Instead, they rely on the default severity in the rule, which is often set randomly or based on an engineer’s opinion without a clear process. This lack of context makes it harder to investigate and properly assess alerts.
Response
The challenges of the final operating phase are most often derived from the issues encountered in the previous stages.
Challenges in incident scoping – as mentioned earlier, the inability to properly correlate alerts leads to a fragmented understanding of attack patterns. This makes it difficult to see the bigger picture, resulting in inefficient incident handling and misjudged response efforts.
Increase in unnecessary escalations – this issue is particularly common in MSSP environments, where a lack of understanding of baseline behavior causes analysts to escalate benign cases. Without proper context, normal activities are mistaken for threats, resulting in wasted time and effort.
With these ongoing challenges, chaos will continue in SOC operations. As organizations adopt new security tools such as CASB and container security, both of which generate valuable detection data, and as digital transformation introduces even more technology, security operations will only become more complex, exacerbating these issues.
Taking the right and impactful approach
Enhancing SOC operations requires evaluating each operating phase from an investment perspective, with the detection phase having the greatest impact because it directly affects data quality, threat visibility, incident response efficiency, and the overall effectiveness of the SOC analyst. Investing in detection directly influences all the other operating phases, making it the foundation for improving all operating phases. The detection operating phase must be handled through a dedicated program that ensures log collection is purpose-driven, collecting only the data fields necessary for detection rather than unnecessarily driving up SIEM costs. This focused approach helps define what should be ingested into the SIEM while ensuring meaningful threat visibility.
Strengthening detection reduces false positives and false negatives, improves true positive rates, and enables the identification of attacker activity chains. A documented triage and investigation process streamlines the work of analysts, improving efficiency and reducing response time. Furthermore, effective incident scoping, guided by accurate detection of the cyber kill chain, enables a faster and more precise response. By prioritizing investment in detection and managing it through a structured approach, organizations can significantly improve SOC performance and resilience against evolving threats. This article focuses solely on SIEM-based detection management.
Detection engineering program
Before diving into the program-level approach, we will first present the detection engineering lifecycle that forms the foundation of the proposed program. The image below shows the stages of this lifecycle.
The detection engineering lifecycle shown here is typically followed when building detections, but its implementation often lacks well-defined processes or a dedicated team. A structured program must be put in place to ensure that the SOC’s investment and efforts in detection engineering are used efficiently.
When we talk about a program, it should be built on the following key elements:
A dedicated team responsible for driving the program
Well-defined processes and procedures to ensure consistency and effectiveness
The right tools to integrate with workflows, facilitate output handovers, and enable feedback loops across related processes
Meaningful metrics to measure the overall performance of the program.
We will discuss these performance measurement metrics in the final section of the article.
Team supporting detection engineering program
The key idea behind having a dedicated team is to take full control of the detection engineering (DE) lifecycle, from analysis to release, and ensure accountability for the program’s success. In a traditional SOC setup, deployment and release are often handled by SOC engineers. This can lead to deployment errors due to potential differences in the data models used by DE and SOC teams (raw log data vs. SIEM-optimized data), as well as deployment delays due to the SOC team being overloaded with other tasks. This, in turn, can indirectly impact the work of the detection team. However, the one responsibility that does not fall under the DE team is log onboarding. Since this process requires coordination with other teams, it should continue to be managed by SOC engineers to keep the DE team focused on its core objectives.
The DE team should start with at least three key roles:
The size of the team depends on factors related to the program’s objectives. For example, if the goal is to build a certain number of detection rules per month, the number of detection engineers required will vary accordingly. Similarly, if a certain number of rules need to be tested and deployed within a week, the team size must be adjusted to meet that demand.
The Detection Engineering Lead should communicate with SOC leadership to set the right expectations by outlining what goals can realistically be achieved based on the size and capacity of the DE team. A dedicated Detection QA role can be established as the need for testing, deployment, and release of detections grows.
Process and procedures
Well-defined workflows, supported by structured processes and procedures, must be established to streamline detection engineering operations. The following image illustrates the necessary processes and procedures, along with the roles responsible for executing each workflow:
During the qualification process, the Detection Engineering Lead or Detection Engineer may discover that the data source needed to develop a detection is not available. In such cases, they should follow the log management process to request onboarding of the required data before proceeding with detection research and development. The testing process typically checks that the rule works by ensuring that the SIEM triggers an alert based on the required data fields.
Lastly, a validation process that is not part of the detection engineering lifecycle must be incorporated into the detection engineering program to assess its overall effectiveness. Ideally, this validation should be conducted by individuals outside the DE lifecycle or by an external service provider.
Proper planning is required that incorporates threat intelligence and an updated threat profile. In addition, the validation process should generate reports that outline:
What is working well
Areas that need improvement
Detection gaps identified
Tools
An essential element of the DE lifecycle is the use of tools to streamline processes and improve efficiency. Key tools include:
Ticketing platform – efficiently manages workflows, tracks progress from ticket creation to closure, and provides time-based metrics for monitoring.
Rules repository – platform for managing detection queries and code, supporting Detection-as-Code, using a unified rule format such as SIGMA, and implementing code development best practices in detection engineering, including features such as version control and change management.
Centralized knowledge base – dedicated space for documenting detection rules, descriptions, research notes, and other relevant information. See the best practices section below for more details on centralized documentation.
Communication platform – facilitates collaboration among DE team members, integrates with the ticketing system, and provides real-time notification of ticket status or other issues.
Lab environment – virtualized setup, including SIEM and relevant data sources, tools to simulate attacks for testing purposes. The core function of the lab is to test detection rules prior to release.
Best practices in detection engineering
Several best practices can significantly enhance your detection engineering program. Based on our experience, implementing these best practices will help you effectively manage your rule set while providing valuable support to security analysts.
Rule naming convention
When developing analytics or a rule, adhering to a proper naming convention provides a concrete framework. A rule name like “Suspicious file drop detected” may confuse the analyst and force them to dig deeper to understand the context of the alert that was triggered. It would be better to give a rule a name that provides complete context at first glance, such as “Initial Access | Suspicious file drop detected in user directory | Windows – Medium”. This example makes it easy for the analyst to understand:
At what stage of the attack the rule is triggered. In this case, it is Initial Access as per MITRE / Kill Chain Model.
Where exactly the file was dropped. In this case, the user directory was the target, which may mean that this probably involved user interaction, which is another sign that the attack was probably detected at an early stage.
What platform was attacked. In this case, it is Windows, which can help the analyst to quickly find the machine that triggered the alert.
Lastly, an alert priority can be set, which helps the analyst to prioritize accordingly. For this to work properly, SIEM’s priority levels should be aligned with the rule priorities defined by the detection engineering team. For example, a high priority in SIEM should correspond to a high-priority alert.
A consistent rule naming structure can help the detection engineering team to easily search, sort and manage existing rules, avoid creating duplicates with different names, etc.
The naming structure doesn’t necessarily have to look like the example above. The whole idea of this best practice is to find a good naming convention that not only helps the SOC analyst, but also makes managing detection rules easier and more convenient.
For example, while the rule name “Audit Log Deletion” gives a basic idea of what is happening, a more effective name would be:
1
[High] – Audit Log Deletion in Internal Server Farm – Linux – Defense Evasion (1070.002).
This provides better context, making it much more useful to the SOC team, and more keywords for the DE team to find this particular rule or filter rules if necessary.
Centralized knowledge base
Once a rule is created after thorough research, the detection team should manage it in a centralized platform (a knowledge base). This platform should not only store the rule name and logic, but also other key details. Important elements to consider:
Rule name/ID/description – rule name, unique ID, and a brief description of the rule.
Rule type/status – provides insight into the rule type (static, correlated, IoC-based, etc.) and the status (experimental, stable, retired, etc.).
Severity and confidence – seriousness of the threat triggering this rule and the likelihood of a true positive.
Research notes – possible public links, threat reports, used as a basis for creating the rule.
Data components used to detect the behavior – list of source and data fields used to detect activity.
Triage steps – provides steps to investigate the alert.
False positives – provides options where the alert could show false positive behavior.
Tags (CVE, Actors, Malware, etc.) – provide more context if the detection is linked to a behavior or artifact, specific to any APT group, or malware.
Make sure this centralized documentation is accessible to all SOC analysts.
Contextual tagging
As covered in the previous best practice, tags provide a great value in understanding the attack chain. That’s why we want to highlight them as a separate best practice.
The tags attached to the above detection rule are the result of the research done on the behavior of the attack when writing the detection rule. They help the analyst gain more context at the time the rule is triggered. In the example above, the analyst may suspect a potential initial access attempt related to QakBot or Black Basta ransomware. This also helps in reporting to security leadership that the SOC team successfully detected the initial ransomware behavior and was able to thwart the attack in the early stages of the kill chain.
Triage steps
A good practice is to include triage (or investigation steps) in detection rule documentation. Since the DE team has spent a lot of time understanding the threat, it is very important to document the precursors and possible next steps the attacker can take. The SOC analyst can quickly review these and provide incident qualification with confidence.
For the rule from the previous section, “Initial Access | Suspicious LNK files dropped in download folder | Windows – Medium”, the triage procedure is shown below.
MITRE has a project called the Technique Inference Engine, which provides a model for understanding other techniques an attacker is likely to use based on observed adversary behavior. This tool can be useful for both DE and SOC teams. By analyzing the attacker’s path, organizations can improve alert correlation and enhance scoping of incident/threats.
Baselining
Understanding the infrastructure and its baseline operations is a must, as it helps reduce the false positive rate. The detection engineering team must learn the prevention policies (to de-prioritize detection if already remediated), learn about the technologies deployed in the infrastructure, understand the network protocols being used and user behavior under normal circumstances.
For example, to detect T1480.002: Execution Guardrails: Mutual Exclusion sub-technique, MITRE recommends monitoring a “file creation” data component. According to the MITRE Data Sources framework, data components are possible actions with data objects and/or data objects statuses or parameters that may be relevant for threat detection. We discussed them in more detail in our detection prioritization article.
A simple rule for detecting such activity is to monitor lock file creation events in the /var/run folder, which stores temporary runtime data for running services. However, if you have done the baselining and found that the environment uses containers that also create lock files to manage runtime operations, you can filter out container-linked events to avoid triggering false positive alerts. This filter is easy to apply, and overall detection can be improved by baselining the infrastructure you are monitoring.
Finding the narrow corridors
Some indicators, such as file hashes or software tools are easy to change, while others are more difficult to replace. Detections based on such “narrow corridors” tend to have high true positive rates. To pursue this, detection should focus primarily on behavioral indicators, ensuring that attackers cannot easily evade detection by simply changing their tools or tactics. Priority should be given to behavior-based detection over tool-specific, software-dependent, or IoC-driven approaches. This aligns with the Pyramid of Pain model, which emphasizes detecting adversaries based on their tactics, techniques, and procedures (TTPs) rather than easily replaceable indicators. By prioritizing common TTPs, we can effectively identify an adversary’s modus operandi, making detection more resilient and impactful.
Universal rules
When planning a detection program from scratch, it is important not to ignore the universal threat detection rules that are mostly available in SIEM by default. Detection engineers should operationalize them as soon as possible and tune them according to feedback received from SOC analysts or what they have learned about the organization’s infrastructure during baselining activity.
Universal rules generally include malicious behavior associated with applications, databases, authentication anomalies, unusual remote access behavior, and policy violation rules (typically to monitor compliance requirements).
Some examples include:
Windows firewall settings modification detected
Use of unapproved remote access tools
Bulk failed database login attempts
Performance measurement
Every investment needs to be justified with measurable outcomes that demonstrate its value. That is why communicating the value of a detection engineering program requires the use of effective and actionable metrics that demonstrate impact and alignment with business objectives. These metrics can be divided into two categories: program-level metrics and technical-level metrics. Program-level metrics signal to security leadership that the program is well aligned with the company’s security objectives. Technical metrics, on the other hand, focus on how operational work is being carried out to maximize the detection engineering team’s operational efficiency. By measuring both program-level metrics and technical-level metrics, security leaders can clearly show how the detection engineering program supports organizational resilience while ensuring operational excellence.
Designing effective program-level metrics requires revisiting the core purpose for initiating the program. This approach helps identify metrics that clearly communicate success to security leadership. There are three metrics that can be very effective to measure the success at program level.
Time to Detect (TTD) – this metric is calculated as the time elapsed from the moment an attacker’s initial activity is observed until the time it is formally detected by the analyst. Some SOCs consider the time the alert is triggered on the SIEM as the detection time, but that is not really an actionable metric to consider. The time the alert is converted into a potential incident is the best option to consider for detection time by SOC analysts.
Although the initial detection of activity occurs at t1 (alert triggered), when malicious activity occurs, a series of events must be analyzed before qualifying the incident. This is why t3 is required to correctly qualify the detection as a potential threat. Additional metrics such as time to triage (TTT), which establishes how long it takes to qualify the incident, and time to investigate (TTI), which describes how long it takes to investigate the qualified incident, can also come in handy.
Time to detect compared to time to triage and time to investigate metrics
Signal-to-Noise Ratio (SNR) – this metric indicates the effectiveness of detection rules by measuring the balance between relevant and irrelevant information. It compares the number of true positive detections (correct alerts for real threats) to the number of false positives (incorrect or misleading alerts).
Where:
True positives: instances where a real threat is correctly detected False positives: incorrect alerts that do not represent real threats
A high SNR indicates that the system is generating more meaningful alerts (signal) compared to noise (false positives), thereby enhancing the efficiency of security operations by reducing alert fatigue and focusing analysts’ attention on genuine threats. Improving SNR is crucial to maximizing the performance and reliability of a detection program. SNR directly impacts the amount of SOC analyst effort spent on false positives, which in turn influences alert fatigue and the risk of professional burnout. Therefore, it is a very important metric to consider.
Threat Profile Alignment (TPA) – this metric evaluates how well detections are aligned with known adversarial tactics, techniques, and procedures (TTPs). This metric measures this by determining how many of the identified TTPs are adequately covered by unique detections (unique data components).
Total TTPs identified – this is the number of known adversarial techniques relevant to the organization’s threat model, typically derived from cyber threat intelligence threat profiling efforts Total TTPs covered with at least three unique detections (where possible) – this counts how many of the identified TTPs are covered by at least three distinct detection mechanisms. Having multiple detections for a given TTP enhances detection confidence, ensuring that if one detection fails or is bypassed, others can still identify the activity. Team efforts supporting the detection engineering program must also be measured to demonstrate progress. These efforts are reflected in technical-level metrics, and monitoring these metrics will help justify team scalability and address productivity challenges. Key metrics are outlined below:
Time to Qualify Detection (TTQD) – this metric measures the time required to analyze and validate the relevance of a detection for further processing. The Detection Engineering Lead assesses the importance of the detection and prioritizes it accordingly. The metric equals the time that has elapsed from when a ticket is raised to create a detection to when it is shortlisted for further research and implementation.
Time to Create Detection (TTCD) – this tracks the amount of time required to design, develop and deploy a new detection rule. It highlights the agility of detection engineering processes in responding to evolving threats.
Detection Backlog – the backlog refers to the number of pending detection rules awaiting review or consideration for detection improvement. A growing backlog might indicate resource constraints or inefficiencies.
Distribution of Rules Criticality (High, Medium, Low) – this metric shows the proportion of detection rules categorized by their criticality level. It helps in understanding the balance of focus between high-risk and lower-risk detections.
Detection Coverage (MITRE) – detection coverage based on MITRE ATT&CK indicates how well the detection rules cover various tactics, techniques, and procedures (TTPs) in the MITRE ATT&CK framework. It helps identify coverage gaps in the defense strategy. Tracking the number of unique detections that cover each specific technique is highly recommended, as it provides visibility into the threat profile alignment – a program level metric. If unique detections are not being built to detect gaps and the coverage is not increasing over time, it indicates an issue in the detection qualification process.
Share of Rules Never Triggered – this metric tracks the percentage of detection rules that have never been triggered since their deployment. It may indicate inefficiencies, such as overly specific or poorly implemented rules, and provides insight for rule optimization.
There are other relevant metrics, such as the proportion of behavior-based rules in the total set. Many more metrics can be derived from a general understanding of the detection engineering process and its purpose to support the DE program. However, program managers should focus on selecting metrics that are easy to measure and can be calculated automatically by available tools, minimizing the need for manual effort. Avoid using an excessive number of metrics, as this can lead to a focus on measurement only. Instead, prioritize a few meaningful metrics that provide valuable insight into the program’s progress and efforts. Choose wisely!
Source: Hong Kong Government special administrative region
Following is a question by the Hon Chan Hoi-yan and a written reply by the Secretary for Labour and Welfare, Mr Chris Sun, in the Legislative Council today (April 16):
Question:
It is learnt that new public toilets built by the Government generally adhere to the requirements of the Buildings Department’s “Design Manual: Barrier Free Access 2008” and include accessible toilets. However, some wheelchair users have relayed that some of these toilets are not equipped with power-operated doors and significant physical strength are required to open the doors, thereby causing inconvenience to users. In this connection, will the Government inform this Council:
(1) of the respective numbers of public toilets and accessible toilets currently managed by the Food and Environmental Hygiene Department, the Leisure and Cultural Services Department and the Agriculture, Fisheries and Conservation Department and, among them, the number of accessible toilets equipped with power-operated doors;
(2) of the expenditures/estimates involved for constructing public toilets (including modification and refurbishment works) by various government departments in the past year and the coming year;
(3) of the Government’s specific considerations in respect of the installation of power-operated doors in accessible toilets, and the average cost of installing each power-operated door;
(4) whether the Government will increase the number of accessible toilets equipped with power-operated doors; if so, of the details; if not, the reasons for that;
(5) of the following information on the accessible toilets managed by various government departments which have been suspended due to repair or other reasons in the past three years: the names and addresses of the public toilets in which they are located, and the total number of days suspended;
(6) of the respective average daily usage of various public toilets of the Government that have been installed with the Smart Public Toilet System and the accessible toilets in these public toilets in the past three years; and
(7) of the number of complaints received by various government departments about the use of accessible toilets in public toilets under their management in the past three years, as well as the major subject matters of such complaints; whether the Government has formulated clear guidelines and provided relevant training for frontline cleaning staff to improve the management of these public toilets; if so, of the details of the relevant training (including the training contents as well as the number of training and participants); if not, the reasons for that?
Reply:
President,
The Government is committed to providing a barrier-free environment for persons with disabilities, so as to enable them to have a barrier-free access to premises and make use of the facilities and services on an equal basis with others, thereby enabling them to live independently and fully integrate into the community.
At present, the provision of accessible toilets is a statutory requirement under the Third Schedule to Regulation 72 of the Building (Planning) Regulations (Cap. 123F), while the provision of power-operated doors for accessible toilets is a recommended best practice under Division 11 of Chapter 4 of the Design Manual: Barrier Free Access 2008 (2024 edition) (Design Manual). The Buildings Department commissioned a consultant in February 2024 to review the Design Manual (including the design requirements for accessible toilets) with the objective of enhancing the standards of barrier-free facilities in private buildings by integrating universal design concepts to meet the latest needs and international trends, and ensuring that the standards are feasible and pragmatic for implementation in the local context. The consultancy study is expected to be completed in the first quarter of 2026.
The Government does not maintain a consolidated list of public toilets and accessible toilets managed by various bureaux and departments. That said, the vast majority of public toilets and toilet facilities (including accessible toilets) provided for public use in public venues are managed by the Agriculture, Fisheries and Conservation Department (AFCD), the Food and Environmental Hygiene Department (FEHD), the Home Affairs Department (HAD) and the Leisure and Cultural Services Department (LCSD). Having consulted the relevant bureaux/departments, I set out below a consolidated reply to the Member’s question:
(1) At present, the numbers of public toilets, accessible toilets and the latter equipped with power-operated doors managed by the AFCD and the FEHD are as follows:
Department
Number of public toilets under its management
Number of public toilets with accessible toilets (number of those equipped with power-operated doors)
AFCD
64
54 (0)
FEHD
812
402 (7)
The LCSD also provides about 1 100 toilets in its leisure, sports and cultural facilities for use by service users. The vast majority of which are furnished with accessible toilets, and among these accessible toilets, about 40 are equipped with power-operated doors.
(2) The expenditure and estimates of the construction of public toilets (including conversion and refurbishment projects) under the AFCD and the FEHD in 2024-25 and 2025-26 are as follows:
Department
Expenditure on the construction of public toilets (including conversion and refurbishment projects) ($ million)
2024-25 (Revised estimate)
2025-26 (Estimate)
AFCD
20.35
83.00
FEHD
88.81
173.77
When developing new or renovating existing leisure, sports and cultural facilities, the LCSD will provide barrier-free ancillary facilities as appropriate, including accessible toilets. The relevant construction costs are part of the overall project estimates, and the LCSD does not maintain breakdown figures.
(3) and (4) According to the Design Manual, the installation of power-operated doors in accessible toilets is a recommended best practice rather than a mandatory requirement. That said, it is the established policy of the Government to follow the recommended best practices in the Design Manual, and where practicable, achieve a higher standard than the statutory requirements in the provision of barrier-free facilities. When considering whether to install power-operated doors in accessible toilets, the departments concerned will take into account a basket of factors, including the usage rate of public toilets, power supply and whether the physical environment (such as location in the suburbs) allows stable operation of power-operated doors. The departments concerned will continue to timely review the usage of accessible toilets and the needs of users, and install power-operated doors in accessible toilets as appropriate. In general, the existing cost of installing each power-operated door is about $50,000 to $60,000.
(5) Information on the accessible toilets managed by the AFCD, the FEHD and the HAD that had been temporarily suspended for maintenance in the past three years are at Annexes 1 to 3 respectively.
Regarding the accessible toilets provided by the LCSD in its leisure, sports and cultural facilities, being part of the facilities/venues, they will not be available for use when the facilities/venues concerned are undergoing repair, renovation and maintenance, etc. The LCSD does not maintain information on the temporary suspension of accessible toilets due to maintenance.
(6) The average daily usage of public toilets installed with the Smart Public Toilet System and the accessible toilets in these public toilets managed by the FEHD in the past three years are at Annex 4.
​Besides, the LCSD has also installed smart systems in the toilets provided in its leisure, sports and cultural facilities, of which seven are located in Kowloon Park and two in Tsuen Wan Sports Centre and Hong Kong Cultural Centre respectively. The LCSD does not maintain information on the average daily usage of these toilets.
(7) In the past three years, the number of complaints about accessible toilets received by the AFCD, the FEHD, the HAD and the LCSD are as follows:
Department
Number of complaints about accessible toilets received between 2022 and 2024
AFCD
About 20
FEHD
About 480
HAD
2
LCSD
About 10
The complaints were mainly about damaged facilities, insufficient facilities, cleanliness, etc. The departments concerned will follow up the complaints and urge cleansing service contractors to deliver the services, and arrange and provide relevant training for their frontline cleansing staff in accordance with the contractual requirements (including the level of cleanliness and service frequency). Site inspections and surprise checks will also be conducted by the departments concerned from time to time to better monitor the contractors’ service performance and ensure service quality. Besides, the FEHD has added new clauses in the dedicated contract for cleansing and management services for public toilets, requiring contractors’ toilet attendants to have received relevant vocational training and possess recognised qualifications.
Source: Hong Kong Government special administrative region
LCQ9: Promoting pet inclusivity and enhancing animal protection Question:
As regards promoting pet inclusivity and enhancing animal protection, will the Government inform this Council:
(1) whether it has compiled statistics on the number of households keeping pets, as well as the respective numbers of dogs and cats which have been microchipped and licensed, in Hong Kong;
(2) whether it has assessed the effectiveness of the Government’s promotion of public education on pet inclusivity (such as responsible pet ownership and prevention of cruelty to animals) in the past two years; if so, of the details; if not, the reasons for that;
(3) given that the Food Business Regulation (Cap. 132X) currently prohibits dogs (except guide dogs) from entering food premises, and it is learnt that some shopping malls have successively allowed pets to enter their areas in recent years, whether the Government will consider implementing a pilot scheme to allow dogs to enter the food premises of such shopping malls, so as to provide actual experience and data for the purposes of reviewing the existing legislation and considering the relaxation of the restriction on the entry of dogs into food premises; if so, of the details; if not, the reasons for that;
(4) as it is learnt that operators of some public transport services may decide at their discretion whether to allow passengers to board with pets, whether the Government will consider further relaxing the restriction to allow passengers to bring along their pets to use all public transport services, and formulating standard guidelines;
(5) of the number of cases received by the Government in each of the past three years involving the fatal poisoning of dogs; among such cases, (i) the number of cases in which the suspects were successfully arrested, (ii) the penalties imposed on the convicted persons, and (iii) the number of cases involving public facilities under the Leisure and Cultural Services Department; how the authorities will follow up cases of fatal poisoning of dogs, including whether they will consider installing cameras at the relevant locations to step up monitoring; and
(6) as it has been reported that many cases of fatal poisoning of dogs are suspected of involving the use of pesticides such as rodenticides, whether the Government will consider amending the legislation to require members of the public to register their real names with the Government when purchasing pesticides, so as to prevent pesticides from being abused to poison and kill animals?
Reply:
President,
Having consulted the Security Bureau, the Transport and Logistics Bureau and the Leisure and Cultural Services Department (LCSD), the reply to the question from the Hon Stanley Li is as follows:
(1) According to the most recent Thematic Household Survey on the household keeping of dogs and cats conducted by the Census and Statistics Department in 2018, some 241 900 households in Hong Kong were keeping cats or dogs, representing 9.4 per cent of all households. A total of some 184 100 cats and 221 100 dogs were being kept.
Under the Rabies Regulation (Cap. 421A), the keeper of a dog shall arrange his dog over the age of five months to be implanted with microchip and licensed. As at 2024, the number of dogs implanted with microchip and licensed was 158 663.
Since the transmission of rabies through cats is relatively lower than that through dogs, the legislation does not require that cats shall be implanted with a microchip and licensed. To facilitate identification of owners and assist owners to find their cats that have gone astray, since April 2024, the Agriculture, Fisheries and Conservation Department (AFCD) has stipulated the Licence Conditions that cats put up for sale by animal traders should be obtained from approved sources and microchipped. The AFCD does not maintain the number of cats implanted with microchip.
(2) The AFCD continues to promote the messages on animal welfare and responsible pet ownership through public education and publicity programmes, which include producing television promotional videos, establishing a thematic website on animal welfare and “Be a Responsible Pet Owner”, organising seminars in schools and residential estates, roving exhibitions, dog training courses, and pet adoption days, etc. The Department has also launched a series of “Duty of Care” publicity programmes, which include the production of a series of posts on social media platforms to share information on how to take proper care of animals and enhance the public’s understanding of the content and importance of “Duty of Care”. The AFCD includes questionnaires in some of its activities to evaluate their effectiveness, and the majority of participants have provided positive feedback. The Pet Adoption Day held in 2024 attracted over 10 000 attendees, demonstrating that the event was well received by the public.
To enlist wider public support and participation in fighting against cruelty to animals, the Hong Kong Police Force (HKPF) has implemented the Animal Watchers Programme (the Programme) since 2021 with a view to agglomerating the strengths of animal lovers at the community level in four directions of education, publicity, intelligence-gathering and investigation, raising public awareness on prevention of cruelty to animals, encouraging the public to report in a timely manner as well as providing information and clues useful for investigations. The Programme covers large-scale activities across Hong Kong for different communities and age groups, through the “Animal CARE Corners”, encouraging schools to keep animals and enhance students’ pet care skills. The Police adopts a multifaceted approach in evaluating its effectiveness by a variety of indicators, including the numbers of cases reported and persons arrested as well as the level of overall public engagement. At present, most of the cases of cruelty to animals are reported by members of the public who voluntarily offer information for investigation. This shows that the Programme has a significant impact on enhancing police-community co-operation and raising public awareness of combatting cruelty to animals.
(3) Society is divided on whether to allow pet dogs to enter food premises. The Government needs to take into account different factors when examining the relevant legislation, including public health, operating environment of food premises, and social acceptance. In particular, food premises in Hong Kong are generally cramped. It is necessary to consider the reaction of pet dogs in a crowded and cramped environment (possibly with different types of dogs), as well as the potential impact on other diners. The Environment and Ecology Bureau, together with the Food and Environmental Hygiene Department, is conducting research on practices and experiences in other places, and will carefully consider whether there is room for relaxing the relevant restrictions.
(4) Generally speaking, public transport has high daily patronage and limited compartment spaces. When considering whether to allow passengers to travel with pets for public transport services, the operators shall consider and balance different factors, including the actual operating situation, space and carrying capacity of the compartments, reaction of the pets in the travelling environment, as well as the potential impact on other passengers. The actual circumstances of different public transport modes vary. The Government will maintain close communication with the public transport operators and remind them to listen to different views to ensure that their services can properly cater for and balance the needs of different passengers. Currently, some public transport operators, such as ferries and taxis, may decide at their discretion whether to allow passengers to board with pets. The MTR Corporation Limited will also implement a pilot scheme that allows passengers to bring along their pet cats and dogs to take the light rail in accordance with specific requirements and at specific periods.
(5) Poisoning an animal causing unnecessary suffering is an offence under the Prevention of Cruelty to Animals Ordinance (Cap. 169). From 2022 to 2024, the number of reports on suspected cruelty to animals received by the HKPF and the AFCD, the number of persons arrested, and the relevant penalties imposed are tabulated at Annex. The Government does not maintain relevant breakdown of information on animal poisoning cases.
The Police will continue to review locations across 18 districts with higher crime rate and greater pedestrian flow, and proportionally install CCTV in these areas with a view to combating crime. Moreover, the LCSD will review and adjust the number of CCTV cameras having regard to established guidelines and the actual security and operational needs of individual venue. In the event of suspected criminal activities, the LCSD will contact the Police and take appropriate follow-up actions in light of the actual circumstances.
(6) Currently, the Pesticides Regulations (Cap. 133A) requires that all pesticide products must carry clear labels in both Chinese and English before being supplied or sold by licensed dealers. Any person using registered pesticides should thoroughly read and follow the instructions at the labels, and take all safety measures to protect the safety of the user and the public.
To enhance public understanding of the safe use of pesticides, the AFCD has distributed and uploaded relevant leaflets and guidelines for the reference of the trades and the public, and has actively disseminated messages of proper use of pesticides through various ongoing education and publicity programmes, including reminding members of the public that they should exercise caution in the purchase and use of pesticides and follow the relevant safety guidelines, so as to minimise the potential risks to human health, animal welfare and the environment. Considering that real-name registration for the purchase of pesticides would cause inconvenience to members of the public in their daily purchases of these products, and that it is difficult for law enforcement officers to identify persons with the intention to poison animals through registration records of the purchasers, the introduction of a real-name registration scheme would not be particularly effective for the prevention of animal poisoning. Issued at HKT 14:35
Over 1.3 Crore Persons Insured through GeM in FY 2024-25 GeM facilitates hiring of 1 million people in FY 2024-25
Posted On: 16 APR 2025 10:53AM by PIB Delhi
Government e Marketplace (GeM), India’s largest e-marketplace for public procurement, sets yet another milestone in services delivery in the FY 24-25. Apart from facilitating hiring of 1 million manpower resources in FY 24-25, GeM has successfully facilitated insurance of more than 1.3 crore individuals covering Health, Life and Personal Accident Insurance policies.
The Insurance Services category was introduced on GeM in January 2022 to bring greater efficiency, transparency and cost-effectiveness in procuring insurance policies. By ensuring that only Insurance Regulatory and Development Authority of India (IRDAI) -approved service providers are onboarded. GeM has established a reliable and trusted mechanism for availing insurance services. Through this platform, buyer organizations can seamlessly procure Group Mediclaim, Personal Accident and Term Insurance policies, thereby offering financial security to a vast number of beneficiaries.
While commenting on this milestone, CEO-GeM Shri Ajay Bhadoo said, “GeM remains committed to continuously enhancing its platform to provide seamless, secure and cost-effective procurement solutions. The milestone of 1.3 crore insured persons reflects the growing confidence of government organizations in leveraging GeM for their insurance needs, reaffirming its role as a transformative force in public procurement.”
A key advantage of GeM’s insurance services is that it facilitates direct transactions between government buyers and insurance providers without intermediaries. This streamlined approach has significantly expedited the process while also reducing insurance premiums thereby ensuring cost savings for government organisations.
Beyond Life and Health insurance, the platform has expanded its insurance offerings to include a comprehensive range of insurance services such as Asset Insurance, Transit and Marine Insurance, Liability Insurance, Livestock Insurance, Motor Insurance, Crop Insurance and Cyber Insurance. Such broad spectrum of services ensures that various insurance needs are met through a single, transparent and efficient platform to enhance accessibility and cost-effectiveness in availing Insurance services by Government Buyers.
KEYNOTE ADDRESS by the Prime Minister Hon. Fiame Naomi Mata’afa [Thursday 3rd April 2025]
Reverend Puletua Tapumanaia,
Members of Cabinet,
Representatives of our Development Partners,
Chairpersons and members of Executive Boards of Government Public Bodies, and of Agriculture in Samoa,
Heads of Government Agencies, Private Sector and Exporters, Partners of the Samoa Export Authority,
Ladies and Gentlemen.
I am pleased to be here to witness the official Opening of the Office of the Samoa Export Authority and to celebrate the launch of its Corporate Plan for the first 5 years of its establishment, from the Financial Year 2025/2026 to 2029/2030.
The establishment of the Samoa Export Authority has been long in the making. An interim Board was established in February 2024 to guide the establishment phase, including consultations across the country and with communities and all stakeholders in developing the policies that underpin the establishment of the Authority and a legislation to legislate and govern its operations.
The Samoa Export Authority Bill 2024 was tabled and passed in Parliament during its sitting in August 2024, and the SEA Act 2024 came into force on 22nd August 2024 when it was signed by the Head of State. The SEA Act 2024, established the Samoa Export Authority as a Body Corporate under the Public Bodies (Performance and Accountability) Act 2001.
As well as opening the new Office, we are also this morning, launching the Corporate Plan for the Authority for the period of 2025/2026 Financial Year to the 2029/2030 Financial Year. The 5-year duration of the Corporate Plan was agreed upon by the SEA Interim Board, to align with a Cabinet decision for the Authority to be established as a Public Beneficial Body in its first 5 years, after which a review should be carried out to consider it becoming a Public Trading Body. Thus the Corporate Plan we are launching today, was developed with a view towards this review mandated by Cabinet to be carried out in August 2029, 5 years after the SEA Act 2024 came into force.
But why the need for an Export Authority? Right now, Samoa spends around $1 billion tala on imported goods. Only around 10% of that amount is earned from goods we export. It is a trade imbalance that is strangling our development and a situation we urgently need to address.
The SEA Act 2024 and the SEA Corporate Plan we are launching this morning, lays out the objectives and functions of the Authority, to address the trade imbalance mentioned-above, through effectively promoting exports or export products from Samoa.
The Objectives of the Authority are:
1. To address policy and legislative requirements to enable exports development and market access;
2. To boost exports through supporting production and productivity, development of export products, and access to export services along value-chains, in partnerships with producers, manufacturers and business operators; and,
3. To establish export markets, and strengthen capacity in standards for market access.
In performing its functions, the Authority will liaise and cooperate with other relevant organizations of the Government, such as MCIL, MFAT, MAF and SROS; private sector and civil society, to ensure that strategic planning and arrangements are in place to deal with exports from Samoa.
In addition, the Authority is to:
a) facilitate and coordinate export development;
b) facilitate and coordinate an enabling environment for the revival and growth of the export sector;
c) find new markets for Samoa’s export sector;
d) promote and facilitate compliance with market requirements; and,
e) facilitate and coordinate the availability of needed capacity building for exporters and other parties of the export value chain.
Before I conclude, I would like to acknowledge the great work by the SEA Interim Board, and the support of MPE as its Secretariat, during the establishment phase of the Authority. The leadership of the Interim Board allowed for a wide consultations process in the development of a SEA legislation, and your guidance facilitated the smooth passing of the SEA legislation through Parliament. It was an achievement to be applauded, when the SEA Act 2024 came into force on 22nd August 2024. Working closely with the new CEO, you also managed to develop a Corporate Plan to guide the work of the Authority in its first 5 years of existence. The SEA Interim Board, ladies and gentlemen comprised of:
Afioga Tagaloa Eddie Wilson, the Chairperson;
Afioga Fa’amausili Dr Matagialofi Lua’iufi;
Afioga Tuisa Tasi Patea;
And two ex-officios: Afioga Saoleititi Maeva Betham-Vaai, and Pouli Dr Keneti Faulalo.
I believe the achievements of the SEA Interim Board has set a solid foundation upon which the new SEA Board, established under the provisions of the SEA Act 2024, will guide the work of the Authority moving forward.
On that note, it is with pleasure that I welcome the members of the new SEA Board that has been approved by Cabinet:
Afioga Tuia’opo Andrew Aliki, Chairman;
Afioga Tuimaseve Kuinimeri Asora-Finau;
Afioga Peseta Peter Tone;
Afioga Tagaloa Eddide Wilson; and,
Afioga Vaai Kolone Vaai.
We wish you all the best in guiding the journey of the Authority. I am confident that with strong leadership and strategic guidance, and with the commitment and drive of the SEA staff, the Authority will be effective in meeting its objectives in leading, facilitating and coordinating export development and export of products from Samoa.
I am now pleased to announce the official opening of the new Samoa Export Authority, as well as the official launch of their Corporate Plan for the first 5 years of its establishment.
May God bless the Authority in its journey and May God Bless Samoa.
Soifua ma ia Manuia!
TATALA ALOAIA LE OFISA FOU O LE PULEGA O OLOA AUINA ATU I FAFO A SAMOA MA LANA FUAFUAGA AUTASI ALUALU MAMAO
SAUNOAGA AUTU a le Afioga i le Palemia, Hon. Fiame Naomi Mata’afa [Aso Tofi 3 Aperila 2025]
Susu lau Susuga i le Ta’ita’i o le Sauniga, lau Susuga Puletua Tapumanaia, Fa’afeagaiga o le Ekalesia EFKS, Penieli Fou, Falelauniu,
Afifio Minisita o le Kapeneta,
Sui o tatou Paaga tau Atina’e,
Afifio Ta’ita’ifono o Komiti Fa’atonu ma Sui o Komiti Fa’afoe o Fa’alapotopotoga a le Malo,
Afifio Sui o Komiti Faufautua o Fa’atoaga ma Faigafaiva,
Afifio Fa’auluuluga o Matagaluega ma Fa’alapotopotoga Tumaoti a le Malo,
Aufai Pisinisi Gaosi Oloa Auina atu i Fafo,
Sui o Paaga a le Pulega o Oloa Auina atu i Fafo a Samoa,
Le paia ma le mamalu o Samoa ua potopoto,
E talitonu o lea ua mapu i le tuasivi le faiva o manusina. Ua mae’a fo’i ona utu le uila o matagi auā le fa’amua ma le fa’asani i le Atua ma Lona agalelei. Ua utūialā le sasaga i le ūtugāvai a tausala, ma ua fa’atofolia i tatou i le malilie o sua o vai, auā manū fa’aifo mai le Tapa’au Silisili’ese i le Lagi.
Ou te manatu fo’i ua mae’a paelago pa’ia o Samoa ua potopoto e le Fofoga o le aso, o le a le toe o’o i ai se tala.
Ae e ia te a’u le mitamitaga tele i lenei taeao, ua tatou auai fa’atasi e molimauina le tatalaina aloa’ia o le Ofisa fou o le Pulega o Oloa Auina Atu i Fafo a Samoa. Ua le o po malaē i le tatou fa’atasiga, o le Pulega ua faitau tausaga ona fuafua ma fa’atalatalanoa, ma ua leva fo’i ona fai galuega mo lona tau fa’atūina, e aofia ai le faufauina o ana Faiga Fa’avae, ma sana Tulafono Autū.
Pei ona silafia, o le Tulafono o le Pulega o Oloa Auina Atu i Fafo a Samoa 2024, sa pasia lea e le Palemene i lana fonotaga i le masina o Aukuso 2024, ma sa sainia ai e lana Afioga i le Ao Mamalu o le Malō, i le Aso 22 Aukuso, 2024. O lea Tulafono, ua fa’atuina ai le Pulega, o se Fa’alapotopotoga ua Tu’ufa’atasia Fa’aletulafono (Body Corporate).
E le gata i le tatala aloa’iaina o le Ofisa fou, ae o le taeao nei, o le a fa’apea fo’i ona tatou amana’iaina ai le Fuafuaga Autasi Alualu Mamao a le Pulega (Corporate Plan) mo lona ulua’i 5 tausaga o lona fa’atūina, mai le tausaga fa’aletupe 2025/2026 se’ia o’o i le 2029/2030. O le avea o le 5 tausaga e fa’atulaga ai le Fuafuaga Autasi Alualu Mamao, ina ia o gatasi ma le fa’avae fa’ata’oto a le Malō, mo le Pulega e avea ma Public Beneficial Body i le 5 tausaga muamua mai lona fa’atuina, ona toe iloilo lea pe agava’a ona liliu e avea ma Public Trading Body.
E pei ona lau silafia, o le fa’avae autū sa a’e ai le tofā mo le fa’atuina o le Pulega, o le tau fo’ia lea o le fa’afitauli tugā, i le ova mamao o le tele o oloa fa’aulufale mai i Samoa, pe a fa’atusatusa i oloa auina atu i fafo. I le taimi nei, e tusa ma le $1 piliona Tala tupe fa’aalu a Samoa i oloa fa’aulufale mai, ae na o le 10% o lea aofa’iga, e maua mai lea i ana oloa auina atu i fafo. O se tulaga lē paleni tele lea i fefa’atauaiga o oloa, ua fa’ama’ia ai le atina’e o le tatou atunu’u, ma o se tulaga e tatau ona vave fo’ia.
O le Tulafono o le Pulega o Oloa Auina Atu i Fafo a Samoa 2024, fa’apea le Fuafuaga Autasi Alualu Mamao ua tatou patipatia i le taeao nei, o lo’o fa’ata’atitia, ma aiaia ai matafaioi tau’ave, fa’apea galuega poutū a le Pulega.
O sini ma galuega autū o le Pulega, e aofia ai le fesoasoani malosi i le fa’amaopo’opoina ma le fa’afaigofieina o le auina atu i fafo o a tatou oloa, e ala i faiga fa’apa’aga ma isi fa’alapotopotoga ‘ese’ese a le Malo ua tutusa malosi’aga, e pei o le Matagalujega o Pisinisi, Alamanuia ma Leipa (MCIL) ma le Matagaluega o le Va i Fafo ma Fefa’ataua’iga (MFAT), aemaise vaega tuma’oti e i ai le Au faifa’ato’aga ma au’aunaga e mafai ona auina atu i fafo. E aofia ai fo’i le fesoasoani malosi mo alamanuia mo le aufai fa’ato’aga lima vaivai ma alalafaga o lo o gāfātia i le galuea’ina o latou fanua ma ‘ele’ele fa’aleaganu’u, e ala lea i galuega fuafuaina a le Pulega.
O galuega tau’ave autu a le Pulega, e aofia ai le fa’ateleina o fua faifa’ato’aga e fuafua mo ‘oloa, pe o le gaosia o ‘oloa e ‘auina atu i fafo, e ala lea i le fesoasoani e sui faiga faifa’ato’aga, mai i le na o le gaosia mo taumafa fa’ale’āiga (subsistence), ae faifa’ato’aga e gaosia taumafa fa’apea le faifa’apisinisi (commercialization).
E le gata i lea, o galuega tau’ave autū a le Pulega, e aofia ai fo’i le fa’amaopo’opo ma fa’afeso’ota’iga o le ‘au faifa’ato’aga, le ‘au fa’atau’oloa, ma i latou uma o lo o faia au’aunaga mo le atina’eina o oloa auina atu i fafo, aemaise o le fa’amautinoaina o lo’o iai se si’osi’omaga talafeagai mo le auina atu i fafo o a tatou oloa. O le Pulega fo’i e na te una’ia malosi le fa’alauiloaina o a tatou oloa e auina pe fefa’ataua’i atu i fafo.
I lona aotelega, o le Pulega ua fa’atuina ina ia mafai ai ona fa’afaigofie ma fa’amaopo’opo le auina atu i fafo o ‘oloa ma au’aunaga mai Samoa. O le fa’amoemoe autū, ia mafai lea ona tele ‘oloa ma au’aunaga auina atu i fafo, ina ia manuia ai o tatou tagata, o le toatele o i latou o faifa’ato’aga mai nu’u i tua.
A o le’i fa’amutaina la’u tautalaga, ou te avatu le fa’amalō tele i le Komiti Fa’atonu Le Tumau a le Pulega, o i latou ia sa latou ta’imua i le tu’ufa’atasiga o le Tulafono mo le Pulega, ma sa ta’ita’iina fo’i galuega fai mo le fa’atuina o le Pulega, e aofia ai le fa’afouina o le Ofisa, ma sa galulue fa’atasi ma le Pule Sili, i le tu’ufa’atasia o le Fuafuaga Autasi Alualu Mamao ‘ua tatou patipatia i le taeao nei.
E fa’apea fo’i ‘ona momoli le fa’afetai tele i le Matagaluega o Fa’alapotopotoga a le Malō (MPE), sa ‘avea ma failautusi (Secretariat) a le Komiti Fa’atonu Le Tumau, i le 12 masina o le latou galuega. Fa’afetai i le Komiti Le Tumau, ‘ua ma’ea la outou galuega sa tofia ai ‘outou e le Kapeneta, fa’amalo le fai o le faiva:
I lau Afioga i le Ta’ita’ifono o le Komiti le Tumau, lau Afioga Tagaloa Eddie Wilson;
Lau Afioga Fa’amausili Dr Matagialofi Lua’iufi;
Lau Afioga Tuisa Tasi Patea;
Fa’apea sui ex-officios: Afioga Saoleititi Maeva Betham-Vaai, ma le Afioga ia Pouli Dr Keneti Faulalo.
Talitonu ‘ua ‘outou fausia se paepae maumaututū e fai ma fa’avae malosi e fa’atino ai galuega fai a le Pulega i le ta’ita’iga a le Komiti Fa’atonu fou ua fa’atuina i lalo o le Tulafono.
Ia atonu o se avanoa lelei lenei e fa’atalofa atu ai i tou Afioga i le ulua’i Komiti Fa’atonu a le Pulega, ua fa’atuina i lalo o le Tulafono.
Fa’atalofa atu:
Lau Afioga Tuia’opo Andrew Aliki, o le Ta’ita’ifono lea o le Komiti Fa’atonu;
Afioga Tuimaseve Kuinimeri Asora-Finau;
Afioga Peseta Peter Tone;
Afioga Tagaloa Eddide Wilson; ma le
Afioga Vaai Kolone Vaai
O outou māmā na. O la outou ta’ita’iga ma le galulue faʻatasi ma le Ofisa Sili ma le aufaigaluega a le Pulega, o le a mautinoa ai le ‘ausia o sini autu ma matafaioi fa’atino a le Pulega, e pei ona fa’atulagaina i le Fuafuaga Autasi Alualu Mamao mo le Tausaga Fa’aletupe 2025/2026 – 2029/2030. Ia, fa’amanuia tele le Atua i le Pulega ma le amatalia o lana folauga, ma ia fai sona ‘ai mo se manuia o tatou tagata lautele.
Ou te fiafia lava e fa’asilasila atu, ua tatala aloaia nei le Ofisa fou mo le Pulega o Oloa Auina atu i Fafo a Samoa (Samoa Export Authority), fa’apea le Fa’alauiloaina aloaia o le latou Fuafuaga Autasi Alualu Mamao (Corporate Plan) mo le ulua’i 5 tausaga o lona fa’atuina.
Soifua ma ia Manuia.
Ata Pueina – Malo o Samoa (Asuisui V. Matafeo)
TATALA ALOAIA LE OFISA FOU O LE PULEGA O OLOA AUINA ATU I FAFO A SAMOA MA LANA FUAFUAGA AUTASI ALUALU MAMAO
SAUNOAGA AUTU a le Afioga i le Palemia, Hon. Fiame Naomi Mata’afa [Aso Tofi 3 Aperila 2025]
Susu lau Susuga i le Ta’ita’i o le Sauniga, lau Susuga Puletua Tapumanaia, Fa’afeagaiga o le Ekalesia EFKS, Penieli Fou, Falelauniu,
Afifio Minisita o le Kapeneta,
Sui o tatou Paaga tau Atina’e,
Afifio Ta’ita’ifono o Komiti Fa’atonu ma Sui o Komiti Fa’afoe o Fa’alapotopotoga a le Malo,
Afifio Sui o Komiti Faufautua o Fa’atoaga ma Faigafaiva,
Afifio Fa’auluuluga o Matagaluega ma Fa’alapotopotoga Tumaoti a le Malo,
Aufai Pisinisi Gaosi Oloa Auina atu i Fafo,
Sui o Paaga a le Pulega o Oloa Auina atu i Fafo a Samoa,
Le paia ma le mamalu o Samoa ua potopoto,
E talitonu o lea ua mapu i le tuasivi le faiva o manusina. Ua mae’a fo’i ona utu le uila o matagi auā le fa’amua ma le fa’asani i le Atua ma Lona agalelei. Ua utūialā le sasaga i le ūtugāvai a tausala, ma ua fa’atofolia i tatou i le malilie o sua o vai, auā manū fa’aifo mai le Tapa’au Silisili’ese i le Lagi.
Ou te manatu fo’i ua mae’a paelago pa’ia o Samoa ua potopoto e le Fofoga o le aso, o le a le toe o’o i ai se tala.
Ae e ia te a’u le mitamitaga tele i lenei taeao, ua tatou auai fa’atasi e molimauina le tatalaina aloa’ia o le Ofisa fou o le Pulega o Oloa Auina Atu i Fafo a Samoa. Ua le o po malaē i le tatou fa’atasiga, o le Pulega ua faitau tausaga ona fuafua ma fa’atalatalanoa, ma ua leva fo’i ona fai galuega mo lona tau fa’atūina, e aofia ai le faufauina o ana Faiga Fa’avae, ma sana Tulafono Autū.
Pei ona silafia, o le Tulafono o le Pulega o Oloa Auina Atu i Fafo a Samoa 2024, sa pasia lea e le Palemene i lana fonotaga i le masina o Aukuso 2024, ma sa sainia ai e lana Afioga i le Ao Mamalu o le Malō, i le Aso 22 Aukuso, 2024. O lea Tulafono, ua fa’atuina ai le Pulega, o se Fa’alapotopotoga ua Tu’ufa’atasia Fa’aletulafono (Body Corporate).
E le gata i le tatala aloa’iaina o le Ofisa fou, ae o le taeao nei, o le a fa’apea fo’i ona tatou amana’iaina ai le Fuafuaga Autasi Alualu Mamao a le Pulega (Corporate Plan) mo lona ulua’i 5 tausaga o lona fa’atūina, mai le tausaga fa’aletupe 2025/2026 se’ia o’o i le 2029/2030. O le avea o le 5 tausaga e fa’atulaga ai le Fuafuaga Autasi Alualu Mamao, ina ia o gatasi ma le fa’avae fa’ata’oto a le Malō, mo le Pulega e avea ma Public Beneficial Body i le 5 tausaga muamua mai lona fa’atuina, ona toe iloilo lea pe agava’a ona liliu e avea ma Public Trading Body.
E pei ona lau silafia, o le fa’avae autū sa a’e ai le tofā mo le fa’atuina o le Pulega, o le tau fo’ia lea o le fa’afitauli tugā, i le ova mamao o le tele o oloa fa’aulufale mai i Samoa, pe a fa’atusatusa i oloa auina atu i fafo. I le taimi nei, e tusa ma le $1 piliona Tala tupe fa’aalu a Samoa i oloa fa’aulufale mai, ae na o le 10% o lea aofa’iga, e maua mai lea i ana oloa auina atu i fafo. O se tulaga lē paleni tele lea i fefa’atauaiga o oloa, ua fa’ama’ia ai le atina’e o le tatou atunu’u, ma o se tulaga e tatau ona vave fo’ia.
O le Tulafono o le Pulega o Oloa Auina Atu i Fafo a Samoa 2024, fa’apea le Fuafuaga Autasi Alualu Mamao ua tatou patipatia i le taeao nei, o lo’o fa’ata’atitia, ma aiaia ai matafaioi tau’ave, fa’apea galuega poutū a le Pulega.
O sini ma galuega autū o le Pulega, e aofia ai le fesoasoani malosi i le fa’amaopo’opoina ma le fa’afaigofieina o le auina atu i fafo o a tatou oloa, e ala i faiga fa’apa’aga ma isi fa’alapotopotoga ‘ese’ese a le Malo ua tutusa malosi’aga, e pei o le Matagalujega o Pisinisi, Alamanuia ma Leipa (MCIL) ma le Matagaluega o le Va i Fafo ma Fefa’ataua’iga (MFAT), aemaise vaega tuma’oti e i ai le Au faifa’ato’aga ma au’aunaga e mafai ona auina atu i fafo. E aofia ai fo’i le fesoasoani malosi mo alamanuia mo le aufai fa’ato’aga lima vaivai ma alalafaga o lo o gāfātia i le galuea’ina o latou fanua ma ‘ele’ele fa’aleaganu’u, e ala lea i galuega fuafuaina a le Pulega.
O galuega tau’ave autu a le Pulega, e aofia ai le fa’ateleina o fua faifa’ato’aga e fuafua mo ‘oloa, pe o le gaosia o ‘oloa e ‘auina atu i fafo, e ala lea i le fesoasoani e sui faiga faifa’ato’aga, mai i le na o le gaosia mo taumafa fa’ale’āiga (subsistence), ae faifa’ato’aga e gaosia taumafa fa’apea le faifa’apisinisi (commercialization).
E le gata i lea, o galuega tau’ave autū a le Pulega, e aofia ai fo’i le fa’amaopo’opo ma fa’afeso’ota’iga o le ‘au faifa’ato’aga, le ‘au fa’atau’oloa, ma i latou uma o lo o faia au’aunaga mo le atina’eina o oloa auina atu i fafo, aemaise o le fa’amautinoaina o lo’o iai se si’osi’omaga talafeagai mo le auina atu i fafo o a tatou oloa. O le Pulega fo’i e na te una’ia malosi le fa’alauiloaina o a tatou oloa e auina pe fefa’ataua’i atu i fafo.
I lona aotelega, o le Pulega ua fa’atuina ina ia mafai ai ona fa’afaigofie ma fa’amaopo’opo le auina atu i fafo o ‘oloa ma au’aunaga mai Samoa. O le fa’amoemoe autū, ia mafai lea ona tele ‘oloa ma au’aunaga auina atu i fafo, ina ia manuia ai o tatou tagata, o le toatele o i latou o faifa’ato’aga mai nu’u i tua.
A o le’i fa’amutaina la’u tautalaga, ou te avatu le fa’amalō tele i le Komiti Fa’atonu Le Tumau a le Pulega, o i latou ia sa latou ta’imua i le tu’ufa’atasiga o le Tulafono mo le Pulega, ma sa ta’ita’iina fo’i galuega fai mo le fa’atuina o le Pulega, e aofia ai le fa’afouina o le Ofisa, ma sa galulue fa’atasi ma le Pule Sili, i le tu’ufa’atasia o le Fuafuaga Autasi Alualu Mamao ‘ua tatou patipatia i le taeao nei.
E fa’apea fo’i ‘ona momoli le fa’afetai tele i le Matagaluega o Fa’alapotopotoga a le Malō (MPE), sa ‘avea ma failautusi (Secretariat) a le Komiti Fa’atonu Le Tumau, i le 12 masina o le latou galuega. Fa’afetai i le Komiti Le Tumau, ‘ua ma’ea la outou galuega sa tofia ai ‘outou e le Kapeneta, fa’amalo le fai o le faiva:
I lau Afioga i le Ta’ita’ifono o le Komiti le Tumau, lau Afioga Tagaloa Eddie Wilson;
Lau Afioga Fa’amausili Dr Matagialofi Lua’iufi;
Lau Afioga Tuisa Tasi Patea;
Fa’apea sui ex-officios: Afioga Saoleititi Maeva Betham-Vaai, ma le Afioga ia Pouli Dr Keneti Faulalo.
Talitonu ‘ua ‘outou fausia se paepae maumaututū e fai ma fa’avae malosi e fa’atino ai galuega fai a le Pulega i le ta’ita’iga a le Komiti Fa’atonu fou ua fa’atuina i lalo o le Tulafono.
Ia atonu o se avanoa lelei lenei e fa’atalofa atu ai i tou Afioga i le ulua’i Komiti Fa’atonu a le Pulega, ua fa’atuina i lalo o le Tulafono.
Fa’atalofa atu:
Lau Afioga Tuia’opo Andrew Aliki, o le Ta’ita’ifono lea o le Komiti Fa’atonu;
Afioga Tuimaseve Kuinimeri Asora-Finau;
Afioga Peseta Peter Tone;
Afioga Tagaloa Eddide Wilson; ma le
Afioga Vaai Kolone Vaai
O outou māmā na. O la outou ta’ita’iga ma le galulue faʻatasi ma le Ofisa Sili ma le aufaigaluega a le Pulega, o le a mautinoa ai le ‘ausia o sini autu ma matafaioi fa’atino a le Pulega, e pei ona fa’atulagaina i le Fuafuaga Autasi Alualu Mamao mo le Tausaga Fa’aletupe 2025/2026 – 2029/2030. Ia, fa’amanuia tele le Atua i le Pulega ma le amatalia o lana folauga, ma ia fai sona ‘ai mo se manuia o tatou tagata lautele.
Ou te fiafia lava e fa’asilasila atu, ua tatala aloaia nei le Ofisa fou mo le Pulega o Oloa Auina atu i Fafo a Samoa (Samoa Export Authority), fa’apea le Fa’alauiloaina aloaia o le latou Fuafuaga Autasi Alualu Mamao (Corporate Plan) mo le ulua’i 5 tausaga o lona fa’atuina.
Coconut Rhinoceros Beetle Treatments Continues in Kona
Posted on Apr 15, 2025 in Main
April 15, 2025 NR25-08
HONOLULU – The Hawai‘i Department of Agriculture (HDOA), with the assistance of the County of Hawai‘i Public Works Department, have been working collaboratively since January 2025 to combat the coconut rhinoceros beetle (CRB) after detections in the Kona area. The HDOA and Hawai‘i County crews completed the latest round of treatments on palm trees last week at Ellison Onizuka Kona International Airport in the continuing effort to protect the island from CRB infestations.
“The staff of the Department of Agriculture remains dedicated to stopping the further spread of the coconut rhinoceros beetle, with emphasis in areas that are not known to be infested,” said Sharon Hurd, chairperson of the Hawai‘i Board of Agriculture. “We truly appreciate the concern and assistance of Mayor Kimo Alameda and the county’s public works crew in providing the resources to prevent CRB from taking hold on Hawai‘i Island. We also appreciate all the various agencies and organizations that work tirelessly in the fight against invasive species.”
Mayor Alameda emphasized the importance of the state and county working collaboratively to protect the island from the invasive species. “The introduction of the coconut rhinoceros beetle is a major concern, and we are committed to doing everything we can—alongside HDOA and our other partners—to stop its spread,” he said.
In September 2024, HDOA Plant Pest Control (PPC) personnel found a single CRB in a trap during routine monitoring in Waikoloa. This was the first detection of CRB on the island since October 2023 when a Waikoloa resident found six grubs (larvae) in a decaying palm tree stump. Increased surveillance continued throughout the island and more intensely on the Kona side.
In January 2025, Mayor Alameda and the County of Hawai‘i offered their resources and assistance to HDOA, including the use of their 75-foot boom truck to treat the crowns of palm trees. On January 14, the team treated a total of 38 trees in the Waikoloa area via crown treatments and 24 trees were treated via an injection system which provides systemic protection against CRB. HDOA’s Pesticides Branch was also at the site to assist. So far, there have been no further detections of CRB in Waikoloa.
On March 3, 2025, the Big Island Invasive Species Committee (BIISC) reported one adult CRB in a detection trap along the boundary of the Ellison Onizuka Kona International Airport. A day later, two more adult CRBs were found in traps at the Natural Energy Laboratory of Hawai‘i (NELHA).
After the detections, HDOA, county crews and airport staff targeted treatments at the airport over a period of three days in March. The county provided the use of two boom trucks and the team treated 128 trees on the airport grounds and injected 12 more trees that were inaccessible to the boom trucks. So far, there have been no further detections at the airport.
Last week, on April 7 and 8, crews began work at NELHA and treated 58 trees via crown treatments with about 14 trees treated via injections due to their close proximity to water.
All palms that were treated were tagged and surrounded with yellow tape to indicate treatment. Coconuts from treated trees should not be consumed. Questions regarding pesticide use may be addressed to HDOA’s Pesticides Branch at 808-973-9402.
Surveillance for CRB continues around Hawai‘i Island by HDOA, BIISC, University of Hawai‘i, the County of Hawai‘i and the state Department of Health Vector Control Branch.
Residents on all islands are asked to be vigilant when purchasing mulch, compost and soil products, and to inspect bags for evidence of entry holes. CRB grubs breed in decomposing plant and animal waste. An adult beetle is about 2-inches long, all black and has a single horn on its head.
Residents may go to the CRB Response website at: https://www.crbhawaii.org/ to learn more about how to detect the signs of CRB damage and how to identify CRB life stages. Reports of possible CRB infestation may also be made to the state’s toll-free Pest Hotline at 808-643-PEST (7378).
# # #
CRB treatment at Ellison Onizuka Kona International Airport
CRB treatment at Kona Airport
Waikoloa tree injection treatment
Waikoloa CRB treatment using boom truck
Tagging of treated trees – do not consume coconuts
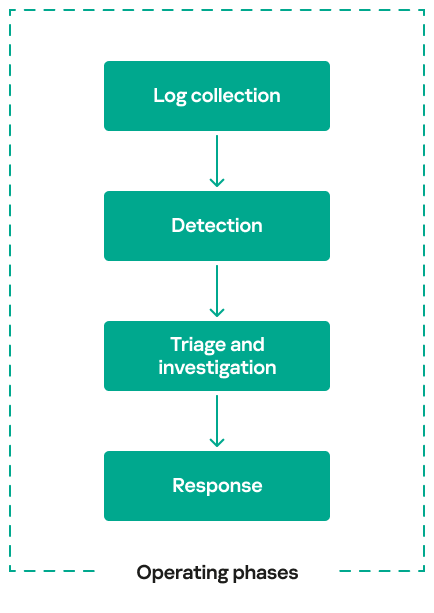
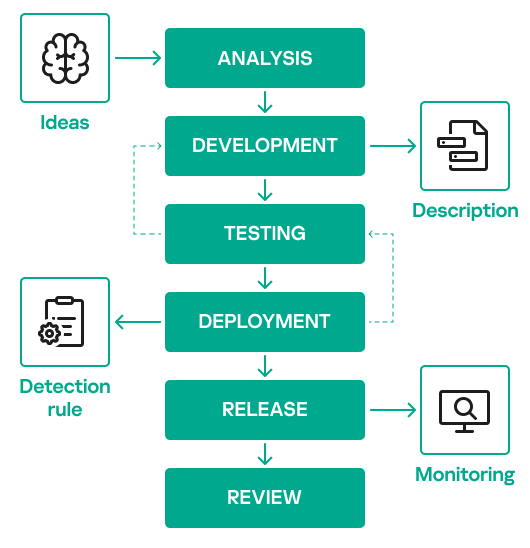
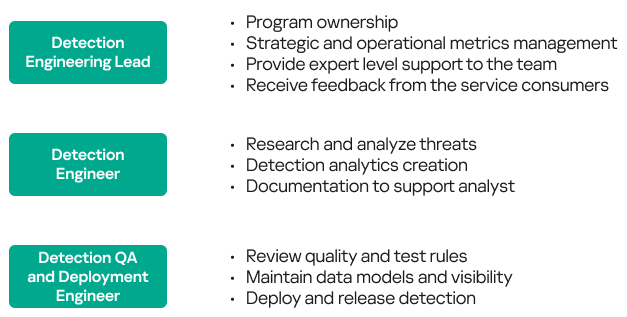
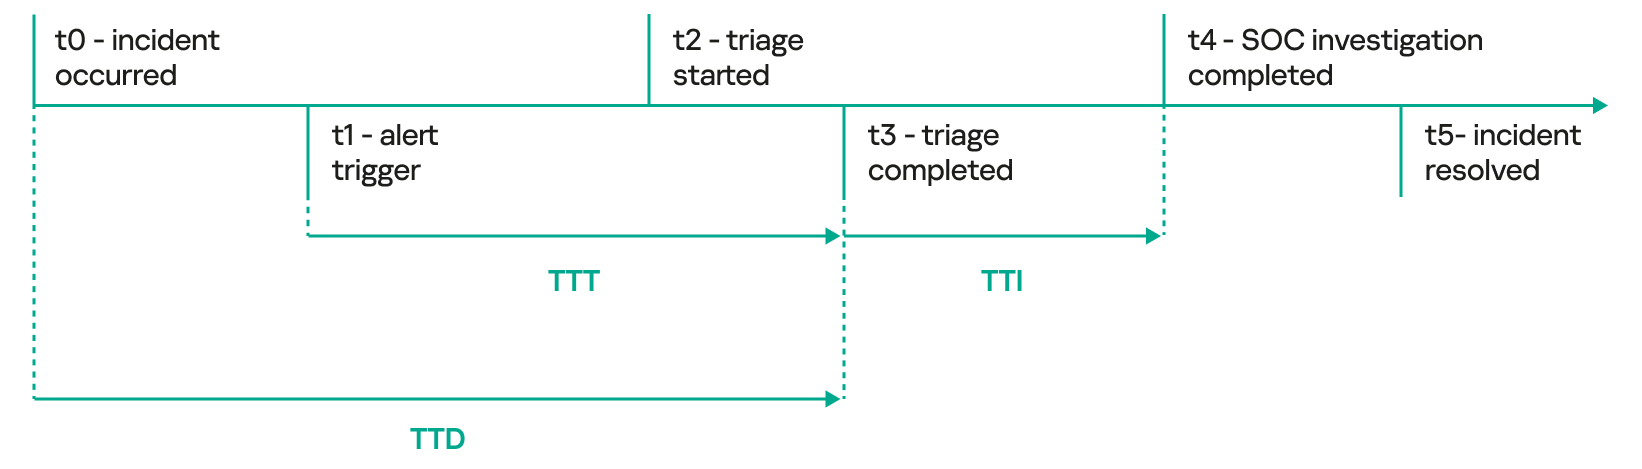
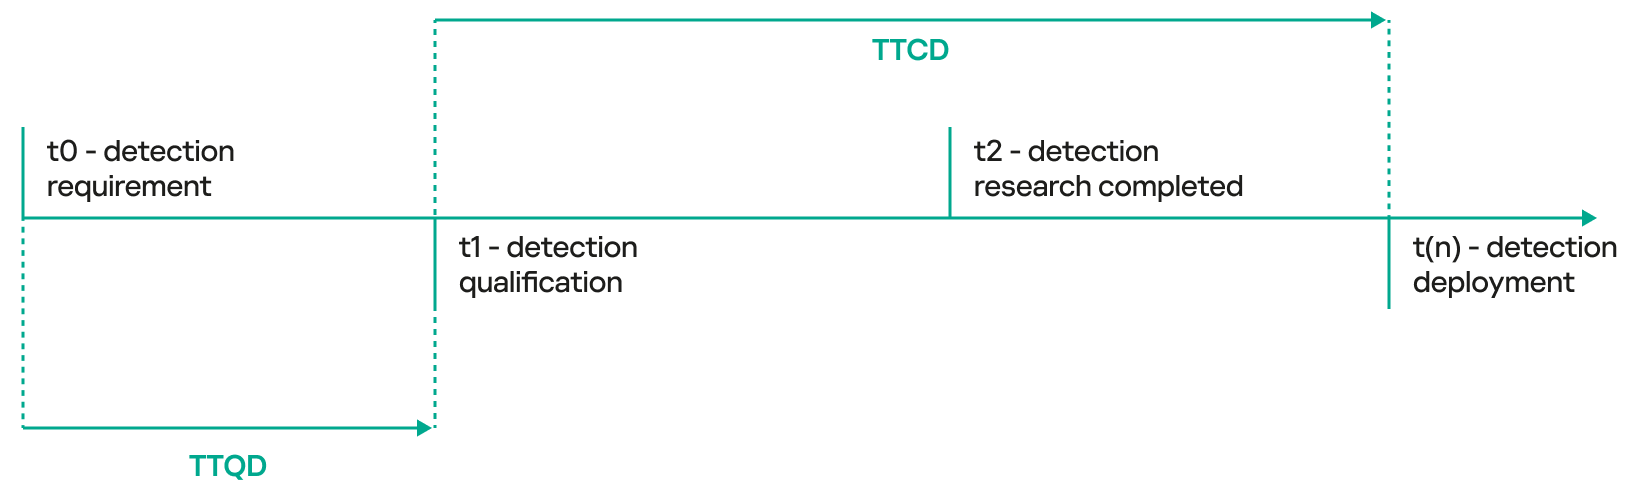