Source: GlobeNewswire (MIL-OSI)
| CONTINUED STRONG EARNINGS MOMENTUM IN 2024 |
| CASA AND CAG STATED AND UNDERLYING DATA Q4-2024 |
| |
|
|
|
|
|
| |
CRÉDIT AGRICOLE S.A. |
|
CRÉDIT AGRICOLE GROUP |
| |
|
Stated |
|
Underlying |
|
|
Stated |
|
Underlying |
| Revenues |
|
€7,092m
+17.4% Q4/Q4 |
|
€7,116m
+18.2% Q4/Q4 |
|
|
€9,817m
+11.9% Q4/Q4 |
|
€9,840m
+13.4% Q4/Q4 |
| Expenses |
|
-€3,917m
+5.6% Q4/Q4 |
|
-€3,878m
+4.4% Q4/Q4 |
|
|
-€5,863m
+3.2% Q4/Q4 |
|
-€5,824m
+2.4% Q4/Q4 |
| Gross Operating Income |
|
€3,175m
+36.2% Q4/Q4 |
|
€3,238m
+40.4% Q4/Q4 |
|
|
€3,954m
+28.0% Q4/Q4 |
|
€4,017m
+34.3% Q4/Q4 |
| Cost of risk |
|
-€594m
+35.0% Q4/Q4 |
|
-€594m
+35.0% Q4/Q4 |
|
|
-€867m
+13.9% Q4/Q4 |
|
-€867m
+13.9% Q4/Q4 |
| Net income group share |
|
€1,689m
+26.6% Q4/Q4 |
|
€1,730m
+32.8% Q4/Q4 |
|
|
€2,149m
+24.6% Q4/Q4 |
|
€2,190m
+33.7% Q4/Q4 |
| C/I ratio |
|
55.2%
-6.2 pp Q4/Q4 |
|
54.5%
-7.2 pp Q4/Q4 |
|
|
59.7%
-5.1 pp Q4/Q4 |
|
59.2%
-6.4 pp Q4/Q4 |
| ALL OF THE FINANCIAL TARGETS OF THE 2025 AMBITIONS PLAN EXCEEDED AS OF 2024
STRONG INCREASE IN QUARTERLY AND FULL-YEAR EARNINGS
- Record quarterly and full-year revenues, fuelled by the excellent performance by Asset Gathering and Large Customers
- High profitability: low cost/income ratio (increase in recurring expenses contained at +3.0% Q4/Q4) and 14.0% return on tangible equity in 2024
- Cost of risk rose in Q4-24, driven by provisions for performing loans related to model effects at Crédit Agricole CIB and Crédit Agricole Personal Finance & Mobility (CAPFM)
PROPOSED 2024 DIVIDEND INCREASE TO €1.10 PER SHARE (+5% VS. 2023)
STRONG ACTIVITY IN ALL BUSINESS LINES
- Robust growth in retail banking and consumer finance driven by multiple factors: continued upturn in the home loan business in France (up +18%), higher corporate loan production, thriving international lending business, consumer finance stability at a high level and confirmed stabilisation of the deposit mix in France
- Record CIB, asset management and insurance business, reflected in the record level in insurance revenues with contributions from all activities, high net inflows and record level of assets under management, as well as a new quarterly and full-year record reached by CIB
CAPITAL OPERATIONS AND STRATEGIC PROJECTS
- Instruments finalised to acquire an additional 5.2% in Banco BPM
- Signing of an agreement for the acquisition of Santander’s 30.5% stake in CACEIS
- Acquisition of aixigo, European leader in Wealth Tech
- Finalization of the acquisition of 50% of GAC Leasing in China by CAPFM
SOLID CAPITAL AND LIQUIDITY POSITIONS
- Crédit Agricole S.A.’s phased-in CET1 at 11.7% and Group phased-in CET1 at 17.2%
CONTINUED SUPPORT FOR THE ENERGY TRANSITION
- Phased withdrawal from fossil energies and reallocation of investments to renewable energy
- Decarbonisation pathways in line with targets (oil & gas, power and automotive)
|
At the meeting of the Board of Directors of Crédit Agricole S.A. on 4 february 2025, SAS Rue La Boétie informed the company of its intention to purchase Crédit Agricole S.A. shares on the market for a maximum amount of 500 million euros in line with the operations announced in August 2023 and in November 2022. Details of the transaction are provided in a press release issued today by SAS Rue La Boétie.
|
Dominique Lefebvre,
Chairman of SAS Rue La Boétie and Chairman of the Crédit Agricole S.A. Board of Directors
« The Group’s excellent results illustrate our overall capacity to support all our customers in a global and loyal relationship over the long term. Three-quarters of these results are retained to serve the development of the economy. I would like to thank all of our employees who work every day with professionalism and commitment. »
|
| |
|
Philippe Brassac,
Chief Executive Officer of Crédit Agricole S.A.
« Driven by its unique Group model based on utility and universality, the Crédit Agricole Group reports excellent results in 2024. Crédit Agricole S.A. has once again exceeded all the financial objectives of its strategic plan, one year ahead of schedule. »
|
|
This press release comments on the results of Crédit Agricole S.A. and those of Crédit Agricole Group, which comprises the Crédit Agricole S.A. entities and the Crédit Agricole Regional Banks, which own 62.4% of Crédit Agricole S.A. Please see the appendices to this press release for details of specific items, which are restated in the various indicators to calculate underlying income.
Crédit Agricole Group
Group activity
The Group’s commercial activity during the quarter continued at a steady pace across all business lines, with a good level of customer capture. During 2024, the Group added +1 900,000 new customers in Retail Banking and grew its customer base by +214,000 customers. More specifically, over the year, the Group gained +1 500,000 new customers for Retail Banking in France and +400,000 new International Retail Banking customers (Italy and Poland). The customer base also grew (+126,000 and +88,000 customers, respectively).
At 31 December 2024, retail banking on-balance sheet deposits totalled €837 billion, up +1.8% year-on-year in France and Italy (+0.5% for Regional Banks and LCL and +1.7% in Italy). Outstanding loans totalled €880 billion, up +0.4% year-on-year in France and Italy (+0.3% for Regional Banks and LCL and +1.7% in Italy). Home loan production picked up gradually in France during this quarter, recording an increase of +1% for the Regional Banks and +11% for LCL compared to the third quarter of 2024, and +7.8% and +59% respectively compared to the fourth quarter of 2023. Although high, home loan production by CA Italia was down -6.3% compared with an already high Q4 2023. The property and casualty insurance equipment rate1 rose to 43.9% for the Regional Banks (+0.8 percentage points compared with the third quarter of 2023), 27.9% for LCL (+0.4 percentage point) and 20.0% for CA Italia (+1.2 percentage point).
In asset management, inflows remained strong at +€20.5 billion, fuelled by strong medium/long-term assets, excluding JVs (+€17.9 billion) and at the JVs. In insurance, savings/retirement gross inflows rose to a record €8.3 billion over the quarter (+17% year-on-year), with the unit-linked rate in production staying at a high 37.4%. Net inflows were positive at +€2.4 billion, growing for both euro-denominated and unit-linked contracts. The strong performance in property and casualty insurance was driven by price changes and portfolio growth (16.7 million contracts at end-December 2024, +5.3% year-on-year). Assets under management totalled €2,867 billion, up +12.1% in the year for all three segments: asset management rose 10% over the year to €2,240 billion; life insurance was up +5.1% to €347.3 billion; and wealth management (Indosuez Wealth Management and LCL Private Banking) increased 46.9% year-on-year to €279 billion, notably with the positive impact of the consolidation of Degroof Petercam (€69 billion in assets under management consolidated in the second quarter of 2024).
Business in the SFS division was stable. At CAPFM, consumer finance outstandings increased to €119.3 billion, up +5.6% compared with the end of December 2023, buoyed by car loans, which accounted for 53%2 of total outstandings. New loan production decreased slightly, by -2.9% compared with the same period in 2023, mainly due to the Chinese market. Regarding Crédit Agricole Leasing & Factoring (CAL&F), production of lease financing outstandings was up +7.2% vs. December 2023 to 20.3%, with a particularly strong contribution from property leasing and renewable energy financing.
Large Customers again posted record results for both the quarter and the full year in Corporate and Investment Banking. Capital Markets and Investment Banking held up well with a strong performance by the repo and securitisation businesses, while Financing activities reaped the benefits of growth in commercial activities. Asset Servicing recorded a high level of assets under custody of €5,291 billion and assets under administration of €3,397 billion (+12.1% and +3%, respectively, compared with the end of December 2023), with good sales momentum and positive market effects over the quarter.
Each of the Group’s business lines posted strong activity (see Infra).
Roll-out of strategic plan
Crédit Agricole S.A.’s model offers constantly renewed potential for organic growth. This model is based on three pillars: customer acquisition, customer equipment and the development of new offers. Gross customer capture amounts to 1.9 million new customers on average since 2022, which marked the roll-out of the Horizon 2025 plan. Customer equipment is growing steadily across our various offers. The bank’s market share in household loans stood structurally at 30%3 helping to drive the market shares for our other offerings. These currently stand at 28% in asset management,3 27% in payment services,3 23% in individual death and disability insurance,4 19% in creditor insurance,4 15% in life insurance,4 7% in property and casualty insurance,4 and 4% in property services.4 Lastly, in line with our universal banking model, we are steadily expanding our customer offers: the new CA Transitions et Energies (CATE) and CA Santé et Territoires (CAST) business lines have been rolled out for the large-scale financing of renewable energy projects as well as the production and supply of electricity, and to offer solutions to improve access to healthcare and support for the elderly.
This model is complemented by a steady stream of self-financed acquisitions and partnerships, through the consolidation of Crédit Agricole S.A.’s business lines in their markets to build the universal bank. Following on from acquisitions in the period 2019 to 2021 for a total of €3.3 billion, all of which were successful with some €1.3 billion5 in revenues generated, and a cost/income ratio of 52%, acquisitions and partnerships during the period covered by the Medium-Term Plan were in five main areas of development. The total investment was €7.2 billion6 (against €1.4 billion in disposals),7 generating around €3 billion in revenues.
First of all, transactions to consolidate our business lines and strengthen our expertise were carried out in France and Europe, in particular: Private Banking through the transaction under way with Degroof Petercam, and a 70% stake in the capital of Wealth Dynamix8; Asset Servicing with the creation of Uptevia9, a common company with BNP Paribas, the acquisition of RBC Investor Services’ European businesses and the purchase of Santander’s minority interest in CACEIS; and Asset Management with the acquisitions of Alpha Associates10 and aixigo11; and finally, Leasing and factoring activity accelerate its development in Germany with the acquisition of Merca Leasing12. Crédit Agricole S.A. is also structuring its property services through the acquisition of property management business of Casino (Sudeco), and more recently the ones of Nexity.
At the same time, the bank has expanded its distribution networks through new partnerships, notably by taking a stake in Banco BPM; signing a new distribution agreement between Crédit Agricole Assurances and Banco BPM for non-life and creditor insurance in Italy; partnership in automobile insurance with Mobilize Financial Services, subsidiary of Renault13; and entering into a distribution agreement between Amundi US and Victory Capital14.
In addition, Specialised Financial Services division developed a comprehensive mobility with: the joint venture Leasys, created with Stellantis to become the European leader in long-term car rental; 100% of CA Auto Bank was acquired, in order to develop partnerships with smaller manufacturers and with independent distributors; six European subsidiaries of ALD and LeasePlan were acquired; and lastly, CA Mobility Services was formed, to create 20 service offers by 2026, mainly through the acquisition of a minority stake in WATEA15, the creation of a joint venture with Opteven16, the acquisition of a stake in HiFlow17, and the commercial partnership with FATEC18. More recently, Credit Agricole Personal Finance & Mobility strengthens its partnership with the car manufacturer GAC with, on the one hand a financial partnership aimed at entrusting CA Auto Bank the financing of vehicules from the Chinese manufacturer in Europe, and on the other end, the acquisition of 50% of the capital of GAC Leasing in order to offer from 2025 financial and operational leasing on the Chinese market.
In addition, Crédit Agricole S.A. has acquired a stake in Worklife19 and formed a partnership with Wordline20 as part of its drive to accelerate digitisation and innovation. In January 2024, Crédit Agricole S.A. announced its acquisition of a 7% non-controlling interest in Worldline.
Lastly, to support the transitions in the new CATE and CAST business lines, Crédit Agricole S.A. acquired minority stakes of 40% in R3 (energy transition consultancy) and 43% in Selfee (energy production and supply), and become a reference shareholder in the capital of Office Santé21 and Cette Famille22. In addition, Crédit Agricole Assurances acquired majority stakes of 93% in Omedys23 and 86% in Medicalib23.
These two pillars of Crédit Agricole S.A.’s universal banking model ensure steady, high growth in revenues and high profitability. Revenues have grown every year between 2015 and 2024 regardless of the environment at an average annual rate of +5.6%. Operational efficiency has also steadily improved with the cost/income ratio falling -15 percentage points in the period 2015 to 2024. Profitability has also risen significantly over the past 10 years. ROTE was 14% at the end of 2024, the highest since 2015, offering even more attractive shareholder remuneration: the dividend per share has tripled in the 10-year period.
Continued support for the energy transition
The Group is continuing the mass roll-out of financing and investment to promote the transition. The Crédit Agricole Group increased its exposure to low-carbon energy financing24 by +141% between the end of 2020 and the end of 2024, with €26.3 billion in financing at 31 December 2024.
Investments by Crédit Agricole Assurances25 and Amundi Transition Energétique in low-carbon energy totalled €6 billion at 31 December 2024. What is more, Crédit Agricole Assurances hit its target of 14 GW of renewable energy production capacity financed one year ahead of schedule.
At the same time, as a universal bank, Crédit Agricole is supporting the transition of all its customers. Crédit Agricole CIB’s green loan portfolio26 grew by +75% between the end of 2022 and December 2024, and represented €21.7 billion at 31 December 2024. The Group also continues to encourage low-carbon mobility. 37% of new vehicles financed by CAPFM in 2024 were electric or hybrid vehicles. The target for the end of 2025 is 50%.
In addition, the Group is continuing on its pathway to exit the financing of carbon-based energies and is disclosing progress at end 2024 in three sectors, in line with their 2030 targets (vs. a 2020 baseline). Financed emissions in the oil and gas sector were reduced by -70% at end 2024 working towards a target of -75% by the end of 2030. The intensity of financed emissions in the power sector27 was down by -29% at end 2024, for a target of -58% by the end of 2030, and by -21% in the automotive sector, for a target of -50% by 2030.
The Group’s phased withdrawal from financing fossil fuel extraction resulted in a -40% decrease in outstandings in the period 2020 to 2024, equating to €5.6 billion at 31 December 2024. At the same time, large-scale financing of low-carbon energies, with outstandings of €26.3 billion, will increase their relative share of the energy mix financed from 54% in 2020 to 82% by the end of 2024.
Group results
In the fourth quarter of 2024, Crédit Agricole Group’s stated net income Group share came to €2,149 million, up +24.6% compared with the fourth quarter of 2023.
Specific items in the fourth quarter of 2024 had a negative net impact of -€42 million on the net income Group share of the Crédit Agricole Group. These items comprise the following recurring accounting items: recurring accounting volatility items, namely the DVA (Debt Valuation Adjustment), the issuer spread portion of the FVA, and secured lending for -€19 million in net income Group share from Capital Markets and Investment Banking, and the hedging of the loan book in Large Customers for +€1 million in net income Group share. In addition to these recurring items, there were other items specific to this quarter: ISB integration costs of
-€15 million in the net income Group share of Large Customers and the Degroof Petercam integration costs of
-€9 million in the net income Group share of Asset Gathering.
Specific items for the fourth quarter of 2023 had a combined impact of +€86 million on net income Group share and included +€69 million in recurring accounting items and +€17 million in non-recurring items. The recurring items mainly corresponded to the reversal of the Home Purchase Saving Plans provision of +€64 million (+€5 million for LCL, +€4 million for the Corporate Centre and +€55 million for the Regional Banks); the other recurring items (+€5 million) are split between the issuer spread portion of the FVA28 and secured lending (+€4 million) and loan book hedging (+€1 million). The non-recurring items related to the ongoing reorganisation of the Mobility activities29 in the SFS division (+€18 million).
Excluding these specific items, Crédit Agricole Group’s underlying net income Group share30 amounted to €2,190 million, up +33.7% compared to fourth quarter 2023.
Crédit Agricole Group – Stated and underlying results, Q4-24 and Q4-23
| €m |
Q4-24
stated |
Specific items |
Q4-24
underlying |
Q4-23
stated |
Specific items |
Q4-23
underlying |
∆ Q4/Q4
stated |
∆ Q4/Q4
underlying |
| |
|
|
|
|
|
|
|
|
| Revenues |
9,817 |
(24) |
9,840 |
8,769 |
93 |
8,677 |
+11.9% |
+13.4% |
| Operating expenses excl.SRF |
(5,863) |
(39) |
(5,824) |
(5,682) |
4 |
(5,686) |
+3.2% |
+2.4% |
| SRF |
– |
– |
– |
– |
– |
– |
n.m. |
n.m. |
| Gross operating income |
3,954 |
(63) |
4,017 |
3,088 |
97 |
2,991 |
+28.0% |
+34.3% |
| Cost of risk |
(867) |
0 |
(867) |
(762) |
– |
(762) |
+13.9% |
+13.9% |
| Equity-accounted entities |
80 |
– |
80 |
73 |
– |
73 |
+9.9% |
+9.9% |
| Net income on other assets |
(20) |
(1) |
(19) |
(19) |
– |
(19) |
+7.5% |
+2.2% |
| Change in value of goodwill |
4 |
– |
4 |
2 |
12 |
(9) |
+60.4% |
n.m. |
| Income before tax |
3,150 |
(64) |
3,214 |
2,382 |
109 |
2,274 |
+32.2% |
+41.4% |
| Tax |
(784) |
16 |
(799) |
(455) |
(23) |
(432) |
+72.4% |
+85.1% |
| Net income from discont’d or held-for-sale ope. |
– |
– |
– |
(10) |
– |
(10) |
(100.0%) |
(100.0%) |
| Net income |
2,366 |
(48) |
2,414 |
1,918 |
86 |
1,832 |
+23.4% |
+31.8% |
| Non controlling interests |
(217) |
7 |
(224) |
(194) |
– |
(194) |
+12.2% |
+15.6% |
| Net income Group Share |
2,149 |
(42) |
2,190 |
1,724 |
86 |
1,638 |
+24.6% |
+33.7% |
| Cost/Income ratio excl.SRF (%) |
59.7% |
|
59.2% |
64.8% |
|
65.5% |
-5.1 pp |
-6.4 pp |
In the fourth quarter of 2024, underlying revenues amounted to €9,840 million, up +13.4% compared to the fourth quarter of 2023, driven by favourable results from most of the business lines. Underlying revenues were up in French Retail Banking, while the Asset Gathering division benefited from good business momentum and the integration of Degroof Petercam, the Large Customers division enjoyed a high level of revenues across all of its business lines and the Specialised Financial Services division benefited from a positive price effect. In addition, International Retail Banking revenues were stable. Underlying operating expenses were up +2.4% in fourth quarter 2024, totalling €5,824 million. Overall, the Group saw its underlying cost/income ratio reach 59.2% in the fourth quarter of 2024, a -6.4 percentage point improvement. As a result, the underlying gross operating income came to €4,017 million, up +34.3% compared to the fourth quarter 2023.
The underlying cost of credit risk stood at -€867 million, an increase of +13.9% compared to fourth quarter 2023. This figure comprises an amount of -€363 million to prudential provisions on performing loans (stages 1 and 2) and an amount of -€489 million for the cost of proven risk (stage 3). There was also an addition of
-€16 million for other risks. The provisioning levels were determined by taking into account several weighted economic scenarios and by applying some flat-rate adjustments on sensitive portfolios. The weighted economic scenarios for the fourth quarter were updated from the third quarter, with a favourable scenario (French GDP at +1.1% in 2024, +1.3% in 2025) and an unfavourable scenario (French GDP at +1.1% in 2024 and -0.1% in 2025). The cost of risk/outstandings31reached 27 basis points over a four rolling quarter period and 29 basis points on an annualised quarterly basis32.
Underlying pre-tax income stood at €3,214 million, a year-on-year increase of +41.4% compared to fourth quarter 2023. This includes the contribution from equity-accounted entities for €80 million (up +9.9%) and net income on other assets, which came to -€19 million over this quarter. The underlying tax charge was up +85.1% over the period, with the tax rate this quarter rising by +6.0 percentage points to 25.5%. Underlying net income before non-controlling interests was up +31.8% to €2,414 million. Non-controlling interests rose +15.6%. Lastly, underlying net income Group share was €2,190 million, +33.7% higher than in the fourth quarter of 2023.
Crédit Agricole Group – Stated and underlying results 2024 and 2023
| En m€ |
2024
stated |
Specific items |
2024
underlying |
2023
stated |
Specific items |
2023
underlying |
∆ 2024/2023
stated |
∆ 2024/2023
underlying |
| |
|
|
|
|
|
|
|
|
| Revenues |
38,060 |
93 |
37,967 |
36,492 |
851 |
35,641 |
+4.3% |
+6.5% |
| Operating expenses excl.SRF |
(22,729) |
(123) |
(22,606) |
(21,464) |
(14) |
(21,450) |
+5.9% |
+5.4% |
| SRF |
– |
– |
– |
(620) |
– |
(620) |
(100.0%) |
(100.0%) |
| Gross operating income |
15,332 |
(30) |
15,362 |
14,408 |
837 |
13,572 |
+6.4% |
+13.2% |
| Cost of risk |
(3,191) |
(20) |
(3,171) |
(2,941) |
(84) |
(2,856) |
+8.5% |
+11.0% |
| Equity-accounted entities |
283 |
(0) |
283 |
263 |
(39) |
302 |
+7.6% |
(6.1%) |
| Net income on other assets |
(39) |
(24) |
(15) |
88 |
89 |
(1) |
n.m. |
x 18.9 |
| Change in value of goodwill |
4 |
– |
4 |
2 |
12 |
(9) |
+60.4% |
n.m. |
| Income before tax |
12,388 |
(74) |
12,462 |
11,821 |
814 |
11,007 |
+4.8% |
+13.2% |
| Tax |
(2,888) |
12 |
(2,900) |
(2,748) |
(203) |
(2,545) |
+5.1% |
+13.9% |
| Net income from discont’d or held-for-sale ope. |
– |
– |
– |
(3) |
– |
(3) |
(100.0%) |
(100.0%) |
| Net income |
9,500 |
(62) |
9,562 |
9,071 |
611 |
8,459 |
+4.7% |
+13.0% |
| Non controlling interests |
(860) |
23 |
(883) |
(813) |
(0) |
(813) |
+5.8% |
+8.7% |
| Net income Group Share |
8,640 |
(39) |
8,679 |
8,258 |
611 |
7,647 |
+4.6% |
+13.5% |
| Cost/Income ratio excl.SRF (%) |
59.7% |
|
59.5% |
58.8% |
|
60.2% |
+0.9 pp |
-0.6 pp |
For full-year 2024, stated net income Group share amounted to €8,640 million, compared with €8,258 million for full-year 2023, an increase of +4.6%.
Specific items for full-year 2024 include the specific items of the Regional Banks (+€47 million in reversals of Home Purchase Savings Plan provisions) and Crédit Agricole S.A. specific items, which are detailed in the Crédit Agricole S.A. section.
Excluding specific items, underlying net income Group share reached €8,679 million, up +13.5% compared with full-year 2023.
Underlying revenues totalled €37,967 million, up +6.5% compared with full-year 2023, driven by all business lines (excluding Corporate Centre).
Underlying operating expenses amounted to -€22,606 million, up +5.4% excluding SRF compared to full-year 2023, mainly due to higher compensation in an inflationary environment, support for business development, IT expenditure and scope effects as detailed for each division. The underlying cost/income ratio for full-year 2024 was 59.5%, a -0.6 percentage point improvement compared to full-year 2023 excluding SRF. The SRF stood at
-€620 million in 2023.
Underlying gross operating income totalled €15,362 million, up +13.2% compared to full-year 2023.
The underlying cost of risk for full-year 2024 rose to -€3,171 million (of which -€540 million in cost of risk on performing loans (stages 1 and 2), -€2,637 million in cost of proven risk, and +€6 million in other risks corresponding mainly to reversals of legal provisions), i.e. an increase of +11.0% compared to full-year 2023.
As at 31 December 2024, risk indicators confirm the high quality of Crédit Agricole Group’s assets and risk coverage level. The diversified loan book is mainly geared towards home loans (45% of gross outstandings) and corporates (33% of gross outstandings). Loan loss reserves amounted to €21.3 billion at the end of December 2024 (€11.7 billion for Regional Banks), 42.2% of which represented provisioning of performing loans (47.3% for Regional Banks). The prudent management of these loan loss reserves meant that the Crédit Agricole Group’s overall coverage ratio for doubtful loans at the end of December 2024 was 84.9%.
Underlying net income on other assets stood at -€15 million for full-year 2024 versus -€1 million for full-year 2023. Underlying pre-tax income before discontinued operations and non-controlling interests rose by +13.2% to €12,462 million. The tax charge was -€2,900 million, up +13.9%, with an underlying effective tax rate of 23.8%, stable compared to full-year 2023. Underlying net income before non-controlling interests was therefore up by +13.0%. Non-controlling interests amounted to -€883 million for full-year 2024, up +8.7%.
Underlying net income Group share for full-year 2024 thus stood at €8,679 million, up 13.5% compared to full-year 2023.
Regional banks
Gross customer capture stands at +273,000 new customers and the customer base grew by +10,000 new customers over the same period. The percentage of customers using demand deposits as their main account and those who use digital tools continued to increase. Credit market share (total credits) stands at 22.7% (at the end of September 2024, source Banque de France). Loan production was up +7.4% compared to the fourth quarter of 2023, reflecting the +7.8% rise in home loans and specialised markets. Home loan production has been gradually recovering since the beginning of the year. The average production rate for home loans stood at 3.35%33 over October and November 2024, -12 basis points lower than in the third quarter of 2024. By contrast, the global loan stock rate showed a gradual improvement (+16 basis points compared to the fourth quarter of 2023). Outstanding loans totalled €648 billion at the end of December 2024, stable year-on-year across all markets but up slightly by +0.2% over the quarter.
Customer assets were up +2.6% year-on-year to reach €910.9 billion at the end of December 2024. This growth was driven both by on-balance sheet deposits, which reached €605.9 billion (+1.7% year-on-year), and off-balance sheet deposits, which reached €305 billion (+4.4% year-on-year) benefiting from strong inflows in life insurance. The mix of on-balance sheet deposits for the quarter remained almost unchanged, with demand deposits and term deposits fluctuating by -0.5% and +0.1%, respectively, from end-September 2024. The market share of balance sheet collection is up compared to last year and stands at 20.3% (Source Banque de France, data at the end of September 2024, i.e. +0.4 percentage points compared to September 2023). The equipment rate for property and casualty insurance34 was 43.9% at the end of December 2024 and continues to rise (up +0.8 percentage point compared to the end of December 2023). In terms of payment instruments, the number of cards rose by +1.6% year-on-year, as did the percentage of premium cards in the stock, which increased by 1.6 percentage points year-on-year to account for 16.4% of total cards.
In the fourth quarter of 2024, the Regional Banks’ consolidated revenues including the SAS Rue La Boétie dividend35 stood at €3,247 million, up +0.7% compared to the fourth quarter of 2023, notably impacted by a base effect of +€73.6 million related to the reversal of the Home Purchase Savings Plan provision in the fourth quarter of 202336. Excluding this item, revenues were up +3.1% compared to the fourth quarter of 2023, the rise in the net interest margin (+9.8% excluding Home Purchase Savings36) and good momentum of fee and commission income (+1.6%) in insurance, account management and payment instruments offsetting the drop in portfolio revenues (-10.0%). Operating expenses were stable (+0.7%), below inflation. Gross operating income was up +0.8% year-on-year (+11.6% excluding the Home Purchase Savings Plan base effect36). The cost of risk was down -24.6% compared with the fourth quarter of 2023 to -€242 million. The cost of risk/outstandings (over four rolling quarters) remained under control at 20 basis points (a -1 basis point drop compared to third quarter 2024).
The Regional Banks’ consolidated net income, including the SAS Rue La Boétie dividend35 amounted to €419 million, up +19.9% compared to the fourth quarter 2023 (+42.1% excluding the base effect36).
The Regional Banks’ contribution to net income Group share was €403 million in the fourth quarter of 2024, up +20.3% compared to the fourth quarter of 2023.
In full-year 2024, revenues including the SAS Rue La Boétie dividend were up +1.9% compared to the same period in 2023. Operating expenses rose by +1.4%, resulting in a rise in gross operating income of +2.7%. Finally, with a cost of risk up +14.0%, the Regional Banks’ net income Group share, including the SAS Rue La Boétie dividend, amounted to €3,470 million, up +2.5% compared to full-year 2023 (+5.5% excluding the Home Purchase Savings Plan base effect36).The Regional Banks’ contribution to the results of Crédit Agricole Group in full-year 2024 amounted to €1,423 million in stated net income Group share (-18.9% compared to the same period in 2023), with revenues of €13,110 million (-1.1%), expenses of -€9,956 (+2.6%) and a cost of risk of -€1,319 million (+14.5%).
Crédit Agricole S.A.
Results
Crédit Agricole S.A.’s Board of Directors, chaired by Dominique Lefebvre, met on 4 February 2025 to examine the financial statements for the fourth quarter of 2024.
Crédit Agricole S.A. – Stated and underlying results, Q4-24 and Q4-23
| €m |
Q4-24
stated |
Specific items |
Q4-24
underlying |
Q4-23
stated |
Specific items |
Q4-23
underlying |
∆ Q4/Q4
stated |
∆ Q4/Q4
underlying |
| |
|
|
|
|
|
|
|
|
| Revenues |
7,092 |
(24) |
7,116 |
6,040 |
19 |
6,021 |
+17.4% |
+18.2% |
| Operating expenses excl.SRF |
(3,917) |
(39) |
(3,878) |
(3,710) |
4 |
(3,714) |
+5.6% |
+4.4% |
| SRF |
– |
– |
– |
– |
– |
– |
n.m. |
n.m. |
| Gross operating income |
3,175 |
(63) |
3,238 |
2,330 |
24 |
2,307 |
+36.2% |
+40.4% |
| Cost of risk |
(594) |
0 |
(594) |
(440) |
– |
(440) |
+35.0% |
+35.0% |
| Equity-accounted entities |
62 |
– |
62 |
61 |
– |
61 |
+2.4% |
+2.4% |
| Net income on other assets |
(9) |
(1) |
(8) |
(17) |
– |
(17) |
(45.9%) |
(51.9%) |
| Change in value of goodwill |
– |
– |
– |
2 |
12 |
(9) |
n.m. |
(100.0%) |
| Income before tax |
2,634 |
(64) |
2,698 |
1,937 |
35 |
1,902 |
+36.0% |
+41.9% |
| Tax |
(681) |
16 |
(697) |
(369) |
(4) |
(365) |
+84.7% |
+91.0% |
| Net income from discont’d or held-for-sale ope. |
– |
– |
– |
(10) |
– |
(10) |
n.m. |
n.m. |
| Net income |
1,953 |
(48) |
2,001 |
1,558 |
32 |
1,527 |
+25.3% |
+31.1% |
| Non controlling interests |
(264) |
7 |
(271) |
(224) |
(0) |
(224) |
+17.8% |
+21.1% |
| Net income Group Share |
1,689 |
(41) |
1,730 |
1,334 |
31 |
1,303 |
+26.6% |
+32.8% |
| Earnings per share (€) |
0.52 |
(0.01) |
0.54 |
0.41 |
0.01 |
0.40 |
+26.8% |
+33.4% |
| Cost/Income ratio excl. SRF (%) |
55.2% |
|
54.5% |
61.4% |
|
61.7% |
-6.2 pp |
-7.2 pp |
In the fourth quarter of 2024, Crédit Agricole S.A.’s stated net income Group share came to €1,689 million, up +26.6% compared to the fourth quarter of 2023, having benefited from non-recurring items related to reversals of Home Purchase Savings Plan and Cheque Image Exchange fine provisions and from the end of the reorganisation of the Mobility activities (see below). This was an excellent result for the fourth quarter of 2024, based on high revenues (exceeding €7 billion) and a cost/income ratio kept at a low level.
Specific items for this quarter had a cumulative impact of -€41 million on net income Group share, and included the following recurring accounting items: recurring accounting volatility items in revenues, such as the DVA (Debt Valuation Adjustment), the issuer spread portion of the FVA and secured lending for -€19 million in net income Group share in the Large Customers segment, and the hedging of the loan book in the Large Customers segment for +€1 million in net income Group share. In addition to these recurring items, there were a number of items specific to this quarter: Degroof Petercam integration costs of -€8 million in the net income Group share in Asset Gathering; ISB integration costs for -€15 million in the net income Group share in Large Customers.
Specific items for the fourth quarter 2023 had a cumulative impact of +€31 million on net income Group share, and included recurring accounting items for +€14 million and non-recurring items for +€17 million. The recurring items mainly corresponded to the reversal of the Home Purchase Savings Plans provision of +€8 million (+€4 million for LCL and +€4 million for the Corporate Centre); the other recurring items – the issuer spread portion of the FVA and secured lending (+€4 million) and loan book hedging (+€1 million) – offset each other. The non-recurring items related to the ongoing reorganisation of the Mobility activities in the SFS division (+€17 million).
Excluding specific items, underlying net income Group share37 stood at €1,730 million in the fourth quarter of 2024, up +32.8% compared to the fourth quarter of 2023.
In the fourth quarter of 2024, underlying revenues were at a high level, standing at €7,116 million. They were up sharply by +18.2% compared to the fourth quarter of 2023. This growth was driven by growth in the Asset Gathering division (+31.6%) which in turn was driven by the rise in outstandings across all business lines, including the integration of Degroof Petercam38. There was a positive base effect relating to very high weather-related claims in the fourth quarter of 2023. Large Customer division revenues (+10.6%) were driven by good results from all business lines with continued revenue growth in corporate and investment banking in the fourth quarter, in addition to an improvement in the net interest margin and fee and commission income within CACEIS. Specialised Financial Services division revenues (+4.0%) benefited mainly from positive price effects in the Personal Finance and Mobility business line. French Retail Banking growth (+0.8%) was driven by the rise in fee and commission income which offset the drop in NIM, and International Retail Banking revenues (-0.5%) were stable. Corporate Centre revenues were up +€362 million, positively impacted by the dividend and the revaluation of the equity interest in Banco BPM of +€294 million.
Underlying operating expenses totalled -€3,878 million in the fourth quarter of 2024, an increase of +4.4% compared to the fourth quarter of 2023, reflecting the support given to business line development. The -€164 million year-on-year rise in expenses was mainly due to a -€132 million scope effect39.
The underlying cost/income ratio in fourth quarter 2024 stood at 54.5%, a decrease of -7.2 percentage points compared to fourth quarter 2023.
Underlying gross operating income in the fourth quarter of 2024 stood at €3,238 million, an increase of +40.4% compared to the fourth quarter of 2023.
As at 31 December 2024, risk indicators confirm the high quality of Crédit Agricole S.A.’s assets and risk coverage level. The diversified loan book is mainly geared towards home loans (26% of gross outstandings) and corporates (44% of Crédit Agricole S.A. gross outstandings). The Non-Performing Loans ratio was down
-0.2 point from the previous quarter and remains low at 2.3%. The coverage ratio40 was high at 74.1%, up +2.7 percentage points over the quarter. Loan loss reserves amounted to €9.6 billion for Crédit Agricole S.A., relatively unchanged from end September 2024. Of those loan loss reserves, 35.8% were for performing loans (percentage up +1.5% from the previous quarter).
The underlying cost of risk showed a net addition of -€594 million, up +35.0% from the fourth quarter of 2023, including a -€278 million addition for performing loans (stages 1 and 2) (versus a reversal of -€1 million in the fourth quarter of 2023) and -€297 million in provisioning for proven risks (stage 3) (versus -€373 million in the fourth quarter of 2023). Also note a provision of -€18 million for other items (legal provisions), primarily for the SFS business line (-€30 million in legal provisions). By business line, 52% of the net addition for the quarter came from Specialised Financial Services (an increase from end-December 2023, unchanged from September 2024), 13% from LCL (22% at end-September 2023), 17% from International Retail Banking (23% at end-December 2023), 16% from Large Customers (9% at end-December 2023) and 1% from the Corporate Centre (3% at end-December 2023). The provisioning levels were determined by taking into account several weighted economic scenarios and by applying some flat-rate adjustments on sensitive portfolios. The weighted economic scenarios for the fourth quarter were updated relative to the third quarter, with a favourable scenario (French GDP at +1.1% in 2024, +1.3% in 2025) and an unfavourable scenario (French GDP at +1.1% in 2024 and -0.1% in 2025). In the fourth quarter of 2024, the cost of risk/outstandings was 34 basis points over a rolling four-quarter period41 and 44 basis points on an annualised quarterly basis42 (a deterioration of 1 basis point and 10 basis points, respectively, versus the fourth quarter of 2023 for both bases).
The underlying contribution from equity-accounted entities amounted to €62 million in the fourth quarter of 2024, up +2.4% compared to the fourth quarter of 2023, mainly due to the growth of equity-accounted entities in the personal finance and mobility business line.
Underlying income43before tax, discontinued operations and non-controlling interests was up +41.9% to €2,698 million. The underlying effective tax rate stood at 26.4%, up +6.7 percentage points on fourth quarter 2023. The underlying tax charge was -€697 million, a +91% increase chiefly due to a positive base effect. Underlying net income before non-controlling interests was up +31.1% to €2,001 million. Non-controlling interests amounted to -€271 million in the fourth quarter of 2024, an increase of +21.1%.
Underlying earnings per share in fourth quarter 2024 came to €0.54, up +33.4% compared to fourth quarter 2023.
Crédit Agricole S.A. – Stated and underlying results, 2024 and 2023
| En m€ |
2024
stated |
Specific items |
2024
underlying |
2023
stated |
Specific items |
2023
underlying |
∆ 2024/2023
stated |
∆ 2024/2023
underlying |
| |
|
|
|
|
|
|
|
|
| Revenues |
27,181 |
30 |
27,151 |
25,180 |
617 |
24,563 |
+7.9% |
+10.5% |
| Operating expenses excl.SRF |
(14,895) |
(123) |
(14,772) |
(13,632) |
(14) |
(13,618) |
+9.3% |
+8.5% |
| SRF |
– |
– |
– |
(509) |
– |
(509) |
(100.0%) |
(100.0%) |
| Gross operating income |
12,286 |
(94) |
12,379 |
11,039 |
603 |
10,436 |
+11.3% |
+18.6% |
| Cost of risk |
(1,850) |
(20) |
(1,830) |
(1,777) |
(84) |
(1,693) |
+4.1% |
+8.1% |
| Equity-accounted entities |
194 |
(0) |
194 |
197 |
(39) |
235 |
(1.5%) |
(17.6%) |
| Net income on other assets |
(4) |
(24) |
20 |
85 |
89 |
(4) |
n.m. |
n.m. |
| Change in value of goodwill |
– |
– |
– |
2 |
12 |
(9) |
(100.0%) |
(100.0%) |
| Income before tax |
10,625 |
(138) |
10,763 |
9,546 |
580 |
8,966 |
+11.3% |
+20.0% |
| Tax |
(2,472) |
28 |
(2,500) |
(2,201) |
(153) |
(2,047) |
+12.3% |
+22.1% |
| Net income from discont’d or held-for-sale ope. |
– |
– |
– |
(3) |
– |
(3) |
n.m. |
n.m. |
| Net income |
8,153 |
(109) |
8,263 |
7,343 |
427 |
6,916 |
+11.0% |
+19.5% |
| Non controlling interests |
(1,067) |
24 |
(1,090) |
(995) |
(2) |
(992) |
+7.3% |
+9.9% |
| Net income Group Share |
7,087 |
(86) |
7,172 |
6,348 |
425 |
5,923 |
+11.6% |
+21.1% |
| Earnings per share (€) |
2.11 |
(0.03) |
2.14 |
1.94 |
0.14 |
1.80 |
+8.5% |
+18.5% |
| Cost/Income ratio excl.SRF (%) |
54.8% |
|
54.4% |
54.1% |
|
55.4% |
+0.7 pp |
-1.0 pp |
Over year 2024, stated net income Group share amounted to €7,087 million, versus €6,348 million for full-year 2023, an increase of +11.6%.
Specific items for 2024 had a negative impact of -€86 million on stated net income Group share and comprise +€21 million in recurring accounting items and -€107 million in non-recurring items. The recurring items mainly correspond to the reversals of and additions to the Home Purchase Savings Plans provisions for +€1 million net, as well as the accounting volatility items of the Large Customers division (the DVA for +€15 million and loan book hedging for +€6 million). Non-recurring items relate to the integration and acquisition costs of Degroof Petercam (-€35 million) within the Asset Gathering division, the costs of integrating ISB (-€52 million) within the Large Customers division and an additional provision for risk in Ukraine (-€20 million) within the International Retail Banking division.
Excluding specific items, underlying net income Group share reached €7,172 million, up +21.1% compared to full-year 2023.
Underlying revenues were up +10.5% year-on-year, driven by all business lines. Underlying operating expenses excluding SRF were +8.5% higher than in 2023, essentially reflecting the development of the Group’s business lines and the integration of scope effects, partially offset by the end of the SRF44 building-up period. The underlying cost/income ratio excluding SRF for the period was 54.4%, a decrease of 1 percentage point compared to the same period in 2023. Underlying gross operating income totalled €12,379 million, up +18.6% compared to full-year 2023. The underlying cost of risk increased by +8.1% over the period to
-€1,830 million, versus -€1,693 million in 2023. Lastly, underlying contributions from equity-accounted entities amounted to €194 million, down -17.6% over the period.
Underlying earnings per share stood at €2.14 per share for full-year 2024, up 18.5% from full-year 2023.
Underlying RoTE45, which is calculated on the basis of an annualised Underlying Net Income Group Share46 and IFRIC charges linearised over the year, net of annualised Additional Tier 1 coupons (return on equity Group share excluding intangibles) and net of foreign exchange impact on reimbursed AT1, and restated for certain volatile items recognised in equity (including unrealised gains and/or losses), reached 14.0% in 2024, up +1.4 percentage point compared to 2023.
Analysis of the activity and the results of Crédit Agricole S.A.’s divisions and business lines
Activity of the Asset Gathering division
In the fourth quarter of 2024, assets under management in the Asset Gathering division (AG) stood at
€2,867 billion, up +€58 billion over the quarter (or +2.1%), mainly due to a positive market effect and strong net inflows in the three business lines – Asset Management, Insurance and Wealth Management. Over the year, assets under management rose by +12.1%.
Insurance activity (Crédit Agricole Assurances) was very dynamic with total premium income of €10.9 billion – a record level for a fourth quarter – up +14.2% compared to the fourth quarter of 2023, and up in all three segments: savings/retirement, property and casualty, and death & disability/creditor/group insurance. In total for the year, overall premium income also stood to a record €43.6 billion, up +17.2% vs. 2023.
In Savings/Retirement, fourth-quarter premium income stood at €8.3 billion, up +17.3% compared to the fourth quarter of 2023. Business was driven by euro payment bonus campaigns in France, launched during the first quarter, which boosted gross euro inflows, as well as by a confirmed upturn in international business. Unit-linked contracts accounted for 37.4% of gross inflows47, down -12.8 percentage points over the year, reflecting the reduced appeal of unit-linked bond products. The quarter’s net inflows47 totalled +€2.4 billion (up +€0.8 billion compared to the third quarter of 2024), comprised of +€1.4 billion net inflows from unit-linked contracts and +€1.1 billion from euro funds. In total, Savings/Retirement premium income amounted to €32.1 billion, up +21.5% compared to the end of December 2023.
Assets under management (savings, retirement and funeral insurance) continued to grow and came to €347.3 billion (up +€17.0 billion year-on-year, or +5.1%). The growth of assets under management was supported by positive market effects and positive net inflows. Unit-linked contracts accounted for 30.0% of outstandings, up +1.1 percentage point compared to the end of December 2023.
The profit sharing rate on Predica’s euro-denominated life insurance policies in 2024 remained stable compared to 2023.48 The Policy Participation Reserve (PPE49) amounted to €7.5 billion at 31 December 2024, representing 3.3% of total euro outstandings.
In property and casualty insurance, premium income rose to €1.2 billion in the fourth quarter of 2024, up +9.9%50 compared to the fourth quarter of 2023. Growth stemmed from a price effect, with the increase in the average premium benefiting from revised rates and changes in the product mix, and a volume effect, with a portfolio of close to €16.7 million51 policies at the end of December 2024 (an increase of +5.3% over the year). The combined ratio at end-December 2024 was 94.4%,52 an improvement of -2.7 percentage points year-on-year, related to a positive base effect due to lower claims in the fourth quarter of 2024 compared with the same period one year earlier, which was impacted by fierce storms. In total, at the end of December 2024, premium income stood at €6.2 billion, an increase of +8.2% compared to full-year 2023.
In death & disability/creditor/group insurance, premium income for the fourth quarter of 2024 stood at €1.3 billion, up +1.4% compared to the fourth quarter of 2023. The strong performance in individual death and disability insurance and group insurance (+9.9% and +22.1%, respectively, compared to fourth quarter 2023) offset a decline in creditor insurance of -4.9% in both consumer finance and mortgage lending. In total, at the end of December 2024, premium income from personal protection insurance stood at €5.3 billion, an increase of +4.6% compared to 2023.
In Asset Management (Amundi), assets under management by Amundi increased by +2.2% and +10.0% respectively over the quarter and the year, reaching a new record of €2,240 billion at the end of December 2024, benefiting from the positive market effect, but also from a high level of inflows over the quarter and year.
Over the quarter, net inflows amounted to +€20.5 billion, the highest level since 2021, driven by medium-long-term assets 53 (+€17.9 billion) in active management and, as in previous quarters, in ETFs. Third-party distributors also posted record inflows in 2024, which were well diversified and positive in all asset classes.
The Retail segment recorded record net inflows in 2024 from third-party distributors, well diversified across all asset classes, and positive inflows from partner networks in France. The institutional segment continued to record solid commercial momentum, with net inflows driven by medium/long-term assets in the institutional and sovereign segments, and by treasury products in the corporate segment. Finally, JVs continue to benefit from the dynamic inflows of SBI MF in India. Thus, the increase in assets under management of +€48.5 billion over the quarter is linked to a good level of activity (net inflows of +€20.5 billion) and a positive market and foreign exchange effect of +€28.1 billion. In 2024, the increase in assets under management of +€203 billion is linked to record net inflows of +€55.4 billion, doubling compared to 2023, a favorable market effect of +€140.1 billion and a scope effect of +€7.9 billion in connection with the integration of Alpha Associate since the second quarter of 2024.
In Wealth Management, total assets under management (CA Indosuez Wealth Management and LCL Private Banking) amounted to €279 billion at the end of December 2024, and were up +1.9% compared to September 2024 and +46,9% compared to December 2023.
For Indosuez Wealth Management assets under management at the end of December stood at €215 billion54, up +2.6% compared to the end of September 2024, thanks to a good level of activity with net inflows of +€1.9 billion and a favourable market effect of +€3.7 billion. Compared to the end of December 2023, assets under management were up by +€87 billion (or +68.2%), taking into account a scope effect of €69 billion (integration of Degroof Petercam in June 2024). Also of note over the quarter was the continued integration of Degroof Petercam with several capital reorganisations in France and in Luxembourg, and the effective mergers of legal entities planned for Q3 2025. In 2025, Wealth Management projects in the region of €70-80 million in additional integration costs for Degroof Petercam.
Results of the Asset Gathering division
In the fourth quarter of 2024, the Asset Gathering division generated €2,045 million in revenues, up +31.6% compared to the fourth quarter of 2023, driven by all the division’s business lines. Expenses increased +28% to -€930 million and gross operating income came to €1,116 million, +34.7% compared to fourth quarter of 2023. The cost/income ratio for the fourth quarter of 2024 stood at 45.5%, down -1.3 percentage points compared to the same period in 2023. Taxes amounted to -€315 million, up +82.3%, notably related to the scope of insurance activities. Net income Group share for Asset Gathering division was €695 million in the fourth quarter of 2024, up +27.4% compared to the same period in 2023.
In full-year 2024, Asset Gathering generated €7,648 million in revenues, up +14.4% compared to the end of December 2023, driven by very high level of revenues in all three business lines – in Insurance, Asset Management and Wealth Management. Expenses excluding SRF increased +17.1%.to -€3,365 million, while gross operating income came to €4,284 million (up +12.5% compared to end-December 2023). As a result, the cost/income ratio excluding SRF stood at 44%, up +1.0 percentage points compared to the end of December 2023. The tax charge was -€973 million in 2024, up +11.7% on 2023. Finally, Asset Gathering net income Group share came to €2,875 million, up +13.1% compared to 2023, up in the three activities of the Asset Gathering division.
At end-December 2024, the Asset Gathering, contributed 38% to the underlying net income Group share of the Crédit Agricole S.A. core businesses and 28% to underlying revenues (excluding the Corporate Centre division).
As at 31 December 2024, equity allocated to the division amounted to €12.6 billion, including €10.4 billion for Insurance, €1.3 billion for Asset Management, and €0.9 billion for Wealth Management. The division’s risk-weighted assets amounted to €57.5 billion, including €34.5 billion for Insurance, €13.7 billion for Asset Management and €9.4 billion for Wealth Management.
Underlying RoNE (return on normalised equity) stood at 26.9% at the end of December 2024.
Insurance results
In the fourth quarter of 2024, insurance revenues reached €715 million, up sharply by +37.1% compared to the fourth quarter of 2023, benefiting from a favorable base effect (fourth quarter 2023 having been impacted by the high claims rate related to storms Ciaran and Domingos), dynamic activity and growth in assets under management. Revenues for the quarter include €540 million from savings/retirement55, €93 million from personal protection56 and €141 million from property and casualty insurance57.
The CSM (Contractual Service Margin) stood at €25.2 billion at 31 December 2024, up 5.8% year-on-year, benefiting from the positive impact of the revaluation of the stock and the contribution of new business exceeding the CSM allocation. The CSM allocation factor was 7.7% in 2024. Non-attributable expenses for the quarter amounted to -€77 million, up +2.7% vs. the fourth quarter of 2023. As a result, gross operating income reached €638 million, up +42.9% compared to the same period in 2023. Taxes amounted to -€218 million, compared with -€79 million in the fourth quarter of 2023, in connection with the increase in the tax rate to 34.5% (+16.7 percentage points compared to the fourth quarter of 2023). This change is linked in particular to an upward reassessment of the tax rate including a decrease in the valuation of assets at a reduced rate. Non-controlling interests amounted to €3 million compared to €-32 million in the fourth quarter of 2023, impacted by the inclusion of accounting items related to the redemption of RT1 instruments. Net income Group share was €418 million, up +24.5% compared to the fourth quarter of 2023.
Full year 2024 insurance revenues reached €2,845 million, up +11.9% compared to 2023, in line with dynamic activity, the increase in outstandings, as well as the lower claims experience in 2024 compared to 2023. Non-attributable expenses amounted to -€341 million, up +9.3%. The cost/income ratio is thus 12%, below the target ceiling set by the Medium-Term Plan of 15%. Gross operating income was €2,504 million (+12.2% compared to 2023). The tax expense was -€572 million, up +16.6% compared to 2023, in line with the lower contribution of reduced tax rate operations to the overall tax rate. As a result, net income Group share reached €1,884 million, up +14% compared to 2023.
Insurance contributed 25% to the underlying net income Group share of Crédit Agricole S.A.’s business lines (excluding AHM) at the end of December 2024 and 10% to their underlying revenues.
Crédit Agricole Assurances remains solid with a prudential Solvency 2 ratio superior to 200% as of 31 December 2024.
Asset Management results
In the fourth quarter of 2024, revenues reached €901 million, up +14.5% compared to the fourth quarter of 2023, mainly driven by management and technology revenues. Net management fees posted sustained growth of +13.5% compared to the fourth quarter of 2023, linked to the good level of activity and the increase in average assets under management. Performance fees were also up +67.6% compared to the fourth quarter of 2023, benefiting from the good performance of active strategies, particularly rates and credit. Amundi Technology’s revenues continued their sustained growth and increased by +47,1% compared to the fourth quarter of 2023, amplified this quarter by the first consolidation of aixigo, a European leader in Wealth Tech, whose acquisition was finalized in November 2024. Operating expenses amounted to €-506 million, up +16.2% compared to the fourth quarter of 2024, mainly explained by the effect of the first consolidation of Alpha Associates and aixigo, the acceleration of strategic investments, the growth of variable compensation revenues related to operational performance and acquisition-related integration costs.58 Restated for integration costs, the increase in expenses remains lower than the increase in revenues, thus generating a positive jaws effect. Gross operating income was €395 million, up +12.5% compared to the fourth quarter of 2023, reflecting double-digit revenue growth. The contribution of associates, including the contribution of Amundi’s Asian joint ventures, amounted to €29 million, up +1.8% compared to the fourth quarter of 2023. The tax expense amounted to -€80 million (down -9.6%). Net income before deduction of minority interests amounted to €341 million, up +18% compared to the same period in 2023. As a result, net income Group share was €226 million, +16.2% compared to the fourth quarter of 2023.
In 2024, net banking income reached €3,406 million, up +9.1% in asset management, reflecting growth in management revenues, linked to the growth in average assets under management and the very good performance of active and passive management. Amundi Technology’s revenues also grew strongly, amplified by the acquisition of aixigo in the fourth quarter of 2024. Operating expenses excluding SRF amounted to -€1,890 million, an increase of +8.8%, explained by the first consolidation of Alpha Associates and aixigo, investments in growth areas, the increase in provisions for variable compensation in line with operational performance and integration costs58.The cost/income ratio excluding SRF stood at 55.5%, stable compared to 2023 (-0.2 percentage points). Thus, gross operating income increased by +9.7% compared to 2023, reflecting the increase in revenues. Profit from associates increased by +20.9%, mainly driven by the JV in India, which contributed more than €100 million for the first time to this result. In the end, net income Group share was €849 million, up +11.7% compared to 2023.
Wealth Management results59
In the fourth quarter of 2024, net banking income from wealth management amounted to €430 million, up +73.9% compared to the fourth quarter of 2023, benefiting from the impact of the integration of Degroof Petercam in June 2024.60 Excluding this effect, revenues were supported by the good momentum of management fees in connection with the increase in outstandings, offsetting the anticipated decrease in the net interest margin on deposits. Expenses for the quarter amounted to -€347 million, up +60.4% compared to the fourth quarter of 2023, impacted by a Degroof Petercam60 and -€12.8 million in integration costs. Restated for these impacts, the evolution of expenses is slightly lower than in the fourth quarter of 2023. The cost/income ratio for the fourth quarter of 2024 stood at 80.8%, down -6.8 percentage points compared to the same period in 2023. Restated for integration and acquisition costs, the cost/income ratio was 77.8%. Gross operating income reached €82 million, up sharply (x 2.7) compared to the fourth quarter of 2023. The cost of risk for the quarter remained moderate at -€3 million, in line with the fourth quarter of 2023 (-€5 million). Net income Group share reached €51 million, up sharply (x 3.3) compared to the fourth quarter of 2023. Restated for integration and acquisition costs61, net income Group share for the fourth quarter of 2024 amounted to €60 million.
For the full year 2024, net banking income from the wealth management business amounted to €1,397 million, up +36.6% compared to the end of December 2023, benefiting in particular from the integration of Degroof Petercam in June 202462. Expenses excluding SRF were up +37.5% due to a Degroof Petercam62 scope effect and -€26.4 million in integration costs. Restated for these impacts, 2024 expenses are up slightly by +2.8% compared to 2023. Gross operating income increased by +35.0% to €264 million. The cost of risk at the end of 2024 was -€15 million, up -€11 million compared to the end of December 2023, related to the consideration of litigation and the provisioning of various cases. Net income on other assets amounted to -€23 million, mainly corresponding to acquisition costs for Degroof Petercam63, restated for specific items. Net income Group share for 2024 was €142 million, up 11.1% compared to 2023. Restated for integration and acquisition costs63, 2024 net income Group share amounted to €177 million.
Wealth Management contributed 2% to the underlying net income Group share of Crédit Agricole S.A.’s business lines (excluding AHM) at the end of December 2024 and 5% of their underlying revenues.
As of 31 December 2024, the equity allocated to Wealth Management amounted to €0.9 billion; risk weighted assets are €9.4 billion.
Activity of the Large Customers division
Once again in Q4 2024, Corporate and Investment Banking (CIB) posted an excellent performance across all its businesses (best fourth quarter and best year in terms of revenues). Asset servicing also recorded strong business momentum during the period.
Corporate and Investment Banking’s fourth-quarter underlying revenues rose sharply to €1,596 million, an increase of +9.9% compared with the fourth quarter of 2023, driven by growth in its two business lines. Revenues from Financing activities were up +4.4% year-on-year to €898 million. This was mainly due to the strong performance recorded by Commercial Banking (+4.0% versus the fourth quarter of 2023), driven by good momentum in Corporate activities, especially in the Telecom sector, and strong revenues from asset financing and project financing, especially in Green energy and Aerospace. Capital Markets and Investment Banking also grew its revenues to €699 million, an increase of +18.0% compared with the fourth quarter of 2023. Growth was fuelled by the high revenues maintained by Capital Markets (+17.0% versus the fourth quarter of 2023), driven by the Repo and Securitisation businesses, and the strong performance recorded by Investment Banking (with growth of +23.0% compared with the fourth quarter of 2023) thanks to the strong performance of Structured Equities.
In total, Corporate and Investment Banking’s underlying revenue rose a steep +6.5% year-on-year to €6,540 million, driven by growth in its two business lines. Revenues from Financing activities were up +5.7% compared to the total for 2023, at €3,355 million. Capital Markets and Investment Banking also grew its revenues by +7.3% compared with the end of December 2023, to total €3,185 million.
Financing activities consolidated its leading position in syndicated loans (#1 in France64 and #2 in EMEA64). Crédit Agricole CIB reaffirmed its strong position in bond issues (#4 All bonds in EUR Worldwide64) and was ranked #2 in Green, Social & Sustainable bonds in EUR.65 Average regulatory VaR stood at €9.5 million in the fourth quarter of 2024, down from the €10.1 million recorded in the third quarter of 2024, reflecting changes in positions and the financial markets. It remained at a level that reflected prudent risk management.
In Asset Servicing, buoyant sales and favourable market conditions boosted growth in assets over the year, which offset the planned withdrawal of ISB customers. The fourth quarter of 2024 saw the continued migration of ISB (formerly RBC Investor Services in Europe) client portfolios to CACEIS platforms, following the effective merger of the legal entities with those of CACEIS on 31 May 2024. Client migration is now practically complete. On 19 December 2024, Crédit Agricole S.A. announced the signature of an agreement to acquire Santander’s 30.5% non-controlling stake in CACEIS, with the aim of full ownership.
Assets under custody increased by +4.5% at end-December 2024 compared with end September 2024, and by +12.1% compared with end December 2023, to reach €5,291 billion. Assets under administration also increased by +0.3% this quarter and were up +3.0% year-on-year, totalling €3,397 billion at end December 2024.
Results of the Large Customers division
In the fourth quarter of 2024, stated revenues of the Large Customers division once again reached a record level, with €2,108 million, up +8.9% compared with the fourth quarter of 2023, buoyed by an excellent performance in the Corporate and Investment Banking and Asset Servicing business lines.
Operating expenses increased (+7.4%) compared with the fourth quarter of 2023, due to IT investments and business development. As a result, the division’s gross operating income was up +11.6% compared with the fourth quarter of 2023 to €810 million. The division recorded an overall net provision for cost of risk of -€93 million in the fourth quarter of 2024, compared with additions of -€39 million in the fourth quarter of 2023. Stated pre-tax income totalled €723 million, an increase over the period (+4.7%). The tax charge was -€166 million. Lastly, stated Net income Group share came to €512 million in the fourth quarter of 2024, compared with stated income of €525 million in Q4 2023.
Over full-year 2024, stated revenues of the Large Customers division was a record high of €8,651 million, up +11.2% compared with the 2023 total. At -€5,039 million, operating expenses excluding SRF rose +11.8% compared with the same period in 2023, due mainly to IT investments and business development. Expenses for the year include ISB integration costs of -€97 million. Gross operating income stood at €3,612 million for full-year 2024, representing an increase of +22.0% compared to 2023. Over the period, the cost of risk recorded a net addition of -€117 million, compared to an addition of -€120 million in the same period in 2023. The business line’s contribution to stated Net income Group share was €2,448 million, a strong increase of +21.7% compared to full-year 2023.
The business line contributed 32% to the underlying net income Group share of Crédit Agricole S.A.’s core businesses (excluding the Corporate Centre division) at end-December 2024 and 31% to underlying revenues excluding the Corporate Centre.
At 31 December 2024, the equity allocated to the division was €14 billion and its risk-weighted assets were €147.8 billion.
Underlying RoNE (return on normalised equity) stood at 17.7% at the end of December 2024.
Corporate and Investment Banking results
In the fourth quarter of 2024, Corporate and Investment Banking stated revenues reached a record at €1,573 million, up +7.7% from the fourth quarter of 2023. This was a record fourth quarter for Corporate and Investment Banking. The specific items had an impact of -€23.7 million in the fourth quarter of 2024 (compared to +€7.8 million in the fourth quarter of 2023) and comprised the DVA, the issuer spread portion of the FVA, and secured lending for -€25.6 million (compared to +€6.0 million in the fourth quarter of 2023) and loan book hedging totalling +€1.9 million (compared to +€1.8 million in the fourth quarter of 2023).
Operating expenses rose by +6.3% to -€902 million, mainly due to IT investments and the development of business line activities. Gross operating income rose sharply by +9.7% compared to the fourth quarter of 2023, taking it to a high level of +€671 million. The cost/income ratio was 57.4%, a slight change of -0.8 percentage point over the period. The cost of risk recorded a net addition of -€86 million, higher than the fourth quarter 2023 (-€32 million). This level of allocations is driven by model effects. The overall level remains low with a cost of risk/outstandings of 7 basis points66. Lastly, pre-tax income in the fourth quarter of 2024 stood at €586 million, versus €580 million in the fourth quarter of 2023 (up +1.0%). The tax charge stood at -€139 million. Lastly, stated net income Group share was down -7.1% at €437 million in the fourth quarter of 2024.
In 2024, stated revenues were up +7.6% to a record level of €6,568 million for the year, with balanced growth between Corporate and Investment Banking and on a very good level recorded for full-year 2023. The specific items over the period had an impact of +€28.5 million (compared to -€38.9 million in 2023) and comprised the DVA, the issuer spread portion of the FVA, and secured lending for +€20.2 million (compared to -€14.6 million in 2023) and loan book hedging totalling +€8.2 million, (compared to -€24.3 million in 2023).
Operating expenses excluding SRF rose +5.4%, mainly due to variable compensation and investments in IT and employees to support the development of the business lines. The cost/income ratio of 53.7% remained contained and below the MTP target. As a result, gross operating income of €3,040 million was up sharply (+22.3% compared with full-year 2023.) The cost of risk recorded a net addition of -€93 million for 2024, compared to a net addition of -€111 million for 2023. The income tax charge stood at -€748 million, up +29.4%. Lastly, stated net income Group share totalled €2,152 million for 2024, an increase of +22.7% over the period.
Risk weighted assets at the end of December 2024 amounted to €136.9 billion, up by +€8.3 billion compared to the end of September 2024, notably due to an unfavourable foreign exchange impact and rating.
Asset servicing results
In the fourth quarter of 2024, the revenues of Asset Servicing were up +12.7% compared to the fourth quarter of 2023, totalling €535 million. This rise was driven by high fee and commission income, itself driven by the increase in assets and by the favourable trend in net interest margin. Operating expenses rose by +9.8% to -€396 million, including -€2.7 million in scope effects linked to the consolidation of the remaining ISB entities and -€26.6 million in ISB integration costs restated as specific items (-€24.9 million in integration costs in the fourth quarter of 2023). Excluding these effects, the increase in expenses was +9.3% compared to the third quarter of 2023, linked to IT expenses and business growth. As a result, gross operating income was up by +21.7% to €139 million in the fourth quarter of 2024. Thus, the cost/income ratio stood at 74%, down -1.9 percentage point. Excluding ISB integration costs, it stood at 69.0%. Net income thus totalled €110 million, up +36.9% compared with the fourth quarter of 2023. Adjusted for the €35 million share of non-controlling interests, the business line’s contribution to net income Group share totalled €75 million in the fourth quarter of 2024, up +36.4% compared with the fourth quarter of 2023.
In 2024, revenues totalled €2,083 million, up +24.2% compared to the same period in 2023, buoyed by the integration of ISB, strong commercial momentum and a favourable trend in the interest margin over the period. Costs excluding SRF increased by +30.1% and stood at €1,511 million. They included a scope effect of -€207 million over the first six months of 2024 and -€97 million in ISB integration costs. Gross operating income was up +20.4% compared to full year 2023. The cost/income ratio stood at 72.6%, up 3.3 points compared to 2023. Excluding ISB integration costs, the cost/income ratio stood at 67.9%. Net income thus rose by +15.8%. The overall contribution of the business line to net income Group share at the end of December 2024 was €296 million, representing a +15.1% increase compared to full year 2023.
Specialised financial services activity
The commercial production of Crédit Agricole Personal Finance & Mobility (CAPFM) totalled €11.7 billion in the fourth quarter of 2024. This represents a decrease, mainly due to the Chinese market, of -2.9% compared to fourth quarter 2023. The share of automotive financing67 in quarterly new business production stood at 50.2% this quarter. The average customer rate for production was up +5 basis points from the third quarter of 2024. CAPFM’s assets under management stood at €119.3 billion at the end of December 2024, up +5.6% compared to the end of December 2023, driven by all activities (Automotive +8.2%68 with Crédit Agricole Auto Bank and Leasys, LCL and Regional Banks +5.3%; Other entities +3.2%). Lastly, consolidated outstandings totalled €69.1 billion at the end of December 2024, up +3.3% compared to the fourth quarter of 2023.
In January 2025, CAPFM announced the finalisation of the acquisition of 50% of GAC Leasing.
Crédit Agricole Leasing & Factoring (CAL&F) commercial production increased by +15.7% compared to the fourth quarter of 2023. It was driven by property leasing and renewable energy financing. Leasing outstandings rose +7.2% year-on-year, both in France (+5.9%) and internationally (+12.3%), to reach €20.3 billion at the end of December 2024 (of which €16.0 billion in France and €4.3 billion internationally). Commercial factoring production was up sharply, recording a twofold increase compared to the fourth quarter of 2023. It was driven by the signing of significant contracts both in France, where production increased by +32.5% in the fourth quarter of 2024 compared to the fourth quarter of 2023, and internationally, where production was multiplied by a factor of 3.5 in the fourth quarter of 2024 compared to the fourth quarter of 2023. Factoring outstandings at end-December 2024 were up +3.7% compared to end-December 2023, and factored revenues were up by +6.9% compared to the same period in 2023.
Specialised financial services’ results
The revenues of the Specialised Financial Services division were €915 million in the fourth quarter of 2024, up +4.0% compared to the fourth quarter of 2023. Expenses amounted to -€447 million, down -0.5% versus fourth quarter 2023 and down -1.4% excluding the base effect69 related to the reorganisation of the Mobility activities at CAPFM in the fourth quarter of 2023. The cost/income ratio stood at 48.8%, up -2.2 percentage points compared to the same period in 2023. Gross operating income thus came to €468 million, up +8.6% compared to the fourth quarter of 2023. Cost of risk amounted to -€306 million, up +66.2% compared to the fourth quarter of 2023, with this quarter including model revisions at CAPFM, essentially leading to a -€50 million deterioration in unproven risk, and a -€30 million provision for legal risk of which UK car loans. Net income from equity-accounted entities rose +8.4% compared to the fourth quarter of 2023 to €43 million, with this quarter including around €14 million in non-recurring items. The change in value of goodwill was €0 million vs. €12 million in the fourth quarter of 2023, and excluding the base effect69 related to the reorganisation of Mobility activities at CAPFM, there was no change. The division’s Net income Group share amounted to €124 million, down -43.1% compared to the same period in 2023, and down -8.4% excluding the base effect69 related to the reorganisation of Mobility activities at CAPFM and excluding provisions for legal risks and model revisions in Q4-24 at CAPFM.
Over 2024, revenues for the Specialised Financial Services division fell by -2.2%, but rose by +6.8% excluding the base effect70 related to the reorganisation of the Mobility activities at CAPFM, compared to 2023. This favourable trend was driven by a good performance in CAL&F (+6.8%) and by higher revenues for CAPFM excluding the base effect70 (+6.8%), benefiting from the scope effects linked to the strategic pivot around Mobility at CAPFM, which led to the 100% consolidation of Crédit Agricole Auto Bank from the second quarter of 2023 and of ALD and LeasePlan activities in six European countries, as well as the acquisition of a majority stake in the capital of Hiflow in the third quarter of 2023. Costs excluding SRF increased by +6.4% compared to 2023. Expenses excluding SRF, the base effect70 and scope effects rose by +2.3%. The cost/income ratio stood at 50.6%, or +4.1 percentage points versus the same period in 2023; excluding the base effect70, the change was +0.3 percentage points. Cost of risk increased by +10.1% compared to 2023, to -€958 million, and increased by +21.9% excluding the base effect70.This rise notably includes the impact of scope effects as well as -€50 million due to model revisions and a -€30 million provision for legal risk of which UK car loans in the fourth quarter of 2024 at CAPFM. The contribution from equity-accounted entities was down -3.3% versus the same period in 2023, and down -25.5% excluding the base effect70, due to the full consolidation of Crédit Agricole Auto Bank in the second quarter of 2023, which was previously accounted for using the equity method. Net income on other assets amounted to -€12 million at the end of December 2024, compared to €71 million at the end of December 2023 and -€18 million excluding the base effect70. The change in value of goodwill was €0 million for 2024 vs. €12 million for 2023, and excluding the base effect70 related to the reorganisation of the Mobility activities at CAPFM, there was no change. Net income Group share thus came to €625 million, down -26.6% compared to 2023, and down -7.5% excluding the base effect70 related to the reorganisation of the Mobility activities at CAPFM.
The business line contributed 8% to the underlying net income Group share of Crédit Agricole S.A.’s core businesses (excluding the Corporate Centre division) at end-December 2024 and 13% to underlying revenues excluding the Corporate Centre.
At 31 December 2024, the equity allocated to the division was €7.2 billion and its risk-weighted assets were €76.2 billion.
The underlying RoNE (return on normalised equity) stood at 8.1% for the 12 months of 2024.
Personal Finance and Mobility results
CAPFM revenues reached €722 million in the fourth quarter of 2024, up +4.5% compared to the fourth quarter of 2023, with a positive price effect thanks in particular to the production margin rate, which improved by +75 basis points in the fourth quarter of 2024 compared to the fourth quarter of 2023 (up +31 basis points compared to the third quarter of 2024), and with around €30 million in non-recurring items in the fourth quarter of 2024. Expenses were down by -0.7% and stood at -€347 million. They were down by -1.9% excluding the base effect71 related to the reorganisation of the Mobility activities compared to the same period in 2023. Gross operating income stood at €375 million, up +9.9%. The cost/income ratio stood at 48.1%, or -2.5 percentage points versus the same period in 2023 and -3.2 percentage points excluding the base effect71 related to the reorganisation of the Mobility activities. Cost of risk increased by +68.4% to -€286 million compared to the fourth quarter of 2023, with this quarter including model revisions leading essentially to a -€50 million deterioration in unproven risk, and a -€30 million provision for legal risk of which UK car loans. The cost of risk/outstandings thus stood at 127 basis points72, a deterioration of +6 basis points compared to the fourth quarter of 2023. The Non Performing Loans ratio was 4.7% at the end of December 2024, up +0.2 percentage point compared to the end of September 2024, while the coverage ratio reached 73.2%, down -1.0 percentage point compared to the end of September 2024. The contribution from equity-accounted entities rose by +9.7% compared to the same period in 2023. Excluding the base effect71 related to the reorganisation of the Mobility activities, the change in value of goodwill is zero, it stood at €12 million in the fourth quarter of 2023. As a result, net income Group share totalled €74 million in the fourth quarter of 2024, i.e. -56.2% compared to the same period the previous year. Excluding the base effect71 and excluding the legal provisions and model revisions, net income Group share was down -11.7%.
In 2024, CAPFM’s revenues totalled €2,764 million, down -4.3% compared with 2023, but up +6.8% excluding the base effect related to the reorganisation of the Mobility activities73. Revenues benefited from scope effects related to the strategic pivot around Mobility that had resulted in the full consolidation of Crédit Agricole Auto Bank from the second quarter of 2023, the acquisition of ALD and LeasePlan activities in six European countries, and the acquisition of a majority stake in the capital of Hiflow in the third quarter of 2023. Expenses excluding SRF stood at -€1,382 million, an increase of +7.0% on 2023. Expenses excluding SRF, excluding the base effect73 and scope effects, were up +1.7%. Gross operating income therefore came in at €1,382 million, which was a drop of -12.8% but an increase of +6.4% excluding the base effect73. The cost/income ratio stood at 50.0%, or +5.3 percentage points versus the same period in 2023; excluding the base effect73, the change was +0.7 percentage points. Cost of risk increased by +8.6% compared with 2023, to -€877 million, and rose +21.3% when the base effect73 is excluded. This rise notably includes the impact of scope effects as well as a model revision leading essentially to a -€50 million deterioration in unproven risk, and a -€30 million provision for legal risk of which UK car loans. The contribution from equity-accounted entities was down -0.8% versus the same period in 2023, and down -22.9% excluding the base effect73 related to the scope effects of Crédit Agricole Auto Bank, which was fully consolidated in the second quarter of 2023 having previously been accounted for using the equity method. Net income on other assets was down -€82.1 million between 2024 and 2023. However, excluding the base effect73, it was up +€7 million. The change in value of goodwill was €0 million for 2024 against €12 million for 2023, and excluding the base effect73 related to the reorganisation of the Mobility activities, there was no change. As a result, net income Group share stood at €422 million for 2024, a decline of -37.5% from the same period one year earlier. Excluding the base effect73, net income Group share was down -15.4% from the same period in 2023.
Leasing & Factoring results
CAL&F’s revenues totalled €193 million, up +1.9% compared with the fourth quarter of 2023. This increase was driven by factoring, which benefited from positive volume effects (increase in factored revenues). Expenses remained stable with an increase of +0.4%, while the cost/income ratio stood at 51.7%, an improvement of -0.8 percentage points from the fourth quarter of 2023. Gross operating income rose +3.5% to €93 million, with a positive jaws effect of +1.5 percentage points. Cost of risk totalled -€20 million, up +40.1% compared to the same period in 2023. This rise was mainly due to the small business and SME markets. Cost of risk/outstandings stood at 24 basis points72, up +4 basis points compared to fourth quarter 2023. As a result, net income Group share was €50 million, up +1.7% compared with the fourth quarter of 2023.
In 2024, revenues totalled €756 million, an increase of +6.8% compared to 2023. Costs excluding SRF increased by +4.3% to €398 million. Gross operating income rose significantly, +15.1% compared to 2023, to €358 million. The underlying cost/income ratio excluding SRF amounted to 52.6%, an improvement of -1.2 percentage points compared to 2023. The cost of risk increased by +29.7%, compared to the same period in 2023, to -€81 million. Net income Group share was €203 million, up +15.0% compared to the year 2023.
Crédit Agricole S.A. Retail Banking activity
Activity in Crédit Agricole S.A.’s Retail Banking business was solid during the quarter, with an increasing number of customers taking out insurance policies. Home loan production in France is steadily recovering, while continuing to rise for corporate loans. Outside France, loan activity was dynamic.
Retail banking activity in France
In the fourth quarter of 2024, activity remained strong with the upturn in mortgage lending and non-remunerated demand deposits which rose over the quarter. Customer acquisition is dynamic, with 60,000 new customers this quarter.
The equipment rate for car, multi-risk home, health, legal, all mobile devices or personal accident insurance rose by +0.4 percentage points to stand at 27.9% at end-December 2024.
Loan production totalled €8.5 billion, representing a year-on-year increase of +34.2%. The fourth quarter of 2024 confirmed the recovery in home loan production (+59.3% compared to the fourth quarter of 2023 and +10.6% compared to the third quarter of 2023), boosted by the proactive pricing policy. The average production rate for home loans came to 3.24%, down -14 basis points from the third quarter of 2024 and -92 basis points year on year. The home loan stock rate improved by +5 basis points over the quarter and by +18 basis points year on year. The strong momentum continued in the corporate market (+28.9% year on year) and the small business market (+19.3% year on year) but slowed for the consumer segment (-8.2%), in a challenging economic environment.
Outstanding loans stood at €171 billion at end-December 2024, representing a +1.1% increase quarter-on-quarter and year-on-year (of which +1.3% for home loans, +0.8% for loans to professionals, +0.7% for loans to corporate). Customer assets totalled €255.0 billion at end-December 2024, up +3.0% year on year, driven by non-remunerated deposits and off-balance sheet funds. Customer assets also rose +0.7% during the quarter, thanks to the increase in demand deposit volumes (+1.1% compared with end-September 2024) in a still-uncertain environment, as well as term deposits (+1.2% compared with end-September 2024). Off-balance sheet deposits benefited from a positive year-on-year market effect across all segments and positive net inflows in life insurance.
Retail banking activity in Italy
In the fourth quarter of 2024, CA Italia posted gross customer capture of 45,000.
Loan outstandings at CA Italia stood at €62.1 billion at end-December 202474, up +1.7% compared with end-December 2023. This was despite the downturn in the Italian market75, driven by the retail segment, which posted an increase in outstandings of 3.2%, and the corporate segment, which recorded an increase in outstandings of 3.6%. Loan production, buoyed by the solid momentum in all markets, rose +4.5% compared with the fourth quarter of 2023. Home loan production was good but nevertheless recorded a decline compared to a very high fourth quarter in 2023 (-6.3%). The loan stock rate fell by -20 bp on the third quarter of 2024, but was down less sharply than market rates.
Customer assets at end-December 2024 totalled €120 billion, up +3.6% compared with end-December 2023; on-balance sheet deposits were relatively unchanged from the previous year at +0.5%, while the cost of ressources decreased. Lastly, off-balance sheet deposits rose +7.7%, benefiting from a market effect and positive net inflows.
CA Italia’s equipment rate in car, multi-risk home, health, legal, all mobile devices or personal accident insurance increased to 20.0%, up 1.2 percentage points compared with the fourth quarter of 2023.
Crédit Agricole Group activity in Italy76
The Group’s business lines in Italy continued to grow throughout 2024. They served 6.1 million customers at end-December 2024, and the Group’s market share stood at 5%77 in Italy at end-2024.
Crédit Agricole Italia has the best NPS among commercial banks.78 The Group’s business lines were ranked 2nd in consumer finance79, 3rd in asset management80, and 4th in life bancassurance81.
Loans outstanding stood at €102 billion at end-December 2024 (+2% versus end-December 2023). Total customer assets stood at €340 billion at end-December 2024 (+2.7% compared to end-December 2023).
International Retail Banking activity excluding Italy
For International Retail Banking excluding Italy, loan outstandings were stable at -0.2% at current exchange rates at end-December 2024 compared with end-December 2023 (+5.2% at constant exchange rates). Customer assets rose by +1.2% over the same period at current exchange rates (+8,9% at constant exchange rates).
In Poland in particular, loan outstandings increased by +3.8% versus December 2023 (+2.1% at constant exchange rates) and customer assets by +7.5% (+9.3% at constant exchange rates), against a backdrop of fierce competition for deposits. Loan production in Poland also remained strong, rising +9% compared with the fourth quarter of 2023 at current exchange rates (+6.3% at constant exchange rates).
In Egypt, loan outstandings fell -16.4% between end-December 2024 and end-December 2023 (+29.3% at constant exchange rates). Over the same period, inflows fell by -26.8% but were still up +13.2% at constant exchange rates.
The surplus of deposits over loans in Poland and Egypt amounted to €2.4 billion at 31 December 2024, and totalled €4.1 billion including Ukraine.
French retail banking results
In the fourth quarter of 2024, LCL’s revenues stood at €960 million, stable (+0.1%) compared with the fourth quarter of 2023 (+0.8% excluding the reversal of the provision for Home Purchase Saving Plans in the fourth quarter of 202382). The increase in fee and commission income (+8.4% Q4/Q4) was driven by all activities (excluding securities management), but mainly by strong momentum in cash flow and card premiums. NIM was down -7.7% Q4/Q4 (-6.6% excluding the reversal of the provision for Home Purchase Saving Plans in the fourth quarter of 202382). This quarter, the net interest margin was boosted by higher lending yields (stock repricing +18 bp Q4/Q4 and +5 bp Q4/Q3) making it possible to offset the increased cost of resources and a lower contribution from macro-hedging.
Expenses were down by -1.1% and stood at -€647 million, benefiting in particular from a positive base effect (non-recurring items recorded in Q4 2023 including provisions on HR, property and IT components) making it possible to offset continued investments linked to IT and external expenditure (marketing, communication). The cost/income ratio stood at 67.4%, down 0.8 percentage point compared to fourth quarter 2023. Gross operating income rose by +2.7% to €313 million.
The cost of risk was down -19.3% compared with the fourth quarter of 2023 to -€78 million (including -€42 million in cost of risk on performing loans, -€36 million in proven risk), cost of risk/outstandings remained stable at 22 basis points, in a context of a deterioration for SMEs and small businesses. The coverage ratio stood at 62.6% at end-December 2024 (+2.8 percentage point compared with end-September 2024). The non-performing loans ratio was 2.0% at end December 2024, -0.1 percentage point compared to end September 2024. As a result, net income Group share increased by +13.1% compared with the fourth quarter of 2024 (+16.3% excluding the Home Purchase Saving Plan base effect82).
For the year 2024, LCL revenues were up +0.6% compared to 2023, totalling €3,872 million (+2.6% excluding the Home Purchase Saving Plan base effect83). The net interest margin was down -1.6% (+1.3% excluding the Home Purchase Saving Plan base effect83), benefiting from gradual loan repricing, making it possible to offset the increased cost of resources. Fee and commission income was up +2.7% compared to 2024 (+3.9% excluding the Cheque Image base effect84 in 2023), particularly on life insurance segments supported by the increase in assets in a positive market context, on non-life insurance linked to property and casualty insurance, and on payment instruments and account management. Costs excluding SRF were up +2.2% due to continued investments linked to IT and external expenditure (marketing, communication). The cost/income ratio excluding SRF stood at 63.2% (+1.0 percentage point compared with 2023). Gross operating income grew by +1.0% year on year. Cost of risk increased by +24.0%, impacted by the rise in proven risk on the corporate market, including corporate-specific files and on the retail market (small businesses and consumer finance). All in all, the business line’s contribution to net income Group share stood at €790 million, down -5.4% (+1.8% excluding the Home Purchase Saving Plan base effect and Cheque Image fine reversal)
In all, the business line contributed 10% to the underlying net income Group share of Crédit Agricole S.A.’s core businesses (excluding the Corporate Centre division) in 2024 and 14% to underlying revenues excluding the Corporate Centre.
At 31 December 2024, the equity allocated to the business line stood at €5.4 billion and risk-weighted assets amounted to €56.8 billion. LCL’s underlying return on normalised equity (RoNE) stood at 13.7% in 2024.
International Retail Banking results85
In the fourth quarter of 2024, revenues for International Retail Banking totalled
€969 million, stable (-0.5% at current exchange rates, +2.8% at constant exchange rates) compared with the fourth quarter of 2023. Operating expenses were under control at €568 million, down -9.5% (-8.3% at constant exchange rates). Gross operating income consequently totalled €401 million, up +15.7% (+24.6% at constant exchange rates) for the period. Cost of risk amounted to -€100 million, down -2.5% compared with the fourth quarter of 2023 (-0.5% at constant exchange rates).
All in all, net income Group share for CA Italia, CA Egypt, CA Poland and CA Ukraine amounted to €158 million in the fourth quarter of 2024, up +54% (+68.6% at constant exchange rates).
For full-year 2024, International Retail Banking revenues rose by +2.8% to €4,059 million (+1.0% at constant exchange rates). Expenses excluding SRF were under control at -€2,148 million, an increase of +1.4% on 2023. Gross operating income totalled €1,911 million, up +6.7% (+5.3% at constant exchange rates). The cost of risk fell by -32.5% (-21.2% at constant exchange rates) -€313 million compared to 2023. All in all, net income Group share of International Retail Banking was €836 million, compared with €703 million in 2023.
In full-year 2024 the International Retail Banking business line contributed 11% to the underlying net income Group share of Crédit Agricole S.A’s core businesses. (excluding the Corporate Centre) and 15% to underlying revenues excluding the Corporate Centre.
As at 31 December 2024, the capital allocated to International Retail Banking was €4.5 billion and risk-weighted assets totalled €46.9 billion.
Results in Italy
In fourth quarter 2024, Crédit Agricole Italia’s revenues stood at €733 million, up +2.7% from fourth quarter 2023. The net interest margin was relatively stable from fourth quarter 2023 (-0.2% compared to fourth quarter 2023) and fee and commission income (-0.1%) benefited from the strong momentum of fee and commission income on assets under management (+18.8% compared to fourth quarter 2023). Operating expenses, excluding DGS, were stable at +0.8% compared to the fourth quarter of 2023.
Cost of risk amounted to -€76 million in the fourth quarter of 2024, down -21.2% from the fourth quarter of 2023, and corresponded almost entirely to provisions for proven risk. Cost of risk/outstandings86 stood at 40 basis points, an improvement of four basis points compared with the third quarter of 2024. The Non Performing Loans ratio improved compared with the third quarter of 2024 to stand at 2.9%, while the coverage ratio was 75.1% (+1.5 percentage points compared with the third quarter of 2024). Net income Group share for CA Italia was €112 million, up +74.3% compared to the fourth quarter of 2023.
In full-year 2024, revenues for Crédit Agricole Italia rose by +1.3% to €3,056 million. Expenses excluding SRF and DGS (deposit guarantee fund in Italy) were under control at €1,602 million, up +0.1% compared with full-year 2023. Gross operating income stood at €1,396 million, a slight increase of +6.1% compared to 2023. The cost of risk amounted to -€246 million, down -25.5% compared to 2023. As a result, the net income Group share of CA Italia totalled €608 million, an increase of +12.7% compared to 2023.
CA Italy’s underlying RoNE (return on normalised equity) was 20,8% at 31 December 2024.
Results for Crédit Agricole Group in Italy87
For full-year 2024, the underlying net income Group share of entities in Italy was €1,254 million, up 20% compared to 2023. This reflects the ongoing momentum of the various business lines, particularly Retail Banking, Asset Gathering, and Large Customers. The breakdown by business line is as follows: Retail Banking 49%; Specialised Financial Services 18%; Asset Gathering and Insurance 21%; and Large Customers 12%. Lastly, Italy’s contribution to the net income Group share of Crédit Agricole S.A. in full-year 2024 was 16%.
International Retail Banking results – excluding Italy
In the fourth quarter of 2024, revenues for International Retail Banking excluding Italy totalled €236 million, up -9.3% (+3.3% at constant exchange rates) compared to the fourth quarter of 2023. Revenues in Poland were up +2.5% on the fourth quarter of 2023 (+0.1% at constant exchange rates), boosted by a higher net interest margin. Revenues in Egypt fell (-21.5% compared with the fourth quarter of 2023) due to foreign exchange rate movements (depreciation of the Egyptian pound) but were particularly buoyant at constant exchange rates (+25%), benefiting from a sharp increase in the interest margin. Operating expenses for International Retail Banking excluding Italy amounted to €126 million, down -1.3% compared with the fourth quarter of 2023 (+5.1% at constant exchange rates). Gross operating income amounted to €110 million, a decrease of -17.1% (+1.9% at constant exchange rates) compared with the fourth quarter of 2023. The cost of risk was stable at -€24 million, versus -€6 million in fourth quarter 2023. Furthermore, at end December 2024, the coverage ratio for loan outstandings remained high in Poland and Egypt, at 124% and 151% respectively. In Ukraine, the local coverage ratio remains prudent (409%). All in all, the contribution of International Retail Banking excluding Italy to net income Group share was €46 million, up 20.2% compared with the fourth quarter of 2023 at current exchange rates (+56.4% at constant exchange rates).
In full-year 2024, revenues for International Retail Banking excluding Italy totalled €1,003 million, up +7.7% (+19.0% at constant exchange rates) compared to 2023, driven by the increase in the net interest margin. Revenues in Poland increased dynamically by +21% compared to 2023 (+15% at constant exchange rates) driven by net interest margin and commissions. Revenues in Egypt decreased slightly by -3% at current exchange rates compared to 2023, taking into account the evolution of exchange rates (in a context of devaluation of the EGP currency) but remain very well oriented at constant exchange rates (+43% compared to 2023), benefiting from a strong increase in the interest margin. Operating expenses amounted to -€488 million, up +6.9% compared with 2023 (+10.6% at constant exchange rates). The cost/income ratio at end-December 2024 was 48.6% (an improvement of 0.4 points on the cost/income ratio at end-December 2023). Thanks to strong growth in revenues, gross operating income came to €515 million, up 8.5% (+28.1% at constant exchange rates) from 2023. Cost of risk amounted to -€67 million, down -50.0% (-49.1% at constant exchange rates) compared to 2023. All in all, International Retail Banking excluding Italy contributed €228 million to net income Group share.
The underlying RoNE (return on normalised equity) of Other IRB (excluding CA Italy) stood at 29.5% at 31 December 2024.
At 31 December 2024, the entire Retail Banking business line contributed 21% to the underlying net income Group share of Crédit Agricole S.A.’s core businesses (excluding the Corporate Centre division) and 29% to underlying revenues excluding the Corporate Centre.
At 31 December 2024, the division’s equity amounted to €9.9 billion. Its risk-weighted assets totalled €103.7 billion.
Corporate Centre results
The net income Group share of the Corporate Centre was +€18 million in the fourth quarter of 2024, up +€236 million compared with the fourth quarter of 2023. The positive contribution of the Corporate Centre division can be analysed by distinguishing between the “structural” contribution (-€26 million) and other items (+€44 million).
The contribution of the “structural” component (-€26 million) was up by +€193 million compared with the fourth quarter of 2023 and can be broken down into three types of activity:
- The activities and functions of the Corporate Centre of the Crédit Agricole S.A. Parent Company. This contribution amounted to -€354 million in the fourth quarter of 2024, down -€116 million, mainly due to a negative corporate income tax catch-up effect of -€91 million.
- The business lines that are not part of the core businesses, such as CACIF (private equity), CA Immobilier, CATE and BforBank (equity-accounted). They contributed +€315 million in the fourth quarter 2024, up +€297 million from the fourth quarter of 2023. This was due to the negative impact of the revaluation of Banco BPM shares for +234 million in revenues (+€271m in the fourth quarter of 2024 compared to +€37m in the fourth quarter of 2023), as well as an interim dividend of +€60 in revenues.
- Group support functions. Their contribution amounted to +€12 million this quarter (+€12 million compared with the fourth quarter of 2023).
The contribution of “other items” was up +€43 million compared with the fourth quarter of 2023.
The “internal margins” effect at the time of the consolidation of the insurance activity at the Crédit Agricole level was accounted for through the Corporate Centre. Over the quarter, the impact of internal margins was -€198 million in revenues and +€198 million in expenses.
Over 2024, the underlying net income Group share of the Corporate Centre division was -€488 million, up +€105 million compared with 2023. The structural component contributed -€539 million, and other items of the division recorded a positive contribution of +€51 million over the year.
The “structural” component contribution was up €160 million compared with 2023 and can be broken down into three types of activities:
- The activities and functions of the Corporate Centre of the Crédit Agricole S.A. Parent Company. This contribution amounted to -€1,120 million in 2024, down -€202 million compared to 2023, including a base effect of -€171 million related the reversal of the provision for Home Purchase Saving Plans recognised in the third quarter of 2023 as well as -€42 million relating to the reversal of the Cheque Image Exchange fine in the second quarter of 2023;
- Business lines not attached to the core businesses, such as CACIF (private equity) and CA Immobilier and BforBank: their contribution, which stood at +€549 million in 2024, was up +€343 on 2023. This increase was primarily due to the end of the SRF building-up period (+€77 million) and the impact of the valuation and dividend of Banco BPM shares for +€387 million;
- The Group’s support functions: their contribution for 2024 was +€32 million, up +€19 million compared to 2023.
The contribution of “other items” was down -€55 million compared to 2023.
The “internal margins” effect at the time of the consolidation of the insurance activity at the Crédit Agricole level was accounted for through the Corporate Centre. Over the year, the impact of internal margins was -€832 million in revenues and +€832 million in expenses.
At 31 December 2024, risk-weighted assets stood at €30.0 billion.
Financial strength
Crédit Agricole Group
At 31 December 2024, the phased-in Common Equity Tier 1 (CET1) ratio of Crédit Agricole Group was 17.2%, a decrease of -0.2 percentage point compared to end-September 2024. Therefore, the Crédit Agricole Group posted a substantial buffer of 7.4 percentage points between the level of its CET1 ratio and the 9.8% SREP requirement. The fully loaded CET1 ratio was 17.1%.
During the fourth quarter 2024:
- The CET1 ratio benefited from an impact of +25 basis points related to retained earnings.
- Changes in risk weighted assets related to business line organic growth impacted the Group’s CET1 ratio by -28 basis points (see below), mainly due to a rating effect of -15 basis points.
- Methodology, M&A and other effects had a negative impact of -14 basis points and included, in particular, the -12 basis point Basel 4 impact relating to the consolidation of leasing activities.
The phased-in Tier 1 ratio stood at 18.3%, while the phased-in total ratio was 20.9% at end-December 2024.
The phased-in leverage ratio stood at 5.5%, remaining stable compared with end-September 2024, well above the regulatory requirement of 3.5%.
Risk-weighted assets for the Crédit Agricole Group amounted to €653 billion, up +€17.5 billion compared with 30 September 2024. The change can be broken down by business line as follows: Retail Banking +6.9 billion (including +4.1 billion in negative rating effects on LCL and the Regional Banks, Asset Gathering -1.3 billion, Specialised Financial Services +4.3 billion, Large Customers +7.3 billion (impacted by foreign exchange and negative rating effects) and Corporate Centre +0.3 billion.
Maximum Distributable Amount (MDA and L-MDA) trigger thresholds
The transposition of Basel regulations into European law (CRD) introduced a restriction mechanism for distribution that applies to dividends, AT1 instruments and variable compensation. The Maximum Distributable Amount (MDA, the maximum sum a bank is allowed to allocate to distributions) principle aims to place limitations on distributions in the event the latter were to result in non-compliance with combined capital buffer requirements.
The distance to the MDA trigger is the lowest of the respective distances to the SREP requirements in CET1 capital, Tier 1 capital and total equity.
At 31 December 2024, Crédit Agricole Group posted a buffer of 666 basis points above the MDA trigger, i.e. €44 billion in CET1 capital.
Failure to comply with the leverage ratio buffer requirement would result in a restriction of distributions and the calculation of a maximum distributable amount (L-MDA).
At 31 December 2024, Crédit Agricole Group posted a buffer of 197 basis points above the L-MDA trigger, i.e. €43 billion in Tier 1 capital. At the Crédit Agricole Group level, it is the distance to the L-MDA trigger that determines the distance to distribution restriction.
At 31 December 2024, Crédit Agricole S.A. posted a buffer of 296 basis points above the MDA trigger, i.e. 12 billion in CET1 capital. Crédit Agricole S.A. is not subject to the L-MDA requirement.
TLAC
Crédit Agricole Group must comply with the following TLAC ratio requirements at all times:
- a TLAC ratio above 18% of risk-weighted assets (RWA), plus – in accordance with EU directive CRD 5 – a combined capital buffer requirement (including, for Crédit Agricole Group, a 2.5% capital conservation buffer, a 1% G-SIB buffer, the counter-cyclical buffer set at 0.77% and the 0.05% systemic risk buffer for CA Group at 31 December 2024). Considering the combined capital buffer requirement, Crédit Agricole Group must adhere to a TLAC ratio of above 22.3%;
- a TLAC ratio of above 6.75% of the Leverage Ratio Exposure (LRE).
The Crédit Agricole Group’s 2025 target is to maintain a TLAC ratio greater than or equal to 26% of RWA excluding eligible senior preferred debt.
At 31 December 2024, Crédit Agricole Group’s TLAC ratio stood at 26.9% of RWA and 8.0% of leverage ratio exposure, excluding eligible senior preferred debt88, which is well above the requirements. The TLAC ratio, expressed as a percentage of risk-weighted assets, decreased by 40 basis points over the quarter, due to risk-weighted assets increasing more rapidly than equity and eligible items over the period. Expressed as a percentage of leverage exposure (LRE), the TLAC ratio was down 20 basis points compared with September 2024.
The Group thus has a TLAC ratio excluding eligible senior preferred debt that is 460 basis points higher, i.e. €30 billion, than the current requirement of 22.3% of RWA.
At end-December 2024, €10.4 billion equivalent had been issued in the market (senior non-preferred and Tier 2 debt) as well as €2.5 billion of AT1. The amount of Crédit Agricole Group senior non-preferred securities taken into account in the calculation of the TLAC ratio was €34.5 billion.
MREL
The required minimum levels are set by decisions of resolution authorities and then communicated to each institution, then revised periodically. At 31 December 2024, Crédit Agricole Group has to meet a minimum total MREL requirement of:
- 22.01% of RWA, plus – in accordance with EU directive CRD 5 – a combined capital buffer requirement (including, for Crédit Agricole Group, a 2.5% capital conservation buffer, a 1% G-SIB buffer, the counter-cyclical buffer set at 0.77% and the 0.05% systemic risk buffer for CA Group at 31 December 2024). Considering the combined capital buffer requirement, the Crédit Agricole Group has to meet to a total MREL ratio of above 26.3%;
- 6.25% of the LRE.
At 31 December 2024, the Crédit Agricole Group had a total MREL ratio of 32.4% of RWA and 9.7% of leverage exposure, well above the requirement.
An additional subordination requirement (“subordinated MREL”) is also determined by the resolution authorities and expressed as a percentage of RWA and LRE. At 31 December 2024, this subordinated MREL requirement for the Crédit Agricole Group was:
- 18.25% of RWA, plus a combined capital buffer requirement. Considering the combined capital buffer requirement, the Crédit Agricole Group has to meet to a subordinated MREL ratio of above 22.6%;
- 6.25% of leverage exposure.
At 31 December 2024, Crédit Agricole Group had a subordinated MREL ratio of 26.9% of RWA and 8.0% of leverage exposure, well above the requirement.
The distance to the maximum distributable amount trigger related to MREL requirements (M-MDA) is the lowest of the respective distances to the MREL, subordinated MREL and TLAC requirements expressed in RWA.
At 31 December 2024, Crédit Agricole Group had a buffer of 430 basis points above the M-MDA trigger, i.e. €28 billion in CET1 capital; the distance to the M-MDA trigger corresponds to the distance between the subordinated MREL ratio and the corresponding requirement.
Crédit Agricole S.A.
At 31 December 2024, Crédit Agricole S.A.’s solvency ratio was higher than the Medium-Term Plan target, with a phased-in Common Equity Tier 1 (CET1) ratio of 11.7%, stable compared to end-September 2024. Crédit Agricole S.A. therefore had a comfortable buffer of 3.0 percentage points between the level of its CET1 ratio and the 8.6% SREP requirement. The fully loaded CET1 ratio was 11.6%.
During the fourth quarter 2024:
- The CET1 ratio benefited this quarter from a positive impact of +19 basis points linked to retained earnings. This impact corresponds to net income Group share net of AT1 coupons (impact of +38 basis points) and of the distribution of 50% of earnings, i.e. a provision for dividends of 27 euro cents per share in third quarter 2024 (-20 basis points).
- Changes in risk-weighted assets related to business line organic growth impacted the CET1 ratio by -12 basis points, of which a rating effect of -10 basis points in Corporate and Investment Banking and French Retail Banking.
- Methodology, M&A and other effects had a negative impact of -13 basis points and included, in particular, the -12 basis point Basel 4 impact relating to the consolidation of leasing activities.
- The phased-in leverage ratio was 3.9% at end-December 2024, up +0.1 percentage point compared to end-September 2024 and above the 3% requirement.
The phased-in Tier 1 ratio stood at 13.4% and the phased-in total ratio at 17.4% this quarter.
Risk weighted assets for Crédit Agricole S.A. amounted to 415 billion at end of December 2024, up by +€12.9 billion compared to 30 September 2024. The change can be broken down by core business line as follows:
- The Retail Banking divisions showed an increase of +€2.1 billion, particularly in France, with a rating effect at LCL of +€1.9 billion.
- Asset Gathering posted a decrease of -€1.2 billion essentially for Insurance due to the impact of the interim dividend.
- Specialised Financial Services increased by +€4.3 billion, due to the Basel 4 impact of consolidation of leasing activities
- Large Customers recorded an increase in risk-weighted assets of +€7.4 billion over the quarter, mainly as a result of the growth of the Corporate and Investment Banking business lines, and negative foreign exchange effects (+€2.7 billion) and ratings (+€1.5 billion).
- The Corporate Centre divisions posted an increase in risk-weighted assets of +€0.4 billion.
Liquidity and Funding
Liquidity is measured at Crédit Agricole Group level.
Preliminary presentation information:
At 31 December 2024, changes have been made to the liquidity balance sheet:
- In assets, the section “Cash and Central Bank deposits (including mandatory reserves)”, eligible to LCR, was reduced to “Central Bank deposits (without Cash and mandatory reserves)”, for consistency with the presentation of Liquidity reserves, which exclude Cash and mandatory reserves. The latter have been reclassified under stable application of funds for the surplus of stable funding resources over stable application of funds, in the section “Net working capital” (see Infra). This methodological change had a negative impact on the indicator of €16 billion;
- In assets, the sections “Interbank assets” and “Reverse repos (net) and other ST” in the banking book have been merged into a single section called “Treasury assets”;
- In liabilities, the “Customer-related funds” section now only contains customer deposits eligible for the Stable Resources Position indicator89, and bonds issued by Group entities through its retail networks as well as national or supranational borrowings are now listed in the “LT debt” section (formerly called “MLT market funds”);
- The sections “Tangible and intangible assets” previously in assets and “Equity and similar” previously in liabilities are netted in a single section called “Net working capital” in liabilities. The later now also includes the difference between accrued liabilities and accrued interests, which were historically included in the section “Reverse repos and other ST”. This reclassification had a positive impact on the surplus of stable funding resources over stable application of funds of €3 billion.
In addition, the following changes have been made to the breakdown of long-term debt (considered within the meaning of banking activities) from the 31 December 2024:
- Senior Preferred bonds issued by Group entities through its retail networks are classified within other debt with the same ranking issued on the market;
- National or supranational borrowings are classified as senior secured debt.
Comments on the liquidity position:
Diversified and granular customer deposits has increased by +2% over the quarter (€1,152 billion at 31 December 2024). The stabilisation of the breakdown in deposits continues this quarter in France.
The Group’s liquidity reserves, at market value and after haircuts90, amounted to €473 billion at 31 December 2024, up +€7 billion compared to 30 September 2024.
Liquidity reserves (without Cash and Central Bank deposits) covered more than twice the short term debt net of treasury assets.
This increase in liquidity reserves is notably explained by:
- The increase in the securities portfolio (HQLA and non-HQLA) for +€24 billion, due to the subscription of additional securities (instead of Central Banks deposits, Cf. Infra) and to the change in haircuts to better reflect the economic reality of central bank value;
- The decrease of collateral already pledged to Central Banks and unencumbered for -€12 billion since additional private non-financial corporate claims (ACC Corpo) are no longer eligible to ECB funding from Q4.
Crédit Agricole Group also continued its efforts to maintain immediately available reserves (after recourse to ECB financing). Central bank eligible non-HQLA assets after haircuts amounted to €139 billion.
Standing at €1,685 billion at 31 December 2024, the Group’s liquidity balance sheet shows a surplus of stable funding resources over stable application of funds of €177 billion, down -€12 billion compared with end-September 2024. This surplus remains well above the Medium-Term Plan target of €110bn-€130bn.
Long term debt was €305 billion at 31 December 2024, up from pro-forma end-September 2024.
This included:
- Senior secured debt of €84 billion;
- Senior preferred debt of €159 billion, up +€10 billion, of which €7.5 billion due to the consolidation of CAPFM’s car lease subsidiaries in compliance with CRR3 regulation;
- Senior non-preferred debt of €37 billion;
- And Tier 2 securities of €25 billion.
Credit institutions are subject to a threshold for the LCR ratio, set at 100% on 1 January 2018.
At 31 December 2024, the end of month LCR ratios were 127% for Crédit Agricole Group (representing a surplus of €66 billion) and 131% for Crédit Agricole S.A. (representing a surplus of €64 billion). They were higher than the Medium-Term Plan target (around 110%). The LCR ratio was lower in December given higher one-month net outflows weighing on the denominator of the ratio.
In addition, the NSFR of Crédit Agricole Group and Crédit Agricole S.A. exceeded 100%, in accordance with the regulatory requirement applicable since 28 June 2021 and above the Medium-Term Plan target (>100%).
The Group continues to follow a prudent policy as regards medium-to-long-term refinancing, with a very diversified access to markets in terms of investor base and products.
At 31 December 2024, the Group’s main issuers raised the equivalent of €32.7 billion91in medium-to-long-term debt on the market, 81% of which was issued by Crédit Agricole S.A.
In particular, the following amounts are noted for the Group excluding Crédit Agricole S.A.:
- Crédit Agricole Assurances issued €750 million in Tier 2 10-year bullet subordinated and made a tender offer on two subordinated perpetual issuances (FR0012444750 & FR0012222297) for €788.5 million in September;
- Crédit Agricole Personal Finance & Mobility issued:
- €2 billion equivalent in EMTN issuances and €0.9 billion in securitisations through Crédit Agricole Auto Bank (CAAB);
- €0.7 billion in securitisations through Agos;
- Crédit Agricole Italia issued two senior secured debt issuances for a total of €1.5 billion, of which €500 million in Green Bond format;
- Crédit Agricole next bank (Switzerland) issued three tranches in senior secured format for a total of 300 million Swiss francs, of which 100 million Swiss francs in Green Bond format
At 31 December 2024, Crédit Agricole S.A. raised the equivalent of €24.1 billion through the market92,93.
The bank raised the equivalent of €24.1 billion, of which €7.3 billion in senior non-preferred debt and €3.1 billion in Tier 2 debt, as well as €7.2 billion in senior preferred debt and €6.5 billion in senior secured debt at end-December. The financing comprised a variety of formats and currencies, including:
- €6.3 billion94,95;
- 6.35 billion96 US dollars (€5.8 billion equivalent);
- 1.1 billion pounds sterling (€1.3 billion equivalent);
- 230 billion Japanese yen (€1.4 billion equivalent);
- 0.8 billion Swiss francs (€0.8 billion equivalent);
- 1.75 billion Australian dollars (€1.1 billion equivalent);
- 7 billion renminbi (€0.9 billion equivalent).
At end-December, Crédit Agricole S.A. had issued 64%97,98 of its funding plan in currencies other than the euro.
In addition, on 2 January 2024, Crédit Agricole S.A. issued a PerpNC6 AT1 bond for €1.25 billion at an initial rate of 6.5% and, on 24 September 2024, a PerpNC10 AT1 bond for $1.25 billion at an initial rate of 6.7%.
The 2025 MLT market funding programme was set at €20 billion, with equilibrium between senior preferred or senior secured debt and senior non-preferred or Tier 2 debt.
The programme was 30% completed at 31 January 2025, with:
- €0.5 billion in senior secured debt;
- €0.3 billion equivalent in senior preferred debt;
- €4.6 billion equivalent in senior non-preferred debt;
- €0.7 billion equivalent in Tier 2 debt.
Economic and financial environment
2024 retrospective
Continuing trend of disinflation and monetary easing
The global context remained contentious and eruptive, marked by significant geopolitical tensions and ongoing open conflicts such as the wars in Ukraine and the Middle East, which began in February 2022 and October 2023, respectively. On their emergence, these conflicts had caused tensions for upstream prices, particularly for grain, gas and maritime transport. These sharp price increases combined with sources of inflation arising from the post-Covid recovery: pressure on demand (recovering strongly) and supply (tight), problems or disruptions in supply, slow return of the participation rate on the labour market to its pre-pandemic level (labour shortage, wage pressures).
This combination of shocks resulted in a sudden upturn in global inflation, which peaked at 10.3% in October 2022 (an annual average of 8.7% in 2022 after 3.8% in 2021). This high inflation and the need to anchor inflation expectations quickly, to avoid price-wage spirals and persisting very high levels of inflation, resulted in sharp monetary tightening. The Federal Reserve and the ECB also began, in March and July 2022, respectively, a powerful rate hike cycle (increases of 525 and 450 base points (bp), respectively, in around 15 months). Thanks to the resorption of shocks upstream, the normalisation of the labour markets and the effects of monetary tightening, disinflation occurred from 2023 (average global inflation at 6.9%); global growth held up well overall.
2024 was marked by widespread continued disinflation (average global inflation at 5%, 4.5% year-on-year in December), despite the resilience of services prices being almost as widespread. After having kept their policy rates at high levels for some time, the major central banks started to make cuts in the summer. While the ECB reduced its deposit rate by 150 bp (to 3% for a refinancing rate of 3.15% in December 2024), the Fed reduced the federal funds target rate by 100 bp (upper bound at 4.50% in December 2024). Widely anticipated, this monetary easing provided support to still robust global growth (recession was avoided despite the high inflation followed by much stricter financial conditions) but for which the overall resilience still masks very mixed performances.
Overall resilient growth masking mixed performances
In the US, the economy once again demonstrated its robustness in 2024, with growth that continued to exceed expectations, coming in at an annual average of 2.8% (after 2.9% in 2023). Despite some pockets of weakness (households with low incomes, negative net equity, small businesses, vulnerable workers more exposed to high interest rates), the monetary and financial tightening did not have a widespread depressive effect thanks to an overall strengthening of balance sheets (corporate and household) after the financial crisis. While the employment market showed signs of a slowdown, this was more of a normalisation following a period of overheating rather than a deep deterioration. The unemployment rate rose only slightly, (4.1% at end-December 2024 vs 3.8% one year earlier). Lastly, confirming that the last mile of disinflation is the hardest, year-on-year inflation climbed very slowly from September to reach 2.9% in December.
In China, the property market has not yet stabilised and support measures (lowering mortgage rates, lowering reserve requirement rates to free up liquidity, creating support funds to buy back certain vacant properties or properties under construction) have not generated the confidence boost expected. Households have preferred to maintain their precautionary savings, to the detriment of consumption, and weak domestic demand has continued to feed strong deflationary pressure. Thanks to better-than-expected growth in the last quarter (5.4% year-on-year), average annual growth reached the government target of “around 5%”. However, inflation (0.2% in 2024) remained far below the Central Bank’s 3% target.
In France, growth came in at 1.1% in 2024, as in 2023. However, inflation dropped sharply, with an annual average of 2%, after 4.9% in 2023. This disinflation led to increased purchasing power for households, although this did not translate into a sharp rise in consumption. The savings rate for households therefore increased to 18%, as an annual average, compared to below 17% in 2023 and 14% before the health crisis (2015-2019). Employment proved very resilient in 2024 and the unemployment rate showed only a slight increase (7.4%). As the previous tightening of financial terms continued to weigh heavily on private investment, domestic demand decelerated and growth was driven by foreign trade and the public sector. While public consumer spending drove growth, on the other side of the coin, the public deficit significantly increased and should reach around 6.2% of GDP (after 5.5% in 2023).
In Italy, the slowdown in activity continued in 2024, with growth limited to 0.5%. The disinflation process that began at the end of 2023 continued (average annual inflation of 1.1%) but was not enough to significantly boost the economy. A buoyant employment market (with an unemployment rate of 6.7%, down one point on 2023), low inflation and slight wage increases enabled an upturn in purchasing power after two years of decline. Despite this support, growth in household consumption remained moderate and the savings rate stabilised after its drop in 2023. Investment growth stagnated, driven solely by projects linked to the stimulus package, while productive investment declined sharply, particularly in the third quarter. Continued restrictive financing terms and insufficient demand, both domestically and internationally, have hampered supply, particularly in industry, which saw a marked drop. The construction sector, supported in the first six months by the delayed effect of the Super Bonus, then slowed.
Financial markets
Disinflation did not drive inflation rates to the targets set by the major central banks, but within their “comfort zones” and enabled them, during the summer, to ease their monetary policy. However, firstly, the “last mile” of disinflation has proved harder than the markets had anticipated and, secondly, the US election revived hopes of stronger growth but fears of higher inflation in the US. Consequently, investors have had to temper their hopes for monetary easing and bond rate cuts, particularly in the US.
On the other side of the Atlantic, while two-year US Treasury yields fell back very slightly during the year (around 4.25% in December 2024), longer-term rates (US 10-year Treasuries) picked up by almost 65 bp (to almost 4.60%). In the eurozone, with a fairly depressed growth outlook and modest inflation, 2-year and 10-year swap rates fell by around 65 bp and 15 bp, respectively, over the year (to 2.20% and 2.35%). The trend in sovereign spreads reflected the relative economic, as well as political, performance of the economies. Whilst difficulties piled up in Germany, the European periphery enjoyed political stability and/or better economic growth. While the Bund rate (German 10-year rate) gained 30 bp over the year (to 2.35%, i.e. the 10-year swap rate level, having been nearly 50 bp below this level at the end of December 2023), peripheral spreads tightened. In France, political instability and concerns about the trajectory of French debt prompted the spread to widen. At the end of 2024, the Spanish, Italian and French 10-year yield spreads against the Bund were around 120, 70 and 80 bp, respectively, (i.e. variations of -25 bp, -50 bp and +30 bp over the year). France’s spread is now higher than Spain’s.
In 2024, US economic performance far outstripped that of other major regions, notably Europe. Whilst US equity markets were again buoyed by the performance of the “Magnificent Seven” and the expected benefits of the US election, Europe suffered for a variety of reasons (depressed manufacturing sector, high energy costs, excessive regulation, Chinese competition, technology gap, political concerns in France and Germany etc.). Between the start and end of 2024, the S&P index rose by 24%, the Eurostoxx 50 was up 8% and the CAC was down 2%. Lastly, although stable on average over the year (at US$1.08), the euro fell against the dollar by 5.5% between January and December 2024.
2025 Outlook
A highly conditional scenario
More than ever, the outlook is dependent on the future course of US geopolitics and economic policy. The assumptions made about the scale and timing of the measures to be taken by the new administration suggest that, in the US, the economy is likely to remain resilient, but also that inflation will pick up, monetary easing will be modest and long-term interest rates will come under upwards pressure. Moreover, these measures are only one explanation for the eurozone’s expected sluggish recovery, below potential.
Outlining the US (and, by extension, global) scenario obviously involves making assumptions about both the scale of the measures likely to be implemented and their timing, depending on whether they fall under the purview of the President or require the approval of Congress. As far as tariffs are concerned, the US President’s threats seem to be tantamount to extreme pressure tactics. They call for an intermediate scenario consisting of substantial increases, but not as high as campaign proposals. Trade tariffs would likely rise to an average of 40% for China, from the second quarter of 2025, and to an average of 6% for the rest of the world, phased in over the second half of 2025. An aggressive fiscal policy, favouring tax cuts and maintaining extremely high deficits, would be implemented later. Its effects could be seen from 2026 onwards. In terms of immigration, restrictions could be applied from the start of the presidential term. They would be followed by a very sharp slowdown in immigration flows and, while deportations are to be expected, they would be selective as opposed to a massive and indiscriminate deportation of millions of people. Lastly, deregulation, from which the energy and finance sectors are likely to benefit the most, would have rather positive effects throughout the presidential term of office.
In the US, these policy guidelines should, on the whole, favour growth. If the expected positive effect of an aggressive fiscal policy and deregulation exceeds the negative impact of tariffs and immigration restrictions, growth will follow. Given the resilience of the US economy, whose growth is still expected to outperform forecasts to settle at around 2.8% in 2024, this suggests that growth will remain strong, albeit slightly weaker. Due to a number of vulnerabilities (low-income households and small businesses are more exposed to high interest rates), our scenario assumes a slowdown to 1.9% in 2025, before a recovery to 2.2% in 2026, a trend that is likely to be accompanied by an upturn in inflation. The end of the disinflationary path to the 2% target is, in fact, the most arduous, and tariffs could result in price pressure ranging between 25 to 30 basis points. Headline inflation could therefore fall back to around 2% next spring, before rising to around 2.5% by the end of 2025 and then remain stable in 2026. The potential for monetary policy easing will be very limited.
In the eurozone, growth is likely to be sluggish, with the economy still not meeting its growth potential and below the pace enjoyed by the US. Although the upturn in household consumption points to slightly stronger growth, the latest data regarding investment does not augur well for a marked acceleration. Falling inflation boosts purchasing power, as well as a rebuilding of real wealth, implying less saving, and lower interest rates help to restore property purchasing power. The ingredients are there for a continued recovery in household spending, albeit only at a very moderate pace, however, as fiscal consolidation and global uncertainty are likely to encourage a continued high savings rate. Our scenario therefore assumes a modest acceleration in consumption to 1.1% in 2025 and 1.2% in 2026, after 0.7% in 2024. After a sharp fall in 2024, investment in 2025 is likely to continue to be penalised by the delay in passing on the interest rate cuts and, above all, by weak domestic demand and growing uncertainty about foreign demand. Investment is expected to grow by just 1.5%, before firming slightly in 2026 (2%). The Trump administration’s policies are likely to have a moderately negative impact on growth in the eurozone, in the short term primarily due to uncertainty. Les politiques de l’administration Trump auraient un impact modérément négatif sur la croissance de la zone euro, dont le canal le plus important à court terme serait l’incertitude. In addition, the monetary and fiscal policy mix remains unfavourable to growth, with the central bank policy rate returning to neutral by mid-2025, while the reduction in the ECB’s balance sheet continues to reflect a restrictive stance. Our forecasts therefore place growth on a relatively soft acceleration trend, rising from 0.7% in 2024 to 1% in 2025, then 1.2% in 2026: growth potential would be attained, but the output gap, which is slightly negative, would not yet be closed, as the growth gap with the US economy would widen.
In France, in 2025, assuming that a 2025 finance act is adopted at the beginning of the year (probably at the end of the first quarter) and that the recovery in public finances is weaker than forecast by the former Barnier government’s draft bill, growth would fall to 0.8%. Economic activity would be curbed, especially at the start of the year, by the uncertainty surrounding national politics and international trade policies. Households and businesses are likely to adopt a more wait-and-see attitude to consumption, investment and hiring. Household consumption is nevertheless set to rise as a result of the ongoing disinflation process, with inflation easing to 2.1% on an annual average basis (CPI), but only slightly. The household savings rate is not expected to fall until the second half of the year and will remain very high, while the unemployment rate is set to rise moderately. Private investment, meanwhile, is expected to remain stable, with an upturn postponed until 2026. Foreign trade is no longer expected to contribute to growth, as imports and exports are expected to grow at more or less the same rate. A slight re-stocking phenomenon is set to support growth, but budgetary efforts are likely to weaken. The public deficit is, however, only expected to fall slightly, to 6% of GDP. In Italy, a slight improvement is expected in 2025, with GDP growth forecast at 0.6%. Although a weakening labour market and slightly higher inflation are expected, consumption should become the main driver of the economy. Productive investment could benefit from a more favourable monetary environment. The construction sector will continue to be weakened by the after-effects of the boom of previous years, despite partial support from projects under the stimulus package.
Regarding emerging countries, were it not for the difficulties associated with “Trump 2.0”, the situation would be improving, with lower US central bank policy rates conducive to global monetary easing, easing of downwards pressure on emerging currencies and, more generally, on external financing for emerging countries, with domestic growth buoyed by falling inflation and interest rate cuts and exports to developed countries (primarily the US) still buoyant. However, the effects of these supporting factors are at risk of being undermined by the probable repercussions of the measures taken by the new US administration. In addition to trade tariffs that are likely to make emerging country exports more expensive and more limited, there will be less monetary accommodation in the US and a probable reduction in US military and financial support for Ukraine, fuelling geopolitical uncertainty in Europe. It will therefore be preferable to be a large country with a low level of openness, such as India, Indonesia or Brazil, a commodity-exporting country or an economy that is well integrated with China, which is preparing for the Trump storm.
In China, the last Politburo meeting concluded in December with a commitment by the authorities to implement a “more proactive” fiscal policy and a “sufficiently accommodating” monetary policy, in order to boost domestic demand and stabilise the property and equity markets. A period of trade tensions is looming and, apart from restrictions on exports of critical products (including rare earths), the means of retaliation are limited. It is difficult to respond by boosting the competitiveness of exports (the yuan is already historically low) or by reciprocally raising tariffs, which would risk penalising already very fragile domestic consumption. The authorities’ plans to provide more vocal support for domestic demand are commendable, but the effectiveness of this strategy will depend on household confidence. The upturn cannot be ordered by decree, and our scenario continues to predict a slowdown in growth in 2025.
The market’s hopes of a sharp monetary easing have been refuted and are absolutely no longer on the agenda, especially in the US.
In an economy that is expected to remain robust, with inflation holding above 2% and which could pick up again, the easing would be modest. After a total reduction of 100 basis points in 2024 (bp), the Fed could ease by a further 50 bp in total, taking the Fed funds rate (upper limit of the target range) to 4.00% in the first half of 2025, before pausing for a prolonged period. With inflation on target and no recession in sight, the ECB is likely to continue moderate easing via its central bank policy rates, while extending its quantitative tightening. After its four 25 bp cuts in 2024, the ECB is expected to cut rates by 25 bp at its meetings in January, March and April, then maintain its deposit rate at 2.25%, i.e. very slightly below the neutral rate estimate (2.50%).
Everything points to a scenario of rising long-term interest rates. In the US, given the economic scenario (limited slowdown in growth and moderation in inflation concentrated at the beginning of the period) and modest monetary easing followed by an earlier pause, interest rates could fall slightly in the first half of 2025 before picking up. The new forecasts look to a ten-year Treasury rate nearing 4.50% at the end of 2025, then rising to around 5.00% at the end of 2026.
In the eurozone, a number of factors lead to a scenario of rising sovereign interest rates: excessive monetary easing expectations by the markets, the correction of which could lead to a rise in swap rates, an increase in the volume of government securities linked to the ECB’s balance sheet reduction (Quantitative Tightening) as well as still-high net national issuance and the extension of the rise in US bond yields to their European equivalents. Whilst the German economy (where early elections will be held in February) continues to suffer, and the political situation in France is not any clearer, “peripheral” countries have seen their sound economic results (notably Spain) and their political stability (this applies to Italy and Spain) rewarded by a significant tightening of their spreads against the German 10-year rate in 2024. They should benefit from the same supportive factors in 2025. Our scenario therefore assumes German, French and Italian ten-year interest rates of 2.55%, 3.15% and 3.55%, respectively, at the end of 2025.
Lastly, on the dollar front, a number of positive factors, including the increased attractiveness of the dollar in terms of yield, seem to have already been largely incorporated into its price. As a result, our scenario assumes that the greenback will remain close to its recent highs throughout 2025, without exceeding them for any long period.
Appendix 1 – Specific items, Crédit Agricole Group and Crédit Agricole S.A.
Crédit Agricole Group – Specific items
| |
Q4-24 |
Q4-23 |
2024 |
2023 |
| €m |
Gross
impact* |
Impact on
Net income |
Gross
impact* |
Impact on
Net income |
Gross
impact* |
Impact on
Net income |
Gross
impact* |
Impact on
Net income |
| |
|
|
|
|
|
|
|
|
| DVA (LC) |
(26) |
(19) |
6 |
4 |
20 |
15 |
(15) |
(11) |
| Loan portfolio hedges (LC) |
2 |
1 |
2 |
1 |
8 |
6 |
(24) |
(18) |
| Home Purchase Savings Plans (LCL) |
– |
– |
6 |
5 |
1 |
1 |
58 |
43 |
| Home Purchase Savings Plans (CC) |
– |
– |
5 |
4 |
(0) |
(0) |
236 |
175 |
| Home Purchase Savings Plans (RB) |
– |
– |
74 |
55 |
63 |
47 |
192 |
142 |
| Mobility activities reorganisation (SFS) |
– |
– |
– |
– |
– |
– |
300 |
214 |
| Check Image Exchange penalty (CC) |
– |
– |
– |
– |
– |
– |
42 |
42 |
| Check Image Exchange penalty (LCL) |
– |
– |
– |
– |
– |
– |
21 |
21 |
| Check Image Exchange penalty (RB) |
– |
– |
– |
– |
– |
– |
42 |
42 |
| Total impact on revenues |
(24) |
(18) |
93 |
69 |
93 |
69 |
851 |
650 |
| Degroof Petercam integration costs (AG) |
(13) |
(10) |
– |
– |
(26) |
(19) |
– |
– |
| ISB integration costs (LC) |
(27) |
(15) |
– |
– |
(97) |
(52) |
– |
– |
| Mobility activitiesreorganisation (SFS) |
– |
– |
4 |
3 |
– |
– |
(14) |
(10) |
| Total impact on operating expenses |
(39) |
(25) |
4 |
3 |
(123) |
(72) |
(14) |
(10) |
| Mobility activities reorganisation (SFS) |
– |
– |
– |
– |
– |
|
(85) |
(61) |
| Provision for risk Ukraine (IRB) |
– |
– |
– |
– |
(20) |
(20) |
– |
– |
| Total impact on cost of credit risk |
– |
– |
– |
– |
(20) |
(20) |
(85) |
(61) |
| Mobility activities reorganisation (SFS) |
– |
– |
– |
– |
– |
– |
(39) |
(39) |
| Total impact equity-accounted entities |
– |
– |
– |
– |
– |
|
(39) |
(39) |
| ISB integration costs (LC) |
(2) |
– |
– |
– |
(2) |
– |
– |
– |
| Degroof Petercam acquisition costs (AG) |
1 |
1 |
– |
– |
(22) |
(16) |
– |
– |
| Mobility activities reorganisation (SFS) |
– |
– |
– |
– |
– |
– |
89 |
57 |
| Total impact Net income on other assets |
(1) |
1 |
– |
– |
(24) |
(16) |
89 |
57 |
| Mobility activities reorganisation (SFS) |
– |
– |
12 |
12 |
– |
– |
12 |
12 |
| Total impact on change of value of goodwill |
– |
– |
12 |
12 |
– |
– |
12 |
12 |
| Mobility activities reorganisation (SFS) |
– |
– |
– |
3 |
– |
– |
– |
3 |
| Total impact on tax |
– |
– |
– |
3 |
– |
– |
– |
3 |
| |
|
|
|
|
|
|
|
|
| Total impact of specific items |
(64) |
(42) |
109 |
86 |
(74) |
(39) |
814 |
611 |
| Asset gathering |
(12) |
(9) |
– |
– |
(49) |
(36) |
– |
– |
| French Retail banking |
– |
– |
80 |
59 |
65 |
48 |
312 |
248 |
| International Retail banking |
– |
– |
– |
– |
(20) |
(20) |
– |
– |
| Specialised financial services |
– |
– |
16 |
17 |
– |
– |
263 |
176 |
| Large customers |
(52) |
(33) |
8 |
6 |
(70) |
(31) |
(39) |
(29) |
| Corporate centre |
– |
– |
5 |
4 |
(0) |
(0) |
277 |
216 |
* Impact before tax and before minority interests
Crédit Agricole S.A. – Specific items
| |
Q4-24 |
Q4-23 |
2024 |
2023 |
| €m |
Gross
impact* |
Impact on
Net income |
Gross
impact* |
Impact on
Net income |
Gross
impact* |
Impact on
Net income |
Gross
impact* |
Impact on
Net income |
| |
|
|
|
|
|
|
|
|
| DVA (LC) |
(26) |
(19) |
6 |
4 |
20 |
15 |
(15) |
(11) |
|
| Loan portfolio hedges (LC) |
2 |
1 |
2 |
1 |
8 |
6 |
(24) |
(18) |
|
| Home Purchase Savings Plans (LCL) |
– |
– |
6 |
4 |
3 |
2 |
58 |
41 |
|
| Home Purchase Savings Plans (CC) |
– |
– |
5 |
4 |
(2) |
(1) |
236 |
175 |
|
| Mobility activities reorganisation (SFS) |
– |
– |
– |
– |
– |
– |
300 |
214 |
| Check Image Exchange penalty (CC) |
– |
– |
– |
– |
– |
– |
42 |
42 |
| Check Image Exchange penalty (LCL) |
– |
– |
– |
– |
– |
– |
21 |
20 |
| Total impact on revenues |
(24) |
(17) |
19 |
14 |
30 |
21 |
617 |
464 |
| Degroof Petercam integration costs (AG) |
(13) |
(9) |
– |
– |
(26) |
(19) |
– |
– |
|
| ISB integration costs (LC) |
(27) |
(15) |
– |
– |
(97) |
(52) |
– |
– |
|
| Mobility activities reorganisation (SFS) |
– |
– |
4 |
3 |
– |
– |
(14) |
(10) |
|
| Total impact on expenses |
(39) |
(25) |
4 |
3 |
(123) |
(71) |
(14) |
(10) |
| Provision for risk Ukraine (IRB) |
– |
– |
– |
– |
(20) |
(20) |
– |
– |
|
| Mobility activities reorganisation (SFS) |
– |
– |
– |
– |
– |
|
(85) |
(61) |
|
| Total impact on cost of credit risk |
– |
– |
– |
– |
(20) |
(20) |
(85) |
(61) |
|
| |
|
|
|
|
|
|
|
|
| Mobility activities reorganisation (SFS) |
– |
– |
– |
– |
– |
– |
(39) |
(39) |
|
| Total impact equity-accounted entities |
– |
– |
– |
– |
– |
|
(39) |
(39) |
|
| ISB integration costs (LC) |
(2) |
– |
– |
– |
(2) |
– |
– |
– |
|
| Degroof Petercam acquisition costs (AG) |
1 |
1 |
– |
– |
(22) |
(16) |
– |
– |
|
| Mobility activities reorganisation (SFS) |
– |
– |
– |
– |
– |
– |
89 |
57 |
|
| Total impact Net income on other assets |
(1) |
1 |
– |
– |
(24) |
(16) |
89 |
57 |
|
| Mobility activities reorganisation (SFS) |
– |
– |
12 |
12 |
– |
– |
12 |
12 |
|
| Total impact on change of value of goodwill |
– |
– |
12 |
12 |
– |
– |
12 |
12 |
|
| Mobility activities reorganisation (SFS) |
– |
– |
– |
3 |
– |
– |
– |
3 |
|
| Total impact on tax |
– |
– |
– |
3 |
– |
– |
– |
3 |
|
| |
|
|
|
|
|
|
|
|
| Total impact of specific items |
(64) |
(41) |
35 |
31 |
(138) |
(86) |
580 |
425 |
|
| Asset gathering |
(12) |
(9) |
– |
– |
(49) |
(35) |
– |
– |
|
| French Retail banking |
– |
– |
6 |
4 |
3 |
2 |
79 |
61 |
|
| International Retail banking |
– |
– |
– |
– |
(20) |
(20) |
– |
– |
|
| Specialised financial services |
– |
– |
16 |
17 |
– |
– |
263 |
176 |
|
| Large customers |
(52) |
(32) |
8 |
6 |
(70) |
(32) |
(39) |
(28) |
|
| Corporate centre |
– |
– |
5 |
4 |
(2) |
(1) |
277 |
216 |
|
* Impact before tax and before minority interests
Appendix 2 – Crédit Agricole Group: income statement by business line
Crédit Agricole Group – Results by business line, Q4-23 and Q4-24
| |
Q4-24 (stated) |
| €m |
RB |
LCL |
IRB |
AG |
SFS |
LC |
CC |
Total |
| |
|
|
|
|
|
|
|
|
| Revenues |
3,276 |
960 |
993 |
2,037 |
915 |
2,108 |
(472) |
9,817 |
| Operating expenses excl. SRF |
(2,503) |
(647) |
(588) |
(930) |
(447) |
(1,298) |
549 |
(5,863) |
| SRF |
– |
– |
– |
– |
– |
– |
– |
– |
| Gross operating income |
773 |
313 |
405 |
1,107 |
468 |
810 |
77 |
3,954 |
| Cost of risk |
(263) |
(78) |
(97) |
(11) |
(306) |
(93) |
(19) |
(867) |
| Equity-accounted entities |
1 |
– |
– |
29 |
43 |
7 |
– |
80 |
| Net income on other assets |
(2) |
1 |
0 |
(0) |
(9) |
(1) |
(10) |
(20) |
| Income before tax |
513 |
236 |
308 |
1,125 |
196 |
724 |
48 |
3,150 |
| Tax |
(110) |
(44) |
(100) |
(313) |
(49) |
(166) |
(2) |
(784) |
| Net income from discont’d or held-for-sale ope. |
– |
– |
– |
– |
– |
– |
– |
– |
| Net income |
404 |
192 |
207 |
813 |
147 |
557 |
46 |
2,366 |
| Non controlling interests |
(1) |
(0) |
(31) |
(117) |
(24) |
(34) |
(11) |
(217) |
| Net income Group Share |
403 |
192 |
177 |
696 |
124 |
523 |
35 |
2,149 |
| |
Q4-23 (stated) |
| €m |
RB |
LCL |
IRB |
AG |
SFS |
LC |
CC |
Total |
| |
|
|
|
|
|
|
|
|
| Revenues |
3,227 |
959 |
1,000 |
1,550 |
880 |
1,936 |
(782) |
8,769 |
| Operating expenses excl. SRF |
(2,485) |
(654) |
(646) |
(726) |
(449) |
(1,209) |
488 |
(5,682) |
| SRF |
– |
– |
– |
– |
– |
– |
– |
– |
| Gross operating income |
742 |
305 |
353 |
824 |
431 |
727 |
(294) |
3,088 |
| Cost of risk |
(321) |
(96) |
(98) |
(4) |
(184) |
(39) |
(20) |
(762) |
| Equity-accounted entities |
(0) |
– |
(0) |
29 |
40 |
5 |
– |
73 |
| Net income on other assets |
(1) |
0 |
2 |
(5) |
(11) |
(1) |
(4) |
(19) |
| Income before tax |
420 |
209 |
258 |
843 |
288 |
692 |
(328) |
2,382 |
| Tax |
(85) |
(39) |
(104) |
(172) |
(53) |
(130) |
128 |
(455) |
| Net income from discont’d or held-for-sale ope. |
(0) |
– |
(10) |
– |
– |
– |
– |
(10) |
| Net income |
336 |
170 |
144 |
671 |
235 |
562 |
(200) |
1,918 |
| Non controlling interests |
0 |
0 |
(24) |
(123) |
(18) |
(25) |
(4) |
(194) |
| Net income Group Share |
336 |
170 |
120 |
548 |
217 |
537 |
(204) |
1,724 |
Crédit Agricole Group – Results by business line, 2024 et 2023
| |
2024 (stated) |
| €m |
RB |
LCL |
IRB |
AG |
SFS |
LC |
CC |
Total |
| |
|
|
|
|
|
|
|
|
| Revenues |
13,110 |
3,872 |
4,153 |
7,633 |
3,520 |
8,652 |
(2,879) |
38,060 |
| Operating expenses excl. SRF |
(9,956) |
(2,448) |
(2,225) |
(3,365) |
(1,780) |
(5,039) |
2,084 |
(22,729) |
| SRF |
– |
– |
– |
– |
– |
– |
– |
– |
| Gross operating income |
3,155 |
1,424 |
1,928 |
4,268 |
1,740 |
3,613 |
(795) |
15,332 |
| Cost of risk |
(1,319) |
(373) |
(316) |
(29) |
(958) |
(117) |
(79) |
(3,191) |
| Equity-accounted entities |
8 |
– |
– |
123 |
125 |
27 |
– |
283 |
| Net income on other assets |
1 |
5 |
0 |
(23) |
(12) |
1 |
(13) |
(39) |
| Income before tax |
1,849 |
1,056 |
1,612 |
4,339 |
895 |
3,523 |
(887) |
12,388 |
| Tax |
(423) |
(229) |
(536) |
(970) |
(187) |
(883) |
341 |
(2,888) |
| Net income from discont’d or held-for-sale ope. |
– |
– |
– |
– |
– |
– |
– |
– |
| Net income |
1,425 |
827 |
1,076 |
3,369 |
708 |
2,641 |
(546) |
9,500 |
| Non controlling interests |
(2) |
(0) |
(160) |
(481) |
(82) |
(139) |
4 |
(860) |
| Net income Group Share |
1,423 |
827 |
916 |
2,889 |
625 |
2,502 |
(542) |
8,640 |
| |
2023 (stated) |
| €m |
RB |
LCL |
IRB |
AG |
SFS |
LC |
CC |
Total |
| |
|
|
|
|
|
|
|
|
| Revenues |
13,259 |
3,850 |
4,040 |
6,693 |
3,597 |
7,780 |
(2,728) |
36,492 |
| Operating expenses excl. SRF |
(9,702) |
(2,396) |
(2,189) |
(2,874) |
(1,673) |
(4,507) |
1,877 |
(21,464) |
| SRF |
(111) |
(44) |
(40) |
(6) |
(29) |
(312) |
(77) |
(620) |
| Gross operating income |
3,446 |
1,410 |
1,811 |
3,813 |
1,896 |
2,961 |
(928) |
14,408 |
| Cost of risk |
(1,152) |
(301) |
(463) |
(5) |
(871) |
(120) |
(28) |
(2,941) |
| Equity-accounted entities |
9 |
– |
1 |
102 |
130 |
21 |
– |
263 |
| Net income on other assets |
5 |
21 |
3 |
(10) |
71 |
2 |
(5) |
88 |
| Income before tax |
2,308 |
1,130 |
1,353 |
3,900 |
1,237 |
2,865 |
(971) |
11,821 |
| Tax |
(551) |
(256) |
(425) |
(868) |
(306) |
(691) |
350 |
(2,748) |
| Net income from discont’d or held-for-sale ope. |
(0) |
– |
(3) |
1 |
(0) |
– |
– |
(3) |
| Net income |
1,756 |
874 |
924 |
3,033 |
931 |
2,174 |
(621) |
9,071 |
| Non controlling interests |
(0) |
(0) |
(145) |
(466) |
(79) |
(118) |
(4) |
(813) |
| Net income Group Share |
1,756 |
874 |
780 |
2,566 |
851 |
2,056 |
(625) |
8,258 |
Appendix 3 – Crédit Agricole S.A.: Results by business line
Crédit Agricole S.A. – Results by business line, Q4-24 et Q4-23
| |
Q4-24 (stated) |
| €m |
AG |
LC |
SFS |
FRB (LCL) |
IRB |
CC |
Total |
| |
|
|
|
|
|
|
|
| Revenues |
2,045 |
2,108 |
915 |
960 |
969 |
95 |
7,092 |
| Operating expenses excl. SRF |
(930) |
(1,298) |
(447) |
(647) |
(568) |
(28) |
(3,917) |
| SRF |
– |
– |
– |
– |
– |
– |
– |
| Gross operating income |
1,116 |
810 |
468 |
313 |
401 |
67 |
3,175 |
| Cost of risk |
(11) |
(93) |
(306) |
(78) |
(100) |
(6) |
(594) |
| Equity-accounted entities |
29 |
7 |
43 |
– |
– |
(17) |
62 |
| Net income on other assets |
(0) |
(1) |
(9) |
1 |
0 |
(0) |
(9) |
| Income before tax |
1,133 |
723 |
196 |
236 |
302 |
44 |
2,634 |
| Tax |
(315) |
(166) |
(49) |
(44) |
(101) |
(7) |
(681) |
| Net income from discont’d or held-for-sale ope. |
– |
– |
– |
– |
– |
– |
– |
| Net income |
819 |
557 |
147 |
192 |
201 |
37 |
1,953 |
| Non controlling interests |
(124) |
(45) |
(24) |
(9) |
(43) |
(19) |
(264) |
| Net income Group Share |
695 |
512 |
124 |
183 |
158 |
18 |
1,689 |
| |
Q4-23 (stated) |
|
| €m |
AG |
LC |
SFS |
FRB (LCL) |
IRB |
CC |
Total |
|
| |
|
|
|
|
|
|
|
| Revenues |
1,555 |
1,935 |
880 |
959 |
974 |
(262) |
6,040 |
| Operating expenses excl. SRF |
(726) |
(1,209) |
(449) |
(654) |
(627) |
(44) |
(3,710) |
| SRF |
– |
– |
– |
– |
– |
– |
– |
| Gross operating income |
828 |
726 |
431 |
305 |
347 |
(306) |
2,330 |
| Cost of risk |
(4) |
(39) |
(184) |
(96) |
(102) |
(14) |
(440) |
| Equity-accounted entities |
29 |
5 |
40 |
– |
(0) |
(12) |
61 |
| Net income on other assets |
(5) |
(1) |
(11) |
0 |
2 |
(3) |
(17) |
| Income before tax |
848 |
691 |
288 |
209 |
246 |
(345) |
1,937 |
| Tax |
(173) |
(129) |
(53) |
(39) |
(103) |
128 |
(369) |
| Net income from discont’d or held-for-sale ope. |
– |
– |
– |
– |
(10) |
– |
(10) |
| Net income |
675 |
562 |
235 |
170 |
134 |
(217) |
1,558 |
| Non controlling interests |
(130) |
(37) |
(18) |
(8) |
(31) |
(1) |
(224) |
| Net income Group Share |
546 |
525 |
217 |
162 |
103 |
(218) |
1,334 |
Crédit Agricole S.A. – Results by business line, 2024 et 2023
| |
2024 (stated) |
| €m |
AG |
LC |
SFS |
FRB (LCL) |
IRB |
CC |
Total |
| |
|
|
|
|
|
|
|
| Revenues |
7,648 |
8,651 |
3,520 |
3,872 |
4,059 |
(570) |
27,181 |
| Operating expenses excl. SRF |
(3,365) |
(5,039) |
(1,780) |
(2,448) |
(2,148) |
(116) |
(14,895) |
| SRF |
– |
– |
– |
– |
– |
– |
– |
| Gross operating income |
4,284 |
3,612 |
1,740 |
1,424 |
1,911 |
(685) |
12,286 |
| Cost of risk |
(29) |
(117) |
(958) |
(373) |
(313) |
(59) |
(1,850) |
| Equity-accounted entities |
123 |
27 |
125 |
– |
– |
(82) |
194 |
| Net income on other assets |
(23) |
1 |
(12) |
5 |
0 |
23 |
(4) |
| Income before tax |
– |
– |
– |
– |
– |
– |
– |
| Tax |
4,355 |
3,523 |
895 |
1,056 |
1,599 |
(803) |
10,625 |
| Net income from discont’d or held-for-sale ope. |
(973) |
(883) |
(187) |
(229) |
(535) |
336 |
(2,472) |
| Net income |
– |
– |
– |
– |
– |
– |
– |
| Non controlling interests |
3,381 |
2,640 |
708 |
827 |
1,063 |
(466) |
8,153 |
| Net income Group Share |
(506) |
(192) |
(82) |
(37) |
(227) |
(22) |
(1,067) |
| Revenues |
2,875 |
2,448 |
625 |
790 |
836 |
(488) |
7,087 |
| |
2023 (stated) |
|
| €m |
AG |
LC |
SFS |
FRB (LCL) |
IRB |
CC |
Total |
|
| |
|
|
|
|
|
|
|
| Revenues |
6,688 |
7,779 |
3,597 |
3,850 |
3,949 |
(683) |
25,180 |
| Operating expenses excl. SRF |
(2,874) |
(4,507) |
(1,673) |
(2,396) |
(2,118) |
(64) |
(13,632) |
| SRF |
(6) |
(312) |
(29) |
(44) |
(40) |
(77) |
(509) |
| Gross operating income |
3,808 |
2,960 |
1,896 |
1,410 |
1,791 |
(825) |
11,039 |
| Cost of risk |
(5) |
(120) |
(870) |
(301) |
(464) |
(17) |
(1,777) |
| Equity-accounted entities |
102 |
21 |
130 |
– |
1 |
(58) |
197 |
| Net income on other assets |
(10) |
2 |
71 |
21 |
3 |
(3) |
85 |
| Income before tax |
– |
– |
12 |
– |
– |
(9) |
2 |
| Tax |
3,894 |
2,864 |
1,237 |
1,130 |
1,332 |
(911) |
9,546 |
| Net income from discont’d or held-for-sale ope. |
(872) |
(690) |
(306) |
(256) |
(422) |
346 |
(2,201) |
| Net income |
1 |
– |
(0) |
– |
(3) |
– |
(3) |
| Non controlling interests |
3,024 |
2,174 |
931 |
874 |
906 |
(565) |
7,343 |
| Net income Group Share |
(483) |
(162) |
(79) |
(39) |
(204) |
(28) |
(995) |
| Revenues |
2,541 |
2,011 |
852 |
835 |
703 |
(593) |
6,348 |
Appendix 4 – Data per share
| Crédit Agricole S.A. – Earnings p/share, net book value p/share and RoTE |
(€m)
Q4-2024
Q4-2023
2024
2023
Net income Group share – stated
1,689
1,334
7,087
6,348
– Interests on AT1, including issuance costs, before tax
(112)
(87)
(463)
(458)
– Foreign exchange impact on reimbursed AT1
–
–
(266)
–
NIGS attributable to ordinary shares – stated
[A]
1,577
1,247
6,358
5,890
Average number shares in issue, excluding treasury shares (m)
[B]
3,025
3,032
3,015
3,031
Net earnings per share – stated
[A]/[B]
0.52 €
0.41 €
2.11 €
1.94 €
Underlying net income Group share (NIGS)
1,730
1,303
7,172
5,923
Underlying NIGS attributable to ordinary shares
[C]
1,618
1,216
6,443
5,465
Net earnings per share – underlying
[C]/[B]
0.54 €
0.40 €
2.14 €
1.80 €
(€m)
31/12/2024
31/12/2023
Shareholder’s equity Group share
74,710
71,086
– AT1 issuances
(7,218)
(7,220)
– Unrealised gains and losses on OCI – Group share
1,256
1,074
– Payout assumption on annual results*
(3,327)
(3,181)
Net book value (NBV), not revaluated, attributable to ordin. sh.
[D]
65,421
61,760
– Goodwill & intangibles** – Group share
(17,851)
(17,347)
Tangible NBV (TNBV), not revaluated attrib. to ordinary sh.
[E]
47,569
44,413
Total shares in issue, excluding treasury shares (period end, m)
[F]
3,025
3,029
| NBV per share, after deduction of dividend to pay (€) |
| Dividend to pay (€) |
| TNBV per share, after deduction of dividend to pay (€) |
TNBV per sh., before deduct. of divid. to pay (€)
| €21.6 |
20,4 € |
| €1.10 |
1,05 € |
| €15.7 |
14,7 € |
| €16.8 |
15,7 € |
| 20,4 € |
| 1,05 € |
| 14,7 € |
| 15,7 € |
* dividend proposed to the Board meeting to be paid
** including goodwill in the equity-accounted entities
(€m)
2024
2023
Net income Group share – stated
[K]
7,087
6,348
Impairment of intangible assets
[L]
0
0
Stated NIGS annualised
[N] = ([K]-[L]-[M])*4/4+[M]
7,087
6,348
Interests on AT1, including issuance costs, before tax, foreign exchange impact, annualised
[O]
-729
-458
Stated result adjusted
[P] = [N]+[O]
6,358
5,890
Tangible NBV (TNBV), not revaluated attrib. to ord. sh. – avg *** (3)
[J]
46,125
43,281
Stated ROTE adjusted (%)
= [P] / [J]
13.8%
13.6%
Underlying Net income Group share
[Q]
7,172
5,923
Underlying NIGS annualised
[R] = ([Q]-[M])*4/4+[M]
7,172
5,923
Underlying NIGS adjusted
[S] = [R]+[O]
6,443
5,465
Underlying ROTE adjusted(%)
= [S] / [J]
14.0%
12.6%
*** including assumption of dividend for the current exercise
0.0%
(1) Underlying: see appendixes for more details on specific items
(2) Underlying ROTE calculated on the basis of an annualised underlying net income Group share and linearised IFRIC costs over the year
(3) Average of the NTBV not revalued attributable to ordinary shares, calculated between 31/12/2023 and 31/12/2024 (line [E]), restated with an assumption of dividend for current exercises
Alternative Performance Indicators99
NBV Net Book Value (not revalued)
The Net Book Value not revalued corresponds to the shareholders’ equity Group share from which the amount of the AT1 issues, the unrealised gains and/or losses on OCI Group share and the pay-out assumption on annual results have been deducted.
NBV per share Net Book Value per share – NTBV Net Tangible Book Value per share
One of the methods for calculating the value of a share. This represents the Net Book Value divided by the number of shares in issue at end of period, excluding treasury shares.
Net Tangible Book Value per share represents the Net Book Value after deduction of intangible assets and goodwill, divided by the number of shares in issue at end of period, excluding treasury shares.
EPS Earnings per Share
This is the net income Group share, from which the AT1 coupon has been deducted, divided by the average number of shares in issue excluding treasury shares. It indicates the portion of profit attributable to each share (not the portion of earnings paid out to each shareholder, which is the dividend). It may decrease, assuming the net income Group share remains unchanged, if the number of shares increases.
Cost/income ratio
The cost/income ratio is calculated by dividing operating expenses by revenues, indicating the proportion of revenues needed to cover operating expenses.
Cost of risk/outstandings
Calculated by dividing the cost of credit risk (over four quarters on a rolling basis) by outstandings (over an average of the past four quarters, beginning of the period). It can also be calculated by dividing the annualised cost of credit risk for the quarter by outstandings at the beginning of the quarter. Similarly, the cost of risk for the period can be annualised and divided by the average outstandings at the beginning of the period.
Since the first quarter of 2019, the outstandings taken into account are the customer outstandings, before allocations to provisions.
The calculation method for the indicator is specified each time the indicator is used.
Doubtful loan
A doubtful loan is a loan in default. The debtor is considered to be in default when at least one of the following two conditions has been met:
- a payment generally more than 90 days past due, unless specific circumstances point to the fact that the delay is due to reasons independent of the debtor’s financial situation.
- the entity believes that the debtor is unlikely to settle its credit obligations unless it avails itself of certain measures such as enforcement of collateral security right.
Impaired loan
Loan which has been provisioned due to a risk of non-repayment.
MREL
The MREL (Minimum Requirement for Own Funds and Eligible Liabilities) ratio is defined in the European “Bank Recovery and Resolution Directive” (BRRD). This Directive establishes a framework for the resolution of banks throughout the European Union, with the aim to provide resolution authorities with shared instruments and powers to pre-emptively tackle banking crises, preserve financial stability and reduce taxpayers’ exposure to losses. Directive (EU) 2019/879 of 20 May 2019 known as “BRRD2” amended the BRRD and was transposed into French law by Order 2020-1636 of 21 December 2020.
The MREL ratio corresponds to an equity and eligible liabilities buffer required to absorb losses in the event of resolution. Under BRRD2, the MREL ratio is calculated as the amount of equity and eligible liabilities expressed as a percentage of risk weighted assets (RWA), as well as a leverage ratio exposure (LRE). Are eligible for the numerator of the total MREL ratio the Group’s regulatory equity, as well as eligible liabilities issued by the corporate centre and the Crédit Agricole network affiliated entities, i.e. subordinated notes, senior non-preferred debt instruments and certain senior preferred debt instruments with residual maturities of more than one year.
Impaired (or non-performing) loan coverage ratio
This ratio divides the outstanding provisions by the impaired gross customer loans.
Impaired (or non-performing) loan ratio
This ratio divides the impaired gross customer loans on an individual basis, before provisions, by the total gross customer loans.
TLAC
The Financial Stability Board (FSB) has defined the calculation of a ratio aimed at estimating the adequacy of the bail-in and recapitalisation capacity of Global Systemically Important Banks (G-SIBs). This Total Loss Absorbing Capacity (TLAC) ratio provides resolution authorities with the means to assess whether G-SIBs have sufficient bail-in and recapitalisation capacity before and during resolution. It applies to Global Systemically Important Banks, and therefore to Crédit Agricole Group. Agricole. The TLAC ratio requirement was transposed into European Union law via CRR2 and has been applicable since 27 June 2019.
The Group’s regulatory equity as well as subordinated notes and eligible senior non-preferred debt with residual maturities of more than one year issued by Crédit Agricole S.A. are eligible for the numerator of the TLAC ratio.
Net income Group share
Net income/(loss) for the financial year (after corporate income tax). Equal to net income Group share, less the share attributable to non-controlling interests in fully consolidated subsidiaries.
Underlying Net income Group share
The underlying net income Group share represents the stated net income Group share from which specific items have been deducted (i.e., non-recurring or exceptional items) to facilitate the understanding of the company’s actual earnings.
Net income Group share attributable to ordinary shares
The net income Group share attributable to ordinary shares represents the net income Group share from which the AT1 coupon has been deducted, including issuance costs before tax.
RoTE Return on Tangible Equity
The RoTE (Return on Tangible Equity) measures the return on tangible capital by dividing the Net income Group share annualised by the Group’s NBV net of intangibles and goodwill. The annualised Net income Group share corresponds to the annualisation of the Net income Group share (Q1x4; H1x2; 9Mx4/3) excluding impairments of intangible assets and restating each period of the IFRIC impacts in order to linearise them over the year.
Disclaimer
The financial information on Crédit Agricole S.A. and Crédit Agricole Group for the fourth quarter and the full year 2024 comprises this press release and the presentation and the attached appendices which are available on the website: https://www.credit-agricole.com/en/finance/finance/financial-publications.
This presentation may include prospective information on the Group, supplied as information on trends. This data does not represent forecasts within the meaning of EU Delegated Act 2019/980 of 14 March 2019 (Chapter 1, article 1, d).
This information was developed from scenarios based on a number of economic assumptions for a given competitive and regulatory environment. Therefore, these assumptions are by nature subject to random factors that could cause actual results to differ from projections. Likewise, the financial statements are based on estimates, particularly in calculating market value and asset impairment.
Readers must take all these risk factors and uncertainties into consideration before making their own judgement.
Applicable standards and comparability
The figures presented for the twelve-month period ending 31 December 2024 have been prepared in accordance with IFRS as adopted in the European Union and applicable at that date, and with regulations currently in force.
Note: The scopes of consolidation of the Crédit Agricole S.A. and Crédit Agricole Groups have not changed materially since the Crédit Agricole S.A. 2023 Universal Registration Document and its A.01 update (including all regulatory information about the Crédit Agricole Group) were filed with the AMF (the French Financial Markets Authority).
The sum of values contained in the tables and analyses may differ slightly from the total reported due to rounding.
At 30 June 2024, Indosuez Wealth Management had completed the acquisition of Degroof Petercam and now holds 65% of Banque Degroof Petercam alongside with CLdN Cobelfret, its historical shareholder, which would maintain a 20% stake in capital. As of 30 September 2024, Indosuez Wealth Management’s stake in Degroof Petercam has increased to 76%.
At 30 June 2024, Amundi had completed the acquisition of Alpha Associates, an independent asset manager offering multi-management investment solutions in private assets.
As of December 31, 2024, Amundi finalized the acquisition of aixigo, a European Wealth Tech player, to complete the ALTO platform’s offering.
As of December 31, 2024, Crédit Agricole S.A. has entered into financial instruments for 5.2% of Banco BPM’s share capital.
Financial Agenda
30 April 2025 Publication of the 2025 first quarter results
14 May 2025 General Meeting
31 July 2025 Publication of the 2025 second quarter and the first half-year results
30 October 2025 Publication of the 2025 third quarter and first nine months results
Contacts
CREDIT AGRICOLE PRESS CONTACTS
CRÉDIT AGRICOLE S.A. INVESTOR RELATIONS CONTACTS
| Institutional investors |
+ 33 1 43 23 04 31 |
investor.relations@credit-agricole-sa.fr |
| Individual shareholders |
+ 33 800 000 777 (freephone number – France only) |
relation@actionnaires.credit-agricole.com |
| |
|
|
| Cécile Mouton |
+ 33 1 57 72 86 79 |
cecile.mouton@credit-agricole-sa.fr |
|
Equity investor relations:
|
|
|
Jean-Yann Asseraf
Fethi Azzoug |
+ 33 1 57 72 23 81
+ 33 1 57 72 03 75 |
jean-yann.asseraf@credit-agricole-sa.fr fethi.azzoug@credit-agricole-sa.fr |
| Oriane Cante |
+ 33 1 43 23 03 07 |
oriane.cante@credit-agricole-sa.fr |
| Nicolas Ianna |
+ 33 1 43 23 55 51 |
nicolas.ianna@credit-agricole-sa.fr |
| Leila Mamou |
+ 33 1 57 72 07 93 |
leila.mamou@credit-agricole-sa.fr |
| Anna Pigoulevski |
+ 33 1 43 23 40 59 |
anna.pigoulevski@credit-agricole-sa.fr |
| |
|
|
| |
|
|
| Credit investor and rating agency relations: |
|
| Gwenaëlle Lereste |
+ 33 1 57 72 57 84 |
gwenaelle.lereste@credit-agricole-sa.fr |
| Florence Quintin de Kercadio |
+ 33 1 43 23 25 32 |
florence.quintindekercadio@credit-agricole-sa.fr |
| |
|
|
| |
|
|
| |
|
|
See all our press releases at: www.credit-agricole.com – www.creditagricole.info
1 Car, home, health, legal, all mobile phones or personal accident insurance.
2 CA Auto Bank, automotive JVs and automotive activities of other entities
3 2024 market shares: CRCA and LCL household loans (source: Banque de France and internal); French UCITS (all customer segments); payments (in No. of transactions; source: Banque de France and internal)
4 2023 market shares: insurance (Argus de l’Assurance and France Assureurs); property services
5 Economic outlook to 2025
6 Purchase price of transactions carried out since 2022. Includes shares acquired in Banco BPM and Worldline
7 Disposal of Crédit du Maroc, La Médicale, Crédit Agricole Serbia and others
8 Indosuez Wealth management acquires a 70% stake in Wealth Dynamix, a fintech specialising in client relationship management for private banks, wealth management and asset management actors across the world.
9 Creation of Uptevia, held in equal shares by CACEIS and BNPP, wich brings together the activities for the issuers of the two banks.
10 Independent asset manager offering private markets multi-manager investment solutions.
11 Technology company of high value-added modular service for distributors of savings solutions.
12 Acquisition of Merca Leasing, independent leasing company in Germany
13 Commercial partnership for automobile insurance between Mobilize Financial Services, subsidiary of Renault Group, specialised in services facilitating access to automobiles, and Pacifica, Property and Casualty subsidiary of Credit Agricole Assurances
14 Merge between Amundi and Victory Capital, acquisition of a participation of 26.1% in Victory Capital, and signature of distribution and services agreement lasting 15 years.
15 Digital fleet management tool on monthly subscription
16 Extended warranty
17 Delivery of single vehicule
18 Agreement allowing CA Autobank, Drivalia, Agilauto and Leasys to offer fatec fllet management services to their customers in France
19 Employee benefits management tool
20 Creation of a joint venture to develop innovative commercial offers.
21 Leader in design, construction, and daily support for multidisciplinary collective primary care structures
22 Credit Agricole Santé et Territoires and 10 regional banks enter the capital of Cette Famille, major player in inclusive housing for seniors in France.
23 Omedys, specialist in assisted telemedicine, Medicalib, home care expert
24 Low-carbon energy outstandings made up of renewable energy produced by the clients of all Crédit Agricole Group entities, including nuclear energy outstandings for Crédit Agricole CIB.
25 Listed investments managed directly, listed investments managed under mandate and unlisted investments managed directly
26 Crédit Agricole CIB green asset portfolio, in line with the eligibility criteria of the Group Green Bond Framework published in November 2023.
27 Scope of power sector: CACIB and Unifergie (Crédit Agricole Transitions & Energies)
28 DVA (Debt Valuation Adjustment)
29Specific (one-off) items had impacted the fourth quarter of 2023 for the SFS division and for CACF as follows: +€17m in net income Group share, of which +€4m on operating expenses, +€12m on badwill and +€1m on tax.
30 See Appendixes for more details on specific items.
31 The cost of risk/outstandings (in basis points) on a four-quarter rolling basis is calculated on the cost of risk of the past four quarters divided by the average outstandings at the start of each of the four quarters
32 The cost of risk/outstandings (in basis points) on an annualised basis is calculated on the cost of risk of the quarter multiplied by four and divided by the outstandings at the start of the quarter
33 Average rate of loans to monthly production for October and November 2024.
34 Equipment rate – Home-Car-Health policies, Legal, All Mobile/Portable or personal accident insurance
35 SAS Rue La Boétie dividend paid annually in Q2
36 Home Purchase Savings Plan base effect (reversal of the Home Purchase Savings Plan provision) in Q4-23 totalling +€73.6m in revenues and +€54.6m in net income Group share.
37 Underlying, excluding specific items.
38 Scope effect of Degroof Petercam revenues: +€158 million in the fourth quarter of 2024.
39 Scope effect in expenses in the fourth quarter of 2024: Degroof Petercam for -€120 million and miscellaneous others.
40 Provisioning rate calculated with outstandings in Stage 3 as denominator, and the sum of the provisions recorded in Stages 1, 2 and 3 as numerator.
41 The cost of risk/outstandings (in basis points) on a four-quarter rolling basis is calculated on the cost of risk of the past four quarters divided by the average outstandings at the start of each of the four quarters
42 The cost of risk/outstandings (in basis points) on an annualised basis is calculated on the cost of risk of the quarter multiplied by four and divided by the outstandings at the start of the quarter
43 See Appendixes for more details on specific items.
44 SRF costs amounted to -€509 million over full-year 2023
45 See Appendixes for details on the calculation of the RoTE (return on tangible equity)
46 The annualised underlying net income Group share corresponds to the annualisation of the underlying net income Group share (Q1x4; H1x2; 9Mx4/3) by restating each period for IFRIC impacts to linearise them over the year
47 In local standards
48 Can reach up to 3.85% for the Anaé policy with a UL rate > 50% and benefiting from management fees of 0.5%
49 Scope “Life France”
50 Property and casualty insurance premium income includes a scope: effect linked to the initial consolidation of CATU in Q2-24 (a property and casualty insurance entity in Poland): 9.4% Q4/Q4 increase in premium income at constant scope
51 Scope: property and casualty in France and abroad
52 Combined property & casualty ratio in France (Pacifica) including discounting and excluding undiscounting, net of reinsurance: (claims + operating expenses + fee and commission income)/gross premiums earned. Undiscounted ratio: 96.4% (-4.3 pp over the year)
53 Excl. JVs
54 Excluding assets under custody for institutional clients
55 Amount of allocation of Contractual Service Margin (CSM) and Risk Adjustment (RA) including funeral guarantees
56 Amount of allocation of CSM and RA
57 Net of cost of reinsurance, excluding financial results
58 Integration costs related to the acquisition of aixigo and the partnership with Victory Capital, which are expected to be completed towards the end of Q1 25, were recorded as operating expenses in the fourth quarter of 2024 for a total of -€14 million.
59 Indosuez Wealth Management scope
60 Degroof Petercam data for the quarter included in Wealth Management results: Revenues of €158m and expenses of -€120m (excluding integration costs partly borne by Degroof Petercam)
61 In Q4 24: -€12.8 million of integration costs (impacting the operating expenses line); and +€0.8 million in acquisition costs (impacting the line gains and losses on other assets)
62 2024 Degroof Petercam data included in the results of the Wealth Management business: NBI of €347 million and expenses of -€259 million (excluding integration costs partially borne by Degroof Petercam)
63 In 2024: -€26.4 million in integration costs (impacting the operating expenses line); and -€22.2 million in acquisition costs (impacting the line gains and losses on other assets)
64 Refinitiv LSEG
65 Bloomberg in EUR
66 Cost of risk for the last four quarters divided by the average of the outstandings at the start of all four quarters of the year
67 CA Auto Bank, automotive JVs and auto activities of other entities
68 CA Auto Bank and automotive JVs
69 Q4-23 base effects related to the reorganisation of the Mobility activities (Expenses +€4m, Changes in value of goodwill +€12m, Corporate income tax +€1m and Net income Group share +€17m)
70 12M-23 base effect linked to the reorganisation of Mobility activities (revenues €300m, expenses -€14m, cost of risk -€85m, equity-accounted entities -€39m, income on other assets €89m, Change in the value of goodwill +€12m, corporate tax €87m, net income Group share €176m)
71 Q4-23 base effects related to the reorganisation of the Mobility activities (Expenses +€4m, Changes in value of goodwill +€12m, Corporate income tax +€1m and Net income Group share +€17m)
72 Cost of risk for the last four quarters as a proportion of the average outstandings at the beginning of the period for the last four quarters.
7312M-23 base effect related to the reorganisation of the Mobility activities (Revenues €300m, Expenses -€14m, Cost of risk -€85m, Equity-accounted entities -€39m, GPAI €89m, Changes in value of goodwill +€12m, Corporate income tax €87m and Net income Group share €176m)
74 Net of POCI outstandings
75 Source: Abi Monthly Outlook, January 2024: -1.0% Dec./Dec. for all loans
76 At 31 December 2024, this scope corresponds to the aggregation of all Group entities present in Italy: CA Italy, CAPFM (Agos, Leasys, CA Auto Bank), CAA (CA Vita, CACI, CA Assicurazioni), Amundi, Crédit Agricole CIB, CAIWM, CACEIS, CALEF.
77 In number of branches
78 Net Promoter Score; source: Doxa survey, October 2023.
79 Assofin publication, 30/04/2024 (excluding credit cards).
80 Assets under management Source: Assogestioni, 31/05/2024
81 Production. Source: IAMA, 30/04/2024
82 Home Purchase Saving Plan base effect (reversal of the provision for Home Purchase Saving Plans) in Q4-23 of +€6.1 million in revenues and +€4.5 million in net income Group share versus 0 in Q4 2024.
83 Home Purchase Saving Plan base effect (reversal of the provision for Home Purchase Saving Plans) in 2023 of +€57.9 million in revenues and +€41.2 million in net income Group share versus €3.1 million in revenues and +€2.2 million in net income Group share in 2024.
84 Reversal of provision for Cheque Image Exchange Provision of + €21m in Q2-23
85 At 31 December 2024 this scope includes the entities CA Italy, CA Polska, CA Egypt and CA Ukraine.
86 Over a rolling four quarter period.
87 At 31 December 2024, this scope corresponds to the aggregation of all Group entities present in Italy: CA Italy, CAPFM (Agos, Leasys, CA Auto Bank), CAA (CA Vita, CACI, CA Assicurazioni), Amundi, Crédit Agricole CIB, CAIWM, CACEIS, CALEF.
88 As part of its annual resolvability assessment, Crédit Agricole Group has chosen in 2024 to continue waiving the possibility offered by Article 72ter(3) of the Capital Requirements Regulation (CRR) to use senior preferred debt for compliance with its TLAC requirements over the resolvability period that will begin during 2025.
89 Which excludes some client deposits from the asset custody business in coherence with the internal management.
90Securities within liquidity reserves are valued after discounting idiosyncratic stress (previously systemic stress) to better reflect the economic reality of central bank value.
91 Gross amount before buy-backs and amortisations
92 Gross amount before buy-backs and amortisations
93 Excl. AT1 issuances
94 Gross amount before buy-backs and amortisations
95 Excl. senior secured debt
96 Gross amount before buy-backs and amortisations
97 Gross amount before buy-backs and amortisations
98 Excl. AT1 issuances
99 APMs are financial indicators not presented in the financial statements or defined in accounting standards but used in the context of financial communications, such as underlying net income Group share or RoTE. They are used to facilitate the understanding of the company’s actual performance. Each APM indicator is matched in its definition to accounting data.
The MIL Network –
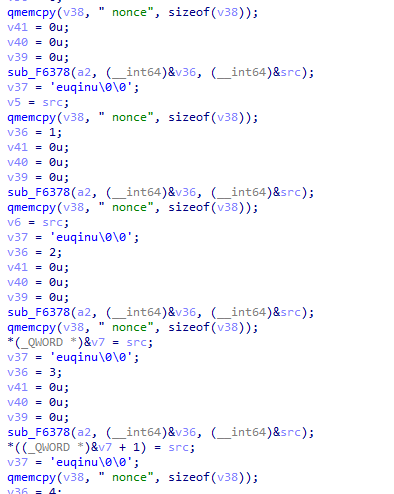