Category: Asia Pacific

  • MIL-OSI Asia-Pac: Elderly aid scheme set to expand

    Source: Hong Kong Information Services

    The “District Services & Community Care Teams – Scheme on Supporting Elderly & Carers”, currently implemented in Tsuen Wan and Southern District, will be rolled out citywide next year, Secretary for Labour & Welfare Chris Sun said today.

    Replying to questions from legislator Tang Ka-piu in the Legislative Council, Mr Sun said that the Social Welfare Department – which has been piloting the scheme in the abovementioned districts since March – had assisted in training care teams to reach out to and identify elderly households, caregivers and people who are in need due to disabilities.

    Over the past six months, the care teams have visited around 4,700 families and referred over 730 elderly cases to social welfare organisations for follow up. The 2024 Policy Address announced that the scheme will cover all 18 districts next year.

    In September last year, the department also commissioned the Tung Wah Group of Hospitals to launch a 24-hour designated hotline for carer support.

    The hotline has so far received over 50,000 calls and referred about 850 cases to community support service units for service matching as appropriate. Of these, around 270 elderly households were referred to elderly service units or respite services. In addition, the hotline facilitated crisis handling in 56 cases.

    Mr Sun said the Government will make use of different channels to enable early identification of elderly residents with potential service needs, and the provision of timely and effective support.

    MIL OSI Asia Pacific News

  • MIL-OSI: Aurora Mobile’s EngageLab Partners with Tao Ji Yun to Jointly Promote Highly Efficient Logistics

    Source: GlobeNewswire (MIL-OSI)

    SHENZHEN, China, Oct. 23, 2024 (GLOBE NEWSWIRE) — Aurora Mobile Limited (NASDAQ: JG) (“Aurora Mobile” or the “Company”), a leading provider of customer engagement and marketing technology services in China, today announced that its subsidiary EngageLab, a leading global multi-channel user engagement solution provider, has established a strategic partnership with Tao Ji Yun, a new generation consolidated shipping platform in Hong Kong under Shenzhen Trans-Jiang Logistics Co., Ltd. The partnership will help Tao Ji Yun achieve millisecond omni-channel messaging, improve the efficiency of global customer engagement, and further strengthen its global competitiveness.

    Tao Ji Yun has become one of the largest and most capable consolidated shipping companies in cross-border e-commerce logistics in Hong Kong. Known for its professional and efficient services, Tao Ji Yun is committed to providing convenient and cost-effective consolidated shipping services to Mainland China e-commerce sellers and Hong Kong buyers, optimizing logistics processes and reducing shipping costs to facilitate mutual benefits for both parties.

    The immediate update and accurate delivery of logistics information is core to Tao Ji Yun’s global operations. EngageLab’s AppPush, which provides push notification services for apps, integrates push messaging channels from eight mobile brands and one self-built channel, ensuring that every logistics update from Tao Ji Yun can be quickly and accurately delivered to users around the world. Whether it’s logistics tracking, freight settlement or after-sales service, users can access the latest logistics information anytime, anywhere. This instant cross-regional messaging not only greatly enhances shopping experience and customer satisfaction, but also will provide a strong impetus to Tao Ji Yun’s global sales growth.

    EngageLab’s AppPush has a global network with multiple channels and data nodes, enabling complementary channel messaging, real-time intelligent redispatch, and multi-point service backups. It can handle large volumes of messages worldwide, and comprehensively ensures message delivery in terms of technical architecture and infrastructure. AppPush processes tens of billions of messages globally every day, ensuring messaging with high concurrency, reliability, stability, security, and efficiency. It achieves millisecond message delivery and ensures smooth operation even during peak business hours. This exceptional performance will enable Tao Ji Yun to maintain accurate and efficient messaging even in the face of immense global business volumes, significantly reducing user reach costs and improving operational efficiency.

    In the area of personalized services, AppPush offers seven message styles and ten user segmentation rules, enabling precise user targeting. It supports full lifecycle data tracking and multi-dimensional message funnels, helping to build user behavior profiles and providing Tao Ji Yun with global intelligent support. Based on messaging data, Tao Ji Yun can build refined user profiles to provide more personalized logistics services and product recommendations. For example, for Hong Kong buyers who frequently purchase bulk goods, Tao Ji Yun can push more favorable consolidated shipping options and freight discount information, further enhancing customer loyalty and satisfaction and shaping its global brand reputation.

    Improving service quality and optimizing customer experience are critical to maintaining a competitive edge in the global cross-border e-commerce logistics market. By working with EngageLab, Tao Ji Yun will not only improve the efficiency of customer engagement, but also accelerate its digital transformation and further strengthen its service capabilities. Going forward, Tao Ji Yun will continue to work with EngageLab, leveraging AppPush’s accurate, efficient, stable and secure push services as the foundation to continuously optimize logistics processes and improve customer engagement efficiency. This will provide global customers with more convenient and cost-effective consolidated shipping services. Meanwhile, Aurora Mobile will continue to support Tao Ji Yun to improve service quality, enhance corporate image, effectively promote its development, and jointly strive to create a more professional, efficient and convenient cross-border e-commerce logistics platform.

    About EngageLab

    As a leading provider of multi-channel user engagement solutions under Aurora Mobile, EngageLab is dedicated to delivering omnichannel messaging solutions to global enterprises and developers. These solutions enable more precise user outreach strategies, lower messaging costs, higher message delivery rates, and improved user conversion rates. EngageLab has steadily increased its market share and become an internationally recognized overseas messaging service platform. Currently, EngageLab has worked with hundreds of leading companies in 29 countries and regions worldwide and across various industries, including technology, internet, mobile, video, media, automotive and finance.

    About Aurora Mobile Limited

    Founded in 2011, Aurora Mobile (NASDAQ: JG) is a leading provider of customer engagement and marketing technology services in China. Since its inception, Aurora Mobile has focused on providing stable and efficient messaging services to enterprises and has grown to be a leading mobile messaging service provider with its first-mover advantage. With the increasing demand for customer reach and marketing growth, Aurora Mobile has developed forward-looking solutions such as Cloud Messaging and Cloud Marketing to help enterprises achieve omnichannel customer reach and interaction, as well as artificial intelligence and big data-driven marketing technology solutions to help enterprises’ digital transformation.

    For more information, please visit https://ir.jiguang.cn/.

    Safe Harbor Statement

    This announcement contains forward-looking statements. These statements are made under the “safe harbor” provisions of the U.S. Private Securities Litigation Reform Act of 1995. These forward-looking statements can be identified by terminology such as “will,” “expects,” “anticipates,” “future,” “intends,” “plans,” “believes,” “estimates,” “confident” and similar statements. Among other things, the Business Outlook and quotations from management in this announcement, as well as Aurora Mobile’s strategic and operational plans, contain forward-looking statements. Aurora Mobile may also make written or oral forward-looking statements in its reports to the U.S. Securities and Exchange Commission, in its annual report to shareholders, in press releases and other written materials and in oral statements made by its officers, directors or employees to third parties. Statements that are not historical facts, including but not limited to statements about Aurora Mobile’s beliefs and expectations, are forward-looking statements. Forward-looking statements involve inherent risks and uncertainties. A number of factors could cause actual results to differ materially from those contained in any forward-looking statement, including but not limited to the following: Aurora Mobile’s strategies; Aurora Mobile’s future business development, financial condition and results of operations; Aurora Mobile’s ability to attract and retain customers; its ability to develop and effectively market data solutions, and penetrate the existing market for developer services; its ability to transition to the new advertising-driven SAAS business model; its ability to maintain or enhance its brand; the competition with current or future competitors; its ability to continue to gain access to mobile data in the future; the laws and regulations relating to data privacy and protection; general economic and business conditions globally and in China and assumptions underlying or related to any of the foregoing. Further information regarding these and other risks is included in the Company’s filings with the Securities and Exchange Commission. All information provided in this press release and in the attachments is as of the date of the press release, and Aurora Mobile undertakes no duty to update such information, except as required under applicable law.

    For more information, please contact:

    Aurora Mobile Limited
    E-mail: ir@jiguang.cn

    Christensen

    In China
    Ms. Xiaoyan Su
    Phone: +86-10-5900-1548
    E-mail: Xiaoyan.Su@christensencomms.com

    In US
    Ms. Linda Bergkamp
    Phone: +1-480-614-3004
    Email: linda.bergkamp@christensencomms.com

    The MIL Network

  • MIL-Evening Report: Politics with Michelle Grattan: Sally McManus on what unions want from Labor and Innes Willox on business wish list for Dutton

    Source: The Conversation (Au and NZ) – By Michelle Grattan, Professorial Fellow, University of Canberra

    Industrial relations will be hotly contested at next year’s election.

    Labor has introduced a raft of new worker protections and pushed for wage increases for lower paid workers.
    Business groups have argued against further red tape and claimed the government’s new regulations have contributed to rising costs.

    The union movement, meanwhile, has been mired in the fallout from the CFMEU controversy, with some union leaders angry over the government and ACTU’s tough treatment of that union after revelations of its infiltration by criminals.

    To talk about these issues and more, we’re joined by ACTU secretary Sally McManus and Innes Willox, the head of the Australian Industry Group, one of the peak employer groups.

    On how to fix the construction industry, Willox advocates an oversight body but not the reintroduction of the Australian Building and Construction Commission,

    We believe that the construction sector does require its own oversight. We had the ABCC previously. We’re not saying go back to that. You don’t have to replicate that model entirely. But the sector has shown that it does require an oversight body that has the ability to launch both civil and criminal claims for poor behaviour. You’re not going to clean it up through sort of task forces and the like, which actually don’t do anything on the ground to change and moderate behaviour.

    What other changes to industrial relations would employers want from a Coalition government?

    I think what we can expect or hope that the Coalition will look long and hard at things like the right to disconnect. Which came from nowhere. It came out of left field right at the end of a process. It’s created huge uncertainty in workplaces. It’s a bit of a minefield both for employers and employees.

    The definition of’casual’ is now a 17-page manual that employers have to work through, rather than a straightforward definition. We’d hope that the Coalition would look at that. And, of course, union right-of-entry powers which have now tilted the balance totally in favour of unions. They’re the sort of things we think that they should look at as a priority and examine what they can do to take off the rough edges that have been put in place there.

    On the unions’ wish list from Labor, McManus says they are talking with the government about further action on the issue of equality.

    At the moment, the gender pay gap is at the lowest ever recorded. So that’s a good thing. But in terms of equality in the workplace, that issue is still a big one, and there is a big push that we are making for reproductive leave. This isn’t just for women, it’s also for men.

    So many women suffer from things like painful periods. Of course, there’s a whole issue of menopause.

    For men, there’s a whole lot of issues to do with reproductive issues as well. […] So this is something that we are talking to the government about and campaigning around.

    Another issue is that of youth wages:

    It’s really totally outrageous that 19, 20-year-olds are paid discount wages in Australia. It’s not acceptable in 2024-2025 and should be fixed. The union movement’s taking it up at the moment and have got rid of it in a lot of industries, and we want to finish the job. So we’re going to try and achieve that through campaigning and through the industrial commission. But if we don’t, if there’s no way of fixing it that way, there’ll be no option then other than to say to the government, listen, ball’s in your court now.

    On the split in the union movement over the government and ACTU actions against the construction division of the CFMEU, McManus says the ACTU will continue to keep its door open,

    Look, no one likes what’s happened. No one likes the fact that, obviously, that union was infiltrated by organised crime, outlaw motorcycle gangs. And no one supports corruption. The other construction union who works with the CFMEU all the time, which is the ETU, the Electrical Trades Union – they’re the ones who have disaffiliated from the ACTU.

    They’re mates, they’re all mates, right? And so, obviously, they’re also not happy with what’s happened. And obviously we will always keep the door open and encourage unity. The ACTU is a place where truck drivers and community workers and teachers and nurses and road workers, everyone of every profession, gets together and talks. It’s always a good thing because you’re listening to other people and you’re stronger together.

    Michelle Grattan does not work for, consult, own shares in or receive funding from any company or organisation that would benefit from this article, and has disclosed no relevant affiliations beyond their academic appointment.

    ref. Politics with Michelle Grattan: Sally McManus on what unions want from Labor and Innes Willox on business wish list for Dutton – https://theconversation.com/politics-with-michelle-grattan-sally-mcmanus-on-what-unions-want-from-labor-and-innes-willox-on-business-wish-list-for-dutton-242019

    MIL OSI AnalysisEveningReport.nz

  • MIL-OSI China: Hong Kong receives more visitors from new cities under individual visit scheme

    Source: People’s Republic of China – State Council News

    HONG KONG, Oct. 23 — In the third quarter of this year, visitors to Hong Kong from 10 newly added Chinese Mainland cities under the Individual Visit Scheme exceeded 140,000, an increase of about 16.3 percent compared to the same period last year, according to the Hong Kong Special Administrative Region (HKSAR) government.

    Kevin Yeung, secretary for culture, sports and tourism of the HKSAR government, said on Wednesday at the HKSAR’s Legislative Council that in March and May this year, the scheme has been expanded to 10 mainland cities including Qingdao, Xi’an, Taiyuan, Lhasa and Yinchuan. The scheme is currently implemented in 59 cities on the mainland.

    Yeung said that to attract more residents from the 10 cities to visit Hong Kong, the Culture, Sports and Tourism Bureau of the HKSAR government and the Hong Kong Tourism Board have rolled out a series of promotional activities, including holding briefing sessions in March in Xi’an and Qingdao to introduce the latest tourism products of Hong Kong to local travel agencies and other trade representatives.

    Yeung said that depending on the circumstances of different markets, the Hong Kong Tourism Board promoted immersive, in-depth tours themed around “city walks” and activities appealing to the young generation, aiming to “soft sell” Hong Kong with fresh content and attract more visitors.

    MIL OSI China News

  • MIL-OSI Asia-Pac: SDEV expresses sorrow over passing of Mr Michael Suen

    Source: Hong Kong Government special administrative region

          The Secretary for Development, Ms Bernadette Linn, today (October 23) expressed her deepest condolences over the passing of former Secretary for Education, Mr Michael Suen.

          Ms Linn said, “Mr Suen was a respected senior who encouraged me a lot throughout my service in the Administrative Officer grade, especially when I was serving in the Education Bureau. As his junior and subordinate, I looked up to him and was deeply impressed by his passion and wisdom, as well as his thorough and pragmatic approach to people and work. He was also enthusiastic about grooming talent. I am deeply saddened by the passing of Mr Suen and extend my deepest condolences to his family.”

    MIL OSI Asia Pacific News

  • MIL-Evening Report: Prabowo’s presidency sparks fear and faint hope in Indonesia’s contested Papua

    By Victor Mambor in Jayapura

    With Prabowo Subianto, a controversial former general installed as Indonesia’s new president, residents in the disputed Papua region were responding to this reality with anxiety and, for some, cautious optimism.

    The remote and resource-rich region has long been a flashpoint for conflict, with its people enduring decades of alleged military abuse and human rights violations under Indonesian rule and many demanding independence.

    With Prabowo now in charge, many Papuans fear that their future will be marked by further violence and repression.

    In Papua — a region known as “West Papua” in the Pacific — views on Prabowo, whose military record is both celebrated by nationalists and condemned by human rights activists, range from apathy to outright alarm.

    Many Papuans remain haunted by past abuses, particularly those associated with Indonesia’s counterinsurgency campaigns that began after Papua was incorporated into Indonesia in 1969 through a disputed UN-backed referendum.

    For people like Maurids Yansip, a private sector employee in Sentani, Prabowo’s rise to the presidency is a cause for serious concern.

    “I am worried,” Yansip said. “Prabowo talked about using a military approach to address Papua’s issues during the presidential debates.

    ‘Military worsened hunman rights’
    “We’ve seen how the military presence has worsened the human rights situation in this region. That’s not going to solve anything — it will only lead to more violations.”

    In Jayapura, the region’s capital, Musa Heselo, a mechanic at a local garage, expressed indifference toward the political changes unfolding in Jakarta.

    “I didn’t vote in the last election—whether for the president or the legislature,” Heselo said.

    “Whoever becomes president is not important to me, as long as Papua remains safe so we can make a living. I don’t know much about Prabowo’s background.”

    But such nonchalance is rare in a region where memories of military crackdowns run deep.

    Prabowo, a former son-in-law of Indonesia’s late dictator Suharto, has long been a polarising figure. His career, marked by accusations of human rights abuses, particularly during Indonesia’s occupation of Timor-Leste, continues to evoke strong reactions.

    In 1996, during his tenure with the elite Indonesian Army special forces unit, Kopassus, Prabowo commanded a high-stakes rescue of 11 hostages from a scientific research team held by Free Papua Movement (OPM) fighters.

    Deadly operation
    The operation was deadly, resulting in the deaths of two hostages and eight pro-independence fighters.

    Markus Haluk, executive secretary of the United Liberation Movement for West Papua (ULMWP), described Prabowo’s presidency as a grim continuation of what he calls a “slow-motion genocide” of the Papuan people.

    “Prabowo’s leadership will extend Indonesia’s occupation of Papua,” Haluk said, his tone resolute.

    “The genocide, ethnocide, and ecocide will continue. We remember our painful history — this won’t be forgotten. We could see military operations return. This will make things worse.”

    Although he has never been convicted and denies any involvement in abuses in East Timor or Papua, these allegations continue to cast a shadow over his political rise.

    He ran for president in 2014 and again in 2019, both times unsuccessfully. His most recent victory, which finally propels him to Indonesia’s highest office, has raised questions about the future of Papua.

    President Prabowo Subianto greets people as he rides in a car after his inauguration in Jakarta, Indonesia, last Sunday. Image: Asprilla Dwi Adha/Antara Foto

    Despite these concerns, some see Prabowo’s presidency as a potential turning point — albeit a fraught one. Elvira Rumkabu, a lecturer at Cendrawasih University in Jayapura, is among those who view his military background as a possible double-edged sword.

    Prabowo’s military experience ‘may help’
    “Prabowo’s military experience and strategic thinking could help control the military in Papua and perhaps even manage the ultranationalist forces in Jakarta that oppose peace,” Rumkabu told BenarNews.

    “But I also worry that he might delegate important issues, like the peace agenda in Papua, to his vice-president.”

    Under outgoing President Joko “Jokowi” Widodo, Papua’s development was often portrayed as a priority, but the reality on the ground told a different story. While Jokowi made high-profile visits to the region, his administration’s reliance on military operations to suppress pro-independence movements continued.

    “This was a pattern we saw under Jokowi, where Papua’s problems were relegated to lower levels, diminishing their urgency,” Rumkabu said.

    In recent years, clashes between Indonesian security forces and the West Papua National Liberation Army (TPNPB) have escalated, with civilians frequently caught in the crossfire.

    Yohanes Mambrasar, a human rights activist based in Sorong, expressed grave concerns about the future under Prabowo.

    “Prabowo’s stance on strengthening the military in Papua was clear during his campaign,” Mambrasar said.

    Called for ‘more troops, weapons’
    “He called for more troops and more weapons. This signals a continuation of militarized policies, and with it, the risk of more land grabs and violence against indigenous Papuans.”

    Earlier this month, Indonesian military chief Gen. Agus Subiyanto inaugurated five new infantry battalions in Papua, stating that their mandate was to support both security operations and regional development initiatives.

    Indeed, the memory of past military abuses looms large for many in Papua, where calls for independence have never abated.

    During a presidential debate, Prabowo vowed to strengthen security forces in Papua.

    “If elected, my priority will be to uphold the rule of law and reinforce our security presence,” he said, framing his approach as essential to safeguarding the local population.

    Yet, amid the fears, some see opportunities for positive change.

    Yohanes Kedang from the Archdiocese of Merauke said that improving the socio-economic conditions of indigenous Papuans must be a priority for Prabowo.

    Education, health care ‘left behind’
    “Education, healthcare, and the economy — these are areas where Papuans are still far behind,” he said.

    “This will be Prabowo’s real challenge. He needs to create policies that bring real improvements to the lives of indigenous Papuans, especially in the southern regions like Merauke, which has immense potential.”

    Theo Hesegem, executive director of the Papua Justice and Human Integrity Foundation, believes that dialogue is key to resolving the region’s long-standing issues.

    “Prabowo has the power to address the human rights violations in Papua,” Hesegem said.

    “But he needs to listen. He should come to Papua and sit down with the people here — not just with officials, but with civil society, with the people on the ground,” he added.

    “Jokowi failed to do that. If Prabowo wants to lead, he must listen to their voices.”

    Pizaro Gozali Idrus in Jakarta contributed to the report. Copyright © 2015-2024, BenarNews. Republished with the permission of BenarNews.

    MIL OSI AnalysisEveningReport.nz

  • MIL-OSI Asia-Pac: USEE attends Third Belt and Road Energy Ministerial Conference (with photos)

    Source: Hong Kong Government special administrative region

    USEE attends Third Belt and Road Energy Ministerial Conference (with photos)
    USEE attends Third Belt and Road Energy Ministerial Conference (with photos)
    ****************************************************************************

         The Under Secretary for Environment and Ecology, Miss Diane Wong, attended the Third Belt and Road Energy Ministerial Conference in Qingdao today (October 23) and was invited to speak at a thematic forum.     The Conference was organised by the National Energy Administration and the Shandong Provincial People’s Government. The theme of the Conference this year is “Together for an Innovative and Win-Win Future”, promoting high-quality green energy co-operation under the Belt and Road Initiative. In delivering her speech at the “Embracing the Green Development Trend and Enhancing Innovation in Energy Policy and Mechanism” thematic forum, Miss Wong highlighted the energy policy measures of the Hong Kong Special Administrative Region (HKSAR) Government to support the country’s contribution to combating global climate change, as well as the decarbonisation strategies to achieve carbon neutrality before 2050.     Miss Wong said, “The HKSAR Government is actively developing renewable energy, exploring new energy sources for electricity generation and strengthening regional co-operation, with a view to increasing zero-carbon electricity supply, reducing carbon emissions at source and achieving the goal of carbon neutrality in the long run. Our country’s headway in building a sustainable future is also providing the HKSAR with bountiful development opportunities. With our country’s development of top-notch green products and advanced technologies, the HKSAR Government could leverage our unique position and distinctive edge to play a pivotal role in stepping up efforts to promote new energy.”     She added that the Chief Executive has promulgated the 2024 Policy Address, themed “Reform for Enhancing Development and Building Our Future Together”, with the announcement that the HKSAR Government will earmark around $750 million under the New Energy Transport Fund to subsidise the taxi trade and franchised bus companies to purchase electric vehicles, and will launch the Subsidy Scheme for Trials of Hydrogen Fuel Cell Electric Heavy Vehicles. Furthermore, the HKSAR Government will earmark $300 million for a new scheme, providing subsidies to the private sector for installing fast-charging facilities. The target is to have a total of 3 000 fast chargers installed by 2030. Regarding hydrogen energy development, the HKSAR Government announced the Strategy of Hydrogen Development in Hong Kong in June and will actively support the industry to establish a solar-to-hydrogen facility for demonstration. It also plans to introduce a bill next year to ensure the safe use of hydrogen fuel, and will also formulate the approach of hydrogen standard certification suitable to Hong Kong.     She said that co-operation between the Government and various parties is crucial for spearheading innovation, enacting policies, and cultivating an environment conducive to green transformation. The HKSAR Government will work together with nearby cities and regions under the framework of the Belt and Road Initiative to actualise a sustainable future.     Miss Wong will return to Hong Kong tomorrow morning (October 24).

     
    Ends/Wednesday, October 23, 2024Issued at HKT 18:12

    NNNN

    MIL OSI Asia Pacific News

  • MIL-OSI Asia-Pac: Smart Traffic Fund approves seven projects

    Source: Hong Kong Government special administrative region

    Smart Traffic Fund approves seven projects
    Smart Traffic Fund approves seven projects
    ******************************************

         The Transport Department (TD) today (October 23) announced that a 16th batch of seven projects has been approved by the Management Committee on Smart Traffic Fund, involving a total grant of around $86.4 million.     The seven approved projects in the latest batch cover safety enhanced autonomous driving artificial intelligence bus with self intelligence, smart taxi ecosystem for efficient electric taxi operations, dynamic reward mechanism for taxi drivers, driving risk detection for taxi, electric taxi dynamic charging solution, optimisation of taxi dispatching and reposition through real-time circumstances monitoring and next generation taxi operating system. Details of the projects are available on the Fund’s website (www.stf.hkpc.org).     The Fund accepts applications throughout the year to provide funding support to local organisations and enterprises for conducting research and application of innovation and technology with the objectives of enhancing commuting convenience, enhancing efficiency of the road network or road space, and improving driving safety. All applications are considered and assessed in batches by the Management Committee, which is chaired by the Deputy Commissioner for Transport (Planning and Technical Services) and comprises representatives from the Government, experts in the industry and relevant stakeholders.     The TD appeals to interested organisations and enterprises for participation to help make the Fund a success, and to build Hong Kong into a more liveable and sustainable city by driving Hong Kong toward a new era of transportation.      Application details are available on the Fund’s website. For enquiries, please contact the Hong Kong Productivity Council, the Secretariat of the Fund, on 2788 5536 or stf_sec@hkpc.org. 

     
    Ends/Wednesday, October 23, 2024Issued at HKT 18:15

    NNNN

    MIL OSI Asia Pacific News

  • MIL-OSI Asia-Pac: Hong Kong and Mainland experts jointly study first discovery of dinosaur fossils in Hong Kong

    Source: Hong Kong Government special administrative region

         The Development Bureau (DEVB) and the Institute of Vertebrate Paleontology and Paleoanthropology (IVPP) of the Chinese Academy of Sciences (CAS) today (October 23) signed the Framework Agreement on Deepening Exchange and Collaboration regarding Stratigraphy, Palaeontology and Prehistoric Sites (Framework Agreement) to conduct scientific research, specimen management and identification, training, and exchanges in the fields of palaeontology, palaeoanthropology and palaeolithic sites. The study of dinosaur fossils discovered on Port Island is the inaugural project under the Framework Agreement.  
     
         Witnessed by the Secretary for Development, Ms Bernadette Linn, the Framework Agreement was signed by the Commissioner for Heritage of the DEVB, Mr Ivanhoe Chang, and the Vice Director of the IVPP of the CAS, Mr Liu Jun.  
     
         Dinosaur fossils were discovered for the first time in Hong Kong. The site is on Port Island in the Hong Kong UNESCO Global Geopark in the northeastern waters of Hong Kong. Ms Linn said that the discovery is of great significance and provides new evidence for research on palaeoecology in Hong Kong.
     
         The Antiquities and Monuments Office (AMO) of the DEVB was informed by the Agriculture, Fisheries and Conservation Department (AFCD) in March this year that the sedimentary rock on Port Island might contain suspected vertebrate fossils. The DEVB then commissioned experts from the IVPP to come to Hong Kong to conduct field investigation, study fossil specimens, recommend management plans and discuss follow-up actions. 
     
         Experts from the IVPP, officers from the DEVB, the AMO and the AFCD conducted site visits to Port Island to collect specimens which contain suspected vertebrate fossils. After taking a preliminary osteohistological analysis of specimens by the IVPP experts, the specimens have been identified as bone fossils of large aged dinosaur. Thereafter, IVPP experts prepared specimens containing dinosaur bone fossils, and it was initially confirmed that the fossils dated to the Cretaceous period (about 145 million to 66 million years ago). Further studies will have to be conducted to confirm the species of the dinosaur.
     
         The AMO and the AFCD, together with the IVPP, will jointly take forward the study of dinosaur fossils, including excavation of the fossils on Port Island and preparation of the fossils. They will also collaborate with universities in Hong Kong and other places to conduct scientific research, and construct the story of dinosaurs in Hong Kong.
     
         The AMO will hold talks tomorrow (October 24) afternoon at the Hong Kong Heritage Discovery Centre (HKHDC), where experts from the IVPP will talk about dinosaurs in China and relevant research. Participants will have the chance to preview the dinosaur fossils prepared at the HKHDC after the talks. The dinosaur fossils will be on public display at the HKHDC from October 25. In addition, the temporary workshop and exhibition space being built in the courtyard of the HKHDC is expected to open by the end of this year for the public to observe the experts’ preparation work and the fossils prepared. The Government will also devise plans for the long-term display of the fossils to enhance the public’s interest and knowledge in palaeontology.
     
         To facilitate future investigations, excavations and research on Port Island, the Director of Agriculture, Fisheries and Conservation announced the closure of the entire area of Port Island within Plover Cove (Extension) Country Park from today until further notice pursuant to the Country Parks and Special Areas Regulations (Cap. 208A). Patrols have been arranged together with the Marine Police. During the closure of Port Island, except approved experts and relevant personnel, no person shall land or enter Port Island. Offenders are liable to a maximum fine of $2,000 and three months’ imprisonment upon conviction.

    MIL OSI Asia Pacific News

  • MIL-OSI Asia-Pac: CEDD deeply saddened by passing of worker

    Source: Hong Kong Government special administrative region

         The Director of Civil Engineering and Development, Mr Michael Fong, today (October 23) was deeply saddened by the passing of a subcontractor’s worker who fell into the sea at the Tuen Mun Area 38 Fill Bank earlier. Mr Fong expressed his deepest condolences to the deceased’s family. The Civil Engineering and Development Department (CEDD) is working with the contractor to provide appropriate assistance to the deceased’s family.

         The worker fell into the sea after assisting with the berthing of a vessel on October 21. The Fire Services Department recovered a body underwater around 7.30am today near a pier at the Tuen Mun Area 38 Fill Bank. The body was later confirmed to be the worker who fell into the sea and went missing earlier.

         The CEDD is rendering full assistance to investigations by the Labour Department and the Police on the cause of the incident. The CEDD requires contractors and subcontractors to strictly comply with safety guidelines. After the incident, the CEDD immediately requested the contractor and subcontractor to suspend relevant works and carry out a thorough review on safety measures to prevent a reoccurrence of similar incidents.

    MIL OSI Asia Pacific News

  • MIL-OSI Asia-Pac: SWD highly concerned about incident of suspected abuse of service users by RCHD staff

    Source: Hong Kong Government special administrative region

    SWD highly concerned about incident of suspected abuse of service users by RCHD staff
    SWD highly concerned about incident of suspected abuse of service users by RCHD staff
    *************************************************************************************

         The Social Welfare Department (SWD) stated today (October 23) that it is highly concerned about an incident of suspected abuse of service users by a staff member of a residential care home for persons with disabilities (RCHD). The RCHD and the organisation concerned have been requested to conduct a thorough investigation and submit improvement plans to avoid similar incidents from happening again and protect the well-being of service users.     The subject RCHD submitted special incident reports to the Licensing Office of Residential Care Homes for Persons with Disabilities of the SWD in August, reporting that a male staff member was suspected of having abused two service users while he was on duty. The RCHD had made a report to the Police and terminated the employment of the relevant staff member. The male staff member concerned had been arrested by the Police. Legal proceedings are underway.     The SWD took immediate follow-up actions upon noting the incident, including deployment of officers to conduct an unannounced inspection at the RCHD as well as requesting the operator to handle the incident in a serious manner and suitably follow up on the emotional and welfare needs of the two victims and their families.     To express deep concern over the incident, the Labour and Welfare Bureau and the SWD met with the Council of Management and the management of the operator and received a briefing about the handling of the incident. A warning letter has also been issued by the SWD to the operator, which is required to submit a detailed investigation report and implement a series of improvement measures to ensure proper care and protection for the service users and prevent similar incidents. These measures include a manpower review by the operator, enhancement of supervision by management officers on the operation of the RCHD, provision of strengthened guidance and training for frontline staff and persistent supervision over the work ethics of staff members.     The SWD noted that the operator has formed an independent review committee to look into its measures to protect service users. The SWD looks forward to the early completion of the review and the implementation of the improvement measures in a serious manner.     To enhance RCHDs’ vigilance and raise the understanding of RCHD staff members on the prevention and handling of abuse incidents, the SWD hosted a sharing session on October 9 for management officers and staff members of all RCHDs on protecting residents from being abused. Relevant training will continue to be provided to the staff of RCHDs. Meanwhile, the SWD has strengthened the requirement on RCHDs’ monitoring and review of CCTV to further safeguard the well-being of the service users.     The SWD will continue to monitor the operation and service quality of the RCHD concerned and urge the RCHD to earnestly implement the improvement measures.

     
    Ends/Wednesday, October 23, 2024Issued at HKT 18:30

    NNNN

    MIL OSI Asia Pacific News

  • MIL-OSI: TransUnion Announces Third Quarter 2024 Results

    Source: GlobeNewswire (MIL-OSI)

    • Exceeded third quarter 2024 financial guidance for revenue and earnings
    • Accelerated revenue growth to 12 percent, driven by U.S. Financial Services, Insurance, Consumer Interactive and International, while executing on technology modernization and transformation program savings
    • Voluntarily prepaid $25 million in debt, bringing total prepayments to $105 million in 2024
    • Raising 2024 financial guidance, we now expect to deliver 9 percent revenue growth for the year

    CHICAGO, Oct. 23, 2024 (GLOBE NEWSWIRE) — TransUnion (NYSE: TRU) (the “Company”) today announced financial results for the quarter ended September 30, 2024.

    Third Quarter 2024 Results

    Revenue:

    • Total revenue for the quarter was $1,085 million, an increase of 12 percent (12 percent on a constant currency basis), compared with the third quarter of 2023.

    Earnings:

    • Net income attributable to TransUnion was $68 million for the quarter, compared with a loss of $319 million for the third quarter of 2023. Diluted earnings per share was $0.35, compared with a loss per share of $1.65 in the third quarter of 2023. Net income attributable to TransUnion margin was 6.3 percent, compared with a loss of 32.9 percent in the third quarter of 2023. Our third quarter 2023 net income (loss) attributable to TransUnion, diluted loss per share and net income (loss) attributable to TransUnion margin were impacted by a $414 million non-cash goodwill impairment expense for our United Kingdom reporting unit in the period.
    • Adjusted Net Income was $205 million for the quarter, compared with $177 million for the third quarter of 2023. Adjusted Diluted Earnings per Share was $1.04, compared with $0.91 in the third quarter of 2023.
    • Adjusted EBITDA was $394 million for the quarter, compared with $356 million for the third quarter of 2023, an increase of 11 percent (11 percent on a constant currency basis). Adjusted EBITDA margin was 36.3 percent, compared with 36.8 percent in the third quarter of 2023.

    “In the third quarter, TransUnion exceeded financial guidance,” said Chris Cartwright, President and CEO. “U.S. Markets grew by double-digits against stable market conditions, driven by mortgage strength, improving non-mortgage financial services, accelerating insurance growth and large breach remediation wins. Our International segment delivered double-digit organic constant currency revenue growth across India, Latin America, Asia Pacific and Africa.”

    “We continue to progress well against our transformation program. We now expect to capture $85 million of operating expense savings in 2024, driven by strong execution against our operating model optimization to expand our Global Capability Center network. Additionally, our technology modernization is accelerating our pace of innovation with several new capabilities and products launched in the quarter, powered by OneTru.”

    “We are raising our 2024 guidance and now expect to deliver 9 percent revenue growth, reflecting third quarter outperformance, stronger mortgage volumes and broad-based strength across the portfolio.”

    Third Quarter 2024 Segment Results

    U.S. Markets:

    U.S. Markets revenue was $848 million, an increase of 12 percent compared with the third quarter of 2023.

    • Financial Services revenue was $367 million, an increase of 17 percent compared with the third quarter of 2023.
    • Emerging Verticals revenue was $307 million, an increase of 3 percent compared with the third quarter of 2023.
    • Consumer Interactive revenue was $174 million, an increase of 21 percent compared with the third quarter of 2023.

    Adjusted EBITDA was $320 million, an increase of 9 percent compared with the third quarter of 2023.

    International:

    International revenue was $242 million, an increase of 11 percent (12 percent on a constant currency basis) compared with the third quarter of 2023.

    • Canada revenue was $39 million, an increase of 7 percent (9 percent on a constant currency basis) compared with the third quarter of 2023.
    • Latin America revenue was $33 million, an increase of 7 percent (13 percent on a constant currency basis) compared with the third quarter of 2023.
    • United Kingdom revenue was $58 million, an increase of 6 percent (4 percent on a constant currency basis) compared with the third quarter of 2023.
    • Africa revenue was $17 million, an increase of 12 percent (10 percent on a constant currency basis) compared with the third quarter of 2023.
    • India revenue was $68 million, an increase of 21 percent (23 percent on a constant currency basis) compared with the third quarter of 2023.
    • Asia Pacific revenue was $26 million, an increase of 11 percent (11 percent on a constant currency basis) compared with the third quarter of 2023.

    Adjusted EBITDA was $110 million, an increase of 14 percent (15 percent on a constant currency basis) compared with the third quarter of 2023.

    Liquidity and Capital Resources

    Cash and cash equivalents was $643 million at September 30, 2024 and $476 million at December 31, 2023.

    For the nine months ended September 30, 2024, cash provided by operating activities was $579 million, compared with $444 million in 2023. The increase in cash provided by operating activities was primarily due to improved operating performance, partially offset by employee separation payments and a penalty paid for the early termination of a facility lease, both of which were in connection with our operating model optimization program. For the nine months ended September 30, 2024, cash used in investing activities was $195 million, compared with $231 million in 2023. The decrease in cash used in investing activities was due primarily to prior year investments in non-consolidated affiliates and lower capital expenditures. For the nine months ended September 30, 2024, capital expenditures were $199 million, compared with $213 million in 2023. Capital expenditures as a percent of revenue represented 6% and 7% for the nine months ended September 30, 2024 and 2023, respectively. For the nine months ended September 30, 2024, cash used in financing activities was $220 million, compared with $375 million in 2023. The decrease in cash used in financing activities was primarily due to a decrease in debt prepayments.

    Fourth Quarter and Full Year 2024 Outlook

    Our guidance is based on a number of assumptions that are subject to change, many of which are outside of the control of the Company, including general macroeconomic conditions, interest rates and inflation. There are numerous evolving factors that we may not be able to accurately predict. There can be no assurance that the Company will achieve the results expressed by this guidance.

        Three Months Ended December 31, 2024   Twelve Months Ended December 31, 2024
    (in millions, except per share data)   Low   High   Low   High
    Revenue, as reported   $ 1,014     $ 1,034     $ 4,161     $ 4,181  
    Revenue growth1:                
    As reported     6 %     8 %     9 %     9 %
    Constant currency1, 2     6 %     8 %     8 %     9 %
    Organic constant currency1, 3     6 %     8 %     8 %     9 %
                     
    Net income attributable to TransUnion   $ 65     $ 77     $ 284     $ 295  
    Net income attributable to TransUnion growth     n/m       n/m       238 %     243 %
    Net income attributable to TransUnion margin     6.4 %     7.4 %     6.8 %     7.1 %
                     
    Diluted Earnings per Share   $ 0.34     $ 0.39     $ 1.45     $ 1.51  
    Diluted Earnings per Share growth   n/m       n/m       237 %     243 %
                     
    Adjusted EBITDA, as reported5   $ 360     $ 375     $ 1,488     $ 1,503  
    Adjusted EBITDA growth, as reported4     10 %     15 %     11 %     12 %
    Adjusted EBITDA margin     35.5 %     36.2 %     35.8 %     36.0 %
                     
    Adjusted Diluted Earnings per Share5   $ 0.92     $ 0.98     $ 3.87     $ 3.93  
    Adjusted Diluted Earnings per Share growth     14 %     21 %     15 %     17 %
    1. Additional revenue growth assumptions:
      1. The impact of changing exchange rates is expected to have an insignificant impact for Q4 2024 and FY 2024.
      2. There is no impact from recent acquisitions for Q4 2024 and FY 2024.
      3. The impact of mortgage is expected to be approximately 5 points of benefit for Q4 2024 and approximately 4 points of benefit for FY 2024.
    2. Constant currency growth rates assume foreign currency exchange rates are consistent between years. This allows financial results to be evaluated without the impact of fluctuations in foreign currency exchange rates.
    3. Organic constant currency growth rates are constant currency growth excluding inorganic growth. Inorganic growth represents growth attributable to the first twelve months of activity for recent business acquisitions. There is no impact from recent business acquisitions in Q4 2024 and FY 2024.
    4. Additional Adjusted EBITDA assumptions:
      1. The impact of changing foreign currency exchange rates is expected to have an insignificant impact for Q4 2024 and FY 2024.
    5. For a reconciliation of the above non-GAAP financial measures to the most directly comparable GAAP financial measures, refer to Schedule 7 of this Earnings Release.

    Earnings Webcast Details

    In conjunction with this release, TransUnion will host a conference call and webcast today at 8:30 a.m. Central Time to discuss the business results for the quarter and certain forward-looking information. This session and the accompanying presentation materials may be accessed at http://www.transunion.com/tru. A replay of the call will also be available at this website following the conclusion of the call.

    About TransUnion (NYSE: TRU)

    TransUnion is a global information and insights company with over 13,000 associates operating in more than 30 countries. We make trust possible by ensuring each person is reliably represented in the marketplace. We do this with a Tru™ picture of each person: an actionable view of consumers, stewarded with care. Through our acquisitions and technology investments we have developed innovative solutions that extend beyond our strong foundation in core credit into areas such as marketing, fraud, risk and advanced analytics. As a result, consumers and businesses can transact with confidence and achieve great things. We call this Information for Good® — and it leads to economic opportunity, great experiences and personal empowerment for millions of people around the world.

    http://www.transunion.com/business 

    Availability of Information on TransUnion’s Website

    Investors and others should note that TransUnion routinely announces material information to investors and the marketplace using SEC filings, press releases, public conference calls, webcasts and the TransUnion Investor Relations website. While not all of the information that the Company posts to the TransUnion Investor Relations website is of a material nature, some information could be deemed to be material. Accordingly, the Company encourages investors, the media and others interested in TransUnion to review the information that it shares on http://www.transunion.com/tru.

    Forward-Looking Statements

    This earnings release contains forward-looking statements within the meaning of the Private Securities Litigation Reform Act of 1995. These statements are based on the current beliefs and expectations of TransUnion’s management and are subject to significant risks and uncertainties. Actual results may differ materially from those described in the forward-looking statements. Any statements made in this earnings release that are not statements of historical fact, including statements about our beliefs and expectations, are forward-looking statements. Forward-looking statements include information concerning possible or assumed future results of operations, including our guidance and descriptions of our business plans and strategies. These statements often include words such as “anticipate,” “expect,” “guidance,” “suggest,” “plan,” “believe,” “intend,” “estimate,” “target,” “project,” “should,” “could,” “would,” “may,” “will,” “forecast,” “outlook,” “potential,” “continues,” “seeks,” “predicts,” or the negatives of these words and other similar expressions.

    Factors that could cause actual results to differ materially from those described in the forward-looking statements, or that could materially affect our financial results or such forward-looking statements include:

    • macroeconomic effects and changes in market conditions, including the impact of inflation, risk of recession, and industry trends and adverse developments in the debt, consumer credit and financial services markets, including the impact on the carrying value of our assets in all of the markets where we operate;
    • our ability to provide competitive services and prices;
    • our ability to retain or renew existing agreements with large or long-term customers;
    • our ability to maintain the security and integrity of our data;
    • our ability to deliver services timely without interruption;
    • our ability to maintain our access to data sources;
    • government regulation and changes in the regulatory environment;
    • litigation or regulatory proceedings;
    • our ability to effectively manage our costs;
    • our efforts to execute our transformation plan and achieve the anticipated benefits and savings;
    • our ability to remediate existing material weakness in our internal control over financial reporting and maintain effective internal control over financial reporting and disclosure controls and procedures;
    • economic and political stability in the United States and international markets where we operate;
    • our ability to effectively develop and maintain strategic alliances and joint ventures;
    • our ability to timely develop new services and the market’s willingness to adopt our new services;
    • our ability to manage and expand our operations and keep up with rapidly changing technologies;
    • our ability to acquire businesses, successfully secure financing for our acquisitions, timely consummate our acquisitions, successfully integrate the operations of our acquisitions, control the costs of integrating our acquisitions and realize the intended benefits of such acquisitions;
    • our ability to protect and enforce our intellectual property, trade secrets and other forms of unpatented intellectual property;
    • our ability to defend our intellectual property from infringement claims by third parties;
    • geopolitical conditions and other risks associated with our international operations;
    • the ability of our outside service providers and key vendors to fulfill their obligations to us;
    • further consolidation in our end-customer markets;
    • the increased availability of free or inexpensive consumer information;
    • losses against which we do not insure;
    • our ability to make timely payments of principal and interest on our indebtedness;
    • our ability to satisfy covenants in the agreements governing our indebtedness;
    • our ability to maintain our liquidity;
    • share repurchase plans; and
    • our reliance on key management personnel.

    There may be other factors, many of which are beyond our control, that may cause our actual results to differ materially from the forward-looking statements, including factors disclosed in our Annual Report on Form 10-K for the year ended December 31, 2023, and any subsequent Quarterly Report on Form 10-Q or Current Report on Form 8-K filed with the Securities and Exchange Commission. You should evaluate all forward-looking statements made in this report in the context of these risks and uncertainties.

    The forward-looking statements contained in this earnings release speak only as of the date of this earnings release. We undertake no obligation to publicly release the result of any revisions to these forward-looking statements to reflect the impact of events or circumstances that may arise after the date of this earnings release.

    For More Information

    TRANSUNION AND SUBSIDIARIES
    Consolidated Balance Sheets (Unaudited)
    (in millions, except per share data)

        September 30,
    2024
      December 31,
    2023
    Assets        
    Current assets:        
    Cash and cash equivalents   $ 643.2     $ 476.2  
    Trade accounts receivable, net of allowance of $18.2 and $16.4     798.4       723.0  
    Other current assets     228.2       275.9  
    Total current assets     1,669.8       1,475.1  
    Property, plant and equipment, net of accumulated depreciation and amortization of $858.3 and $804.4     181.5       199.3  
    Goodwill     5,184.5       5,176.0  
    Other intangibles, net of accumulated amortization of $3,055.8 and $2,719.8     3,356.9       3,515.3  
    Other assets     661.1       739.4  
    Total assets   $ 11,053.8     $ 11,105.1  
    Liabilities and stockholders’ equity        
    Current liabilities:        
    Trade accounts payable   $ 319.4     $ 251.3  
    Short-term debt and current portion of long-term debt     66.5       89.6  
    Other current liabilities     609.8       661.8  
    Total current liabilities     995.7       1,002.7  
    Long-term debt     5,134.9       5,250.8  
    Deferred taxes     481.8       592.9  
    Other liabilities     120.2       153.2  
    Total liabilities     6,732.6       6,999.6  
    Stockholders’ equity:        
    Common stock, $0.01 par value; 1.0 billion shares authorized at September 30, 2024 and December 31, 2023, 201.4 million and 200.0 million shares issued at September 30, 2024 and December 31, 2023, respectively, and 194.9 million and 193.8 million shares outstanding as of September 30, 2024 and December 31, 2023, respectively     2.0       2.0  
    Additional paid-in capital     2,524.3       2,412.9  
    Treasury stock at cost, 6.6 million and 6.2 million shares at September 30, 2024 and December 31, 2023, respectively     (333.0 )     (302.9 )
    Retained earnings     2,312.6       2,157.1  
    Accumulated other comprehensive loss     (289.5 )     (260.9 )
    Total TransUnion stockholders’ equity     4,216.4       4,008.2  
    Noncontrolling interests     104.8       97.3  
    Total stockholders’ equity     4,321.2       4,105.5  
    Total liabilities and stockholders’ equity   $ 11,053.8     $ 11,105.1  
     

    TRANSUNION AND SUBSIDIARIES
    Consolidated Statements of Operations (Unaudited)
    (in millions, except per share data)

        Three Months Ended
    September 30,
      Nine Months Ended
    September 30,
         2024     2023     2024     2023 
    Revenue   $ 1,085.0     $ 968.7     $ 3,147.0     $ 2,876.9  
    Operating expenses                
    Cost of services (exclusive of depreciation and amortization below)     448.7       368.8       1,261.7       1,136.8  
    Selling, general and administrative     305.7       290.8       922.1       867.7  
    Depreciation and amortization     133.6       131.3       400.5       391.1  
    Goodwill impairment           414.0             414.0  
    Restructuring     40.5             66.8        
    Total operating expenses     928.6       1,205.0       2,651.0       2,809.6  
    Operating income (loss)     156.4       (236.3 )     495.9       67.3  
    Non-operating income and (expense)                
    Interest expense     (66.6 )     (72.7 )     (203.2 )     (217.2 )
    Interest income     7.8       5.0       19.9       15.1  
    Earnings from equity method investments     4.7       3.7       14.0       11.7  
    Other (expense) and income, net     (5.4 )     8.7       (26.2 )     (16.3 )
    Total non-operating income and (expense)     (59.6 )     (55.4 )     (195.4 )     (206.8 )
    Income (loss) from continuing operations before income taxes     96.8       (291.7 )     300.5       (139.5 )
    Provision for income taxes     (24.9 )     (22.2 )     (68.9 )     (60.1 )
    Income (loss) from continuing operations     71.9       (313.9 )     231.6       (199.6 )
    Discontinued operations, net of tax           (0.5 )           (0.7 )
    Net income (loss)     71.9       (314.4 )     231.6       (200.3 )
    Less: net income attributable to the noncontrolling interests     (3.9 )     (4.3 )     (13.4 )     (11.9 )
    Net income (loss) attributable to TransUnion   $ 68.0     $ (318.8 )   $ 218.2     $ (212.2 )
                     
    Basic earnings (loss) per common share from:                
    Income (loss) from continuing operations attributable to TransUnion   $ 0.35     $ (1.65 )   $ 1.12     $ (1.09 )
    Discontinued operations, net of tax                        
    Net income (loss) attributable to TransUnion   $ 0.35     $ (1.65 )   $ 1.12     $ (1.10 )
    Diluted earnings (loss) per common share from:                
    Income (loss) from continuing operations attributable to TransUnion   $ 0.35     $ (1.65 )   $ 1.11     $ (1.09 )
    Discontinued operations, net of tax                        
    Net income (loss) attributable to TransUnion   $ 0.35     $ (1.65 )   $ 1.11     $ (1.10 )
    Weighted-average shares outstanding:                
    Basic     194.6       193.4       194.3       193.3  
    Diluted     197.0       193.4       196.3       193.3  
                                     

    As a result of displaying amounts in millions, rounding differences may exist in the table above.

    TRANSUNION AND SUBSIDIARIES
    Consolidated Statements of Cash Flows (Unaudited)
    (in millions)

        Nine Months Ended September 30,
         2024    2023
    Cash flows from operating activities:        
    Net income (loss)   $ 231.6     $ (200.3 )
    Less: Discontinued operations, net of tax           0.7  
    Income (loss) from continuing operations     231.6       (199.6 )
    Adjustments to reconcile net income (loss) to net cash provided by operating activities:        
    Depreciation and amortization     400.5       391.1  
    Goodwill impairment           414.0  
    Loss on repayment of loans     2.6       3.0  
    Deferred taxes     (94.1 )     (101.3 )
    Stock-based compensation     85.6       72.9  
    Loss on early termination of lease     40.5        
    Other     17.9       13.1  
    Changes in assets and liabilities:        
    Trade accounts receivable     (88.9 )     (104.2 )
    Other current and long-term assets     31.4       (42.4 )
    Trade accounts payable     44.2       16.9  
    Other current and long-term liabilities     (92.8 )     (19.7 )
    Cash provided by operating activities of continuing operations     578.5       443.8  
    Cash used in operating activities of discontinued operations           (0.2 )
    Cash provided by operating activities     578.5       443.6  
    Cash flows from investing activities:        
    Capital expenditures     (198.7 )     (213.2 )
    Proceeds from sale/maturities of other investments           63.9  
    Purchases of other investments           (43.7 )
    Investments in nonconsolidated affiliates     (5.9 )     (36.9 )
    Proceeds from the sale of investments in nonconsolidated affiliates     3.8        
    Payment related to disposal of discontinued operations           (0.5 )
    Other     5.7       (0.1 )
    Cash used in investing activities     (195.1 )     (230.5 )
    Cash flows from financing activities:        
    Proceeds from term loans     934.9        
    Repayments of term loans     (927.9 )      
    Repayments of debt     (141.0 )     (310.9 )
    Debt financing fees     (13.5 )      
    Proceeds from issuance of common stock and exercise of stock options     24.5       23.1  
    Dividends to shareholders     (61.7 )     (61.4 )
    Employee taxes paid on restricted stock units recorded as treasury stock     (30.1 )     (17.6 )
    Distributions to noncontrolling interests     (4.7 )     (8.5 )
    Cash used in financing activities     (219.5 )     (375.3 )
    Effect of exchange rate changes on cash and cash equivalents     3.1       (2.2 )
    Net change in cash and cash equivalents     167.0       (164.4 )
    Cash and cash equivalents, beginning of period     476.2       585.3  
    Cash and cash equivalents, end of period   $ 643.2     $ 420.9  
     

    As a result of displaying amounts in millions, rounding differences may exist in the table above.

    TRANSUNION AND SUBSIDIARIES
    Non-GAAP Financial Measures

    We present Consolidated Adjusted EBITDA, Consolidated Adjusted EBITDA Margin, Adjusted Net Income, Adjusted Diluted Earnings per Share, Adjusted Provision for Income Taxes, Adjusted Effective Tax Rate and Leverage Ratio for all periods presented. These are important financial measures for the Company but are not financial measures as defined by GAAP. These financial measures should be reviewed in conjunction with the relevant GAAP financial measures and are not presented as alternative measures of GAAP. Other companies in our industry may define or calculate these measures differently than we do, limiting their usefulness as comparative measures. Because of these limitations, these non-GAAP financial measures should not be considered in isolation or as substitutes for performance measures calculated in accordance with GAAP, including operating income, operating margin, effective tax rate, net income attributable to the Company, diluted earnings per share or cash provided by operating activities. Reconciliations of these non-GAAP financial measures to their most directly comparable GAAP financial measures are presented in the tables below.

    We present Consolidated Adjusted EBITDA, Consolidated Adjusted EBITDA Margin, Adjusted Net Income, Adjusted Diluted Earnings per Share, Adjusted Provision for Income Taxes and Adjusted Effective Tax Rate as supplemental measures of our operating performance because these measures eliminate the impact of certain items that we do not consider indicative of our cash operations and ongoing operating performance. These are measures frequently used by securities analysts, investors and other interested parties in their evaluation of the operating performance of companies similar to ours.

    Our board of directors and executive management team use Adjusted EBITDA as an incentive compensation measure for most eligible employees and Adjusted Diluted Earnings per Share as an incentive compensation measure for certain of our senior executives.

    Under the credit agreement governing our Senior Secured Credit Facility, our ability to engage in activities such as incurring additional indebtedness, making investments and paying dividends is tied to our Leverage Ratio which is partially based on Adjusted EBITDA. Investors also use our Leverage Ratio to assess our ability to service our debt and make other capital allocation decisions.

    Consolidated Adjusted EBITDA

    Management has excluded the following items from net income attributable to TransUnion in order to calculate Adjusted EBITDA for the periods presented:

    • Discontinued operations, net of tax, as reported on our Consolidated Statements of Operations. We exclude discontinued operations, net of tax because we believe it does not reflect the underlying and ongoing performance of our business operations.
    • Net interest expense is the sum of interest expense and interest income as reported on our Consolidated Statements of Operations.
    • Provision for income taxes, as reported on our Consolidated Statements of Operations.
    • Depreciation and amortization, as reported on our Consolidated Statements of Operations.
    • Stock-based compensation is used as an incentive to engage and retain our employees. It is predominantly a non-cash expense. We exclude stock-based compensation because it may not correlate to the underlying performance of our business operations during the period since it is measured at the grant date fair value and it is subject to variability as a result of performance conditions and timing of grants. These expenses are reported within cost of services and selling, general and administrative on our Consolidated Statements of Operations.
    • Operating model optimization program represents employee separation costs, facility lease exit costs, and other business process optimization expenses incurred in connection with the transformation plan discussed further in “Results of Operations – Factors Affecting Our Results of Operations” in our Quarterly Report on Form 10-Q for the three and nine months ended September 30, 2024. We exclude these expenses as we believe they are not directly correlated to the underlying performance of our business. Further, these costs will vary and may not be comparable during the transformation initiative as we progress toward an optimized operating model. These costs are reported primarily in restructuring and selling, general and administrative on our Consolidated Statements of Operations.
    • Accelerated technology investment includes Project Rise and the final phase of our technology investment announced in November 2023. Project Rise was announced in February 2020 and was originally expected to be completed in 2022. Following our acquisition of Neustar in December 2021, we recognized the opportunity to take advantage of Neustar’s capabilities to enhance and complement our cloud-based technology already under development as part of Project Rise. As a result, we extended Project Rise’s timeline to 2024 and increased the total estimated cost to approximately $240 million. In November 2023, we announced our plans to further leverage Neustar’s technology to standardize and streamline our product delivery platforms and to build a single global platform for fulfillment of our product lines. The additional investment is expected to be approximately $90 million during 2024 and 2025 and represents the final phase of the technology investment in our global technology infrastructure and core customer applications. We expect that the accelerated technology investment will fundamentally transform our technology infrastructure by implementing a global cloud-based approach to streamline product development, increase the efficiency of ongoing operations and maintenance and enable a continuous improvement approach to avoid the need for another major technology overhaul in the foreseeable future. The unique effort to build a secure, reliable and performant hybrid cloud infrastructure requires us to dedicate separate resources in order to develop the new cloud-based infrastructure in parallel with our current on-premise environment by maintaining our existing technology team to ensure no disruptions to our customers. The costs associated with the accelerated technology investment are incremental and redundant costs that will not recur after the program has been completed and are not representative of our underlying operating performance. Therefore, we believe that excluding these costs from our non-GAAP measures provides a better reflection of our ongoing cost structure. These costs are primarily reported in cost of services and therefore do not include amounts that are capitalized as internally developed software.
    • Mergers and acquisitions, divestitures and business optimization expenses are non-recurring expenses associated with specific transactions (exploratory or executed) and consist of (i) transaction and integration costs, (ii) post-acquisition adjustments to contingent consideration or to assets and liabilities that occurred after the acquisition measurement period, (iii) fair value and impairment adjustments related to investments and call and put options, (iv) transition services agreement income, and (v) a loss on disposal of a business. We exclude these expenses as we believe they are not directly correlated to the underlying performance of our business operations and vary depending upon the timing of such transactions. These expenses are reported in costs of services, selling, general and administrative and other income and (expenses), net, on our Consolidated Statements of Operations.
    • Net other adjustments principally relate to: (i) deferred loan fee expense from debt prepayments and refinancing, (ii) currency remeasurement on foreign operations, (iii) other debt financing expenses consisting primarily of revolving credit facility deferred financing fee amortization and commitment fees and expenses associated with ratings agencies and interest rate hedging, (iv) legal and regulatory expenses, net, and (v) other non-operating (income) expense. We exclude these expenses as we believe they are not directly correlated to the underlying performance of our business and create variability between periods based on the nature and timing of the expense or income. These costs are reported in selling, general and administrative and in non-operating income and expense, net as applicable based on their nature on our Consolidated Statements of Operations.

    Consolidated Adjusted EBITDA Margin

    Management defines Consolidated Adjusted EBITDA Margin as Consolidated Adjusted EBITDA divided by total revenue as reported.

    Adjusted Net Income

    Management has excluded the following items from net income attributable to TransUnion in order to calculate Adjusted Net Income for the periods presented:

    • Discontinued operations, net of tax (see Consolidated Adjusted EBITDA above).
    • Amortization of certain intangible assets presents non-cash amortization expenses related to assets that arose from our 2012 change in control transaction and business combinations occurring after our 2012 change in control. We exclude these expenses as we believe they are not directly correlated to the underlying performance of our business operations and vary dependent upon the timing of the transactions that give rise to these assets. Amortization of intangible assets is included in depreciation and amortization on our Consolidated Statements of Operations.
    • Stock-based compensation (see Consolidated Adjusted EBITDA above).
    • Operating model optimization program (see Consolidated Adjusted EBITDA above).
    • Accelerated technology investment (see Consolidated Adjusted EBITDA above).
    • Mergers and acquisitions, divestiture and business optimization (see Consolidated Adjusted EBITDA above).
    • Net other is consistent with the definition in Consolidated Adjusted EBITDA above except that other debt financing expenses and certain other miscellaneous income and expense that are included in the adjustment to calculate Adjusted EBITDA are excluded in the adjustment made to calculate Adjusted Net Income.
    • Total adjustments for income taxes relates to the cumulative adjustments discussed below for Adjusted Provision for Income Taxes. This adjustment is made for the reasons indicated in Adjusted Provision for Income Taxes below. Adjustments related to the provision for income taxes are included in the line item by this name on our consolidated statement of operations.

    Adjusted Diluted Earnings Per Share

    Management defines Adjusted Diluted Earnings per Share as Adjusted Net Income divided by the weighted-average diluted shares outstanding.

    Adjusted Provision for Income Taxes

    Management has excluded the following items from our provision for income taxes for the periods presented:

    • Tax effect of above adjustments represents the income tax effect of the adjustments related to Adjusted Net Income described above. The tax rate applied to each adjustment is based on the nature of each line item. We include the tax effect of the adjustments made to Adjusted Net Income to provide a comprehensive view of our adjusted net income.
    • Excess tax expense (benefit) for stock-based compensation is the permanent difference between expenses recognized for book purposes and expenses recognized for tax purposes, in each case related to stock-based compensation expense. We exclude this amount from the Adjusted Provision for Income Taxes in order to be consistent with the exclusion of stock-based compensation from the calculation of Adjusted Net Income.
    • Other principally relates to (i) deferred tax adjustments, including rate changes, (ii) infrequent or unusual valuation allowance adjustments, (iii) return to provision, tax authority audit adjustments, and reserves related to prior periods, and (iv) other non-recurring items. We exclude these items because they create variability that impacts comparability between periods.

    Adjusted Effective Tax Rate

    Management defines Adjusted Effective Tax Rate as Adjusted Provision for Income Taxes divided by Adjusted income from continuing operations before income taxes. We calculate adjusted income from continuing operations before income taxes by excluding the pre-tax adjustments in the calculation of Adjusted Net Income discussed above and noncontrolling interest related to these pre-tax adjustments from income from continuing operations before income taxes.

    Leverage Ratio

    Management defines Leverage Ratio as net debt divided by Consolidated Adjusted EBITDA for the most recent twelve-month period including twelve months of Adjusted EBITDA from significant acquisitions. Since the Leverage Ratio is calculated on a trailing twelve month basis, prior period goodwill impairment is excluded as this expense may not directly correlate to the underlying performance of our business operations during that period and may vary significantly between periods. Net debt is defined as total debt less cash and cash equivalents as reported on the balance sheet as of the end of the period.

    This earnings release presents constant currency growth rates assuming foreign currency exchange rates are consistent between years. This allows financial results to be evaluated without the impact of fluctuations in foreign currency exchange rates. This earnings release also presents organic constant currency growth rates, which assumes consistent foreign currency exchange rates between years and also eliminates the impact of our recent acquisitions. This allows financial results to be evaluated without the impact of fluctuations in foreign currency exchange rates and the impacts of recent acquisitions.

    Free cash flow is defined as cash provided by operating activities less capital expenditures and is a measure we may refer to.

    Refer to Schedules 1 through 7 for a reconciliation of our non-GAAP financial measures to the most directly comparable GAAP financial measure.

    SCHEDULE 1
    TRANSUNION AND SUBSIDIARIES
    Revenue and Adjusted EBITDA growth rates as Reported, CC, and Organic CC
    (Unaudited)

        For the Three Months Ended September 30, 2024 compared with
    the Three Months Ended September 30, 2023
      For the Nine Months Ended September 30, 2024 compared with
    the Nine Months Ended September 30, 2023
        Reported   CC Growth1   Organic CC
    Growth2
      Reported   CC Growth1   Organic CC
    Growth2
    Revenue:                        
    Consolidated   12.0 %   12.2 %   12.2 %   9.4 %   9.4 %   9.4 %
    U.S. Markets   12.5 %   12.5 %   12.5 %   8.4 %   8.4 %   8.4 %
    Financial Services   17.1 %   17.1 %   17.1 %   13.5 %   13.5 %   13.5 %
    Emerging Verticals   3.3 %   3.3 %   3.3 %   4.0 %   4.0 %   4.0 %
    Consumer Interactive   21.4 %   21.3 %   21.3 %   6.0 %   6.0 %   6.0 %
    International   11.3 %   12.1 %   12.1 %   13.4 %   13.5 %   13.5 %
    Canada   6.8 %   8.6 %   8.6 %   11.5 %   12.7 %   12.7 %
    Latin America   7.2 %   12.7 %   12.7 %   11.8 %   10.9 %   10.9 %
    United Kingdom   6.0 %   3.7 %   3.7 %   4.9 %   2.5 %   2.5 %
    Africa   12.3 %   9.5 %   9.5 %   8.3 %   10.4 %   10.4 %
    India   21.5 %   23.1 %   23.1 %   25.4 %   27.0 %   27.0 %
    Asia Pacific   11.1 %   11.5 %   11.5 %   13.6 %   14.2 %   14.2 %
                             
    Adjusted EBITDA:                        
    Consolidated   10.5 %   10.9 %   10.9 %   10.9 %   11.0 %   11.0 %
    U.S. Markets   9.0 %   9.0 %   9.0 %   8.2 %   8.2 %   8.2 %
    International   13.9 %   15.3 %   15.3 %   17.4 %   17.9 %   17.9 %
    1.  Constant Currency (“CC”) growth rates assume foreign currency exchange rates are consistent between years. This allows financial results to be evaluated without the impact of fluctuations in foreign currency exchange rates.
       
    2.  We have no inorganic revenue or Adjusted EBITDA for the periods presented. Organic CC growth rate is the CC growth rate less the inorganic growth rate.

    SCHEDULE 2
    TRANSUNION AND SUBSIDIARIES
    Consolidated and Segment Revenue, Adjusted EBITDA, and Adjusted EBITDA Margin (Unaudited)
    (dollars in millions)

      Three Months Ended
    September 30,
      Nine Months Ended
    September 30,
       2024    2023    2024    2023
    Revenue:              
    U.S. Markets gross revenue              
    Financial Services $ 367.2     $ 313.7     $ 1,077.6     $ 949.6  
    Emerging Verticals   307.2       297.3       913.1       877.9  
    Consumer Interactive   173.7       143.1       455.1       429.4  
    U.S. Markets gross revenue $ 848.1     $ 754.0     $ 2,445.9     $ 2,256.9  
                   
    International gross revenue              
    Canada $ 39.4     $ 36.9     $ 115.9     $ 103.9  
    Latin America   33.5       31.2       100.9       90.2  
    United Kingdom   57.8       54.5       168.6       160.7  
    Africa   17.1       15.2       48.0       44.3  
    India   68.2       56.1       202.8       161.8  
    Asia Pacific   25.6       23.1       77.1       67.9  
    International gross revenue $ 241.6     $ 217.1     $ 713.3     $ 628.9  
                   
    Total gross revenue $ 1,089.6     $ 971.2     $ 3,159.2     $ 2,885.8  
                   
    Intersegment revenue eliminations              
    U.S. Markets $ (2.8 )   $ (1.0 )   $ (7.4 )   $ (4.6 )
    International   (1.9 )     (1.5 )     (4.8 )     (4.3 )
    Total intersegment revenue eliminations $ (4.7 )   $ (2.5 )   $ (12.3 )   $ (8.9 )
                   
    Total revenue as reported $ 1,085.0     $ 968.7     $ 3,147.0     $ 2,876.9  
                   
    Adjusted EBITDA:              
    U.S. Markets $ 319.9     $ 293.7     $ 920.9     $ 850.9  
    International   110.5       97.0       318.1       271.0  
    Corporate   (36.7 )     (34.5 )     (110.6 )     (104.3 )
    Adjusted EBITDA Margin:1              
    U.S. Markets   37.7 %     38.9 %     37.6 %     37.7 %
    International   45.7 %     44.7 %     44.6 %     43.1 %
    1.  Segment Adjusted EBITDA Margins are calculated using segment gross revenue and segment Adjusted EBITDA. Consolidated Adjusted EBITDA Margin is calculated using total revenue as reported and consolidated Adjusted EBITDA.
      Three Months Ended
    September 30,
      Nine Months Ended
    September 30,
       2024     2023     2024    2023 
    Reconciliation of Net income (loss) attributable to TransUnion to consolidated Adjusted EBITDA:              
    Net income (loss) attributable to TransUnion $ 68.0     $ (318.8 )   $ 218.2     $ (212.2 )
    Discontinued operations, net of tax         0.5             0.7  
    Income (loss) from continuing operations attributable to TransUnion $ 68.0     $ (318.3 )   $ 218.2     $ (211.5 )
    Net interest expense   58.9       67.8       183.3       202.1  
    Provision for income taxes   24.9       22.2       68.9       60.1  
    Depreciation and amortization   133.6       131.3       400.5       391.1  
    EBITDA $ 285.4     $ (97.0 )   $ 870.8     $ 441.8  
    Adjustments to EBITDA:              
    Stock-based compensation   33.8       27.0       85.7       73.3  
    Goodwill impairment1         414.0             414.0  
    Mergers and acquisitions, divestitures and business optimization2   7.3       (6.0 )     17.1       24.5  
    Accelerated technology investment3   21.8       16.3       58.6       53.5  
    Operating model optimization program4   47.3             86.4        
    Net other5   (2.0 )     1.8       9.7       10.6  
    Total adjustments to EBITDA $ 108.3     $ 453.1     $ 257.5     $ 575.8  
    Consolidated Adjusted EBITDA $ 393.7     $ 356.1     $ 1,128.4     $ 1,017.6  
                   
    Net income (loss) attributable to TransUnion margin   6.3 %     (32.9 )%     6.9 %     (7.4 )%
    Consolidated Adjusted EBITDA margin5   36.3 %     36.8 %     35.9 %     35.4 %
                                   

    As a result of displaying amounts in millions, rounding differences may exist in the tables above and footnotes below.

     1.  During the three and nine months ended September 30, 2023, we recorded a goodwill impairment of $414.0 million related to our United Kingdom reporting unit in our International segment.
     2.  Mergers and acquisitions, divestitures and business optimization consisted of the following adjustments:
          Three Months Ended
    September 30,
      Nine Months Ended
    September 30,
           2024    2023     2024    2023 
      Transaction and integration costs   $ 3.6   $ 5.8     $ 7.0   $ 21.0  
      Fair value and impairment adjustments         (10.7 )     0.8     0.8  
      Post-acquisition adjustments     3.7           9.4     5.1  
      Transition services agreement income         (1.1 )         (2.4 )
      Total mergers and acquisitions, divestitures and business optimization   $ 7.3   $ (6.0 )   $ 17.1   $ 24.5  
     3.  Represents expenses associated with our accelerated technology investment to migrate to the cloud. There are three components of the accelerated technology investment: (i) building foundational capabilities, which includes establishing a modern, API-based and services-oriented software architecture, (ii) the migration of each application and customer data to the new enterprise platform, including the redundant software costs during the migration period, as well as the efforts to decommission the legacy system, and (iii) program enablement, which includes dedicated resources to support the planning and execution of the program. The amounts for each category of cost are as follows:
          Three Months Ended
    September 30,
      Nine Months Ended
    September 30,
          2024   2023   2024   2023
      Foundational Capabilities   $ 9.9   $ 8.0   $ 25.0   $ 27.7
      Migration Management     11.0     7.2     29.9     21.9
      Program Enablement     0.9     1.1     3.8     3.9
      Total accelerated technology investment   $ 21.8   $ 16.3   $ 58.6   $ 53.5
     4.  Operating model optimization consisted of the following adjustments:
          Three Months Ended
    September 30,
      Nine Months Ended
    September 30,
           2024    2023    2024    2023
      Employee separation   $   $   $ 24.7   $
      Facility exit     40.5         42.1    
      Business process optimization     6.8         19.6    
      Total operating model optimization   $ 47.3   $   $ 86.4   $
     5.  Net other consisted of the following adjustments:
          Three Months Ended
    September 30,
      Nine Months Ended
    September 30,
           2024     2023     2024     2023 
      Deferred loan fee expense from debt prepayments and refinancing   $ 0.1     $ 1.0     $ 9.2     $ 3.1  
      Other debt financing expenses     0.5       0.3       1.6       1.5  
      Currency remeasurement on foreign operations     (1.7 )     0.8       (0.4 )     6.5  
      Other non-operating (income) expense     (0.8 )     (0.3 )     (0.7 )     (0.5 )
      Total other adjustments   $ (2.0 )   $ 1.8     $ 9.7     $ 10.6  
     6.  Consolidated Adjusted EBITDA margin is calculated by dividing Consolidated Adjusted EBITDA by total revenue.


    SCHEDULE 3

    TRANSUNION AND SUBSIDIARIES
    Adjusted Net Income and Adjusted Diluted Earnings Per Share (Unaudited)
    (in millions, except per share data)

        Three Months Ended
    September 30,
      Nine Months Ended
    September 30,
        2024   2023   2024   2023
    Income (loss) from continuing operations attributable to TransUnion   $ 68.0     $ (318.3 )   $ 218.2     $ (211.5 )
    Discontinued operations, net of tax           (0.5 )           (0.7 )
    Net income (loss) attributable to TransUnion   $ 68.0     $ (318.8 )   $ 218.2     $ (212.2 )
                     
    Weighted-average shares outstanding:                
    Basic     194.6       193.4       194.3       193.3  
    Diluted     197.0       193.4       196.3       193.3  
                     
    Basic earnings (loss) per common share from:                
    Income (loss) from continuing operations attributable to TransUnion   $ 0.35     $ (1.65 )   $ 1.12     $ (1.09 )
    Discontinued operations, net of tax                        
    Net income (loss) attributable to TransUnion   $ 0.35     $ (1.65 )   $ 1.12     $ (1.10 )
    Diluted earnings (loss) per common share from:                
    Income (loss) from continuing operations attributable to TransUnion   $ 0.35     $ (1.65 )   $ 1.11     $ (1.09 )
    Discontinued operations, net of tax                        
    Net income (loss) attributable to TransUnion   $ 0.35     $ (1.65 )   $ 1.11     $ (1.10 )
                     
    Reconciliation of Net income (loss) attributable to TransUnion to Adjusted Net Income:                
    Net income (loss) attributable to TransUnion   $ 68.0     $ (318.8 )   $ 218.2     $ (212.2 )
    Discontinued operations, net of tax           0.5             0.7  
    Income (loss) from continuing operations attributable to TransUnion   $ 68.0     $ (318.3 )   $ 218.2     $ (211.5 )
    Adjustments before income tax items:                
    Amortization of certain intangible assets1     71.5       72.1       214.9       221.2  
    Stock-based compensation     33.8       27.0       85.7       73.3  
    Goodwill impairment2           414.0             414.0  
    Mergers and acquisitions, divestitures and business optimization2     7.3       (6.0 )     17.1       24.5  
    Accelerated technology investment3     21.8       16.3       58.6       53.5  
    Operating model optimization program4     47.3             86.4        
    Net other5     (2.1 )     1.8       8.6       9.6  
    Total adjustments before income tax items   $ 179.6     $ 525.2     $ 471.3     $ 796.0  
    Total adjustments for income taxes6     (43.1 )     (29.5 )     (112.9 )     (85.2 )
    Adjusted Net Income   $ 204.5     $ 177.4     $ 576.6     $ 499.3  
                     
    Weighted-average shares outstanding:                
    Basic     194.6       193.4       194.3       193.3  
    Diluted     197.0       194.6       196.3       194.8  
                     
    Adjusted Earnings per Share:                
    Basic   $ 1.05     $ 0.92     $ 2.97     $ 2.58  
    Diluted   $ 1.04     $ 0.91     $ 2.94     $ 2.56  
        Three Months Ended
    September 30,
      Nine Months Ended
    September 30,
        2024   2023   2024   2023
    Reconciliation of Diluted earnings (loss) per share from Net income (loss) attributable to TransUnion to Adjusted Diluted Earnings per Share:                
    Diluted earnings (loss) per common share from:                
    Net income (loss) attributable to TransUnion   $ 0.35     $ (1.65 )   $ 1.11     $ (1.10 )
    Discontinued operations, net of tax                        
    Income (loss) from continuing operations attributable to TransUnion   $ 0.35     $ (1.65 )   $ 1.11     $ (1.09 )
    Adjustments before income tax items:                
    Amortization of certain intangible assets1     0.36       0.37       1.09       1.14  
    Stock-based compensation     0.17       0.14       0.44       0.38  
    Goodwill impairment2           2.13             2.13  
    Mergers and acquisitions, divestitures and business optimization3     0.04       (0.03 )     0.09       0.13  
    Accelerated technology investment4     0.11       0.08       0.30       0.27  
    Operating model optimization program5     0.24             0.44        
    Net other6     (0.01 )     0.01       0.04       0.05  
    Total adjustments before income tax items   $ 0.91     $ 2.70     $ 2.40     $ 4.09  
    Total adjustments for income taxes7     (0.22 )     (0.15 )     (0.57 )     (0.44 )
    Adjusted Diluted Earnings per Share   $ 1.04     $ 0.91     $ 2.94     $ 2.56  
     

    Each component of earnings per share is calculated independently, therefore, rounding differences exist in the table above.

     1.  Consists of amortization of intangible assets from our 2012 change-in-control transaction and amortization of intangible assets established in business acquisitions after our 2012 change-in-control transaction.
     2.  During the three and nine months ended September 30, 2023, we recorded a goodwill impairment of $414.0 million related to our United Kingdom reporting unit in our International segment.
     3.  Mergers and acquisitions, divestitures and business optimization consisted of the following adjustments:
          Three Months Ended
    September 30,
      Nine Months Ended
    September 30,
          2024   2023   2024   2023
      Transaction and integration costs   $ 3.6   $ 5.8     $ 7.0   $ 21.0  
      Fair value and impairment adjustments         (10.7 )     0.8     0.8  
      Post-acquisition adjustments     3.7           9.4     5.1  
      Transition services agreement income         (1.1 )         (2.4 )
      Total mergers and acquisitions, divestitures and business optimization   $ 7.3   $ (6.0 )   $ 17.1   $ 24.5  
     4.  Represents expenses associated with our accelerated technology investment to migrate to the cloud. There are three components of the accelerated technology investment: (i) building foundational capabilities which includes establishing a modern, API-based and services-oriented software architecture, (ii) the migration of each application and customer data to the new enterprise platform, including the redundant software costs during the migration period, as well as the efforts to decommission the legacy system, and (iii) program enablement, which includes dedicated resources to support the planning and execution of the program. The amounts for each category of cost are as follows:
          Three Months Ended
    September 30,
      Nine Months Ended
    September 30,
          2024   2023   2024   2023
      Foundational Capabilities   $ 9.9   $ 8.0   $ 25.0   $ 27.7
      Migration Management     11.0     7.2     29.9     21.9
      Program Enablement     0.9     1.1     3.8     3.9
      Total accelerated technology investment   $ 21.8   $ 16.3   $ 58.6   $ 53.5
     5.  Operating model optimization consisted of the following adjustments:
          Three Months Ended
    September 30,
      Nine Months Ended
    September 30,
          2024   2023   2024   2023
      Employee separation   $   $   $ 24.7   $
      Facility exit     40.5         42.1    
      Business process optimization     6.8         19.6    
      Total operating model optimization   $ 47.3   $   $ 86.4   $
     6.  Net other consisted of the following adjustments:
          Three Months Ended
    September 30,
      Nine Months Ended
    September 30,
          2024   2023   2024   2023
      Deferred loan fee expense from debt prepayments and refinancing   $ 0.1     $ 1.0   $ 9.2     $ 3.1
      Currency remeasurement on foreign operations     (1.7 )     0.8     (0.4 )     6.5
      Other non-operating (income) and expense     (0.5 )         (0.2 )    
      Total other adjustments   $ (2.1 )   $ 1.8   $ 8.6     $ 9.6
     7.  Total adjustments for income taxes represents the total of adjustments discussed to calculate the Adjusted Provision for Income Taxes.

    SCHEDULE 4
    TRANSUNION AND SUBSIDIARIES
    Adjusted Provision for Income Taxes and Adjusted Effective Tax Rate (Unaudited)
    (dollars in millions)

      Three Months Ended
    September 30,
      Nine Months Ended
    September 30,
      2024   2023   2024   2023
    Income (loss) from continuing operations before income taxes $ 96.8     $ (291.7 )   $ 300.5     $ (139.5 )
    Total adjustments before income tax items from Schedule 3   179.6       525.2       471.3       796.0  
    Adjusted income (loss) from continuing operations before income taxes $ 276.4     $ 233.5     $ 771.8     $ 656.5  
                   
    Reconciliation of Provision for income taxes to Adjusted Provision for Income Taxes:              
    Provision for income taxes   (24.9 )     (22.2 )     (68.9 )     (60.1 )
    Adjustments for income taxes:              
    Tax effect of above adjustments   (41.8 )     (27.9 )     (108.5 )     (90.1 )
    Eliminate impact of excess tax (benefit) expense for stock-based compensation   (2.3 )     0.7       (1.4 )     2.7  
    Other1   0.9       (2.2 )     (3.0 )     2.2  
    Total adjustments for income taxes $ (43.1 )   $ (29.5 )   $ (112.9 )   $ (85.2 )
    Adjusted Provision for Income Taxes $ (68.0 )   $ (51.7 )   $ (181.8 )   $ (145.3 )
                   
    Effective tax rate   25.7 %     (7.6 )%     22.9 %     (43.1 )%
    Adjusted Effective Tax Rate   24.6 %     22.2 %     23.6 %     22.1 %
                                   

    As a result of displaying amounts in millions, rounding differences may exist in the table above.

      1.  Other adjustments for income taxes include:
          Three Months Ended
    September 30,
      Nine Months Ended
    September 30,
          2024   2023   2024   2023 
      Deferred tax adjustments   $ 3.8     $ (0.2 )   $ (1.4 )   $ 0.6  
      Valuation allowance adjustments     (2.3 )     (1.9 )     (2.1 )     (0.8 )
      Return to provision, audit adjustments, and reserves related to prior periods     (1.2 )     1.4       1.2       2.6  
      Other adjustments     0.7       (1.6 )     (0.7 )     (0.3 )
      Total other adjustments   $ 0.9     $ (2.2 )   $ (3.0 )   $ 2.2  
     

    SCHEDULE 5
    TRANSUNION AND SUBSIDIARIES
    Leverage Ratio (Unaudited)
    (dollars in millions)

        Trailing Twelve
    Months Ended
    September 30, 2024
    Reconciliation of Net income attributable to TransUnion to Consolidated Adjusted EBITDA:    
    Net income attributable to TransUnion   $ 224.2
    Net interest expense     248.6
    Provision for income taxes     53.6
    Depreciation and amortization     533.8
    EBITDA   $ 1,060.2
    Adjustments to EBITDA:    
    Stock-based compensation   $ 113.0
    Mergers and acquisitions, divestitures and business optimization1     27.2
    Accelerated technology investment2     75.6
    Operating model optimization program3     164.0
    Net other4     14.4
    Total adjustments to EBITDA   $ 394.3
    Leverage Ratio Adjusted EBITDA   $ 1,454.5
         
    Total debt   $ 5,201.4
    Less: Cash and cash equivalents     643.2
    Net Debt   $ 4,558.2
         
    Ratio of Net Debt to Net income attributable to TransUnion     20.3
    Leverage Ratio     3.1

    As a result of displaying amounts in millions, rounding differences may exist in the table above.

    1.  Mergers and acquisitions, divestitures and business optimization consisted of the following adjustments:
          Trailing Twelve
    Months Ended
    September 30, 2024
      Transaction and integration costs   $ 16.9  
      Fair value and impairment adjustments     10.3  
      Post-acquisition adjustments     0.1  
      Transition services agreement income     (0.1 )
      Total mergers and acquisitions, divestitures and business optimization   $ 27.2  
    2.  Represents expenses associated with our accelerated technology investment to migrate to the cloud. There are three components of the accelerated technology investment: (i) building foundational capabilities which includes establishing a modern, API-based and services-oriented software architecture, (ii) the migration of each application and customer data to the new enterprise platform including the redundant software costs during the migration period, as well as the efforts to decommission the legacy system, and (iii) program enablement, which includes dedicated resources to support the planning and execution of the program. The amounts for each category of cost are as follows:
          Trailing Twelve
    Months Ended
    September 30, 2024
      Foundational Capabilities   $         33.0        
      Migration Management             37.5        
      Program Enablement             5.1        
      Total accelerated technology investment   $         75.6        
    3.  Operating model optimization consisted of the following adjustments:
          Trailing Twelve
    Months Ended
    September 30, 2024
      Employee separation   $         96.6        
      Facility exit             45.5        
      Business process optimization             21.9        
      Total operating model optimization   $         164.0        
    4.  Net other consisted of the following adjustments:
          Trailing Twelve
    Months Ended
    September 30, 2024
      Deferred loan fee expense from debt prepayments and refinancings   $ 15.4  
      Other debt financing expenses     2.3  
      Currency remeasurement on foreign operations     (2.2 )
      Other non-operating (income) and expense     (1.2 )
      Total other adjustments   $ 14.4  
       

    SCHEDULE 6
    TRANSUNION AND SUBSIDIARIES
    Segment Depreciation and Amortization (Unaudited)
    (in millions)

      Three Months Ended September 30,   Nine Months Ended September 30,
       2024    2023    2024    2023
                   
    U.S. Markets $ 99.3   $ 99.3   $ 299.4   $ 292.3
    International   33.4     31.0     98.1     95.5
    Corporate   1.0     1.1     3.0     3.3
    Total depreciation and amortization $ 133.6   $ 131.3   $ 400.5   $ 391.1
     

    As a result of displaying amounts in millions, rounding differences may exist in the table above.

    SCHEDULE 7
    TRANSUNION AND SUBSIDIARIES
    Reconciliation of Non-GAAP Guidance (Unaudited)
    (in millions, except per share data)

      Three Months Ended December 31, 2024   Twelve Months Ended December 31, 2024
      Low   High   Low   High
    Guidance reconciliation of Net income attributable to TransUnion to Adjusted EBITDA:              
    Net income attributable to TransUnion $ 65     $ 77     $ 284     $ 295  
    Interest, taxes and depreciation and amortization   216       219       868       872  
    EBITDA $ 281     $ 296     $ 1,152     $ 1,167  
    Stock-based compensation, mergers, acquisitions divestitures and business optimization-related expenses and other adjustments1   79       79       336       336  
    Adjusted EBITDA $ 360     $ 375     $ 1,488     $ 1,503  
                   
    Net income attributable to TransUnion margin   6.4 %     7.4 %     6.8 %     7.1 %
    Consolidated Adjusted EBITDA margin2   35.5 %     36.2 %     35.8 %     36.0 %
                   
    Guidance reconciliation of Diluted earnings per share to Adjusted Diluted Earnings per Share:              
    Diluted earnings per share $ 0.34     $ 0.39     $ 1.45     $ 1.51  
    Adjustments to diluted earnings per share1   0.58       0.58       2.42       2.42  
    Adjusted Diluted Earnings per Share $ 0.92     $ 0.98     $ 3.87     $ 3.93  
     

    As a result of displaying amounts in millions, rounding differences may exist in the table above.

    1. These adjustments include the same adjustments we make to our Adjusted EBITDA and Adjusted Net Income as discussed in the Non-GAAP Financial Measures section of our Earnings Release.
    2. Consolidated Adjusted EBITDA margin is calculated by dividing Consolidated Adjusted EBITDA by total revenue.

    The MIL Network

  • MIL-OSI Asia-Pac: Bazaar to mark 75th National Day

    Source: Hong Kong Information Services

    ​The Home Affairs Department and 28 provincial-level Clansmen Associations will hold a bazaar carnival from October 25 to 29 at Sha Tin Park to celebrate the 75th anniversary of the founding of the People’s Republic of China.

    The five-day bazaar carnival will feature 75 market stalls, offering specialty foods and hometown products from across the country.

    Citizens and tourists may also experience a rich variety of customs and unique cultures from across the country via the cultural performances, film screenings and an introduction to different provincial cultures at the carnival.

    The event is free and admission tickets are not required.

    MIL OSI Asia Pacific News

  • MIL-OSI Asia-Pac: Second-day auction results for Victoria Park Lunar New Year Fair stalls

    Source: Hong Kong Government special administrative region

         A total of 59 regular size dry goods stalls and 40 large size dry goods stalls were all successfully let on the second-day auction for stalls at the 2025 Victoria Park Lunar New Year Fair today (October 23).

         Around 460 people attended the auction at the Assembly Hall, 2/F, Lai Chi Kok Government Offices, 19 Lai Wan Road, Lai Chi Kok, Kowloon, from 9am to 5.30pm today, a spokesman for the Food and Environmental Hygiene Department said.

         The average bid price for the regular size dry goods stalls today was $11,729, with the successful bids ranging from $8,540 to $30,000. The highest bid, $30,000, was about 3.5 times the opening price of $8,540.

         The average bid price for the large size dry goods stalls today was $16,230, with the successful bids ranging from $12,810 to $41,000. The highest bid, $41,000, was about 3.2 times the opening price of $12,810.

         The auction for the remaining 117 dry goods stalls will be held at 9am tomorrow (October 24) at the same venue.

         The spokesman reminded the successful bidders to comply with all the stipulations and provisions as set out in the licence agreement. Otherwise, the department is entitled to terminate the agreement and the licensee shall immediately vacate the stall.

    MIL OSI Asia Pacific News

  • MIL-OSI Europe: Answer to a written question – Impact of possible curb on exports of Russian uranium – E-001721/2024(ASW)

    Source: European Parliament

    Already in 2014, with the European Energy Security Strategy[1], the Commission emphasised the need for all EU operators to have a diversified portfolio of fuel supply and for fuel supply diversification to be a condition for any new investment in the nuclear sector.

    In response to Russia’s full-scale war of aggression against Ukraine, the EU decided to phase out its remaining dependence on Russia. The REPowerEU Plan[2] emphasises further the need for diversification and securing alternative sources of uranium, and boosting conversion, enrichment, and fuel fabrication capacities.

    The Commission and the Euratom Supply Agency (ESA) have been engaging with concerned Member States to assess dependencies and ensure security of supply in the nuclear value chain. Utilities have taken steps to diversify their supplies, increase stockpiling of nuclear material and fuel, and prepare for potential disruptions to supplies.

    The electricity produced in Soviet-designed reactors (dependent on Russian fuel supply) accounts for about 10% of EU gross nuclear electricity capacity. Utilities operating these reactors in Bulgaria, Czechia, Slovakia and Finland have signed supply contracts with alternative fuel suppliers and are moving forward with the licensing process for the new fuels (already tested by several utilities).

    Meanwhile, mothballed uranium mines in the United States (US), Australia, Canada and Africa have returned to operation, and additional conversion and enrichment capacity is being developed in the EU, United Kingdom, US and Canada.

    The Commission and ESA continue to monitor the market and the supply situation and engage with utilities and national authorities to ensure the diversification of supply in the civil nuclear industry.

    • [1] https://eur-lex.europa.eu/legal-content/EN/TXT/PDF/?uri=CELEX:52014DC0330&from=EN
    • [2] https://commission.europa.eu/strategy-and-policy/priorities-2019-2024/european-green-deal/repowereu-affordable-secure-and-sustainable-energy-europe_en

    MIL OSI Europe News

  • MIL-OSI Asia-Pac: Dr. Mansukh Mandaviya Chairs Stakeholders Consultation Meeting with Athletes and Coaches on Draft National Sports Governance Bill 2024

    Source: Government of India (2)

    Dr. Mansukh Mandaviya Chairs Stakeholders Consultation Meeting with Athletes and Coaches on Draft National Sports Governance Bill 2024

    More we empower our coaches, the better they will be able to produce outstanding athletes for the nation: Dr. Mandaviya

    Draft Bill to Establish Comprehensive Framework for Sportspersons Development and Welfare: Union Minister

    Posted On: 23 OCT 2024 3:55PM by PIB Delhi

    Union Minister of Youth Affairs & Sports and Labour & Employment, Dr. Mansukh Mandaviya chaired a stakeholders’ consultation meeting to discuss the Draft National Sports Governance Bill 2024 in New Delhi today. This consultation is part of a series of meetings being held with various stakeholders to gather inputs on the Draft Bill, aimed at shaping a robust governance framework for sports in India.

    In his address, Dr. Mandaviya emphasized that the Draft National Sports Governance Bill 2024 aims to establish a comprehensive framework to promote the development and welfare of sportspersons, ensure ethical governance, and provide effective dispute resolution mechanisms. “The Bill has been drafted with a holistic approach, keeping in mind the diverse needs of athletes, coaches, and other stakeholders,” he added.

    Dr. Mandaviya invited participants to share their insights and suggestions, stating, “You have been called here for your valuable inputs to make this Bill more effective so that athletes, coaches, and other stakeholders can truly benefit.” He acknowledged the significant role of coaches in nurturing sports talent, saying, “I am clear that the more we empower our coaches, the better they will be able to produce outstanding athletes for the nation.”

    Union Minister also stressed the potential of India’s youth and the importance of channelling their talent in the right direction. “There is no shortage of youth, talent, or brainpower in our country. Our aim is to provide them with the right direction in the spirit of good governance,” he remarked.

    During the meeting, athletes and coaches expressed their appreciation for the opportunity to contribute to the discussion on the Draft Bill. They shared their suggestions and emphasized that this initiative marks a positive step toward inclusive and athlete-centric governance in Indian sports.

    The event witnessed participation from a diverse group of distinguished athletes, including Arjuna Awardees, Khel Ratna Awardees, Olympians, Paralympians, and Dronacharya award winning coaches. Approximately 40 sportspersons and coaches attended the meeting in person, while around 120 joined virtually. Prominent former and current sportspersons and coaches such as Ronjon Sodhi, Mansher Singh, Neeraj Chopra, Gurbax Singh, Ashok Kumar Dhyan Chand, Bhawani Devi, Nikhat Zareen, Ankur Dhama, Maha Singh Rao, Dr. Satya Pal Singh, among others, gave their views and suggestions on the draft Bill. 

    Ministry of Youth Affairs and Sports has put in public domain the Draft National Sports Governance Bill, 2024 for inviting comments/suggestions of general public and the stakeholders, as part of pre-legislative consultation process. Stakeholders and general public have been requested to send suggestions/comments to the Ministry preferably by email at email id draft.sportsbill[at]gov[dot]inby 25.10.2024.

    Draft National Sports Governance Bill 2024 can be accessed at  https://yas.nic.in/sports/draft-national-sports-governance-bill-2024-inviting-comments-suggestions-general-public-and.

    *****

    Himanshu Pathak

    (Release ID: 2067331) Visitor Counter : 72

    MIL OSI Asia Pacific News

  • MIL-OSI Asia-Pac: IFFI 2024 celebrates Australia’s Rich Film Traditions and Vibrant Cinema Culture

    Source: Government of India

    IFFI 2024 celebrates Australia’s Rich Film Traditions and Vibrant Cinema Culture

    Australia to be the “Country of Focus” at the 55th edition of the International Film Festival of India

    Australia-India Co-Production Panel to explore collaboration opportunities at ‘Film Bazaar’

    Academy award winning Cinematographer John Seale to host Master Class at IFFI 2024

    Posted On: 23 OCT 2024 3:05PM by PIB Mumbai

    #IFFIWood, 23rd October 2024

    The Ministry of Information & Broadcasting is proud to announce that Australia has been nominated as the “Country of Focus” at the 55th edition of the International Film Festival of India (IFFI), to be held in Goa from 20th November to 28th November 2024. This special recognition aims to celebrate the dynamic contributions of Australian cinema to the global film industry, highlighting its rich storytelling traditions, vibrant film culture and innovative cinematic techniques.  India & Australia are already parties to an Audio Visual Co-production Treaty.


    Country of Focus at IFFI

    The “Country of Focus” segment is a key feature of IFFI, offering a dedicated showcase of a nation’s best contemporary films. Australia’s diverse cultural background and globally acclaimed filmmakers have had a lasting impact on cinema, making it a fitting selection for this year. This inclusion reflects the strengthening collaboration between the Indian and Australian film industries.

    Showcase of Australian Films

    IFFI will present a carefully curated selection of seven Australian films, offering a diverse blend of genres, from critically acclaimed dramas to powerful documentaries, visually stunning thrillers, and light-hearted comedies. These films will showcase the unique cultural identity of Australia, reflecting the vibrant spectrum of stories from its indigenous and contemporary communities.

    Participation in Film Bazaar

    Film Bazaar, the largest South Asian film market held alongside the International Film Festival of India (IFFI), will see a sizeable Australian participation with a strong delegation from Screen Australia, State Screen Commissions and also Ausfilm, the agency promoting Australia as a filming destination. They will showcase their offerings including Australian locations and incentives at the special Film Office exhibition area. The Film Bazaar will also see a Producers’ delegation with upto six producers receiving funding from the Australian Government to attend Film Bazaar and explore co-production opportunities. There will also be a special Australian Co-production Day at the Film Bazaar where filmmaker delegates from both the countries will be given an opportunity to network. Film Bazaar has also selected the Australian project Home Before Night as one of its official entries in the Co-Production Market.


    Australia-India Film Co-Production Panel

    In line with the growing collaboration between the Indian and Australian film industries, a dedicated panel discussion in the Knowledge Series will focus on co-production opportunities between the two countries. Featuring producers and industry experts, the panel will explore the creative and logistical aspects of co-productions and highlight successful ventures.

    Master Class by Cinematographer John Seale

    A major attraction will be a Cinematography Master Class led by Academy Award-winning cinematographer John Seale, known for his work on iconic films such as Mad Max: Fury Road and The English Patient. This session will delve into his artistic journey and offer invaluable technical insights to budding filmmakers and enthusiasts.

    The 55th IFFI is set to be an exhilarating celebration of world cinema, bringing together an eclectic mix of films from across the globe, stimulating panel discussions, engaging workshops, and exclusive screenings. This year’s “Country of Focus” spotlight on Australia is sure to enhance IFFI’s mission of fostering cultural exchange and promoting cinematic art that transcends borders.

    Founded in 1952, the International Film Festival of India is one of Asia’s most significant film festivals, serving as a platform for filmmakers worldwide to present their works. Held annually in Goa, IFFI attracts directors, producers, actors, and film enthusiasts to celebrate the finest in world cinema.


    PIB IFFI CAST AND CREW | Dharmendra/ Rajith/ Kshitij/ Nikita/ Sriyanka/ Priti IFFI 55 – 3

    Follow us on social media:  @PIBMumbai     /PIBMumbai     /pibmumbai   pibmumbai[at]gmail[dot]com   /PIBMumbai     /pibmumbai


    (Release ID: 2067309) Visitor Counter : 88

    MIL OSI Asia Pacific News

  • MIL-OSI Asia-Pac: English Translation of Prime Minister’s Remarks at the Closed Plenary of the 16th BRICS Summit

    Source: Government of India

    Posted On: 23 OCT 2024 3:25PM by PIB Delhi

    Your Highness,
    Excellencies,

    I express my heartfelt gratitude to President Putin for the wonderful organisation of todays, meeting.

    I am very pleased that we are meeting for the first time today, as the extended BRICS Family.I warmly welcome all the new friends that have joined the BRICS family.

    I congratulate President Putin for Russia’s successful Presidency of BRICS over the last one year.

    Friends,

    Our meeting is taking place at a time, when the world is facing several pressing challenges such as wars, economic uncertainty, climate change and terrorism. The world is talking about the North South divide and the East West divide.

    Preventing inflation, ensuring food security, energy security , health security, water security, are matters of priority for all countries in the world.

    And in this era of technology, new challenges have emerged such as cyber deepfake, disinformation.

    At such a time, there are high expectations of BRICS. I believe that as a diverse and inclusive platform, BRICS can play a positive role in all areas.

    In this regard, our approach must remain people centric.We have to give the world the message that BRICS is not a divisive organisation but one that works in the interest of humanity.

    We support dialogue and diplomacy, not war. And just as we were able to overcome a challenge like COVID together, we are certainly able to create new opportunities to ensure a secure , strong and prosperous future for future generations.

    In order to counter terrorism and Terror financing, we need the single minded, firm support of all. There is no place for double standards on this serious matter. We need to take active steps to stop radicalization of youth in our countries.

    We must work together on the long pending matter in the UN of the Comprehensive Convention on International Terrorism.

    The same way, we need to work on global regulations for cyber security and for safe and secure AI.

    Friends,

    India is ready to welcome new countries into BRICS as Partner Countries.

    In this regard all decisions should be taken by consensus, and the views of BRICS founding members should be respected. The Guiding principles , standards, criteria and procedures adopted during the Johanesburg summit, should be complied with by all members and partner countries.

    Friends,

    BRICS is an organisation, which is willing to evolve with time.By giving our own example to the world we must collectively and in a united manner, raise our voice for reforms of global institutions.

    We must move forward in a time bound manner on reforms in global institutions such as the UN Security Council, Multilateral development banks, and the WTO.

    As we take our efforts forward in BRICS, we must be careful to ensure that this organisation does not acquire the image of one that is trying to replace global instutions, instead of being perceived as one that wishes to reform them.

    The hopes , aspirations and expectations of the countries of the Global south must also be kept in mind. During our Voice of Global South Summits and G20 Presidency, India put the voices of these countries on the global stage.I am pleased that these efforts are being strengthened under BRICS as well.Last year countries of Africa were integrated into BRICS.

    This year, as well, several countries of the Global south have been invited by Russia.

    Friends,

    The BRICS grouping , created by the confluence of different viewpoints and ideologies, is a source of inspiration for the world,fostering positive cooperation.

    Our diversity, respect for each other and our tradition of moving forward on the basis of consensus, are the basis for our cooperation.This quality of ours, and our BRICS spirit, are attracting other countries as well to this forum. I am confident that in the times to come we will together make this unique platform a model for dialogue, cooperation and coordination.

    In this regard, as a Founding member of BRICS, India will always continue to fulfill its responsibilities.

    Once again, a big thank you to all of you.

    DISCLAIMER – This is the approximate translation of Prime Minister’s remarks. Original remarks were delivered

    MIL OSI Asia Pacific News

  • MIL-OSI Asia-Pac: Government of India, under the leadership of Prime Minister Shri Narendra Modi, to commemorate 150th birth anniversary of Sardar Patel with a two-year-long nationwide celebration from 2024 to 2026 to honor his monumental contributions

    Source: Government of India

    Government of India, under the leadership of Prime Minister Shri Narendra Modi, to commemorate 150th birth anniversary of Sardar Patel with a two-year-long nationwide celebration from 2024 to 2026 to honor his monumental contributions

    Announcing the decision Union Home Minister Shri Amit Shah says, this celebration will serve as a testament to Sardar Patel’s remarkable achievements and the spirit of unity that he epitomized

    Sardar Patel Ji’s enduring legacy as the visionary behind the establishment of one of the world’s most robust democracies and his pivotal role in unifying India from Kashmir to Lakshadweep remains indelible

    Posted On: 23 OCT 2024 3:20PM by PIB Delhi

    Union Home Minister and Minister of Cooperation, Shri Amit Shah has announced that the Government of India, under the leadership of Prime Minister Shri Narendra Modi, will commemorate 150th birth anniversary of Sardar Patel with a two-year-long nationwide celebration from 2024 to 2026.

    Announcing this decision in a post on X platform, Union Home Minister and Minister of Cooperation said that “Sardar Patel Ji’s enduring legacy as the visionary behind the establishment of one of the world’s most robust democracies and his pivotal role in unifying India from Kashmir to Lakshadweep remains indelible. To honor his monumental contributions, the government of India, under the leadership of PM Shri Narendra Modi Ji, will commemorate his 150th birth anniversary with a two-year-long nationwide celebration from 2024 to 2026. This celebration will serve as a testament to his remarkable achievements and the spirit of unity that he epitomized.”

    *****

    RK / VV / RR / PS

    (Release ID: 2067316) Visitor Counter : 96

    Read this release in: Hindi

    MIL OSI Asia Pacific News

  • MIL-OSI Asia-Pac: Shri Dharmendra Pradhan addresses Australian International Education Conference

    Source: Government of India (2)

    Shri Dharmendra Pradhan addresses Australian International Education Conference

    Shri Dharmendra Pradhan holds a bilateral meeting with his Australian counterpart Hon. Jason Clare, MP in Melbourne

    Establishment of Australian university campuses in India just the beginning, much more potential to be realized – Shri Dharmendra Pradhan

    Cooperation in education is the fulcrum of India-Australia relationship – Shri Dharmendra Pradhan

    NEP 2020 has transformed India’s learning landscape into a powerhouse of possibilities – Shri Dharmendra Pradhan

    As a ‘Vishwa-Bandhu’, India is committed to being a trusted partner in human-centric development – Shri Dharmendra Pradhan

    By 2035 one in four people around the world who get a university degree will get it in India – Hon. Jason Clare, MP

    Posted On: 23 OCT 2024 3:09PM by PIB Delhi

    Union Minister for Education, Shri Dharmendra Pradhan, delivered the plenary speech at the Australian International Education Conference in Melbourne, Australia, today. Shri Pradhan also held a Bilateral Meeting with his counterpart Minister for Education, Government of Australia, Mr. Jason Clare MP. Members of the Indian delegation, heads of the universities of both countries, and other dignitaries were also present at the event.

    Shri Pradhan in his speech commended the strong and evolving partnership between India and Australia that ties the history of the two countries and will also pave the way for a brighter future together. He also reaffirmed the further strengthening of these ties under the visionary leadership of Prime Minister Shri Narendra Modi and Prime Minister of Australia Mr. Anthony Albanese.

    Shri Pradhan also highlighted that in the 4th Industrial Revolution, education must prepare students to be creators and managers of technology. India’s National Education Policy provides a framework emphasising digital literacy, soft skills, critical thinking, and interdisciplinary studies to adapt to evolving job markets, he added.

    Shri Pradhan emphasized that cooperation in education is the fulcrum of the India-Australia relationship. He stated that the main objective is to enhance India’s education system into a competency-based framework, focusing on skills-based education as outlined in India’s National Education Policy (NEP).

    The Minister spoke about how NEP 2020 has transformed India’s learning landscape into a powerhouse of possibilities, the enduring India-Australia ties and the remarkable strides made in education cooperation powered by NEP 2020. The establishment of Australian university campuses in India is just the beginning, with much more potential to be realized, he added.

    He also added that together, the countries can advance knowledge, leverage technology for global challenges, and create endless opportunities for innovation and entrepreneurship for the students.

    The Minister also expressed that as a ‘Vishwa-Bandhu’, India is committed to being a trusted partner in human-centric development. The idea is to build and nurture global citizens, contributing to a brighter future for the next generation, he said.

    Mr. Jason Clare MP, in his speech, emphasised the importance of a good education system that can change more than just lives. It can change nations, he added. Commending India’s education systems, he said that by 2035 one in four people around the world who get a university degree will get it in India. He mentioned how Australian universities like Deakin had been in India for 30 years and now Wollongong has one campus. He expressed his gratitude to Shri Pradhan for encouraging these initiatives. He also praised the work the six Innovative Research Universities are doing by exploring options for a consortium campus in India.

    Earlier in the day, Shri Pradhan also met Mr. Jason Clare MP for a discussion regarding shared priorities of India and Australia in early childhood care, capacity building of teachers, and the potential for school twinning initiatives. Building on the strong institutional linkages between Indian and Australian higher education institutions, they agreed to further strengthen the partnership in critical and emerging technologies. They also explored the possibility of establishing branch campuses of Australian universities in India.

    During these discussions, Shri Pradhan also met the Assistant Minister of Foreign Affairs, Mr. Tim Watts MP.

    Shri Pradhan met Mrs. Jacinta Allan MP, Premier of Victoria, Australia. He highlighted that Victoria is home to the largest Indian diaspora in Australia. They had engaging conversations on ways to strengthen institutional linkages of schools and universities in Victoria with India.

    Shri Pradhan also visited South Melbourne Primary School and engaged with young learners. He explored the school’s innovative approaches to early childhood education. He emphasized how NEP 2020 in India places a strong focus on Early Childhood Care and Education (ECCE), which is essential for a child’s holistic development. He reaffirmed his commitment to adopting global best practices to make early learning universal, enjoyable, and stress-free.

    Shri Dharmendra Pradhan visited the Royal Melbourne Institute of Technology (RMIT), a hub for technology, design, and enterprise. He explored their ‘Discovery to Device’ med-tech facility, fast-tracking ideas to products. He also appreciated the university’s emphasis on industry experience, hands-on skills, and focus on transforming ideas into products. Shri Pradhan explored how RMIT can partner and work with top Indian HEIs to equip Indian students with future skills and jobs.

    Discovery to Device transforms ideas into products, through prototyping and scale-up manufacture, to create real-world impact.

    Shri Pradhan also visited Monash University, which has notably welcomed Indian students since the late 1960s. Shri Pradhan received key insights into the university’s research & innovation ecosystem and their plans to strengthen educational ties with Indian institutions through its New India Plan. He also toured the Innovation Lab & Center for Nanofabrication— commending their impressive facilities supporting talent in driving ideas into impactful innovations.

    In a significant move to enhance bilateral cooperation in the education sector, Shri Pradhan is visiting Australia from 22 to 26 October 2024. The visit is expected to foster collaboration, participation, and synergy in critical areas of mutual interest in education. Earlier this week from 20-21 October, Shri Pradhan visited Singapore and met the Prime Minister, Deputy Prime Minister, Education Minister and other dignitaries to expand bilateral cooperation in skill-based education and research.

    *****

    SS/AK

    (Release ID: 2067313) Visitor Counter : 69

    MIL OSI Asia Pacific News

  • MIL-OSI Asia-Pac: Ministry of Mines Organizes One-Day Workshop on Study on State Best Practices in Mining in Collaboration with FIMI

    Source: Government of India

    Posted On: 23 OCT 2024 2:51PM by PIB Delhi

    The Ministry of Mines, in collaboration with the Federation of Indian Mineral Industries (FIMI) successfully organized a one-day workshop on Study on State Best Practices in Mining, in Delhi today. It was attended by representatives of 20 States and from mining industry. This interactive workshop aimed at building an understanding on various initiatives & policy reforms undertaken by the States. The objective of the study is to assess and identify the different best practices that State governments have implemented/ adopted within their jurisdictions and showcase how other States can replicate/ adopt these practices to further improve mining sector growth. This Study will complement the on-going work of the Ministry to develop a State Mining Index, the Framework of which was issued to the States in September for data submission.

    The Secretary, Ministry of Mines, Govt. of India, Shri V. L. Kantha Rao was the Chief Guest at the inaugural session of the workshop. In his keynote address, Shri Rao emphasized the crucial role of States in fostering a strong regulatory environment by introducing innovative policies, initiatives, and administrative measures that drive impactful and sustainable progress of the sector. Emphasizing the active participation of States being important in successful completion of study, he encouraged the representatives from the States to share the information on best practices undertaken/ adopted by them.

    ****

    ST

    (Release ID: 2067303) Visitor Counter : 48

    MIL OSI Asia Pacific News

  • MIL-OSI Asia-Pac: ICG implements preventive measures in view of Cyclone Dana’s likely landfall along West Bengal & Odisha coasts

    Source: Government of India

    ICG implements preventive measures in view of Cyclone Dana’s likely landfall along West Bengal & Odisha coasts  

    Vessels & aircraft strategically positioned; Weather warnings & safety advisories being broadcast; Disaster relief teams on standby

    Posted On: 23 OCT 2024 2:49PM by PIB Delhi

    As Cyclone Dana is forecast to make landfall on October 24-25, 2024 along the coasts of West Bengal and Odisha, Indian Coast Guard (ICG) Region (North-East) has implemented a series of preventive measures to safeguard lives and property at sea. The ICG has been closely monitoring the situation and has taken proactive steps to ensure preparedness for dealing with any emergency arising from the cyclone’s impact. 

    ICG has tasked ships, aircraft and Remote Operating Stations at West Bengal and Odisha to broadcast regular weather warnings and safety advisories to fishermen and mariners. These alerts are being transmitted continuously to all fishing vessels, urging them to return to shore immediately and seek safe shelter.

    The ICG has mobilised its vessels and aircraft, positioning them strategically to respond swiftly to any emergency situation at sea. Additionally, ICG personnel are working in coordination with local administrations and disaster management authorities to ensure a coordinated and effective response.

    Fishing communities along the coastline have been informed through various channels, including village heads, to avoid venturing into the sea until the cyclone passes. The ICG is on high alert, with its dedicated disaster relief teams and assets ready to provide assistance, rescue & relief operations.

     ***

    SR/Savvy/KB

    (Release ID: 2067301) Visitor Counter : 65

    MIL OSI Asia Pacific News

  • MIL-OSI Asia-Pac: Mid Term Progress of Ministry of Steel under Special Campaign 4.0 for Disposal of Pending Matters

    Source: Government of India (2)

    Posted On: 23 OCT 2024 1:54PM by PIB Delhi

    Ministry of Steel, in collaboration with its CPSEs has initiated efforts and prepared action plans for implementing Special Campaign for Disposal of Pending Matters (SCDPM) 4.0 from 02 October 2024 to 31 October 2024.

    The SCDPM aims to systematically address and dispose of pending references across various categories, including Member of Parliament (MP) references, Prime Minister’s Office (PMO) references, VIP and Cabinet references, State Government references, and CPGRAM matters and other important matters.

    The mid-term progress of SCDPM 4.0 highlights significant achievements, with 87% of references from Members of Parliament already replied to and 80% of the public grievances target reached. Additionally, 9,690 physical files have been weeded out, freeing up 21,379 sq. ft. of space due to scrap disposal and file weeding. Out of a target of 375, 159 cleanliness campaigns have been conducted so far. Regular review meetings with nodal officers of CPSEs are also being held to monitor progress effectively.


    One Stop Centre functionaries in MECON Delhi Office carried out cleaning of drainage, grass cutting and cleanliness drive under ongoing Special Campaign 4.0 


               BEFORE                                                                AFTER                        


    One Stop functionaries in Bhilai (SAIL) conducted drive on cleanliness in Streets, Office and Garden with focus on maintaining hygiene for prevention of Dengue and Malaria.


    MSTC Carried out awareness among its employees and public about importance of SCDPM 4.0

    The Ministry of Steel, under Special Campaign 4.0 for Disposal of Pending Matters, has undertaken various initiatives to promote cleanliness and environmental sustainability across its units. SAIL-Bhilai Steel Plant concluded its “Swachhata Hi Seva 2024” program with a Shramdaan activity and honored Safai Mitra workers for their dedication. Additionally, MOIL demonstrated leadership in Nagpur by conducting eco-friendly initiatives, including Shramdaan, contributing to the Swachhata Hi Seva campaign. These activities, shared through social media, underscore the Ministry’s commitment to fostering a cleaner and greener India.


    ******

    MG

    (Release ID: 2067290) Visitor Counter : 55

    MIL OSI Asia Pacific News

  • MIL-OSI Asia-Pac: Union Food and Consumer Affairs Minister Shri Pralhad Joshi launches retail of Bharat Chana Dal Phase – II in Delhi-NCR by flagging off mobile vans

    Source: Government of India

    Union Food and Consumer Affairs Minister Shri Pralhad Joshi launches retail of Bharat Chana Dal Phase – II in Delhi-NCR by flagging off mobile vans

    Chana Dal at MRP Rs.70 per kg and Chana Whole at Rs.58 per kg is made available to consumers from 3 lakh ton of Chana stock

    Government of India committed towards ensuring availability of essential food items to consumers at affordable prices: Shri Pralhad Joshi

    Posted On: 23 OCT 2024 1:38PM by PIB Delhi

    Union Minister of Consumer Affairs, Food and Public Distribution & New and Renewable Energy, Shri Pralhad Joshi, launched the retail of Bharat Chana Dal Phase – II in Delhi-NCR by flagging off mobile vans of NCCF, NAFED and Kendriya Bhandar here today, in the presence of Ministers of State, Shri B.L. Verma and Smt. Nimuben Jayantibhai Bambhaniya.

    In Phase – II of Bharat Chana Dal, 3 lakh tons of Chana stock from the price stabilisation buffer is being converted to Chana Dal and Chana Whole for retail sale to consumers at MRP of Rs.70 per kg and Rs.58 per kg, respectively. Apart from Chana, the government had also expanded the Bharat brand to Moong and Masur Dals. The Bharat Moong Dal is retailed at Rs.107 per kg, Bharat Moong Sabut at Rs.93 per kg and Bharat Masur Dal at Rs.89 per kg. The resumption of Bharat Chana Dal at this time will enhance the supplies to consumers of Delhi-NCR in this festive season.

    While interacting with media persons during the event, Shri Joshi stated that the initiative is an affirmation of the Government of India’s commitment to ensuring the availability of essential food to the consumers at affordable prices. Direct interventions through retail sale of basic food items such as rice, atta, dals and onion have also helped in maintaining stable price regime.

    The Centre has taken various policy measures to ensure availability of pulses. In order to encourage domestic production, the government has raised the MSP of pulses year after year, and also announced the policy to procure Tur, Urad and Masur without ceiling for 2024-25 season. During Kharif 2024-25 sowing season, NCCF and NAFED had conducted awareness campaigns, seed distribution and pre-registration of farmers for assured procurement, and the same activities are being continued in upcoming Rabi sowing season. To augment domestic production and facilitate seamless import, the government has allowed duty free import of Tur, Urad, Masur and Chana till 31st March, 2025 and Yellow Peas import till 31st December, 2024. Enhanced area coverage of Kharif pulses this year, together with continuous inflow of imports have led to declining trend in the prices of most pulses since July, 2024. The retail prices of Tur dal, Urad dal, Moong dal and Masur dal have either declined or remained stable during the past three months.

    In respect of vegetables, the government had procured 4.7 lakh tonnes onions from the rabi crop for price stabilisation buffer through NCCF and NAFED. The government started the disposal of onions from the buffer from 5th September, 2024 and till date, 1.15 lakh tonnes has been disposed. NCCF has disposed onions in 77 centres across 21 States and NAFED in 43 centres in 16 States. To augment the pace of disposal, bulk transportation of onions by rail rakes have been adopted for the first time. NCCF had transported 1,600 MT (42 BCN wagons i.e. approximately 53 trucks) by Kanda Express from Nashik which arrived at Delhi on 20th October, 2024. NAFED has also arranged the transportation of 800 – 840 MT of onions to Chennai by rail rake. The rail rake to Chennai has left Nashik on 22nd October, 2024.

    Indent for shipments by rail rake to Lucknow and Varanasi has been placed by NCCF. The Department of Consumer affairs has also requested Indian Railways to allow transportation of onion rakes from Nashik to multiple locations across the North-eastern region which would include (i) NJP: New Jalpaiguri (Siliguri), (ii) DBRG- Dibrugarh, (iii) NTSK- New Tinsukia, and (iv) CGS: Changsari. This will ensure wider availability of onions in different regions of India ensuring its availability at a very reasonable price to consumers.

    ***

    Nihi Sharma

    (Release ID: 2067286) Visitor Counter : 105

    MIL OSI Asia Pacific News

  • MIL-OSI Asia-Pac: Union Minister, Ministry of Panchayati Raj, Shri Rajiv Ranjan Singh to Launch “Weather Forecasts at the Gram Panchayat Level” on 24th October 2024 at Vigyan Bhawan, New Delhi

    Source: Government of India (2)

    Union Minister, Ministry of Panchayati Raj, Shri Rajiv Ranjan Singh to Launch “Weather Forecasts at the Gram Panchayat Level” on 24th October 2024 at Vigyan Bhawan, New Delhi

    Villages to become Climate Resilient: Weather Forecasts will now be Available to Gram Panchayats

    Gram Panchayats to Get Access to 5-Day and Hourly Weather Forecasts

    Posted On: 23 OCT 2024 9:53AM by PIB Delhi

    The Ministry of Panchayati Raj (MoPR), in collaboration with the India Meteorological Department (IMD), Ministry of Earth Sciences (MoES), is set to launch a landmark and a transformative initiative to provide Gram Panchayats with 5 days daily weather forecasting and provision to check hourly weather forecast Gram Panchayat-Level Weather Forecasting – on 24th October 2024 at Vigyan Bhawan, New Delhi. This initiative, aimed at empowering rural communities and enhancing disaster preparedness at the grassroots, will directly benefit farmers and villagers across the country. As part of the Government’s 100 Days Agenda, this initiative strengthens grassroots governance and promotes sustainable agricultural practices, making rural populations more climate-resilient and better equipped to tackle environmental challenges.

    This is the first time that localized weather forecasts will be available at the Gram Panchayat level, supported by IMD’s expanded sensor coverage. The forecasts will be disseminated through the Ministry’s digital platforms: e-GramSwaraj, which enables efficient governance, project tracking, and resource management; the Meri Panchayat app, which fosters community engagement by allowing citizens to interact with local representatives and report issues; and Gram Manchitra, a spatial planning tool that provides geospatial insights for development projects.

    The launch will be graced by the presence of Shri Rajiv Ranjan Singh alias Lalan Singh, Minister of Panchayati Raj, Shri (Dr.) Jitendra Singh, Minister of State (Independent Charge) for Science and Technology & Earth Sciences, and Shri Prof. S. P. Singh Baghel, Minister of State for Panchayati Raj along with Shri Vivek Bharadwaj, Secretary, Ministry of Panchayati Raj, Shri Devesh Chaturvedi, Secretary, Ministry of Agriculture & Farmers Welfare, Dr. M. Ravichandran, Secretary, Ministry of Earth Sciences, Dr. Mrutyunjay Mohapatra, DG, India Meteorological Department, Shri Alok Prem Nagar, Joint Secretary, Ministry of Panchayati Raj and other senior officials from the Ministries of Panchayati Raj, Agriculture, Rural Development, National Disaster Management Authority (NDMA), Department of Science and Technology (DST), and other key stakeholders.

    A Training Workshop on “Weather Forecasts at the Gram Panchayat Level” will be organized to mark the launch of this pioneering initiative. The workshop will be attended by more than 200 participants, including Elected Representatives of Panchayati Raj Institutions and State Panchayati Raj officials. This training session will equip Panchayat representatives and functionaries with the knowledge and skills to effectively utilize weather forecasting tools and resources at the grassroots level, empowering them to make informed decisions and enhance climate resilience in their communities.

    This endeavour, a key component of the Government’s 100 Days Agenda, is a significant stride toward boosting local-level governance and cultivating climate-resilient villages. As weather patterns become increasingly unpredictable, the introduction of weather forecasting at the Gram Panchayat level will serve as a crucial tool in safeguarding agricultural livelihoods and enhancing rural preparedness against natural disasters. Gram Panchayats will receive daily updates on temperature, rainfall, wind speed, and cloud cover, empowering them to make critical decisions in agriculture, such as planning sowing, irrigation, and harvesting activities. These tools will also strengthen disaster preparedness and infrastructure planning. Furthermore, SMS alerts will be sent to Panchayat representatives regarding extreme weather events like cyclones and heavy rainfall, ensuring immediate action to protect lives, crops, and property. This endeavour is a transformative step toward building climate-resilient communities at the grassroots level.

    ***


    AA

    (Release ID: 2067232) Visitor Counter : 53

    MIL OSI Asia Pacific News

  • MIL-OSI Asia-Pac: Day 2 of ITU Kaleidoscope 2024 Highlights Cutting-Edge AI Innovations for Sustainable Development

    Source: Government of India

    Day 2 of ITU Kaleidoscope 2024 Highlights Cutting-Edge AI Innovations for Sustainable Development

    “ITU Kaleidoscope 2024: Bridging Technology and Sustainability for a more secure, equitable, and sustainable digital ecosystem “: Rohit Sharma Member (Services), Digital Communications Commission, DoT

    Posted On: 23 OCT 2024 8:42AM by PIB Delhi

    The second day of ITU Kaleidoscope 2024, which concluded yesterday on the sidelines of ITU-WTSA 2024 in New Delhi, brought forward transformative discussions focused on AI and digital technologies driving sustainable development. Kicking off with a special presentation by Mari Carmen Aguayo Torres, the day emphasized inclusive technology solutions, particularly through public-private partnerships to attract women to tech fields.

    Kicking off with a special presentation by Mari Carmen Aguayo Torres, the day emphasized inclusive technology solutions, particularly through public-private partnerships to attract women to tech fields.

    Eva Ibarrola, from the University of the Basque Country, Spain, chaired the session for the presentation on Attracting Girls to Technology Through Public-Private Partnership, and Applications and Services for Sustainable Development. Mr. Rohit Sharma, Member (services), Department of Telecommunications, Government of India and Mr. Sunil Kumar, President – IETE chaired the sessions on Social, economic, environmental and policy aspects for sustainable development.

    The event presented groundbreaking insights into AI applications for healthcare, education, and sustainable development. Themes included AI’s impact on healthcare, education, and agriculture, with discussions on AI-driven diagnostics and AI’s role in rural education access. The sessions also emphasized the importance of cybersecurity in IoT applications and explored AI’s ethical implications in content creation. Overall, the event underscored the critical need for innovation and international collaboration in developing technologies that support the UN Sustainable Development Goals (SDGs). The afternoon poster session fostered vibrant research collaboration, with topics covering AI’s role in education and the use of space systems to achieve the UN Sustainable Development Goals (SDGs).

    Mr. Rohit Sharma Member (Services), Digital Communications Commission, DoT said, “ITU Kaleidoscope 2024 provided a crucial platform for exploring the intersection of technology and sustainability. From the cybersecurity implications of agricultural IoT devices to the complexities of AI-generated copyright and the future of international taxation for ICT solutions, the discussions highlighted the importance of global cooperation in ensuring that technological advancements contribute to sustainable development. The insights shared by experts across fields underscore the need for robust policies and innovative standards to create a more secure, equitable, and sustainable digital ecosystem.”

    Mr. Atul Sinha Dy. Director General National Communications Academy said that, “The diverse research presented today showcases practical solutions to pressing global challenges, emphasizing the need for cross-disciplinary collaboration. I am confident that the ideas shared will help shape the future of technology for the greater good.”

    ITU WTSA New Delhi 2024 witnessed another happening day yesterday with Mr. Sunil Kumar, President IETE, who chaired sessions on Social, economic, environmental and policy aspects for sustainable development, with presentations on The Role of Refurbished Mobile Phones in Digital Inclusion and Sustainable Development”, “Advancing Trustworthy AI for Sustainable Development: Recommendations for Standardising AI Incident Reporting” and on “Modelling Internet Use in the Global Development Context.

    Concluding the day, interactive discussions focused on the social, economic, and policy impacts of AI, particularly cybersecurity challenges in agriculture and copyright issues in AI-generated content. These sessions provided critical insights into real-world challenges and opportunities that arise with the integration of AI into key sectors.

    On Day 3, two important panel discussions will take the spotlight, delving into the future of global standards and innovation opportunities, followed by the presentation of paper awards.

    Kaleidoscope 2024 continues to inspire meaningful dialogue around technology, standards, and sustainability, propelling forward global efforts for a more inclusive digital future.

    About ITU Kaleidoscope

    ITU Kaleidoscope is an annual event that has been instrumental in bridging the gap between academia and industry, promoting the exchange of ideas that contribute to the global standardization of telecommunications technologies. Since its inception in 2008, Kaleidoscope has become one of the most influential platforms for discussing the future of digital communications, providing a space where researchers and innovators can present their most promising work.

    Visit the official ITU Kaleidoscope 2024 website at https://www.itu.int/en/ITU-T/academia/kaleidoscope/2024/Pages/default.aspx or simply type ITU Kaleidoscope 2024 in google and select the first displayed website for detailed information on the event program, speakers, and sessions.

    About WTSA 2024:

    WTSA 2024, organized by the International Telecommunication Union (ITU), serves as a platform for the development and implementation of global telecommunications standards, uniting regulators, industry leaders, and policymakers to shape the future of communications worldwide.


    ******

    SB/DP/ARJ

    (Release ID: 2067228) Visitor Counter : 38

    MIL OSI Asia Pacific News

  • MIL-OSI Economics: The Crypto Game of Lazarus APT: Investors vs. Zero-days

    Source: Securelist – Kaspersky

    Headline: The Crypto Game of Lazarus APT: Investors vs. Zero-days

    Introduction

    Lazarus APT and its BlueNoroff subgroup are a highly sophisticated and multifaceted Korean-speaking threat actor. We closely monitor their activities and quite often see them using their signature malware in their attacks — a full-feature backdoor called Manuscrypt. According to our research, Lazarus has been employing this malware since at least 2013 and we’ve documented its usage in 50+ unique campaigns targeting governments, diplomatic entities, financial institutions, military and defense contractors, cryptocurrency platforms, IT and telecommunication operators, gaming companies, media outlets, casinos, universities, and even security researchers — the list goes on.

    On May 13, 2024, our consumer-grade product Kaspersky Total Security detected a new Manuscrypt infection on the personal computer of a person living in Russia. Since Lazarus rarely attacks individuals, this piqued our interest and we decided to take a closer look. We discovered that prior to the detection of Manuscrypt, our technologies also detected exploitation of the Google Chrome web browser originating from the website detankzone[.]com. On the surface, this website resembled a professionally designed product page for a decentralized finance (DeFi) NFT-based (non-fungible token) multiplayer online battle arena (MOBA) tank game, inviting users to download a trial version. But that was just a disguise. Under the hood, this website had a hidden script that ran in the user’s Google Chrome browser, launching a zero-day exploit and giving the attackers complete control over the victim’s PC. Visiting the website was all it took to get infected — the game was just a distraction.

    We were able to extract the first stage of the attack — an exploit that performs remote code execution in the Google Chrome process. After confirming that the exploit was based on a zero-day vulnerability targeting the latest version of Google Chrome, we reported our findings to Google the same day. Two days later, Google released an update and thanked us for discovering this attack.

    Acknowledgement for finding CVE-2024-4947 (excerpt from the security fixes included into Chrome 125.0.6422.60)

    Having notified Google about the discovered vulnerability, we followed responsible vulnerability disclosure policy and refrained from sharing specific details in public, giving users sufficient time to apply the patch. This approach is also intended to prevent further exploitation by threat actors. Google took additional steps by blocking detankzone[.]com and other websites linked to this campaign, ensuring that anyone attempting to access these sites — even without our products — would be warned of their malicious nature.

    While we respected Google’s request for a set disclosure period, on May 28, 2024, Microsoft published a blog post titled “Moonstone Sleet emerges as new North Korean threat actor with new bag of tricks,” which partially revealed our findings. According to the blog, Microsoft had also been tracking the campaign and associated websites since February 2024. However, their analysis overlooked a key point in the malicious campaign: the presence of the browser exploit and the fact that it was a high-severity issue — a zero-day. In this report, we explore in great detail the vulnerabilities exploited by the attackers and the game they used as bait (spoiler alert: we had to develop our own server for this online game).

    The exploit

    The website used by the attackers as a cover for their campaign was developed in TypeScript/React, and one of its index.tsx files contained a small piece of code that loads and executes the Google Chrome exploit.

    Website facade and the hidden exploit loader

    The exploit contains code for two vulnerabilities: the first is used to gain the ability to read and write Chrome process memory from the JavaScript, and the second is used to bypass the recently introduced V8 sandbox.

    First vulnerability (CVE-2024-4947)

    The heart of every web browser is its JavaScript engine. The JavaScript engine of Google Chrome is called V8 — Google’s own open-source JavaScript engine. For lower memory consumption and maximum speed, V8 uses a fairly complex JavaScript compilation pipeline, currently consisting of one interpreter and three JIT compilers.

    V8’s JavaScript compilation pipeline

    When V8 starts to execute JavaScript, it first compiles the script into bytecode and executes it using the interpreter called Ignition. Ignition is a register-based machine with several hundred instructions. While executing bytecode, V8 monitors the program’s behavior, and may JIT-compile some functions for better performance. The best and fastest code is produced by TurboFan, a highly optimizing compiler with one drawback — the code generation takes too much time. Still, the difference in performance between Ignition and TurboFan was so significant that a new non-optimizing JIT compiler was introduced in 2021 called Sparkplug, which compiles bytecode into equivalent machine code almost instantly. Sparkplug-generated code runs faster than the interpreter, but the performance gap between Sparkplug- and TurboFan-generated code was still big. Because of this, in Chrome 117 (released in Q4 2023), the developers introduced a new optimizing compiler, Maglev, whose goal is to generate good enough code fast enough by performing optimizations based solely on feedback from the interpreter. CVE-2024-4947 (issue 340221135) is the vulnerability in this new compiler.

    To understand this vulnerability and how it was exploited, let’s take a look at the code the attackers used to trigger it.

    Code used by the attackers to trigger CVE-2024-4947

    We can see in this code that it first accesses the exported variable exportedVar of the moduleImport module and then creates the emptyArray array and the arrHolder dictionary. However, it seems that no real work is done with them, they are just returned by the function trigger. And then something interesting happens – the f function is executed until it returns “true”. However, this function returns “true” only if it can set the exported variable moduleImport.exportedVar to the “3.79837e-312” value, and if an exception occurs because of this, the f function returns “false”. How could it be that executing the same expression moduleImport.exportedVar = 3.79837e312; should always return “false” until it returns “true”?

    Bytecode produced by the Ignition interpreter for “moduleImport.exportedVar = 3.79837e-312;”

    If we take a look at the bytecode produced for this expression by Ignition and at the code of the SetNamedProperty instruction handler, which is supposed to set this variable to the “3.79837e-312” value, we can see that it will always throw an exception — according to the ECMAScript specification, storing in a module object is always an error in JavaScript.

    JIT code produced by Maglev for “moduleImport.exportedVar = 3.79837e-312;”

    But if we wait until this bytecode has been executed enough times and V8 decides to compile it using the Maglev compiler, we’ll see that the resulting machine code doesn’t throw an exception, but actually sets this property somewhere in the moduleImport object. This happens due to a missing check for storing to module exports — which is the CVE-2024-4947 vulnerability (you can find the fix here). How do attackers exploit it? To answer this, we need to understand how JavaScript objects are represented in memory.

    Structure of JS objects

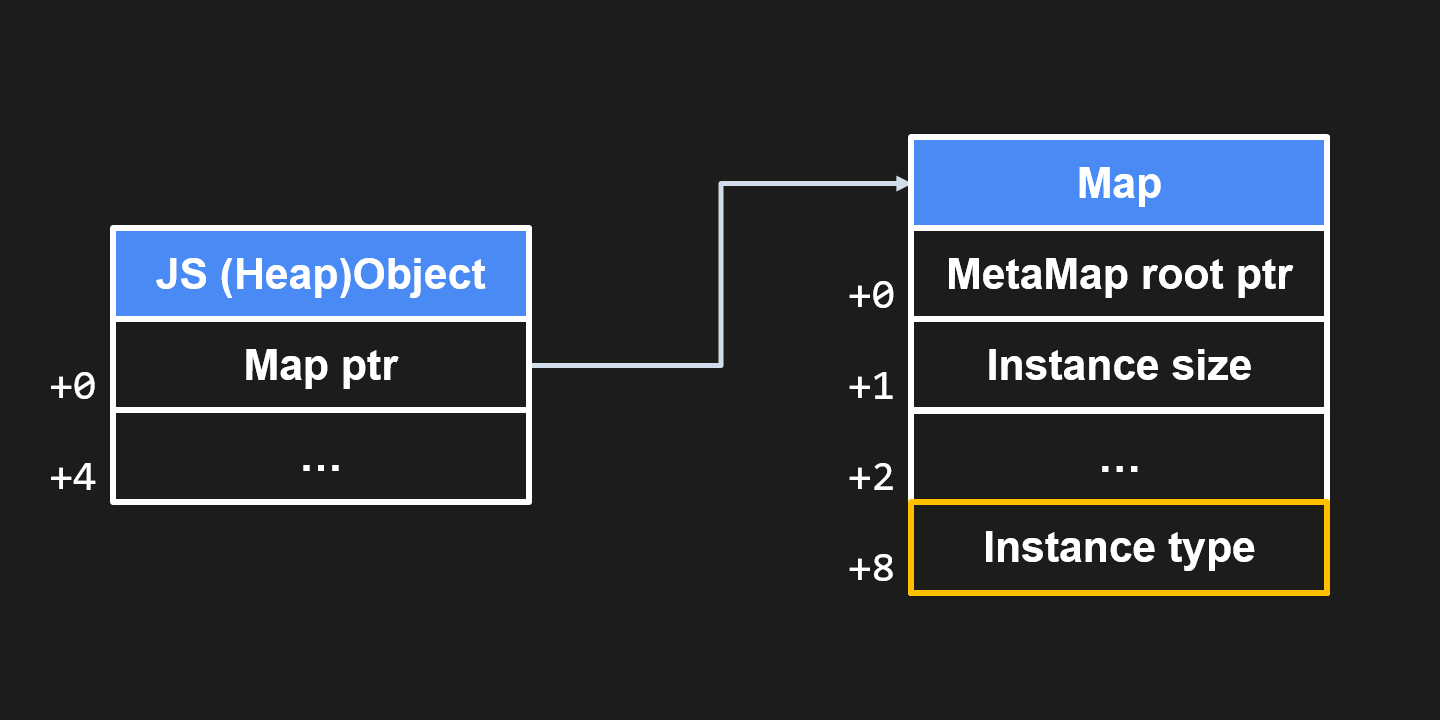
    All JS objects begin with a pointer to a special object called Map (also known as HiddenClass) which stores meta information about the object and describes its structure. It contains the object’s type (stored at a +8 offset), number of properties, and so on.

    Structure of the “moduleImport” JS object

    The moduleImport module is represented in memory as a JSReceiver object, which is the most generic JS object and is used for types for which properties can be defined. It includes a pointer to the array of properties ( PropertyArray) which is basically a regular JS object of the FixedArray type with its own Map. If in the expression moduleImport.exportedVar = 3.79837e312; moduleImport was not a module but a regular object, the code would set the property #0 in that array, writing at a +8 offset; however, since it is a module and there is a bug, the code sets this property, writing at a +0 offset, overwriting the Map object with the provided object.

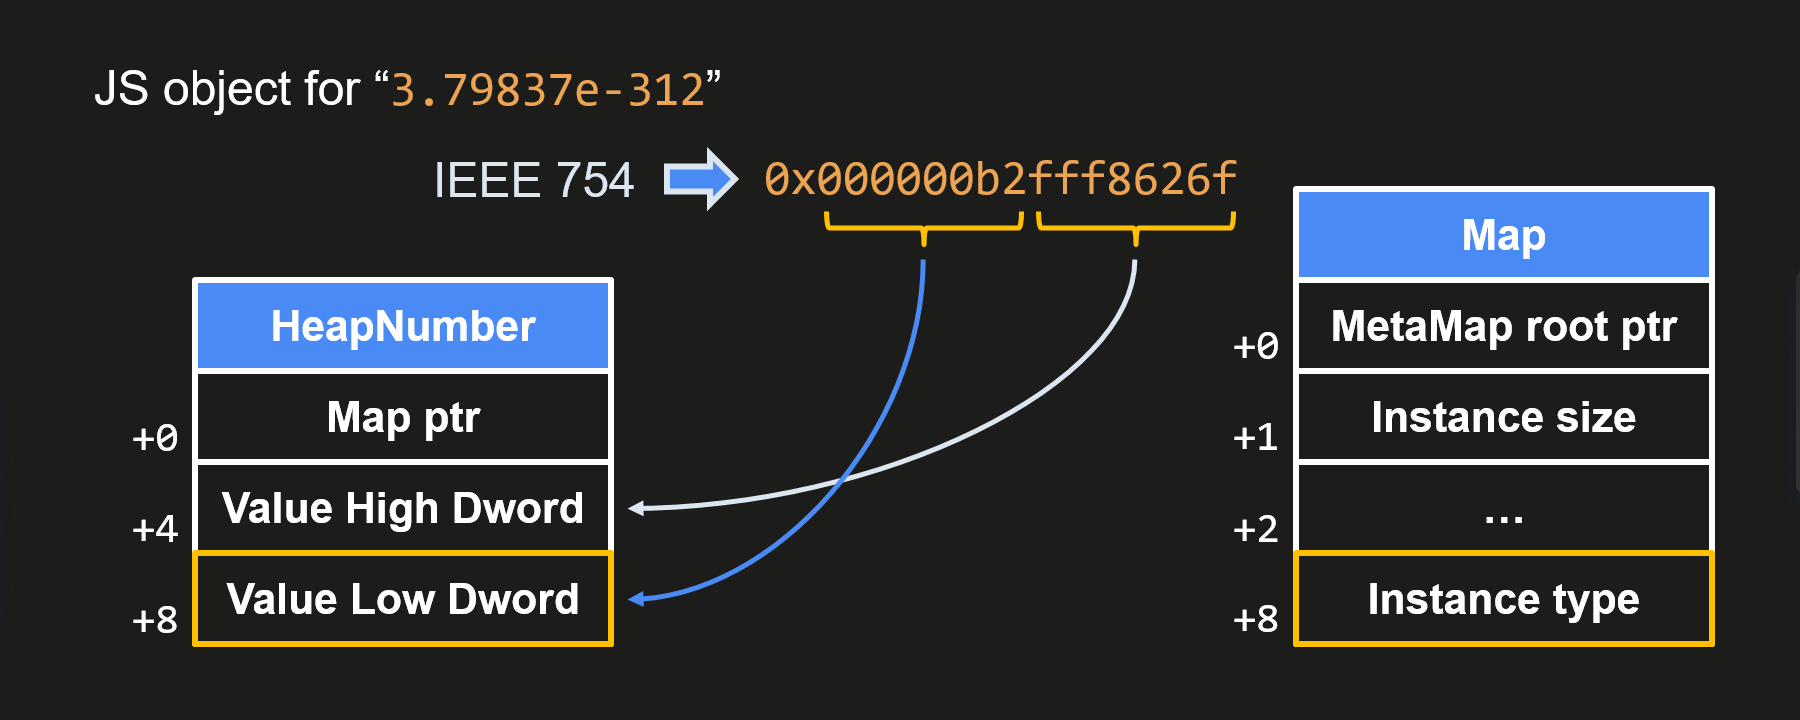
    Structure of the “3.79837e-312” number JS object

    Since 3.79837e-312 is a floating-point number, it is converted to a 64-bit value (according to the IEEE 754 standard) and stored in a HeapNumber JS object at a +4 offset. This allows the attackers to set their own type for the PropertyArray object and cause a type confusion. Setting the type to 0xB2 causes V8 to treat the PropertyArray as a PropertyDictionary, which results in memory corruption because the PropertyArray and PropertyDictionary objects are of different sizes and the kLengthAndHashOffset field of the PropertyDictionary falls outside the bounds of the PropertyArray.

    Now the attackers need to get the right memory layout and corrupt something useful. They defragment the heap and perform the actions that you can see in the trigger function.

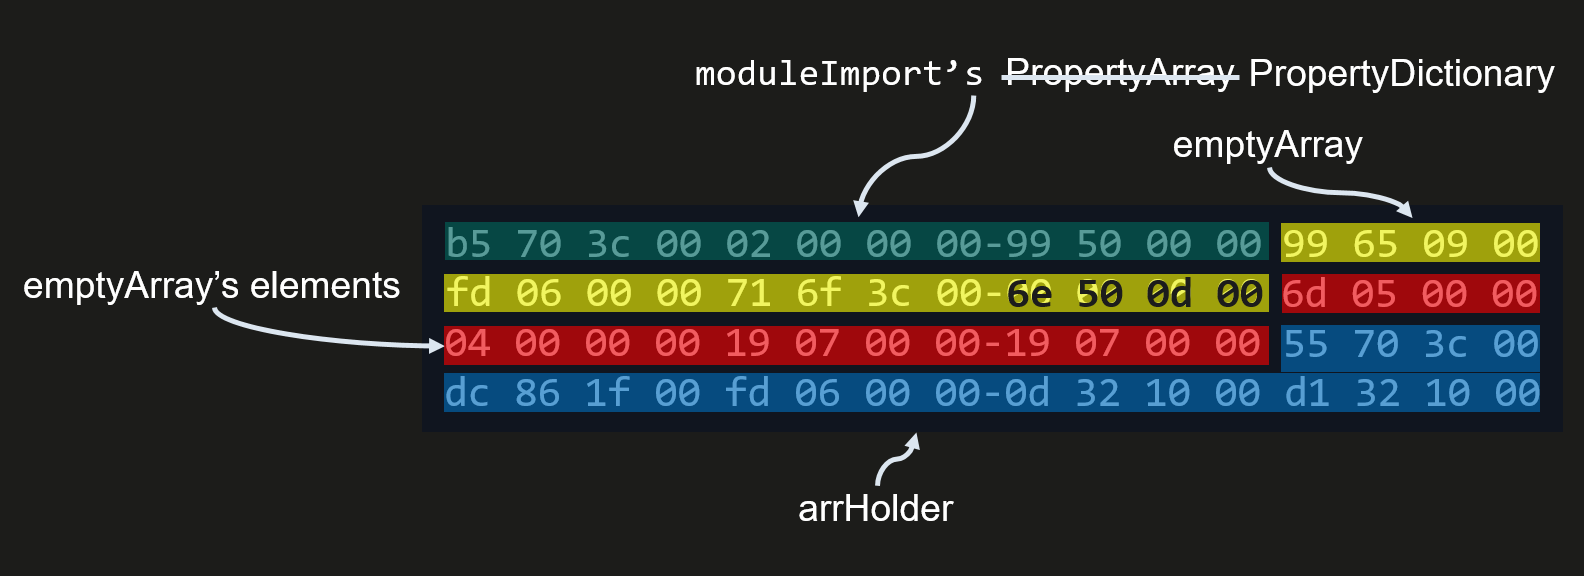
    Memory layout created by the “trigger” function

    What happens in this function is the following:

    1. It accesses the exported module variable moduleImport.exportedVar to allocate moduleImport’s PropertyArray.
    2. It creates an emptyArray with two elements.
    3. Removing elements from this array reallocates the object that is used for storing the elements and sets emptyArray’s length to 0. This is an important step because in order to overwrite emptyArray’s length with PropertyDictionary’s hash, the length/hash must be equal to 0.
    4. The trigger function creates the arrHolder dictionary with two objects. This step follows the creation of the emptyArray to allow the pointers of these two objects to be accessed and overwritten when the length of emptyArray is corrupted. The first object, xxarr: doubleArray is used to construct a primitive for getting the addresses of JS objects. The second object, xxab: fakeArrayBuffer is used to construct a primitive for getting read/write access to the whole address space of the Chrome process.
    5. Next, the trigger function executes the f function until it is compiled by Maglev, and overwrites the type of the PropertyArray so it is treated as a PropertyDictionary object.
    6. Executing new WeakRef(moduleImport) triggers the calculation of PropertyDictionary’s hash, and the length of emptyArray is overwritten with the hash value.
    7. The trigger function returns emptyArray and arrHolder containing objects that can be overwritten with emptyArray.

    After this, the exploit again abuses Maglev, or rather the fact that it optimizes the code based on the feedback collected by the interpreter. The exploit uses Maglev to compile a function that loads a double value from an array obtained using arrHolder.xxarr. When this function is compiled, the attackers can overwrite the pointer to an array obtained using arrHolder.xxarr via emptyArray[5] and use this function to get the addresses of JS objects. Similarly, the attackers use arrHolder.xxab to compile a function that sets specific properties and overwrites the length of another ArrayBuffer-type object along with the pointer to its data (backing_store_ptr). This becomes possible when the pointer to the object accessible via arrHolder.xxab is replaced via emptyArray[6] with a pointer to the ArrayBuffer. This gives the attackers read and write access to the entire address space of the Chrome process.

    Second vulnerability (V8 sandbox bypass)

    At this point, the attackers can read and write memory from JavaScript, but they need an additional vulnerability to bypass the newly introduced V8 (heap) sandbox. This sandbox is purely software-based and its main function is to isolate the V8 memory (heap) in such a way that attackers cannot access other parts of the memory and execute code. How does it do this? You may have noticed that all the pointers in the previous section are 32 bits long. This is not because we’re talking about a 32-bit process. It’s a 64-bit process, but the pointers are 32 bits long because V8 uses something called pointer compression. The pointers are not stored in full, but just as their lower parts, or they could also be seen as a 32-bit offset from some “base” address. The upper part (the “base” address) is stored in CPU registers and added by the code. In this case, attackers should not be able to obtain real pointers from the isolated memory and have no way to obtain addresses for the stack and JIT-code pages.

    To bypass the V8 sandbox, the attackers used an interesting but very common vulnerability associated with interpreters — we have previously seen variations of this vulnerability in multiple virtual machine implementations. In V8, regular expressions are implemented using its own interpreter, Irregexp, with its own set of opcodes. The Irregexp VM is completely different from Ignition, but it is also a register-based VM.

    Examples of vulnerable code in Irregexp VM instruction handlers

    The vulnerability is that the virtual machine has a fixed number of registers and a dedicated array for storing them, but the register indexes are decoded from the instruction bodies and are not checked. This allows attackers to access the memory outside the bounds of the register array.

    Malicious Irregexp VM bytecode for reading the memory outside of the register array bounds

    Coincidentally, the pointers to output_registers and output_register_count are located right next to the register array. This allows the attackers to read and write the memory outside of the V8 sandbox with the help of the SUCCEED opcode. Attackers use this to overwrite JIT’ed code with shellcode and execute it.

    This issue (330404819) was submitted and fixed in March 2024. It is unknown whether it was a bug collision and the attackers discovered it first and initially exploited it as a 0-day vulnerability, or if it was initially exploited as a 1-day vulnerability.

    Shellcode

    At this point, the attackers need additional vulnerabilities to escape the Chrome process and gain full access to the system. In the best practices of sophisticated attackers, they run a validator in the form of a shellcode that collects as much information as possible and sends it to the server to decide whether to provide the next stage (another exploit) or not. This decision is made based on the following information: CPUID information (vendor, processor name, etc), whether it’s running on a VM or not, OS version and build, number of processors, tick count, OS product type, whether it’s being debugged or not, process path, file version info of system modules, file version info of process executable, and SMBIOS firmware table.

    By the time we analyzed the attack, the attackers had already removed the exploit from the decoy website, preventing us from easily obtaining the next stage of the attack. At Kaspersky, we possess technologies that have allowed us to discover and help to fix a huge number of 0-day privilege escalation vulnerabilities exploited by sophisticated attackers in various malware campaigns over the years; however, in this particular case we would have to wait for the next attack in order to extract its next stage. We’ve decided to not wait, preferring to let Google fix the initial exploit used to perform the remote code execution in Google Chrome.

    List of in-the-wild 0-days caught and reported by Kaspersky over the past 10 years

    Social activity

    What never ceases to impress us is how much effort Lazarus APT puts into their social engineering campaigns. For several months, the attackers were building their social media presence, regularly making posts on X (formerly Twitter) from multiple accounts and promoting their game with content produced by generative AI and graphic designers.

    Attackers’ accounts on X

    One of the tactics used by the attackers was to contact influential figures in the cryptocurrency space to get them to promote their malicious website and most likely to also compromise them.

    Attackers’ attempts to contact crypto-influencers

    The attackers’ activity was not limited to X — they also used professionally designed websites with additional malware, premium accounts on LinkedIn, and spear phishing through email.

    The game

    Malicious website offering to download a beta version of the game

    What particularly caught our attention in this attack was that the malicious website attacking its visitors using a Google Chrome zero-day was inviting them to download and try a beta version of a computer game. As big computer games fans ourselves, we immediately wanted to try it. Could the attackers have developed a real game for this campaign? Could this be the first computer game ever developed by a threat actor? We downloaded detankzone.zip and it looked legit: the 400 MB-archive contained a valid file structure of a game developed in Unity. We unpacked the game’s resources and found “DeTankZone” logos, HUD elements, and 3D model textures. Debugging artifacts indicated that the game had been compiled by the attackers. We decided to give it a spin.

    Start menu of the DeTankZone game

    After an intro with the game’s logo, we are greeted with a typical online gaming start menu, asking us to enter valid account credentials to access the game. We tried to log in using some common account names and passwords, and then tried to register our own account through the game and the website — but nothing worked.

    Is that really all this game has to offer? We started reverse engineering the game’s code and discovered that there was more content available beyond this start menu. We found the code responsible for communication with the game server and started reverse engineering that as well. The game was hardcoded to use the server running at “api.detankzone[.]com,” which clearly wasn’t working. But we really wanted to check this game out! What to do? We decided to develop our own game server, of course.

    First, we discovered that the game uses the Socket.IO protocol to communicate with the server, so we chose the pythonsocketio library to develop our own server. We then found a function with a list of all supported command names (event names) and reverse engineered how they are obfuscated. After that, we reverse engineered how the data was encoded: it turned out to be a JSON encrypted with AES256 and encoded with Base64. For the AES key it uses the string “Full Stack IT Service 198703Game”, while the string “MatGoGameProject” is used for the IV. We hoped that this information might reveal the identities of the game’s developers, but a Google search yielded no results. Finally, we reverse engineered the data format for a couple of commands, implemented them on our server, and replaced the server URL with the address of our own server. Success! After all this we were able to log into the game and play with the bots!

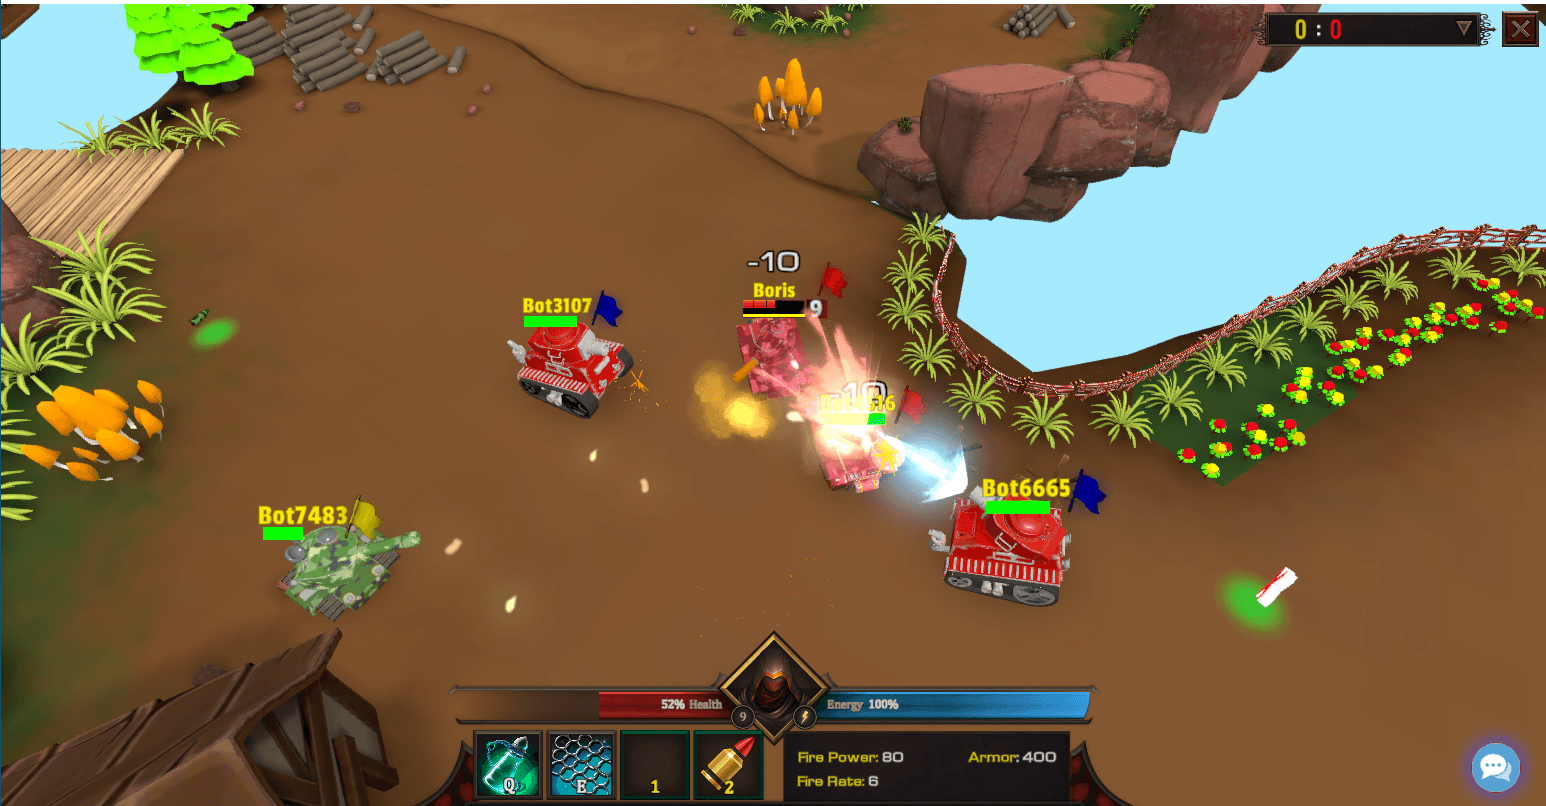
    Screenshot from the game running with our custom server

    Yes, it turned out to be a real game! We played it for a bit and it was fun — it reminded us of some shareware games from the early 2000s. Definitely worth the effort. The textures look a little tacky and the game itself closely resembles a popular Unity tutorial, but if Lazarus had developed this game themselves, it would have set a new bar for attack preparation. But no — Lazarus stayed true to themselves. It turns out that the source code for this game was stolen from its original developers.

    The original game

    DeFiTankLand (DFTL) – the original game

    We found a legitimate game that served as a prototype for the attacker’s version – it’s called DeFiTankLand (DFTL). Studying the developers’ Telegram chat helped us build a timeline of the attack. On February 20, 2024, the attackers began their campaign, advertising their game on X. Two weeks later, on March 2, 2024, the price of the DeFiTankLand’s currency, DFTL2 coin, dropped, and the game’s developers announced on their Telegram that their cold wallet had been hacked and $20,000 worth of DFTL2 coins had been stolen. The developers blamed an insider for this. Insider or not, we suspect that this was the work of Lazarus, and that before stealing the coins they first stole the game’s source code, modified all the logos and references to DeFiTankLand, and used it to make their campaign more credible.

    Conclusions

    Lazarus is one of the most active and sophisticated APT actors, and financial gain remains one of their top motivations. Over the years, we have uncovered many of their attacks on the cryptocurrency industry, and one thing is certain: these attacks are not going away. The attackers’ tactics are evolving and they’re constantly coming up with new, complex social engineering schemes. Lazarus has already successfully started using generative AI, and we predict that they will come up with even more elaborate attacks using it. What makes Lazarus’s attacks particularly dangerous is their frequent use of zero-day exploits. Simply clicking a link on a social network or in an email can lead to the complete compromise of a personal computer or corporate network.

    Historically, half of the bugs discovered or exploited in Google Chrome and other web browsers have affected its compilers. Huge changes in the code base of the web browser and the introduction of new JIT compilers inevitably lead to a large number of new vulnerabilities. What can end users do about this? While Google Chrome continues to add new JIT compilers, there is also Microsoft Edge, which can run without JIT at all. But it’s also fair to say that the newly introduced V8 sandbox might be very successful at stopping bugs exploitation in compilers. Once it becomes more mature, exploiting Google Chrome with JIT may be as difficult as exploiting Microsoft Edge without it.

    Indicators of Compromise

    Exploit
    B2DC7AEC2C6D2FFA28219AC288E4750C
    E5DA4AB6366C5690DFD1BB386C7FE0C78F6ED54F
    7353AB9670133468081305BD442F7691CF2F2C1136F09D9508400546C417833A

    Game
    8312E556C4EEC999204368D69BA91BF4
    7F28AD5EE9966410B15CA85B7FACB70088A17C5F
    59A37D7D2BF4CFFE31407EDD286A811D9600B68FE757829E30DA4394AB65A4CC

    Domains
    detankzone[.]com
    ccwaterfall[.]com

    MIL OSI Economics

  • MIL-OSI Banking: Thales reports its order intake and sales as of September 30, 2024

    Source: Thales Group

    Headline: Thales reports its order intake and sales as of September 30, 2024

    • Order intake: €15.6 billion, up 23% on an organic basis1(+26% total change)
    • Sales: €14.1 billion, up 6.2% on an organic basis (+9.4% total change)
    • 2024 targets confirmed:
      • Book-to-bill ratio above 1
      • Organic sales growth between +5% and +6%2
      • EBIT margin: 11.7% to 11.8%

    Thales (Euronext Paris: HO) today announced its order intake and sales for the period ending September 30, 2024.

    Reminder: 9m 2023 figures have been restated to include Cyber civil activities transferred from Defence and Security to Digital Identity & Security.

    “The third quarter confirmed the continued strong commercial momentum and organic sales growth in most of Thales’ businesses.
    ​The Defence business enjoyed unparalleled visibility thanks to emblematic long-term contracts. Avionics was driven by the recovery in air traffic and solid growth prospects. The cybersecurity and biometrics businesses benefited from a robust environment.
    ​We are also proud of Thales’ inclusion in the CAC 40 ESG index. This is a strong external endorsement of our non-financial performance and of our contribution to the protection of society, the planet and citizens.
    ​We are confident that we will achieve our annual financial targets for 2024, thanks to our teams’ unwavering involvement.”

    ​Patrice Caine, Chairman & Chief Executive Officer

    Order intake

    Order intake over the first nine months of 2024 amounted to €15,551 million, up 23% on an organic basis4 compared with the first nine months of 2023 (up 26% total change). The Group continued to benefit from an excellent commercial momentum in all its businesses, particularly in Defence & Security.

    Over the period, Thales recorded 19 large orders with a unit value of more than €100 million, the cumulative amount of which came to €4,983 million:

    • Four large orders booked in Q1 2024:
      • The entry into force of the third phase of the order placed by Indonesia in 2022 for the purchase of 42 Rafale aircraft (18 aircraft and support services);
      • Order of an aerial surveillance system for a military customer in the Middle East;
      • Second tranche of the contract signed in 2023 between France and Italy for the production of 400 ASTER B1NT ground-to-air missiles;
      • Phased contract with the French Defence Procurement Agency (DGA) to develop the next generation of sonars to equip French nuclear-powered ballistic-missile submarines (SSBN).
    • Eight large orders booked in Q2 2024:
      • Order of two new F126 frigates by the German Navy. This additional contract brings the number of F126 frigates acquired by the German Navy to six in the past four years;
      • Exomars 2028, a contract signed between industrial prime contractor Thales Alenia Space and the European Space Agency (ESA) to relaunch the European space mission dedicated to the exploration of the Red Planet;
      • Order by SKY Perfect JSAT to Thales Alenia Space of JSAT-31, a new generation of satellite reconfigurable in orbit using Space INSPIRE technology;
      • Order by France’s Joint Munitions Command (SiMu) of tens of thousands of 120mm rifled ammunition;
      • Order for a next generation cloud native “FLYTEDGE” InFlight Entertainment System for a major worldwide airline;
      • Order by an Asian customer of latest-generation Ground Master 400 Alpha long-range air surveillance radars;
      • Order by the Dutch Ministry of Defence of seven additional Ground Master 200 multi-mission compact radars;
      • Service contract for the maintenance of the Royal Australian Navy fleet.
    • Seven major orders recorded in Q3 2024:
      • Order for the supply of communications, vetronics, navigation and optronics equipment for vehicles in the French Army’s SCORPION program;
      • Order for the renovation of an air traffic management system;
      • Order from the UK Ministry of Defence for the supply of LMM missiles to strengthen Ukraine’s air defence capabilities;
      • Order of LMM missiles for the British armed forces;
      • Order for the supply of Ground Fire multifunction radars and engagement modules following France’s acquisition of seven SAMP/T NG air defence systems;
      • Order for the supply of anti-submarine warfare systems for the first phase of the construction of six HUNTER-class frigates for the Royal Australian Navy;
      • Notification by the DGA of the second tranche of the development of the future RBE2 XG radar for the Rafale F5.

    At €10,567 million, order intake with a unit value of less than €100 million increased by 6% compared to the first nine months of 2023; while order intake with a unit value of less than €10 million was up by 7% at September 30, 2024.

    From a geographical5 point of view, order intake in mature markets recorded organic growth of 12%, to €11,413 million, driven by strong sales momentum in the United Kingdom (up 28% on an organic basis) as well as in Australia and New Zealand (up 34% on an organic basis). Order intake in emerging markets amounted to €4,137 million, with strong organic growth of 69% as at September 30, 2024. This performance reflected excellent momentum in the Near and Middle East (up 175% on an organic basis) and in Asia (up 49% on an organic basis).

    Order intake in the Aerospace segment totaled €3,639 million, versus €3,403 million over the first nine months of 2023 (+8% at constant scope and exchange rates). This increase reflects two contrasting trends. On the one hand, the avionics market remained strong, our activities growing double-digit organically. On the other hand, the order intake in the space business declined due to a high comparison basis (two large orders signed as at September 30, 2024 versus five as of September 30, 2023).

    At €8,951 million (compared with €6,404 million for the first nine months of 2023), order intake in the Defence & Security segment continued to record a strong momentum, with organic growth of 40%. Seven new orders with a unit value of more than €100 million in the third quarter were added to the nine already recorded in the first half of the year. The order book stood at €37.0 billion, compared with €35.1 billion at September 30, 2023.

    At €2,905 million, order intake in the Digital Identity & Security segment was in line with sales over the period, as most of the activities in this segment operate on short cycles.

    Sales

    Sales for the first nine months of 2024 amounted to €14,069million, compared with €12,854 million for the same period in 2023, an increase of 6.2% at constant scope and exchange rates.

    From a geographical5 point of view, sales growth was strong in mature markets (+6.3% on an organic basis), driven in particular by Europe (+9.0%) including France (+9.4%), and Australia and New Zealand (+8.5%). Emerging markets posted organic growth of +5.8% over the period.

    Sales in the Aerospace segment amounted to €3,839 million, up 5.6% compared to the first nine months of 2023 (+5.3% at constant scope and exchange rates). This growth reflected ongoing robust demand in the avionics market, leading the activity to grow mid-single digit plus. It was however mitigated by the low-single digit organic growth of the space business.

    Sales in the Defence & Security segment totaled €7,239 million, up +8.8% compared to the first nine months of 2023 (+8.5% at constant scope and exchange rates). After sustained growth recorded in the first half of the year, this segment confirmed its strong momentum in the third quarter. Growth was driven in particular by land and air systems.

    In the Digital Identity & Security segment, sales totaled €2,914 million, up 15.7% in the first nine months of 2024 (+0.3% at constant scope and exchange rates), including the positive scope effect linked to the acquisitions of Tesserent and Imperva. The stability in organic growth in this segment reflects contrasting trends:

    • Banking and Payment solutions, negatively affected by a high comparison basis, continued to suffer from further destocking in North America;
    • Steady pace of growth in Cyber and Biometrics activities;
    • Continued ramp-up on Connectivity Solutions market, recording double-digit organic growth.

    Outlook

    Thales continues to benefit from its solid positioning in all its major markets and enjoys robust medium-term outlook, as illustrated by the continued strong sales momentum in the third quarter of 2024.

    As a result, assuming there are no major new disruptions in the global economy or global supply chains, Thales confirms its 2024 annual targets:

    • A book-to-bill ratio above 1;
    • Organic sales growth of between +5% and +6%, corresponding to sales in the range of €19.9 billion to €20.1 billion6;
    • An EBIT margin between 11.7% and 11.8%.

    ****

    This press release contains certain forward-looking statements. Although Thales believes that its expectations are based on reasonable assumptions, actual results may differ significantly from the forward-looking statements due to various risks and uncertainties, as described in the Company’s Universal Registration Document, which has been filed with the French financial markets authority (Autorité des marchés financiers – AMF).

    1In this press release, “organic” means “at constant scope and exchange rates”.

    2Between €19.9 billion and €20.1 billion based on September 2024 scope and exchange rates.

    3Mature markets: Europe, North America, Australia, New Zealand; emerging markets: all other countries.

    4Taking into account a negative currency effect of -€45 million and a positive net scope effect of €441 million.

    5See table on page 6.

    5Seetableon page 6.

    6Based on September 2024 scope and exchanges rates.

    MIL OSI Global Banks

  • MIL-OSI Banking: Committee on Market Access holds third thematic session on supply chain resilience

    Source: WTO

    Headline: Committee on Market Access holds third thematic session on supply chain resilience

    The moderator of the session, Mr Iain Fifer of the United Kingdom, emphasized the critical role of trade data in analyzing and enhancing the resilience of supply chains. He noted the challenges in gathering reliable, timely and relevant data, and underlined how such information can inform decision-making.
    Thailand highlighted logistical challenges related to train freight routes from Thailand to Europe. While rail transport is faster than ocean freight and cheaper than air freight, it faces significant obstacles such as customs clearance issues at multiple borders, a lack of harmonized standards, and higher costs compared to sea freight. Additionally, it stressed how limitations in rail infrastructure add complexity.
    China emphasized the importance of multilateral and bilateral trade frameworks, such as those supported by the WTO, in ensuring smooth supply chain operations. It underscored technological advances, particularly in big data and green energy, as key influencers of the development of global supply chains. China also announced the upcoming release of its Global Supply Chain Connectivity Index at the second China International Supply Chain Expo in November 2024. The document will provide a quantitative assessment of the resilience and stability of global supply chains.
    India focused on the three fundamental pillars of supply chains — production, logistics and markets. It also underlined the importance of digital infrastructure in bolstering supply chain resilience. Additionally, India discussed initiatives such as the Unified Logistics Interface Platform and the PM Gati Shakti National Master Plan, which utilize geospatial data to enhance infrastructure connectivity and logistics efficiency.
    The United States introduced its newly established Supply Chain Center within the Department of Commerce, designed to enhance supply chain resilience. The unit’s “Scale” tool assesses risks across sectors of the US economy by evaluating more than 40 indicators of criticality, vulnerability and resiliency in supply chains. The tool provides an in-depth view of current risks to better inform policy decisions, the United States underlined.
    Switzerland presented an initiative led by the Organisation for Economic Cooperation and Development (OECD) aimed at improving the transparency and resilience of medical supply chains. The initiative was prompted by the supply shortages experienced during the COVID-19 pandemic. Switzerland’s project involves a monitoring mechanism designed to increase visibility in global medical supply chains and address future disruptions through international cooperation and the use of advanced technologies such as artificial intelligence.
    In his conclusion, the moderator emphasized the importance of data design and collection in creating a comprehensive understanding of various supply chains. He stressed that data sharing and collaboration were central themes of the discussion, noting that swift and accurate exchange of information between stakeholders and governments is essential. Additionally, he acknowledged the significant analytical work required after data collection and pointed out that once data analysis is completed, it must be effectively utilized to guide policymaking. The session also featured examples of ongoing policy initiatives shaped by data-driven projects.
    The interim Chair of the Market Access Committee, Ms Nicola Waterfield of Canada, expressed appreciation for the presentations and highlighted the importance of the discussions. She also announced that the Committee’s next formal meeting is scheduled for 19-20 November 2024.

    Share

    MIL OSI Global Banks

  • MIL-OSI Video: Transforming Social Safety Nets: A Digital Revolution

    Source: International Monetary Fund – IMF (video statements)

    This Analytical Corner focuses on how digital technologies are transforming social safety nets in various country settings such as Brazil, DRC, India, Pakistan, Togo, and Türkiye. Join us to discover innovative strategies to identify, verify, and pay social benefits to enhance support for vulnerable households, even in low-capacity settings. Related publication: Expanding and Improving Social Safety Nets Through Digitalization: Conceptual Framework and Review of Country Experiences (IMF Note, December 2023).

    https://www.youtube.com/watch?v=XIh2aySlzvo

    MIL OSI Video