Category: Economy

  • MIL-OSI United Kingdom: Additional funding for Council’s digital inclusion programme.

    Source: City of Coventry

    Coventry City Council’s efforts to promote digital inclusion across the city have received a major funding boost.

    The Council’s digital inclusion programme, #CovConnects, has received £340,000 to support its ongoing work within in the city.

    The funding, which comes from the Government’s UK Shared Prosperity Fund and the West Midlands Combined Authority, will help the team secure 1250 Mi-Fi units which will be distributed through the programme’s #CovConnects Device Bank.

    Mi-fi units are small, portable devices which allow people to use 4g/5g units to connect to the internet. Each of the units comes with 2 years’ worth of unlimited data enabling residents to connect to the digital world. The mi-fi devices and sim cards have been provided thanks to the Council’s ongoing partnership with Vodafone.

    The Device Bank launched in July 2023 and has distributed over 3850 devices to organisations across the city. These devices are used by these groups to help support residents in their everyday lives allowing the most vulnerable in the city to complete everyday task such as online banking, filling our job applications and accessing vital NHS services.

    Cllr Richard Brown, Cabinet Member for Strategic Finance and Resources, said: “As an organisation, we’re committed to ensuring that as many residents as possible can access the digital world. This funding will help us do just that.

    “It will allow us to expand our efforts and get more of these devices into the hands of those who need it most. Having your own device, which you can use every day, is something that has the potential to completely transform your life. “

    Richard Parker, the Mayor of the West Midlands, said: “So much in life is reliant on us being online, whether that’s finding a job, booking a GP appointment, or managing finances. Too many people are still locked out of opportunities because they don’t have reliable internet or the right digital skills and this can be isolating. It’s why I want more people to have the digital access they need to get on in life. This scheme is a step towards breaking down those barriers, helping more people access the services, support, and training they need to build a better future.”

    The #CovConnects Device Bank is part funded by the UK Government through the UK Shared Prosperity Fund.

    To find out more about the device bank and applying for devices for your organisation, visit: #CovConnects Device Bank – Coventry City Council 

    The UK Shared Prosperity Fund aims to improve pride in place and increase life chances across the UK investing in communities and place, supporting local business, and people and skills. Please visit the UK Shared Prosperity Fund webpage for more information 

    Get in touch with us to find out more about the digital inclusion programme in Coventry, devices, data and skills provisions we can help with: covconnectsdigital@coventry.gov.uk 

    MIL OSI United Kingdom

  • MIL-OSI: SINTX Receives Issuance of U.S. Patent for Silicon Nitride-Functionalized Zirconia-Toughened Alumina Ceramic Biomaterial

    Source: GlobeNewswire (MIL-OSI)

    Salt Lake City, Utah, Feb. 19, 2025 (GLOBE NEWSWIRE) — SINTX Technologies, Inc. (NASDAQ: SINT) (“SINTX” or the “Company”) an advanced ceramics company specializing in the development and commercialization of materials, components, and technologies for medical and technical applications, today announced the issuance of U.S. Patent No. 12,239,761 by the United States Patent and Trademark Office (USPTO).

    This newly issued patent strengthens SINTX’s intellectual property portfolio, further solidifying its position as a global leader in silicon nitride innovation. The patent covers novel advancements in silicon nitride material processing and applications, particularly in the biomedical sector, where the company continues to make significant strides in next-generation implant technology.

    “This patent represents another key milestone in SINTX’s ongoing commitment to pioneering advanced silicon nitride solutions,” said Eric K. Olson, President and CEO of SINTX. “With its antiviral, antibacterial, and biomechanical advantages, silicon nitride continues to demonstrate its potential in medical implants, regenerative medicine, and advanced coating technologies. This latest patent reinforces our leadership in the field and strengthens our ability to develop high-performance biomedical applications.”

    The patent, developed by the Company covers innovative methods of adhering silicon nitride to a wide array of biomaterial substrates to improve biocompatibility and resistance to infection, expanding its potential applications to orthopedic, craniomaxillofacial, dental and spinal implants. This scientific breakthrough aligns with SINTX’s broader mission to leverage its proprietary technology to improve patient outcomes and surgical success rates.

    SINTX is the only FDA-registered producer of implantable silicon nitride, with a robust portfolio that includes monolithic ceramic implants, particulate-based coatings, microspheres and composite materials. These innovations are aimed at enhancing osseointegration and reducing bacterial colonization, key factors in improving implant longevity and patient safety.

    With this issuance, SINTX continues to expand its intellectual property portfolio, which now includes 17 issued U.S. patents and 84 pending applications worldwide.

    For more information about SINTX Technologies and its silicon nitride platform, visit www.sintx.com.

    About SINTX Technologies, Inc.

    SINTX Technologies is an advanced ceramics company that develops and commercializes materials, components, and technologies for medical and technical applications. SINTX is a global leader in the research, development, and manufacturing of silicon nitride, and its products have been implanted in humans since 2008. Over the past several years, SINTX has utilized strategic acquisitions and alliances to enter into new markets. The Company has manufacturing and R&D facilities in Utah and Maryland.

    For more information on SINTX Technologies or its materials platform, visit www.sintx.com.

    Forward-Looking Statements

    This press release contains forward-looking statements within the meaning of the Private Securities Litigation Reform Act of 1995 (“PSLRA”) that are subject to a number of risks and uncertainties. Forward-looking statements can be identified by words such as: “anticipate,” “believe,” “project,” “estimate,” “expect,” “strategy,” “future,” “likely,” “may,” “should,” “will” and similar references to future periods. Examples of forward-looking statements include, among others, statements we make that the company continues to make significant strides in next-generation implant technology and the potential to pursue growth opportunities and explore strategic opportunities.

    Readers are cautioned not to place undue reliance on the forward-looking statements, which speak only as of the date on which they are made and reflect management’s current estimates, projections, expectations and beliefs. Because forward-looking statements relate to the future, they are subject to inherent uncertainties, risks and changes in circumstances that are difficult to predict and many of which are outside of our control. Our actual results and financial condition may differ materially from those indicated in the forward-looking statements. Important factors that could cause our actual results and financial condition to differ materially from those indicated in the forward-looking statements include, among others, technical feasibility and product development. A discussion of other risks and uncertainties that could cause our actual results and financial condition to differ materially from those indicated in the forward-looking statements can be found in SINTX’s Risk Factors disclosure in its Annual Report on Form 10-K, filed with the SEC on March 27, 2024, and in SINTX’s other filings with the SEC. SINTX undertakes no obligation to publicly revise or update the forward-looking statements to reflect events or circumstances that arise after the date of this report, except as required by law.

    Business and Media Inquiries for SINTX:
    SINTX Technologies
    801.839.3502
    IR@sintx.com

    The MIL Network

  • MIL-OSI: Canadian Consumer Debt Continues to Grow Despite Macroeconomic Relief

    Source: GlobeNewswire (MIL-OSI)

    Key findings from TransUnion report:

    • Despite stabilization of macroeconomic conditions, total consumer debt and delinquency rates continue to rise
    • Gen Z consumers continue to drive credit market activity
    • Credit card balances hit new milestone of $124 billion and delinquency rates rise even as average monthly card spend declines

    TORONTO, Feb. 19, 2025 (GLOBE NEWSWIRE) — Total consumer debt in Canada hit a historic high of $2.5 trillion as outstanding balances across all credit products grew by 4.5% year-over-year (YoY) in Q4 2024, according to TransUnion’s Q4 2024 Credit Industry Insights Report (CIIR). Balances grew due to a combination of increases in both mortgage debt and non-mortgage debt. Non-mortgage debt increased 5.8% YoY with balances continuing to rise across revolving products in Q4 2024. Line of credit balances grew 4.2%, while credit card balances continued a more rapid pace of growth, increasing 9.2%. Although the rate of growth has been slowing, the overall increase remains significant.

    Credit participation grew by 2.5% YoY, with 32.3 million Canadians holding at least one open credit product, a trend fueled in part by the recent decline in interest rates and inflation. Millennial and Gen Z consumers were at the forefront of this increase, collectively holding $1.1 trillion in outstanding balances, a 10% rise YoY. Gen Z consumers were the fastest-growing segment, with a 29% increase in credit participation as they diversify their debt beyond credit card debt.

    Canada Consumer Credit Index Hits Lowest Level Since 2021

    The Canada Consumer Credit Index fell YoY to 99.8 in Q4 2024, its lowest December level since 2020. The decline indicates a deterioration in the overall health of the Canadian retail credit market, reflecting declining consumer behaviours and weakening market conditions. Although all elements of the index were lower than the prior years’ values, slowing balances, declining demand and continued increase in delinquency rates were the strongest drivers of the decline.

    Credit Card Market Growth Slowing

    Credit card balances continued to grow, marking 31 months of consecutive YoY balance growth. However, this growth has moderated in recent quarters, indicating a stabilization in the market may be expected in 2025.

    Bankcard originations trended lower in recent quarters, though totals remained elevated in comparison to pre-2018 levels. The recent decline in origination totals was seen across most risk tiers, with subprime leading the decline, influenced by the decrease in new Canadians entering the market after a significant reduction in immigration volume.

    In an effort to manage delinquency rates, lenders have become more conservative within their risk tier targets at origination. Overall, bankcard originations dropped by 3.7% YoY, with the largest decline led by subprime at 6.9% YoY, while prime and near prime consumers grew by 3.7% and 0.4% respectively. The risk mix of originated bankcard accounts and credit lines remains consistent with 2018 and 2019 levels, indicating market moderation, metric stabilization and reversion to more familiar business cycles.

    Originations growth fell across all generations. Gen Z showed the least year-over-year impact, remaining relatively flat at a decline of only 0.1% from prior year as more young adults in this generation continue to enter the credit market each year. The remaining generations saw a significant drop off from prior years, as demand in these groups for additional credit may have waned as the economy improved.

    Year-over-Year Card Origination by Generation
      Q3’22 – Q3’23 Q3’23 – Q3’24
    Baby Boomer 6.2%   -9.0%  
    Gen X 9.3%   -6.8%  
    Gen Y/Millennial 11.6%   -2.9%  
    Gen Z 28.5%   -0.1%  

    Lower inflation in recent quarters, combined with continued employment resiliency for consumers, may be driving consumers towards an improved financial health, where they balance their monthly expenses and monthly budgets. Reduced lender appetite may also play a role in this slowdown, resulting in a decrease in new credit card originations. However, despite the slowing of originations, credit card balance growth remained strong, up 9% YoY, though below the previous year’s 13% growth. The growth fueled a new balance milestone of $124 billion in Q4 2024. This was driven by higher revolving balances as consumers paid down a smaller portion of their balances. Approximately 64% of outstanding balances were revolving in Q4 2024 (+157 bp YoY) indicating that consumers are increasingly carrying balances on their cards from month to month.

    Average credit card debt per borrower hit $4,681 in Q4, but has also been slowing relative to prior years, with average debt per borrower rising 6.0% YoY in Q4 2024 as opposed to 7.2% the year prior. Prime and below risk segments are increasingly tapping into their available credit, highlighting potential pockets of growing financial needs and a greater dependence on revolving debt to cover daily expenses.

    Despite positive economic indicators, including lower interest rates boosting home-related purchases, ongoing economic uncertainty, and high prices for goods and services have continued to weigh on consumer spending decisions. There has been a corresponding drop-off in average monthly card spend, which fell 2.6% from prior year. Overall pressure on consumers related to the higher costs of living and lower savings rates contributed to a rise in bankcard delinquency rates. Bankcard serious consumer-level delinquency levels, defined as 90 or more days past due (DPD), continued to climb higher to 0.93% in Q2 2024, up 9 bps YoY.

    “In an environment where new account growth is slowing, credit card issuers need to focus on optimizing account management strategies,” said Matthew Fabian, director of financial services research and consulting at TransUnion Canada. “Strengthening customer loyalty, fostering prudent balance growth and engaging younger consumers to enhance lifetime value are crucial. Equally important is vigilant monitoring for early warning signs of rising delinquencies.”

    Credit Card Lending Metric (Bankcard) Q4 2024 Q4 2023 Q4 2022
    Number of Credit Cards (millions) 50.8 47.6 44.5
    New Card Originations (millions)* 1.8 1.9 1.7
    Average New Card Credit Limit* $5,963 $5,771 $5,688
    Total Credit Card Balances (Market) in $ billions $124.7 $114.2 $100.9
    Average Card Balance per Consumer $4,681 $4,430 $4,076
    Average Credit Limit Per Consumer $19,124 $17,973 $16,969
    Average Monthly Spend $2,136 $2,193 $2,137
    Consumer-Level Delinquency Rate (90+ DPD) 0.93% 0.84% 0.75%

    * Acquisition results are presented one quarter in arrears

    Non-Bankcard Delinquencies Also Increase Despite Economic Improvements

    The current economic landscape is unique in that, despite relatively stable employment, there has been a rise in consumer loan delinquency rates. Solid employment has been offset by high interest rates that have put pressure on consumer wallets.

    Overall serious consumer delinquency continues to rise on a year-over-year basis, up 16 basis points to 1.83% and reaching a five-year high, back on par with the pre-pandemic levels. From a demographic perspective, Gen Z consumers are driving high delinquency rates with delinquencies up YoY 26 bps to 2.74% in Q4 2024. Gen Z credit consumers generally have lower risk scores as they are new to credit and have a shorter lending history. They may also be feeling a greater impact from inflation and the high cost of living, which may strain their budgets. Lenders will need to continue applying advanced analytics to grow and retain this segment, as Gen Z will remain a growing proportion of new credit consumers over the next few years and ultimately will become core credit consumers throughout their lifecycle.


    YoY Growth in delinquency by Cohort and Risk Segment

    Q4 2023 – Q4 2024 (bps)
      Baby Boomer Gen X Millennial Gen Z
    Subprime 91 134 114 189
    Near Prime 11 12 9 14
    Prime 3 4 2 1

    “As the Canadian credit market expands, Gen Z consumers present a significant growth opportunity for lenders, especially through tailored credit card offerings,” Fabian said. “Gen Z are educated and active credit users with a growing propensity to utilize credit throughout their lifecycle. Early management is crucial, as credit cards can be a valuable financial tool for Gen Z when managed responsibly. By implementing strategies such as education and regular credit monitoring, credit cards can become an asset rather than a financial burden for Gen Z consumers, creating loyalty to lenders who provide those services.”

    ** All data is sourced from the TransUnion Canada consumer credit database.

    About TransUnion®(NYSE: TRU)

    TransUnion is a global information and insights company with over 13,000 associates operating in more than 30 countries, including Canada, where we’re the credit bureau of choice for the financial services ecosystem and most of Canada’s largest banks. We make trust possible by ensuring each person is reliably represented in the marketplace. We do this by providing an actionable view of consumers, stewarded with care.

    Through our acquisitions and technology investments we have developed innovative solutions that extend beyond our strong foundation in core credit into areas such as marketing, fraud, risk and advanced analytics. As a result, consumers and businesses can transact with confidence and achieve great things. We call this Information for Good® — and it leads to economic opportunity, great experiences and personal empowerment for millions of people around the world.

    For more information visit: www.transunion.ca

    For more information or to request an interview, contact:

    Contact: Katie Duffy
    E-mail: katie.duffy@ketchum.com 
    Telephone: +1 647-772-0969

    A photo accompanying this announcement is available at https://www.globenewswire.com/NewsRoom/AttachmentNg/f4b9eec1-e70c-45bf-8e6d-7144f3adbf3d

    The MIL Network

  • MIL-OSI: HighPeak Energy, Inc. Announces 2024 Fourth Quarter and Yearend Earnings Release and Conference Call Dates

    Source: GlobeNewswire (MIL-OSI)

    FORT WORTH, Texas, Feb. 19, 2025 (GLOBE NEWSWIRE) — HighPeak Energy, Inc. (NASDAQ: HPK) (“HighPeak Energy”), today announced that it plans to release its 2024 fourth quarter and yearend financial and operating results after the close of trading on Monday, March 10, 2025.

    HighPeak Energy will host a conference call and webcast on Tuesday, March 11, 2025 at 10:00 a.m. Central Time for investors and analysts to discuss its 2024 fourth quarter and yearend financial results and operational highlights. Participants may register for the call here. Access to the live audio-only webcast and replay of the earnings release conference call may be found here. A live broadcast of the earnings conference call will also be available on HighPeak Energy’s website at www.highpeakenergy.com under the “Investors” section of the website.  

    About HighPeak Energy, Inc.

    HighPeak Energy is a publicly traded independent oil and natural gas company, headquartered in Fort Worth, Texas, focused on the acquisition, development, exploration and exploitation of oil and natural gas reserves in the Midland Basin in West Texas. For more information, please visit our website at www.highpeakenergy.com.

    Investor Contact:

    Ryan Hightower
    Vice President, Business Development
    817.850.9204
    rhightower@highpeakenergy.com

    Source: HighPeak Energy, Inc.

    The MIL Network

  • MIL-OSI: Enlight Renewable Energy Reports Fourth Quarter and Full Year 2024 Financial Results

    Source: GlobeNewswire (MIL-OSI)

    All of the amounts disclosed in this press release are in U.S. dollars unless otherwise noted

    TEL AVIV, Israel, Feb. 19, 2025 (GLOBE NEWSWIRE) — Enlight Renewable Energy Ltd. (NASDAQ: ENLT, TASE: ENLT) today reported financial results for the fourth quarter and full year ending December 31, 2024. The Company’s earnings conference call and webcast will be held today at 8:00 AM ET. Registration links to both the call and the webcast can be found at the end of this earnings release.

    Financial Highlights

    Full year 2024

    • Revenues and income of $399m, up 53% year over year
    • Adjusted EBITDA1 of $289m, up 49% year over year
    • Net income of $67m, down 32% year over year
    • Cash flow from operations of $193, up 29% year over year

    3 months ending December 31, 2024

    • Revenues and income of $104m, up 35% year over year
    • Adjusted EBITDA1 of $65m, up 31% year over year
    • Net income of $8m, down 48% year over year
    • Cash flow from operations of $36m, up 49% year over year

    ________________________
    1 The Company is unable to provide a reconciliation of Adjusted EBITDA to Net Income on a forward-looking basis without unreasonable effort because items that impact this IFRS financial measure are not within the Company’s control and/or cannot be reasonably predicted. Please refer to the reconciliation table in Appendix 2

      For the twelve months ended   For the three months ended
     ($ millions) 31/12/2024 31/12/2023 % change 31/12/2024 31/12/2023 % change
    Revenue and Income 399 261 53% 104 77 35%
    Net Income 67 98 (32%) 8 16 (48%)
    Adjusted EBITDA 289 194 49% 65 50 31%
    Cash Flow from Operating Activities 193 150 29% 36 24 49%
    • In 2023 the net income contained substantial one-time items
    • A detailed analysis of financial results appears below

    2024 Guidance vs Actual Results

    • Reported revenues and income for 2024 was 15% higher than the Company’s original guidance at the midpoint.
    • Reported Adjusted EBITDA for 2024 was 18% higher than the Company’s original guidance at the midpoint.

    Revenues and Income and Adjusted EBITDA includes $21m of U.S. tax benefits

    “We are proud to conclude 2024 with outstanding financial results that surpassed both our targets and analysts’ forecasts,” said Gilad Yavetz, CEO of Enlight Renewable Energy.

    “Enlight continues to grow thanks to its diversified and innovative operations, spanning three continents and employing the three main technologies of the industry: solar, wind, and energy storage.

    “The year 2025 represents another leap forward for us, as a massive capacity of 4.7 FGW – with a total investment of $5.5bn – will be under various stages of construction. Together with the Company’s operating portfolio, this will secure approximately 90% of the Company’s ambitious growth plan: to reach operating capacity of 8.6 FGW by the end of 2027. This plan will bring Enlight to an annual revenue rate of over $1bn by 2028, tripling the business in just three years.

    “We expect that the average return on equity for the vast asset portfolio that will become operational by 2027 will exceed 15%. Our three-year growth plan is already reflected in our 2025 guidance: we project revenues and income in the range of $490-510 million and Adjusted EBITDA in the range of $360-380 million, a 25% increase.”

    Portfolio Review

    • Enlight’s total portfolio is comprised of 20 GW of generation capacity and 35.8 GWh storage (30.2 FGW2)
    • Of this, the Mature portfolio component (including operating projects, projects under construction or pre-construction) contains 6.1 GW generation capacity and 8.6 GWh of storage (8.6 FGW)
    • Within the Mature portfolio component, the operating component has 2.5 GW of generation capacity and 1.9 GWh of storage (3.0 FGW)

    The full composition of the portfolio appears in the following table:

    Component Status FGW2 Annual recurring revenues ($m)3
    Operating Commercial operation 3.0 ~5004
    Under Construction Under construction 1.8 ~175
    Pre-Construction 0-12 months to start of construction 3.8 ~385
    Total Mature Portfolio Mature 8.6 1,060~
    Advanced Development 13-24 months to start of construction 7
    Development 2+ years to start of construction 14.7
    Total Portfolio   30.2

    ________________________
    2 FGW (Factored GW) is a consolidated metric combining generation and storage capacity into a uniform figure based on the ratio of construction costs. The company’s current weighted average construction cost ratio is 3.5 GWh of storage per 1 GW of generation: FGW = GW + GWh / 3.5
    3
    Does not include income from tax benefits for under construction and pre-construction projects.

    4 Based on the midpoint of 2025 guidance.

    • Operating component of the portfolio: 3 FGW
      • Start of commercial operations of 1.1 FGW in 2024, including projects Atrisco in the U.S., Pupin and Tapolca in Europe, the Israel Solar and Storage Cluster in MENA. These additions contribute approximately $100m to the annual revenue run rate.
    • Under Construction component of the portfolio: 1.8 FGW
      • Consists of three projects in the U.S. with a total capacity of 1.4 FGW; the Gecama Solar project in Spain with a capacity of 0.3 FGW; and a solar and storage cluster in Israel. 35% of the cluster is expected to reach operations in 2025, with the rest commissioning in 2026.
      • Projects under construction are expected to contribute $175m to the annual revenue run rate during their first full year of operation.
    • Pre-construction component of the portfolio: 3.8 FGW
      • Two mega projects in the U.S., Snowflake and CO Bar, with a combined capacity of 2.6 FGW will begin construction in 2025 and are expected to contribute $246m to revenues on an annualized basis.
      • Nardo, a stand alone storage project in Italy with a capacity of 0.25 FGW, is expected to begin construction in 2H25 and contribute $31m to revenues on an annualized basis.
    • Advanced Development component of the portfolio component: 7 FGW
      • 5.3 FGW in the U.S., with 100% of the capacity having passed completion of the System Impact Study, the most important study of the grid connection process, significantly de-risking the portfolio.
      • The U.S. portfolio includes several mega-projects and follow-ons to Mature projects, such as Cedar Island (1.4 FGW), Snowflake B (1.2 FGW), and Atrisco 2 (0.7 FGW).
      • These projects reflect the Company’s “Connect and Expand” strategy, leveraging existing grid infrastructure with the development of new ones, thereby reducing construction costs and project risks while improving project returns.
      • 0.7 FGW in Europe, focused on Italy, Spain, and Croatia.
      • 1 FGW in MENA, focused on solar and storage projects and stand alone storage facilities, including approximately 0.5 FGW that won availability tariffs as part of the Israel Electricity Authority’s first high voltage storage availability tariff tender.
    • Development component of the portfolio: 14.7 FGW
      • 10 FGW in the U.S. with broad geographic presence, including the PJM, WECC, SPP and MISO regions.
      • 2.7 FGW in Europe, focused on Italy, Spain, Croatia and entry into stand-alone storage operations in Poland.
      • 2 FGW in MENA, focused on solar combined storage projects and stand alone storage facilities.

    Projected COD Timeline for the Mature Portfolio5

    ________________________
    5 Additional projects currently classified in the Advanced Development portfolio are expected to reach commercial operation by 2027, however they are not included in this forecast

    Mature Portfolio Components Expected to Generate Annualized Revenues of Over $1bn6

    All the projects in the plan are expected to be completed by the end of 2027

    ________________________
    6 The projection is based on 2025 guidance, and only includes additional revenue growth from the sale of electricity from projects under construction and in pre-construction status.

    Financing Activities

    • Financial closings totaling $1.1bn in Europe and the US occurred during 2024, supporting the construction of projects with 470 MW and 2,100 MWh capacity.
    • Expansion of Series D bonds totaling $178m to finance the Company’s growth.
    • Sale of 44% of the Sunlight cluster for $50m cash at a valuation of $114m, generating a profit of up to $94m to be recognized in the first quarter of 2025. The cluster represents approximately 1% of the Company’s total portfolio.
    • As of the date of this report, the Company maintains $350m of revolving credit facilities, of which $70m have been drawn.

    2025 Guidance

    Construction and commissioning

    • Expected commissioning of 440 MW and 1.1 GWh of capacity, which is expected to add approximately $130m to annualized revenues and $105m annualized EBITDA, starting in 2026.
    • Starting construction on 1.8 GW and 3.9 GWh of capacity, which is expected to add over $300m in annualized revenues and over $250m in annualized EBITDA gradually through 2026-2027.

    Financial guidance

    • Total revenues and income7 are expected to range between $490m and $510m, a 25% increase (from the midpoint) from 2024 results. Of the projected revenues and income, 38% are expected to be denominated in ILS, 35% in EUR, and 27% in USD.
    • Adjusted EBITDA8 is expected to range between $360m and $380m, a 28% increase (from the midpoint) from 2024 results.
    • Approximately 90% of the electricity volumes expected to be generated in 2025 will be sold at fixed prices through PPAs or hedges.

    ________________________
    7 Total revenues and income include revenues from the sale of electricity along with income from tax benefits from US projects amounting to $60m-80m.
    8 EBITDA is a non-IFRS financial measure. The Company is unable to provide a reconciliation of EBITDA to Net Income on a forward-looking basis without unreasonable effort because items that impact this IFRS financial measure are not within the Company’s control and/or cannot be reasonably predicted. Please refer to the reconciliation table in Appendix 2.

    Financial Results Analysis

    Revenue & Income by Segment
    ($ thousands) For the twelve months ended   For the three months ended  
    Segment 31/12/2024 31/12/2023 Change % 31/12/2024 31/12/2023 Change %
    MENA 155,693 67,687 130% 34,086 20,738 64%
    Europe 197,143 177,471 11% 49,979 50,770 (2%)
    U.S. 36,608 7,712 375% 17,894 3,571 401%
    Other 9,351 8,270 13% 2,143 2,009 7%
    Total Revenue & Income 398,795 261,140 53% 104,102 77,088 35%
                 

    Revenues & Income

    In the fourth quarter of 2024, the Company’s total revenues and income increased to $104m, up from $77m last year, a growth rate of 35% year over year. This was composed of revenues from the sale of electricity, which rose 26% to $93m compared to $74m in the same period of 2023, as well as recognition of $11m in income from tax benefits, up 230% compared to $3m in 4Q23.

    The Company benefited from the revenue contribution of newly operational projects. Since the fourth quarter of 2023, 650 MW and 1,600 MWh of projects were connected to the grid and began selling electricity, including seven of the Israel Solar and Storage Cluster units in Israel, Atrisco in the U.S, Pupin in Serbia, and Tapolca in Hungary. The most important increases in revenue from the sale of electricity originated at the Israel Solar and Storage Cluster, which added $9m, followed by Atrisco, which added $6m in. In total, new projects contributed $18m to revenues from the sale of electricity

    Revenues and income were distributed between MENA, Europe, and the US, with 34% denominated in Israeli Shekel, 47% in Euros, and 18% denominated in US Dollars.

    Net Income

    In the fourth quarter, the Company’s net income amounted to $8m compared to $16m last year, a decrease of 48% year over year. In 4Q23 the Company recorded a $12m net profit stemming from the recalculation of earnout payments linked to the acquisition of Clenera. Adjusting for this figure, the net income in 4Q23 was $4m, implying year-on-year growth of 90%.

    Adjusted EBITDA9

    In the fourth quarter of 2024, the Company’s Adjusted EBITDA grew by 31% to $65m compared to $50m for the same period in 2023. The increase in Adjusted EBITDA was driven by the same factors that drove the increase in revenues and income, namely new projects and the recognition of higher amounts of tax benefits. This was offset by an additional $6m in higher operating expenses linked to new projects, while company overheads rose by $5m year-on-year.

    ________________________
    9 Adjusted EBITDA is a non-IFRS measure. Please see the appendix of this presentation for a reconciliation to Net Income

    Conference Call Information

    Enlight plans to hold its Fourth Quarter 2024 Conference Call and Webcast on Wednesday, February 19, 2025 at 8:00 a.m. ET to review its financial results and business outlook. Management will deliver prepared remarks followed by a question-and-answer session. Participants can join by dial-in or webcast:

    The press release with the financial results as well as the investor presentation materials will be accessible from the Company’s website prior to the conference call. Approximately one hour after completion of the live call, an archived version of the webcast will be available on the Company’s investor relations website at https://enlightenergy.co.il/info/investors/.

    Supplemental Financial and Other Information

    We intend to announce material information to the public through the Enlight investor relations website at https://enlightenergy.co.il/info/investors, SEC filings, press releases, public conference calls, and public webcasts. We use these channels to communicate with our investors, customers, and the public about our company, our offerings, and other issues. As such, we encourage investors, the media, and others to follow the channels listed above, and to review the information disclosed through such channels. Any updates to the list of disclosure channels through which we will announce information will be posted on the investor relations page of our website.

    Non-IFRS Financial Measures

    This release presents Adjusted EBITDA, a financial metric, which is provided as a complement to the results provided in accordance with the International Financial Reporting Standards as issued by the International Accounting Standards Board (“IFRS”). A reconciliation of the non-IFRS financial information to the most directly comparable IFRS financial measure is provided in the accompanying tables found at the end of this release.

    We define Adjusted EBITDA as net income (loss) plus depreciation and amortization, share based compensation, finance expenses, taxes on income and share in losses of equity accounted investees and minus finance income and non-recurring portions of other income, net. For the purposes of calculating Adjusted EBITDA, compensation for inadequate performance of goods and services procured by the Company are included in other income, net. Compensation for inadequate performance of goods and services reflects the profits the Company would have generated under regular operating conditions and is therefore included in Adjusted EBITDA. With respect to gains (losses) from asset disposals, as part of Enlight’s strategy to accelerate growth and reduce the need for equity financing, the Company sells parts of or the entirety of selected renewable project assets from time to time, and therefore includes realized gains or losses from these asset disposals in Adjusted EBITDA. In the case of partial assets disposals, Adjusted EBITDA includes only the actual consideration less the book value of the assets sold. Our management believes Adjusted EBITDA is indicative of operational performance and ongoing profitability and uses Adjusted EBITDA to evaluate the operating performance and for planning and forecasting purposes.

    Non-IFRS financial measures have limitations as analytical tools and should not be considered in isolation or as substitutes for financial information presented under IFRS. There are a number of limitations related to the use of non-IFRS financial measures versus comparable financial measures determined under IFRS. For example, other companies in our industry may calculate the non-IFRS financial measures that we use differently or may use other measures to evaluate their performance. All of these limitations could reduce the usefulness of our non-IFRS financial measures as analytical tools. Investors are encouraged to review the related IFRS financial measure, Net Income, and the reconciliations of Adjusted EBITDA provided below to Net Income and to not rely on any single financial measure to evaluate our business.

    Special Note Regarding Forward-Looking Statements

    This press release contains forward-looking statements within the meaning of the U.S. Private Securities Litigation Reform Act of 1995. We intend such forward-looking statements to be covered by the safe harbor provisions for forward-looking statements as contained in Section 27A of the Securities Act of 1933, as amended, and Section 21E of the Securities Exchange Act of 1934, as amended. All statements contained in this press release other than statements of historical fact, including, without limitation, statements regarding the Company’s business strategy and plans, capabilities of the Company’s project portfolio and achievement of operational objectives, market opportunity, utility demand and potential growth, discussions with commercial counterparties and financing sources, pricing trends for materials, progress of Company projects, including anticipated timing of related approvals and project completion and anticipated production delays, the Company’s future financial results, expected impact from various regulatory developments and anticipated trade sanctions, expectations regarding wind production, electricity prices and windfall taxes, and Revenues and Income and Adjusted EBITDA guidance, the expected timing of completion of our ongoing projects, and the Company’s anticipated cash requirements and financing plans , are forward-looking statements. The words “may,” “might,” “will,” “could,” “would,” “should,” “expect,” “plan,” “anticipate,” “intend,” “target,” “seek,” “believe,” “estimate,” “predict,” “potential,” “continue,” “contemplate,” “possible,” “forecasts,” “aims” or the negative of these terms and similar expressions are intended to identify forward-looking statements, though not all forward-looking statements use these words or expressions.

    These statements are neither promises nor guarantees, but involve known and unknown risks, uncertainties and other important factors that may cause our actual results, performance or achievements to be materially different from any future results, performance or achievements expressed or implied by the forward-looking statements, including, but not limited to, the following: our ability to site suitable land for, and otherwise source, renewable energy projects and to successfully develop and convert them into Operational Projects; availability of, and access to, interconnection facilities and transmission systems; our ability to obtain and maintain governmental and other regulatory approvals and permits, including environmental approvals and permits; construction delays, operational delays and supply chain disruptions leading to increased cost of materials required for the construction of our projects, as well as cost overruns and delays related to disputes with contractors; disruptions in trade caused by political, social or economic instability in regions where our components and materials are made; our suppliers’ ability and willingness to perform both existing and future obligations; competition from traditional and renewable energy companies in developing renewable energy projects; potential slowed demand for renewable energy projects and our ability to enter into new offtake contracts on acceptable terms and prices as current offtake contracts expire; offtakers’ ability to terminate contracts or seek other remedies resulting from failure of our projects to meet development, operational or performance benchmarks; exposure to market prices in some of our offtake contracts; various technical and operational challenges leading to unplanned outages, reduced output, interconnection or termination issues; the dependence of our production and revenue on suitable meteorological and environmental conditions, and our ability to accurately predict such conditions; our ability to enforce warranties provided by our counterparties in the event that our projects do not perform as expected; government curtailment, energy price caps and other government actions that restrict or reduce the profitability of renewable energy production; electricity price volatility, unusual weather conditions (including the effects of climate change, could adversely affect wind and solar conditions), catastrophic weather-related or other damage to facilities, unscheduled generation outages, maintenance or repairs, unanticipated changes to availability due to higher demand, shortages, transportation problems or other developments, environmental incidents, or electric transmission system constraints and the possibility that we may not have adequate insurance to cover losses as a result of such hazards; our dependence on certain operational projects for a substantial portion of our cash flows; our ability to continue to grow our portfolio of projects through successful acquisitions; changes and advances in technology that impair or eliminate the competitive advantage of our projects or upsets the expectations underlying investments in our technologies; our ability to effectively anticipate and manage cost inflation, interest rate risk, currency exchange fluctuations and other macroeconomic conditions that impact our business; our ability to retain and attract key personnel; our ability to manage legal and regulatory compliance and litigation risk across our global corporate structure; our ability to protect our business from, and manage the impact of, cyber-attacks, disruptions and security incidents, as well as acts of terrorism or war; changes to existing renewable energy industry policies and regulations that present technical, regulatory and economic barriers to renewable energy projects; the reduction, elimination or expiration of government incentives or benefits for, or regulations mandating the use of, renewable energy; our ability to effectively manage the global expansion of the scale of our business operations; our ability to perform to expectations in our new line of business involving the construction of PV systems for municipalities in Israel; our ability to effectively manage our supply chain and comply with applicable regulations with respect to international trade relations, tariffs, sanctions, export controls and anti-bribery and anti-corruption laws; our ability to effectively comply with Environmental Health and Safety and other laws and regulations and receive and maintain all necessary licenses, permits and authorizations; our performance of various obligations under the terms of our indebtedness (and the indebtedness of our subsidiaries that we guarantee) and our ability to continue to secure project financing on attractive terms for our projects; limitations on our management rights and operational flexibility due to our use of tax equity arrangements; potential claims and disagreements with partners, investors and other counterparties that could reduce our right to cash flows generated by our projects; our ability to comply with increasingly complex tax laws of various jurisdictions in which we currently operate as well as the tax laws in jurisdictions in which we intend to operate in the future; the unknown effect of the dual listing of our ordinary shares on the price of our ordinary shares; various risks related to our incorporation and location in Israel, including the ongoing war in Israel, where our headquarters and some of our wind energy and solar energy projects are located; the costs and requirements of being a public company, including the diversion of management’s attention with respect to such requirements; certain provisions in our Articles of Association and certain applicable regulations that may delay or prevent a change of control; and other risk factors set forth in the section titled “Risk factors” in our Annual Report on Form 20-F for the fiscal year ended December 31, 2023, filed with the Securities and Exchange Commission (the “SEC”), as may be updated in our other documents filed with or furnished to the SEC.

    These statements reflect management’s current expectations regarding future events and operating performance and speak only as of the date of this press release. You should not put undue reliance on any forward-looking statements. Although we believe that the expectations reflected in the forward-looking statements are reasonable, we cannot guarantee that future results, levels of activity, performance and events and circumstances reflected in the forward-looking statements will be achieved or will occur. Except as required by applicable law, we undertake no obligation to update or revise publicly any forward-looking statements, whether as a result of new information, future events or otherwise, after the date on which the statements are made or to reflect the occurrence of unanticipated events.

    About Enlight

    Founded in 2008, Enlight develops, finances, constructs, owns, and operates utility-scale renewable energy projects. Enlight operates across the three largest renewable segments today: solar, wind and energy storage. A global platform, Enlight operates in the United States, Israel and 9 European countries. Enlight has been traded on the Tel Aviv Stock Exchange since 2010 (TASE: ENLT) and completed its U.S. IPO (Nasdaq: ENLT) in 2023.

    Company Contacts

    Yonah Weisz
    Director IR
    investors@enlightenergy.co.il

    Erica Mannion or Mike Funari
    Sapphire Investor Relations, LLC
    +1 617 542 6180
    investors@enlightenergy.co.il

    Appendix 1 – Financial information

    Consolidated Statements of Income
           
        For the year ended at
    December 31
        2024   2023(*)
        USD in   USD in
        thousands   thousands
    Revenues   377,935   255,702
    Tax benefits   20,860   5,438
    Total revenues and income   398,795   261,140
             
    Cost of sales (**)   (80,696)   (52,794)
    Depreciation and amortization   (108,889)   (65,796)
    General and administrative expenses   (38,847)   (31,356)
    Development expenses   (11,601)   (6,347)
    Total operating expenses   (240,033)   (156,293)
    Gains from projects disposals   601   9,846
    Other income, net   16,172   43,450
    Operating profit   175,535   158,143
             
    Finance income   20,439   36,799
    Finance expenses   (107,844)   (68,143)
    Total finance expenses, net   (87,405)   (31,344)
             
    Profit before tax and equity loss   88,130   126,799
    Share of loss of equity accounted investees   (3,350)   (330)
    Profit before income taxes   84,780   126,469
    Taxes on income   (18,275)   (28,428)
    Profit for the year   66,505   98,041
             
    Profit for the year attributed to:        
    Owners of the Company   44,209   70,924
    Non-controlling interests   22,296   27,117
        66,505   98,041
    Earnings per ordinary share (in USD) with a par value of        
    NIS 0.1, attributable to owners of the parent Company:        
    Basic earnings per share   0.37   0.61
    Diluted earnings per share   0.36   0.57
    Weighted average of share capital used in the        
    calculation of earnings:        
    Basic per share   118,293,556   115,721,346
    Diluted per share   123,312,565   123,861,293
     

    (*) The Consolidated Statements of Income have been adjusted to present comparable information for the previous year. For additional details please see Appendix 8.

    (**) Excluding depreciation and amortization

    Consolidated Statements of Financial Position as of        
        December 31   December 31
        2024   2023
        USD in   USD in
        Thousands   Thousands
    Assets        
             
    Current assets        
    Cash and cash equivalents   387,427   403,805
    Deposits in banks     5,308
    Restricted cash   100,090   142,695
    Trade receivables   50,692   43,100
    Other receivables   99,651   60,691
    Current maturities of contract assets     8,070
    Other financial assets   975   976
    Assets of disposal groups classified as held for sale   81,661  
    Total current assets   720,496   664,645
             
    Non-current assets        
    Restricted cash   48,251   38,891
    Other long-term receivables   61,045   32,540
    Deferred costs in respect of projects   357,358   271,424
    Deferred borrowing costs   276   493
    Loans to investee entities   18,112   35,878
    Contract assets     91,346
    Fixed assets, net   3,699,192   2,947,369
    Intangible assets, net   291,442   287,961
    Deferred taxes assets   10,744   9,134
    Right-of-use asset, net   210,941   121,348
    Financial assets at fair value through profit or loss   69,216   53,466
    Other financial assets   59,812   79,426
    Total non-current assets   4,826,389   3,969,276
             
    Total assets   5,546,885   4,633,921
    Consolidated Statements of Financial Position as of (Cont.)         
        December 31   December 31
        2024   2023
        USD in   USD in
        Thousands   Thousands
    Liabilities and equity    
             
    Current liabilities      
    Credit and current maturities of loans from        
    banks and other financial institutions   212,246   324,666
    Trade payables 161,991   105,574
    Other payables 107,825   103,622
    Current maturities of debentures   44,962   26,233
    Current maturities of lease liability   10,240   8,113
    Financial liabilities through profit or loss     13,860
    Other financial liabilities   8,141   1,224
    Liabilities of disposal groups classified as held for sale   46,635  
    Total current liabilities   592,040   583,292
             
    Non-current liabilities    
    Debentures 433,994   293,751
    Other financial liabilities   107,865   62,020
    Convertible debentures   133,056   130,566
    Loans from banks and other financial institutions   1,996,137   1,702,925
    Loans from non-controlling interests   75,598   92,750
    Financial liabilities through profit or loss   25,844   34,524
    Deferred taxes liabilities   41,792   44,941
    Employee benefits 1,215   4,784
    Lease liability 211,941   119,484
    Deferred income related to tax equity   403,384   60,880
    Asset retirement obligation   83,085   68,047
    Total non-current liabilities   3,513,911   2,614,672
             
    Total liabilities 4,105,951   3,197,964
             
    Equity        
    Ordinary share capital   3,308   3,293
    Share premium 1,028,532   1,028,532
    Capital reserves 25,273   57,730
    Proceeds on account of convertible options   15,494   15,494
    Accumulated profit 107,919   63,710
    Equity attributable to shareholders of the Company   1,180,526   1,168,759
    Non-controlling interests   260,408   267,198
    Total equity 1,440,934   1,435,957
    Total liabilities and equity   5,546,885   4,633,921
    Consolidated Statements of Cash Flows    
         
      For the year ended at
    December 31
      2024 2023
      USD in USD in
      Thousands Thousands
         
    Cash flows for operating activities    
    Profit for the period 66,505 98,041
         
    Income and expenses not associated with cash flows:    
    Depreciation and amortization 108,889 65,796
    Finance expenses, net 83,560 28,805
    Share-based compensation 8,360 4,970
    Taxes on income 18,275 28,428
    Tax benefits (20,860) (5,438)
    Other income, net (4,963) (46,991)
    Company’s share in losses of investee partnerships 3,350 330
      196,611 75,900
         
    Changes in assets and liabilities items:    
    Change in other receivables 12,261 (3,241)
    Change in trade receivables (9,892) (2,841)
    Change in other payables 294 6,382
    Change in trade payables 746 15,474
      3,409 15,774
         
    Interest receipts 12,684 12,490
    Interest paid (74,891) (54,469)
    Income Tax paid (11,246) (12,236)
    Repayment of contract assets 14,120
         
    Net cash from operating activities 193,072 149,620
         
    Cash flows for investing activities    
    Sale (Acquisition) of consolidated entities, net 1,871 (6,975)
    Changes in restricted cash and bank deposits, net 29,959 (53,131)
    Purchase, development, and construction in respect of projects (899,257) (730,976)
    Loans provided and Investment in investees (26,444) (28,174)
    Payments on account of acquisition of consolidated entity (32,777) (5,728)
    Proceeds from sale (purchase) of financial assets measured at fair value     
    through profit or loss, net (14,719) 26,919
    Net cash used in investing activities (941,367) (798,065)
    Consolidated Statements of Cash Flows (Cont.)   
      For the year ended at
    December 31
      2024  2023 
      USD in USD in
      Thousands Thousands
         
    Cash flows from financing activities    
    Receipt of loans from banks and other financial institutions 939,627 623,927
    Repayment of loans from banks and other financial institutions (699,586) (203,499)
    Issuance of debentures 177,914 83,038
    Repayment of debentures (26,016) (14,735)
    Dividends and distributions by subsidiaries to non-controlling interests (25,534) (13,328)
    Proceeds from investments by tax-equity investors 410,845 198,758
    Repayment of tax equity investment (839) (82,721)
    Deferred borrowing costs (21,637) (1,984)
    Receipt of loans from non-controlling interests 274
    Repayment of loans from non-controlling interests (2,960) (1,485)
    Increase in holding rights of consolidated entity (169)
    Issuance of shares 266,451
    Exercise of share options 15 9
    Repayment of lease liability (5,852) (4,848)
    Proceeds from investment in entities by non-controlling interest 179 5,448
         
    Net cash from financing activities 745,987 855,305
         
    Increase (Decrease) in cash and cash equivalents (2,308) 206,860
         
    Balance of cash and cash equivalents at beginning of period 403,805 193,869
         
    Changes in cash of disposal groups classified as held for sale (5,753)
         
    Effect of exchange rate fluctuations on cash and cash equivalents (8,317) 3,076
         
    Cash and cash equivalents at end of period 387,427 403,805

    Information related to Segmental Reporting

      For the year ended December 31, 2024
      MENA(**)   Europe(**)   USA   Total reportable segments   Others   Total
      USD in thousands
    Revenues 155,693   197,143   15,748   368,584   9,351   377,935
    Tax benefits     20,860   20,860     20,860
    Total revenues and income 155,693   197,143   36,608   389,444   9,351   377,935
                           
    Segment adjusted EBITDA 123,724   165,385   33,539   322,648   4,141   326,789
       
    Reconciliations of unallocated amounts:  
    Headquarter costs (*) (37,774)
    Intersegment profit 100
    Depreciation and amortization and share-based compensation (117,249)
    Other incomes not attributed to segments 3,669
    Operating profit 175,535
    Finance income 20,439
    Finance expenses (107,844)
    Share in the losses of equity accounted investees (3,350)
    Profit before income taxes 84,780
     

    (*) Including general and administrative and development expenses (excluding depreciation and amortization and share based compensation).

    (**) Due to the Company’s organizational restructuring, the Chief Operation Decision Maker (CODM) now reviews the group’s results by segmenting them into four business units: MENA (Middle East and North Africa), Europe, the US, and Management and Construction. Consequently, the Central/Eastern Europe and Western Europe segments have been consolidated into the “Europe” segment, and the Israel segment has been incorporated into the MENA segment. The comparative figures for the year ended December 31, 2023, have been updated accordingly.

    Information related to Segmental Reporting

      For the year ended December 31, 2023
      MENA   Europe   USA   Total reportable segments   Others   Total
      USD in thousands
    Revenues 67,687   177,471   2,274   247,432   8,270   255,702
    Tax benefits     5,438   5,438     5,438
    Total revenues and income 67,687   177,471   7,712   252,870   8,270   261,140
                           
    Segment adjusted EBITDA 71,350   150,677   12,133   234,160   3,035   237,195
       
    Reconciliations of unallocated amounts:  
    Headquarter costs (*) (30,434)
    Intersegment profit 1,587
    Repayment of contract asset under concession arrangements (14,120)
    Depreciation and amortization and share-based compensation (70,766)
    Other incomes not attributed to segments 34,681
    Operating profit 158,143
    Finance income 36,799
    Finance expenses (68,143)
    Share in the losses of equity accounted investees (330)
    Profit before income taxes 126,469
     

    (*) Including general and administrative and development expenses (excluding depreciation and amortization and share based compensation).

    Appendix 2 – Reconciliations between Net Income to Adjusted EBITDA

    ($ thousands)   For the year ended   For the three months
        December 31   ended December 31
        2024   2023   2024   2023
    Net Income (loss)   66,505   98,041   8,372   16,202
    Depreciation and amortization   108,889   65,796   30,912   21,611
    Share based compensation   8,360   4,970   2,333   970
    Finance income   (20,439)   (36,799)   (2,140)   7,581
    Finance expenses   107,844   68,143   22,008   16,344
    Non-recurring other income (*)   (3,669)   (34,681)     (15,718)
    Share of losses of equity accounted investees   3,350   330   1,613   (137)
    Taxes on income   18,275   28,428   2,121   2,934
    Adjusted EBITDA   289,115   194,228   65,219   49,787
                     
    * For the purposes of calculating Adjusted EBITDA, compensation for inadequate performance of goods and services procured by the Company are included in other income, net.
       

    The Company has changed its presentation of its Income Statement, which includes the presentation of specified items that have been previously included within other income (i.e. tax equity). The Company believes that such presentation provides a more relevant information and better reflects the measurement of its financial performance. The Company applied such change retrospectively.

    Appendix 3 – Debentures Covenants

    Debentures Covenants

    As of December 31, 2024, the Company was in compliance with all of its financial covenants under the indenture for the Series C-F Debentures, based on having achieved the following in its consolidated financial results:

    Minimum equity
    The company’s equity shall be maintained at no less than NIS 200 million so long as debentures E remain outstanding, no less than NIS 375 million so long as debentures F remain outstanding, and NIS 1,250 million so long as debentures C and D remain outstanding.

    As of December 31, 2024, the company’s equity amounted to NIS 5,255 million.

    Net financial debt to net CAP
    The ratio of standalone net financial debt to net CAP shall not exceed 70% for two consecutive financial periods so long as debentures E and F remain outstanding, and shall not exceed 65% for two consecutive financial periods so long as debentures C and D remain outstanding.

    As of December 31, 2024, the net financial debt to net CAP ratio, as defined above, stands at 37%.

    Net financial debt to EBITDA
    So long as debentures E and F remain outstanding, standalone financial debt shall not exceed NIS 10 million, and the consolidated financial debt to EBITDA ratio shall not exceed 18 for more than two consecutive financial periods.

    For as long as debentures C and D remain outstanding, the consolidated financial debt to EBITDA ratio shall not exceed 15 for more than two consecutive financial periods.

    As of December 31, 2024, the net financial debt to EBITDA ratio, as defined above, stands at 9.

    Equity to balance sheet
    The standalone equity to total balance sheet ratio shall be maintained at no less than 20% and 25%, respectively, for two consecutive financial periods for as long as debentures E and F, and debentures C and D remain outstanding.

    As of December 31, 2024, the equity to balance sheet ratio, as defined above, stands at 55%.

    Photos accompanying this announcement are available at:
    https://www.globenewswire.com/NewsRoom/AttachmentNg/16dfdaab-3b06-4494-a529-7e4b98cd6ad8

    https://www.globenewswire.com/NewsRoom/AttachmentNg/a4d568ee-77b0-4eab-b7ef-c865a4a26d0e

    https://www.globenewswire.com/NewsRoom/AttachmentNg/ae07b0d5-09c7-404f-a71d-70494b2b64ca

    The MIL Network

  • MIL-OSI: Broctagon Partners with Level2 to Simplify Strategy Creation for AXIS CRM Brokers

    Source: GlobeNewswire (MIL-OSI)

    LONDON, Feb. 19, 2025 (GLOBE NEWSWIRE) —

    Level2 and Broctagon Partner to Bring No-Code Automated Trading to Brokers Using AXIS CRM
    This innovative collaboration aims to simplify the strategy creation process for brokers and all their traders currently using Broctagon’s AXIS CRM platform.

    Level2’s intuitive no-code EA solution allows traders of all experience levels to easily create, deploy, and automate strategies using a fully visual, drag-and-drop approach. This no-code approach eliminates the need for technical expertise, enabling traders to configure strategies, analyse performance, and execute trades with ease. By integrating Level2’s capabilities, brokers utilising Broctagon’s AXIS CRM – known for its multi-tier IB module, prop trading features, and API app marketplace – will now be able to offer their traders cutting-edge automated trading tools that drive engagement and unlock greater market potential.

    Key Features for Active Traders:

    • No-Code, Visual Strategy Creation: Level2’s platform allows traders to configure and deploy strategies through an intuitive interface, without any coding skills required.
    • Real-Time Backtesting: Traders can instantly test their strategies using historical data, gaining valuable insights to optimise performance and make data-driven decisions in real time.
    • Seamless Analysis to Execution: With Level2’s visual tools, traders can connect market insights directly to execution, streamlining the entire trading process for increased efficiency.
    • Collaborative Social Trading: Level2 introduces a community-driven approach to trading, where users can share, follow, and collaborate on strategies, enhancing engagement and empowering traders of all skill levels.

    “Broctagon is a forward-thinking organisation that prioritises innovation. Through this partnership, we’ve created a solution that will make technical analysis and fully automated trading more accessible than ever before, giving Axis CRM brokers a competitive edge to captivate traders and drive demand” — Andrew Grevett, Co-founder & CEO of Level2. “Algorithmic trading has traditionally been reserved for those with coding expertise, creating a barrier for many traders. Level2’s no-code EA builder removes that barrier, revolutionising the way traders of all skill levels access and implement automated strategies. By partnering with Level2, Broctagon reinforces its commitment to innovation, empowering all AXIS FX CRM brokers with cutting-edge automation tools that drive engagement, retention, and trading volume” — Don Guo, Founder & CEO of Broctagon

    About Level2
    Level2 is a pioneering technology company focused on transforming the way active traders engage with financial markets. Through its intuitive, fully visual platform, Level2 simplifies strategy creation and automation for traders of all experience levels, eliminating the need for complex coding or technical expertise. With a commitment to innovation and accessibility, Level2 is helping shape the future of active trading by making professional-grade tools available to a broader audience, driving smarter, more efficient trading.

    About Broctagon Fintech Group
    Broctagon Fintech Group is a leading multi-asset liquidity and FX technology provider headquartered in Singapore, with over 15 years of global presence in Hong Kong, Malaysia, India, Cyprus, Thailand, and China. We specialize in performance-driven, bespoke solutions, serving over 350 clients in more than 50 countries with our liquidity aggregator technology, brokerage and prop trading solutions, and enterprise blockchain development.

    Users can experience Level2 now or contact us to arrange a personalised demonstration.

    Contact

    Co-founder & CEO
    Andrew Grevett
    Level2
    andrew@trylevel2.com

    A photo accompanying this announcement is available at https://www.globenewswire.com/NewsRoom/AttachmentNg/fe7bd9b0-2951-46f0-b696-453b6ae50c34

    The MIL Network

  • MIL-OSI: Taitiko Announces Strategic Update: New Real-Money Competitions to Launch on Taitiko ARENA

    Source: GlobeNewswire (MIL-OSI)

    FAMAGUSTA, Cyprus, Feb. 19, 2025 (GLOBE NEWSWIRE) — Taitiko, the emerging leader in Web3 gaming, is poised to make a major announcement today, unveiling the upcoming launch of real-money competitions on its popular Taitiko ARENA platform. With over 100,000 active users already engaged in skill-based mini-games via Telegram, the introduction of real-money competitions will elevate the gaming experience, offering players the opportunity to earn tangible rewards in exchange for their skills and achievements.

    This milestone is part of Taitiko’s ongoing strategy to create a sustainable, player-centric ecosystem within the Web3 space. “We’re committed to prioritizing genuine player engagement and innovation, not just speculative tokenomics,” said Alex Pei Fresneda, spokesperson for Taitiko. “The new real-money competitions will enhance the fun and competition in our platform while ensuring that users can benefit directly from their gaming experience.”

    A New Era for Taitiko ARENA

    As part of Taitiko’s broader vision, the integration of real-money competitions will provide a dynamic new avenue for players to showcase their abilities and compete against a global community. The update, set for release in the coming weeks, will enhance the user experience by adding financial stakes to the already competitive and skill-driven environment of Taitiko ARENA.

    “We want to give players an opportunity to turn their skills into real rewards,” Fresneda added. “This update is just the beginning of a series of exciting developments for Taitiko in 2025.”

    Strengthening Industry Position

    Taitiko’s growth is fueled by its strategic partnerships with prominent entities such as DEXTools, Tonstation Games, SidusPad, and Decubate. These collaborations have enhanced Taitiko’s technological capabilities and broadened its reach within the blockchain and gaming communities, setting the stage for further expansion.

    Additionally, the ongoing development of Taitiko Party, a multiplayer desktop game for both Windows and Mac, is progressing at full speed, with the game nearing completion at 80%. Taitiko’s upcoming token launch and plans for a year-long NFT collection further underscore its commitment to delivering both immersive experiences and long-term growth in the Web3 gaming space.

    About Taitiko

    Taitiko is at the forefront of revolutionizing the gaming industry with its innovative approach to Web3 gaming, focusing on player engagement, strategic partnerships, and a sustainable business model. With a growing user base and a clear roadmap, Taitiko aims to lead the next wave of blockchain-powered gaming experiences.

    For more information on Taitiko, visit Taitiko.com.

    Media Contact:

    Alex Pei Fresneda
    info@taitiko.com

    Taitiko Official Website
    Taitiko on X
    Taitiko on Telegram

    Disclaimer: This content is provided by Taitiko. The statements, views, and opinions expressed in this content are solely those of the sponsor and do not necessarily reflect the views of this media platform. We do not endorse, verify, or guarantee the accuracy, completeness, or reliability of any information presented. This content is for informational purposes only and should not be considered as financial, investment, or trading advice. Readers are strongly encouraged to conduct their own research and consult with a qualified financial advisor before investing in or trading cryptocurrency and securities. Please conduct your own research and invest at your own risk.

    Photos accompanying this announcement are available at

    https://www.globenewswire.com/NewsRoom/AttachmentNg/9ac8e0b1-58f1-4721-bee1-cb461d9f6966

    https://www.globenewswire.com/NewsRoom/AttachmentNg/fc3dad94-8f4b-4788-8381-a9feac2b9e9f

    The MIL Network

  • MIL-OSI Russia: Alexander Novak met with the Special Representative for Climate Change of the President of Kenya, Chairman of the African Group of Negotiators Ali Daoud Mohamed

    Translartion. Region: Russians Fedetion –

    Source: Government of the Russian Federation – An important disclaimer is at the bottom of this article.

    Previous news Next news

    Alexander Novak met with the Special Representative for Climate Change of the President of Kenya, Chairman of the African Group of Negotiators Ali Daoud Mohamed

    Deputy Prime Minister of Russia Alexander Novak met with the Special Representative for Climate Change of the President of Kenya, Chairman of the African Group of Negotiators within the framework of the UN Framework Convention on Climate Change (UNFCCC) process Ali Daoud Mohamed.

    The parties discussed national efforts and international cooperation in implementing the goals of the Paris Agreement to limit global warming and climate change.

    The meeting also discussed cooperation in the carbon market, the need to take into account the contribution of forests to absorbing emissions, and the possibility of coordinating the efforts of Russia and African countries in matters of adaptation to climate change.

    Alexander Novak stressed the need to implement a smooth transition to a zero-emissions economy with equal access to modern technologies.

    “The transition to a low-carbon economy must be fair and take into account various national climate and natural conditions and development priorities. I believe that the transition to zero emissions will be gradual, using a wide range of technologies. Harmonious coexistence of both green and traditional energy, which can complement each other, is necessary. The transition from fossil fuels is not the only way to reduce emissions, but one of the possible ways. A ban on investment in projects related to the use of fossil fuels cannot be the basis for a fair transition,” said Alexander Novak.

    The Deputy Prime Minister noted the important role of the transition from coal to natural gas in the process of moving towards carbon neutrality. This allows for a significant reduction in greenhouse gas emissions and helps to overcome technological gaps.

    The meeting participants recognized that any unilateral barriers or artificial restrictions that hinder the achievement of climate goals are inappropriate, since global warming is one of the main challenges for future generations.

    Russia has emphasized its commitment to climate issues and intends to continue participating in the international dialogue on combating climate change regardless of the changing course of other countries. In total, Russia has already managed to reduce emissions by almost 70% compared to the 1990 level – this is an absolute record among all countries participating in the international climate agenda.

    Please note: This information is raw content directly from the source of the information. It is exactly what the source states and does not reflect the position of MIL-OSI or its clients.

    MIL OSI Russia News

  • MIL-OSI New Zealand: Lifestyle – Exercise Industry Set for Significant Growth in 2025 Despite Economic Headwinds

    Source: Exercise NZ

    Despite ongoing economic pressures, a new consumer survey by ExerciseNZ reveals a promising outlook for New Zealand’s exercise industry. Conducted by Horizon Research for the past five years, the survey polled New Zealand adults nationwide and highlights a growing interest and uptake in physical activity and structured exercise, presenting significant opportunities for industry growth in 2025.

    The survey, conducted in late 2024, is set for release in February 2025.

    Richard Beddie, CEO of ExerciseNZ, notes that while economic challenges often impact discretionary spending, exercise remains a priority for many Kiwis. “People increasingly recognise the benefits of regular exercise—not just for physical health but also for mental wellbeing and resilience. Even in times of financial uncertainty, we see continued demand for exercise services, highlighting the industry’s resilience and growth potential,” says Beddie.

    Key Findings from the Consumer Report:

    Strong Intent to Start Exercise

    Over a quarter of a million (309,000) adults plan to begin structured exercise in 2025.
    10% of adults are considering joining a structured exercise provider in the next 12 months.

    Increased Use of Exercise Professionals

    28% of adults (1,075,000 people) pay for one-on-one exercise professionals—a 6% increase from 2023.
    15% (595,000 people) see an exercise professional weekly, up 4%.
    8% of non-users (309,000 adults) plan to start, indicating 30% growth potential.

    High Value Placed on Physical Activity

    98% of New Zealanders value physical activity.
    Top reasons: health benefits (76%), mental health (64%), and feeling good (61%).

    Shift in Exercise Preferences

    67% of adults exercise, up from 64% in 2023—defying the trend of declining physical activity.
    22% (866,000 people) use structured providers, with 12% in group classes and 14% training individually.
    Small gyms/studios and recreational facilities (both 11%) are growing, while large gyms saw a slight decline (14%).

    Despite economic challenges and cost-of-living pressures, the survey shows that New Zealanders are prioritising their health and well-being, with a strong intent to increase physical activity. The exercise industry is well-positioned to capitalise on this trend by offering flexible, affordable, and varied exercise options to meet consumer needs.

    Beddie adds, “The findings from this year’s survey are incredibly encouraging. Despite economic challenges, New Zealanders want to exercise more and see the value in professional guidance and structured programs. This presents a significant opportunity for the industry to grow and adapt to evolving consumer needs.”

    As the industry gears up for a dynamic year ahead, ExerciseNZ remains committed to supporting exercise professionals, facility operators, and the wider exercise community in navigating growth opportunities while maintaining high service standards and accessibility for all New Zealanders.

    MIL OSI New Zealand News

  • MIL-OSI New Zealand: Economy – OCR 3.75% – OCR reduced further as inflation abates – Reserve Bank of NZ

    Source: Reserve Bank of New Zealand

    19 February 2025 – Annual consumer price inflation remains near the midpoint of the Monetary Policy Committee’s 1 to 3 percent target band. Firms’ inflation expectations are at target and core inflation continues to fall towards the target midpoint. The economic outlook remains consistent with inflation remaining in the band over the medium term, giving the Committee confidence to continue lowering the OCR.

    Economic activity in New Zealand remains subdued. With spare productive capacity, domestic inflation pressures continue to ease. Price and wage setting behaviours are adapting to a low-inflation environment. The price of imports has fallen, also contributing to lower headline inflation.

    Economic growth is expected to recover during 2025. Lower interest rates will encourage spending, although elevated global economic uncertainty is expected to weigh on business investment decisions. Higher prices for some of our key commodities and a lower exchange rate will increase export revenues. Employment growth is expected to pick up in the second half of the year as the domestic economy recovers.

    Global economic growth is expected to remain subdued in the near term. Geopolitics, including uncertainty about trade barriers, is likely to weaken global growth. Global economic activity is also likely to remain fragile over the medium term given increasing geoeconomic fragmentation.

    Consumer price inflation in New Zealand is expected to be volatile in the near term, due to a lower exchange rate and higher petrol prices. The net effect of future changes in trade policy on inflation in New Zealand is currently unclear. Nevertheless, the Committee is well placed to maintain price stability over the medium term. Having consumer price inflation close to the middle of its target band puts the Committee in the best position to respond to future inflationary shocks.

    The Monetary Policy Committee today agreed to lower the Official Cash Rate by 50 basis points to 3.75 percent. If economic conditions continue to evolve as projected, the Committee has scope to lower the OCR further through 2025.

    Read the full statement and Record of meeting: https://govt.us20.list-manage.com/track/click?u=bd316aa7ee4f5679c56377819&id=06d3058d74&e=f3c68946f8

    MIL OSI New Zealand News

  • MIL-OSI Economics: Spam and phishing in 2024

    Source: Securelist – Kaspersky

    Headline: Spam and phishing in 2024

    The year in figures

    • 27% of all emails sent worldwide and 48.57% of all emails sent in the Russian web segment were spam
    • 18% of all spam emails were sent from Russia
    • Kaspersky Mail Anti-Virus blocked 125,521,794 malicious email attachments
    • Our Anti-Phishing system thwarted 893,216,170 attempts to follow phishing links
    • Chat Protection in Kaspersky mobile solutions prevented more than 60,000 redirects via phishing links from Telegram

    Phishing and scams in 2024

    Phishing for travelers

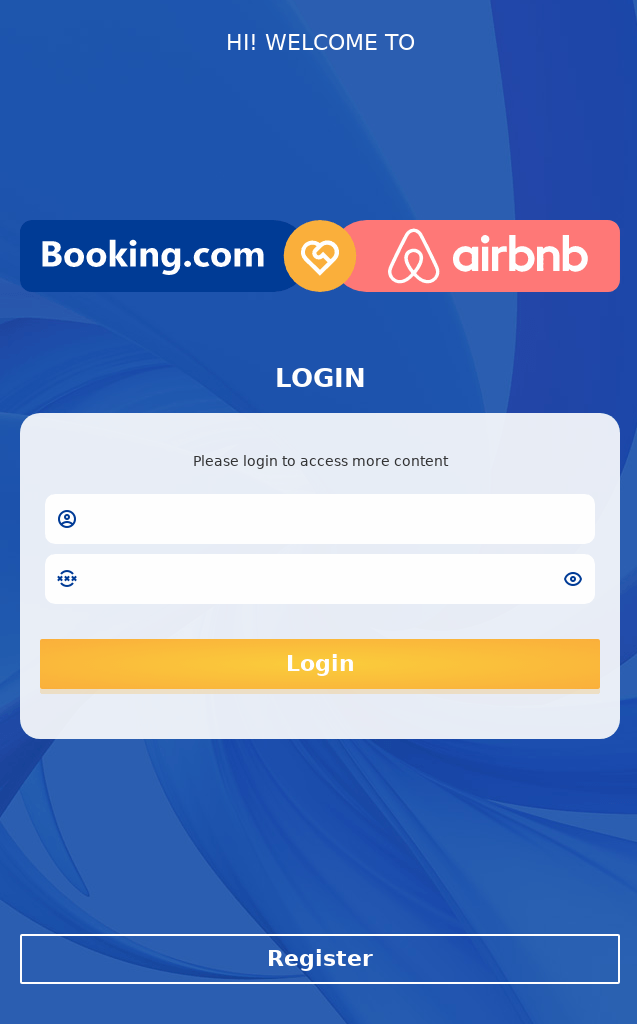
    In 2024, cybercriminals targeted travel enthusiasts using fake hotel and airline booking websites. In one simple scheme, a fraudulent site asked users to enter their login credentials to complete their booking — these credentials ended up in criminal hands. Sometimes, the fake login form appeared under multiple brand names at once (for example, both Booking and Airbnb).

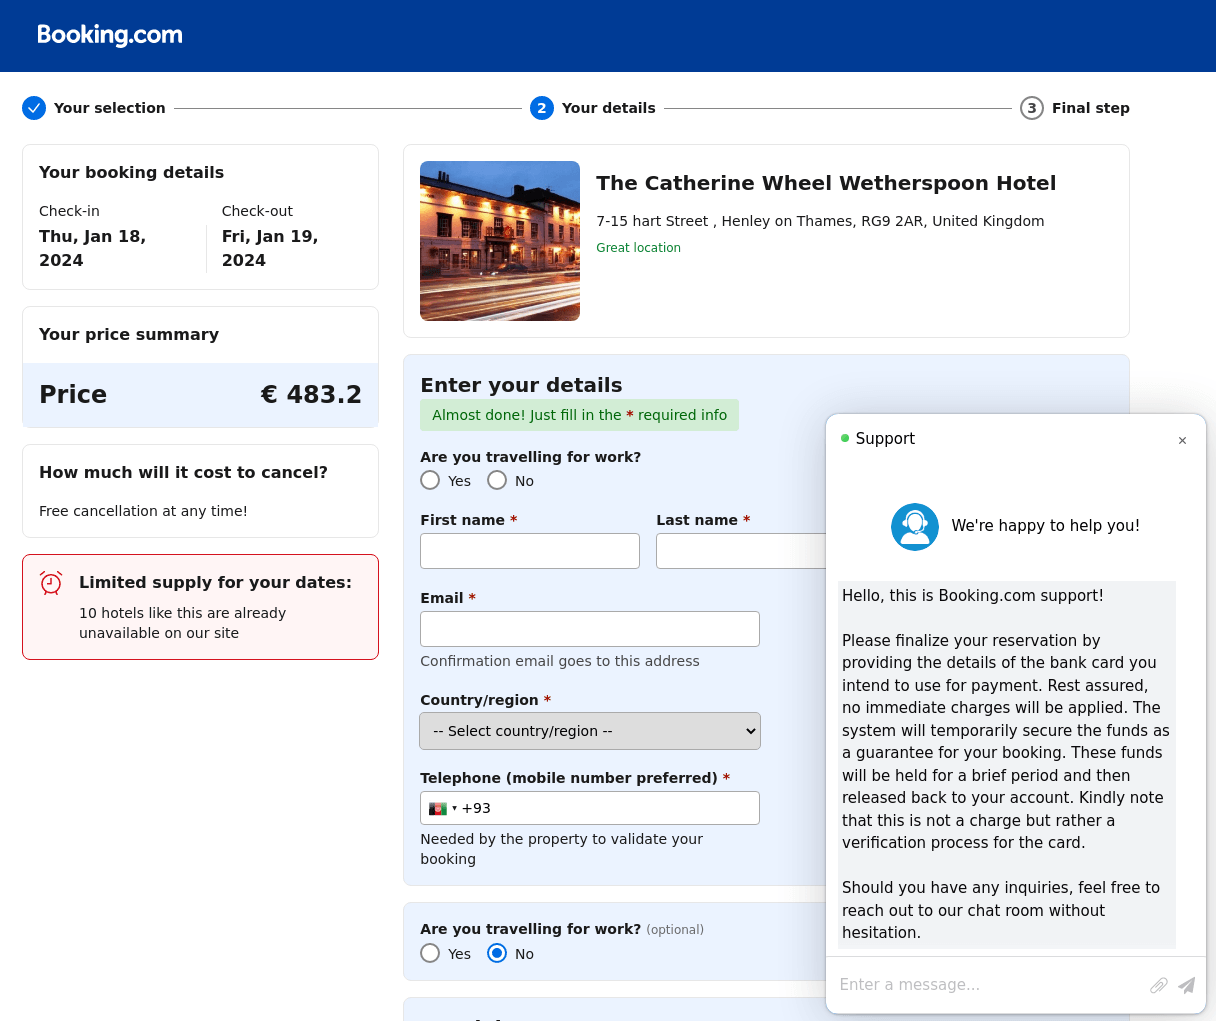
    Another scheme involved a more sophisticated fake site, where users could even select the purpose of their trip (business or leisure). To complete the booking, the scammers requested bank card details, claiming that a certain sum would be temporarily blocked on the account to verify the card’s authenticity. Legitimate booking services regularly request payment details, so the victim may not suspect anything in this case. To rush users into entering their data carelessly, on the phishing page, the scammers displayed warnings about dwindling accommodation availability and an imminent payment deadline for the booking. If the victim entered their data, the funds were not frozen but went straight into the criminals’ pockets.

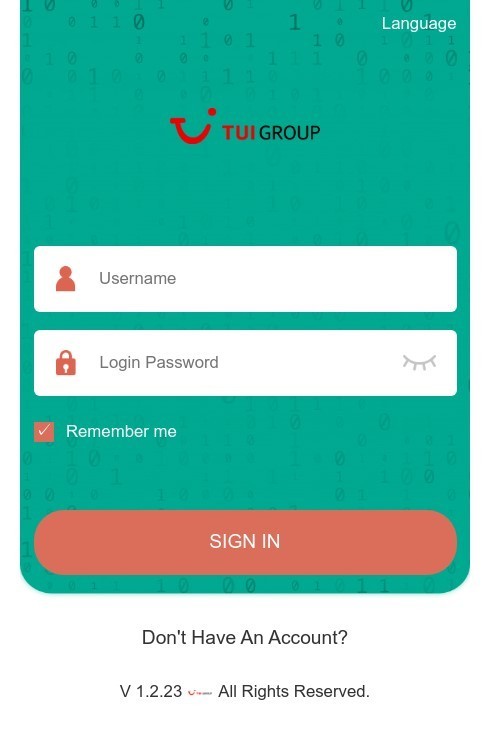
    Cyberthreats in the travel sector affected not only tourists but also employees of travel agencies. By gaining access to a corporate account, criminals could conduct financial transactions on behalf of employees and gain access to large customer databases.

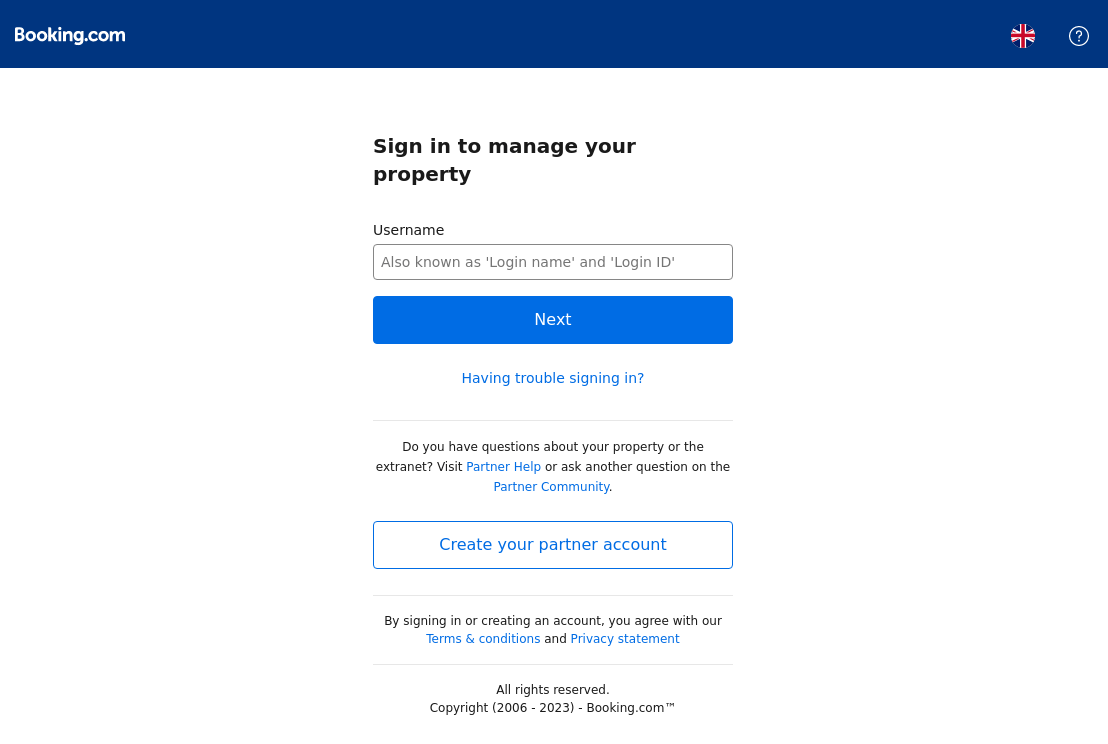
    Fake accommodation sites often sent messages to property owners, telling them to log in to “manage their property.” This scheme targeted people renting out their homes through online booking platforms.

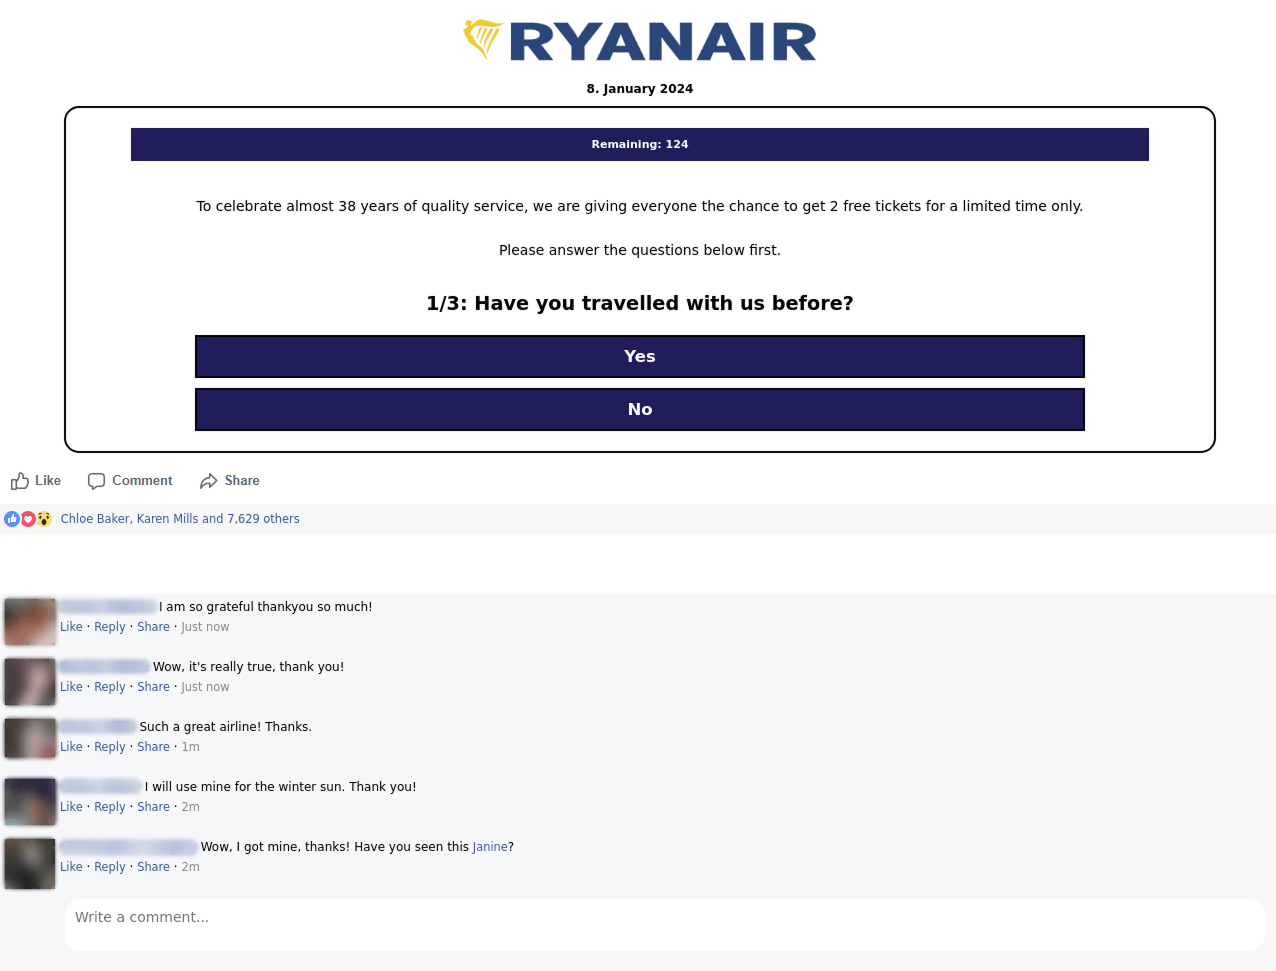
    Other scam pages featured surveys, offering respondents gifts or prize draws for participating. In this case, victims risked both their credentials and their money. Such fake giveaways are a classic scam tactic. They are often timed to coincide with a significant date for the travel industry or a specific company. For example, the screenshot below shows an offer to take part in a giveaway of airline tickets to celebrate Ryanair’s birthday.

    After completing the survey, users may be asked to share the offer with a certain number of contacts, and then pay a small fee to receive the expensive gift. Of course, these prizes are non-existent.

    Trapped in social networks

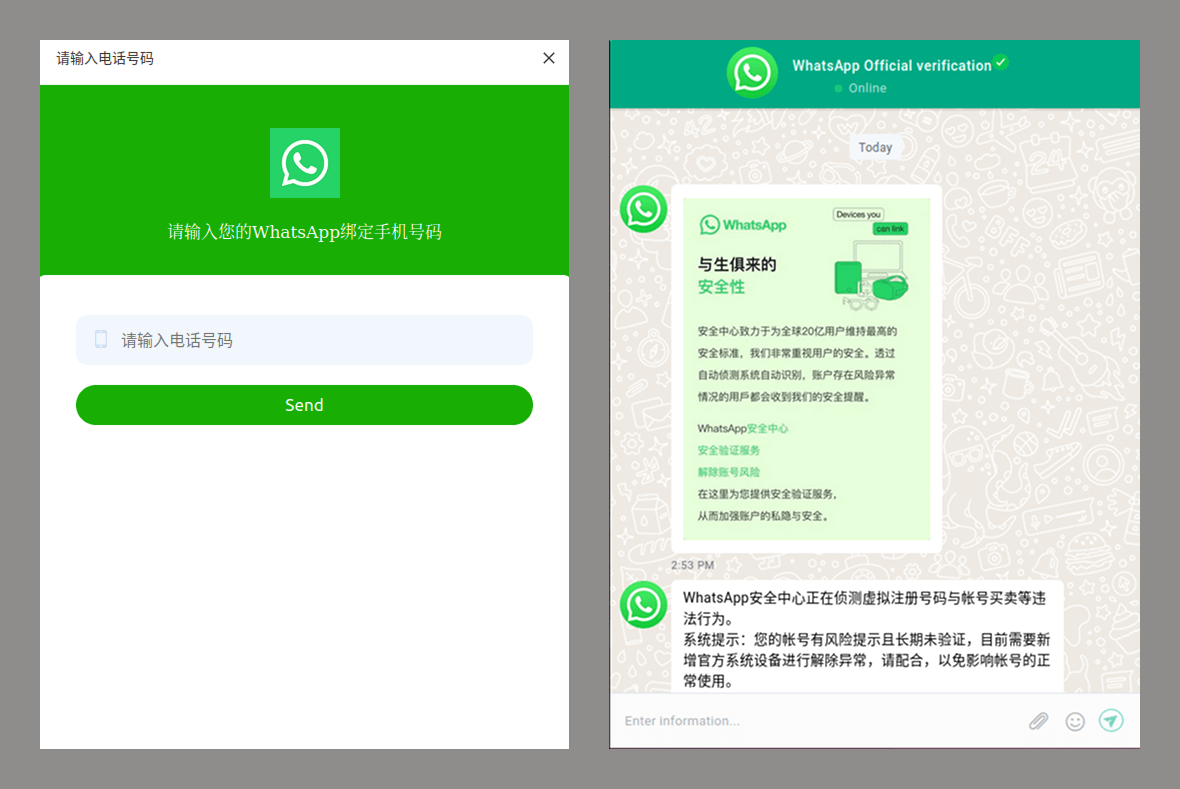
    To steal credentials for social media and messenger accounts, scammers used another classic technique: asking users to verify themselves. In one scheme, the victim was redirected to a website that completely replicated WhatsApp’s design. The user entered their phone number and login code, handing their credentials straight over to the cybercriminals.

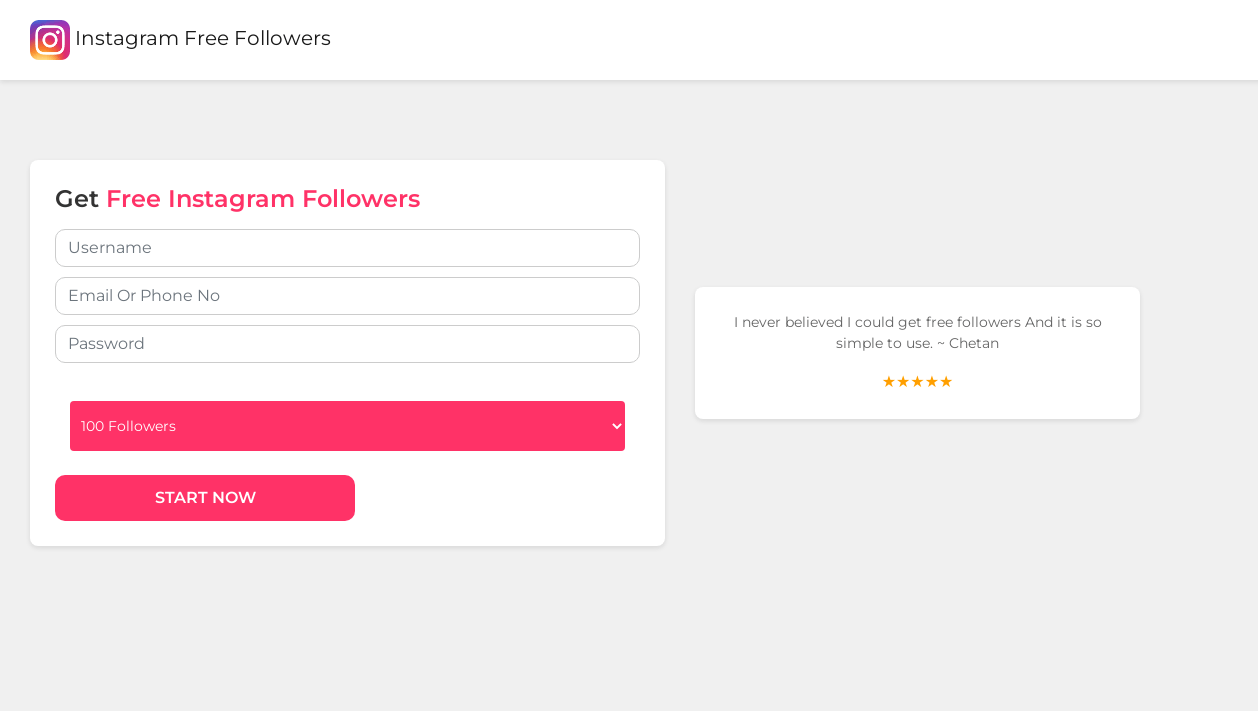
    Beyond verification scams, fraudsters also lured victims with attractive offers. For example, in the screenshot below, the victim is promised free Instagram followers.

    Some cybercriminals also used the promise of adult content to lure victims into entering their credentials in a fake authorization form.

    Other scammers took advantage of Facebook and Instagram being owned by the same company. On a fraudulent page, they claimed to offer a service that allowed users to find Instagram profiles by entering their Facebook login and password.

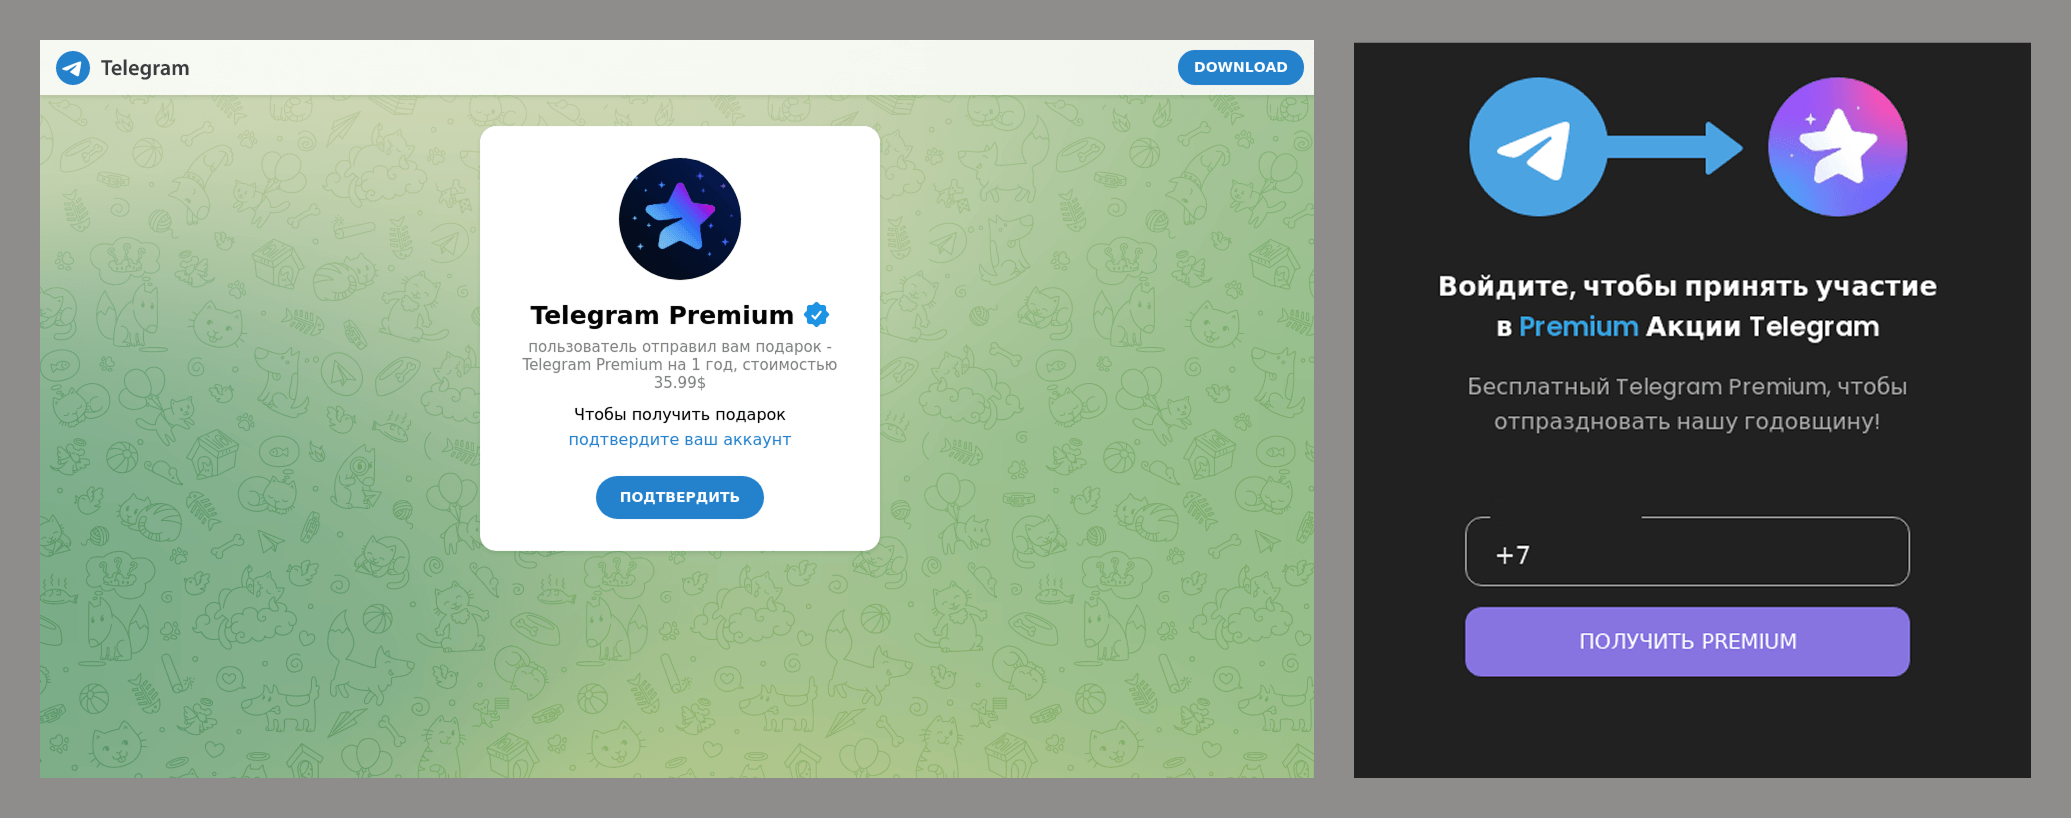
    Some scams offered users a surprise “gift” — a free Telegram Premium subscription. To enable the messenger’s premium features, the victim only had to enter their phone number and a one-time code on a fraudulent website.

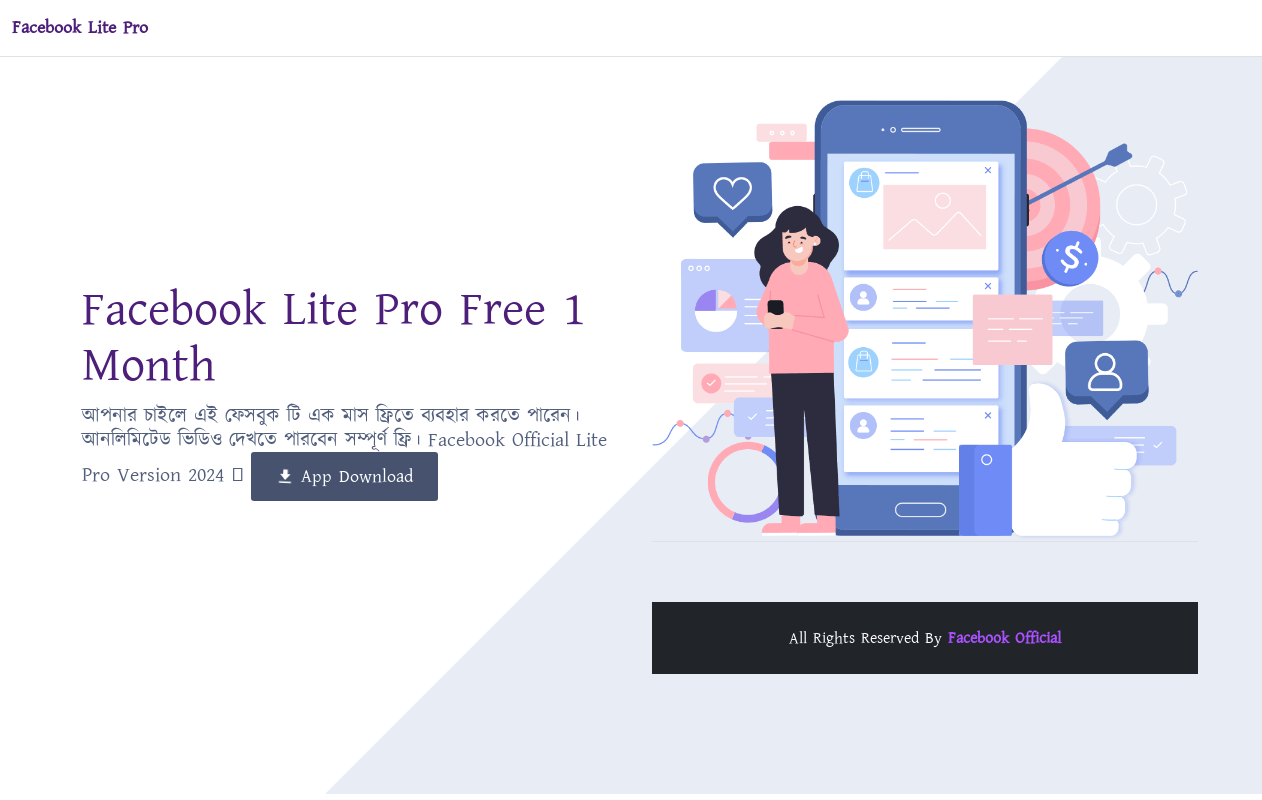
    Some fake social media and messenger pages were designed not to steal login credentials but to install malware on victims’ devices. Taking advantage of the popularity of Facebook Lite for Android, scammers offered users a “more advanced official version”, claiming it had extra features missing in the original app. However, instead of an upgraded app, users downloaded malware onto their devices.

    Similarly, installing a supposedly free Telegram client with an activated Premium subscription often led to downloading malware.

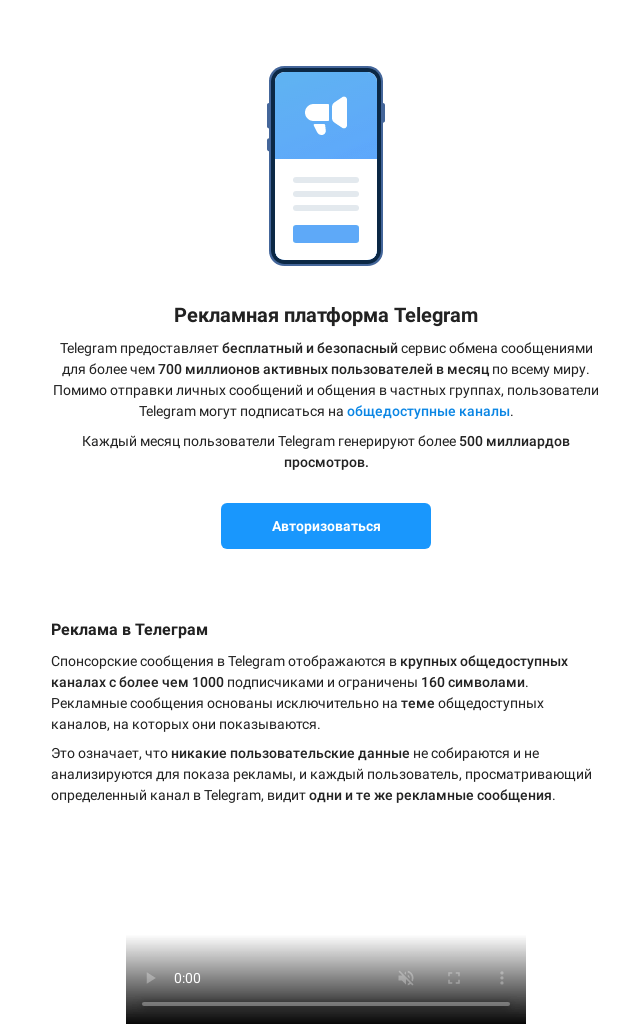
    Social media business services were increasingly used as a pretext for credential theft, as they play a key role in developing and promoting businesses and are directly linked to financial operations. Cybercriminals tricked Telegram channel owners into logging in to a phishing platform imitating the official Telegram Ads tool, thereby stealing their Telegram credentials. To make the scam more convincing, the attackers detailed how Telegram advertising works and promised millions of ad views per month.

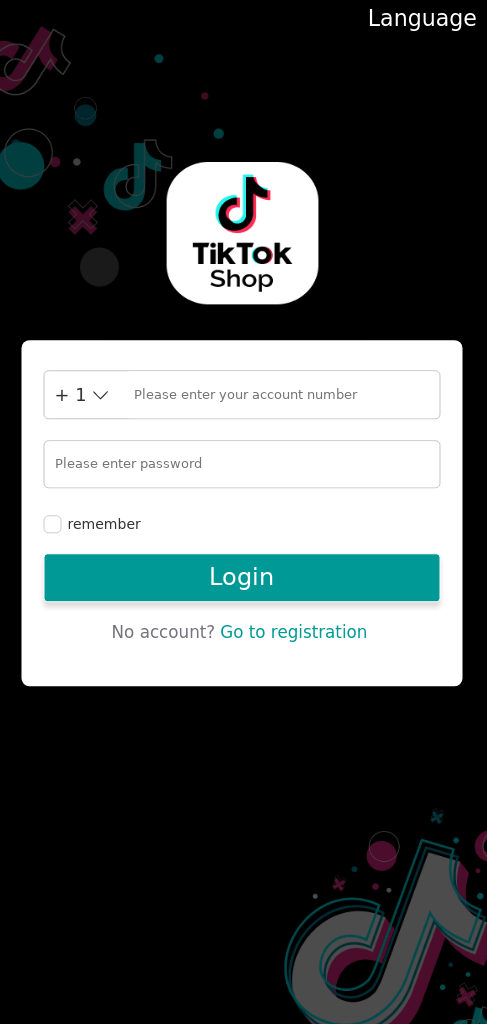
    TikTok users have also been targeted. TikTok Shop allows sellers to list curated products—items featured in videos—for potential buyers to find and purchase. Scammers created fake TikTok Shop pages to steal seller credentials, potentially leading to both reputational and financial damage.

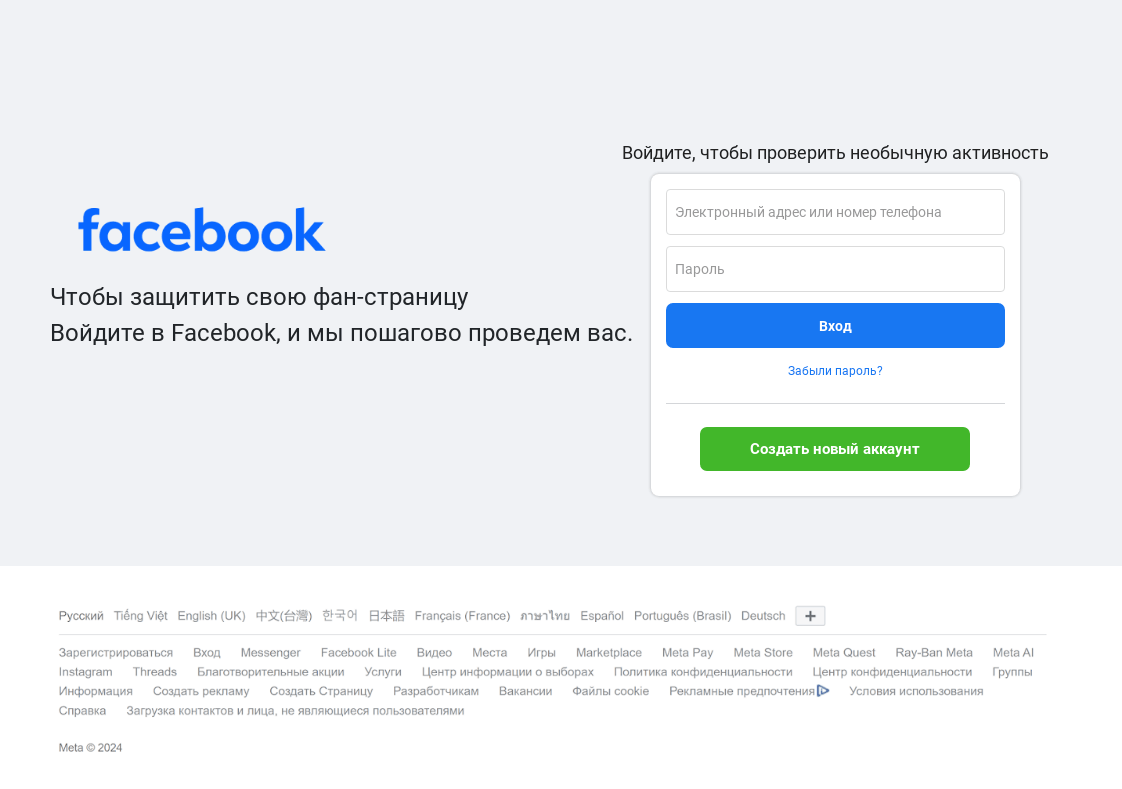
    In another case, fraudsters informed Facebook fan page owners of unusual activity in their accounts. Potential victims were prompted to check their profile by entering their login credentials into a phishing form.

    Cryptocurrency: don’t mistake scams for real deals

    One of last year’s most sensational stories was the cryptocurrency game Hamster Kombat. This clicker game, simulating the creation of a crypto exchange in a gamified format, quickly attracted a massive audience. Players eagerly awaited the moment when the in-game coins could be exchanged for real virtual currency. But while the official listing was delayed, the fraudulent schemes wasted no time.

    Fraudsters claimed to offer cash-out services for in-game coins by converting them into rubles. To withdraw money, criminals claimed, users just had to log in through a fake Telegram page.

    The growing anticipation for the new cryptocurrency’s market launch was frequently exploited by cybercriminals to steal seed phrases from crypto wallets. Scammers announced an early token sale, requiring users to log in through a fake page to participate. Of course, there was no mention of such promotions on official resources.

    The popularity of Hamster Kombat was also abused in scam schemes. For example, users were offered access to a crypto wallet supposedly containing a significant sum in virtual coins. To claim it, the unsuspecting victims had to share information about the “opportunity” with a certain number of contacts in messaging apps. Having made their potential victim an accomplice in spreading false information, the scammers demanded a small commission for the withdrawal and disappeared with the stolen money.

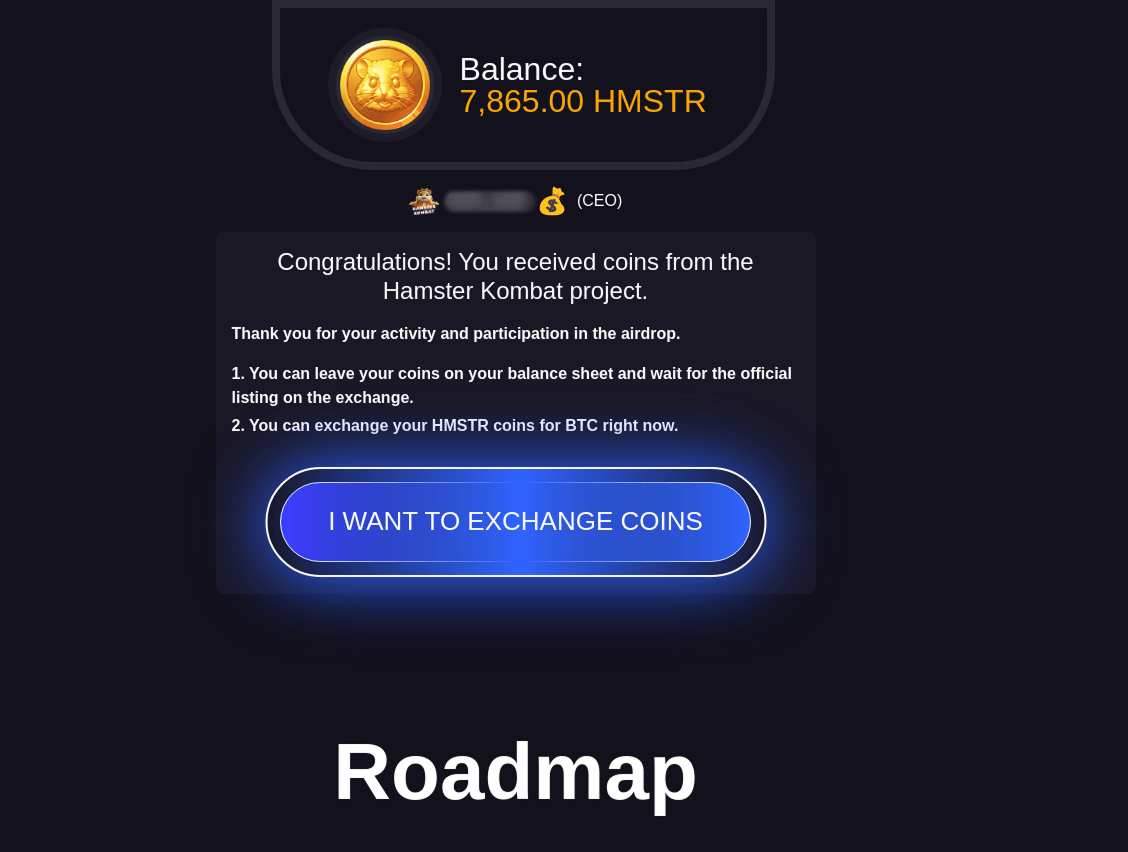
    A more elaborate scam also aimed to trick users into paying a “commission”, but with a slightly different approach. First, visitors to the page were asked to register to learn about some new activity related to Hamster Kombat.

    Once registered, they were suddenly informed of having won a large amount of the HMSTR cryptocurrency supposedly as part of an experiment conducted on the platform. Exploiting uncertainty around the token’s listing, scammers urged victims to bypass the official trading launch and exchange their in-game currency for Bitcoin immediately.

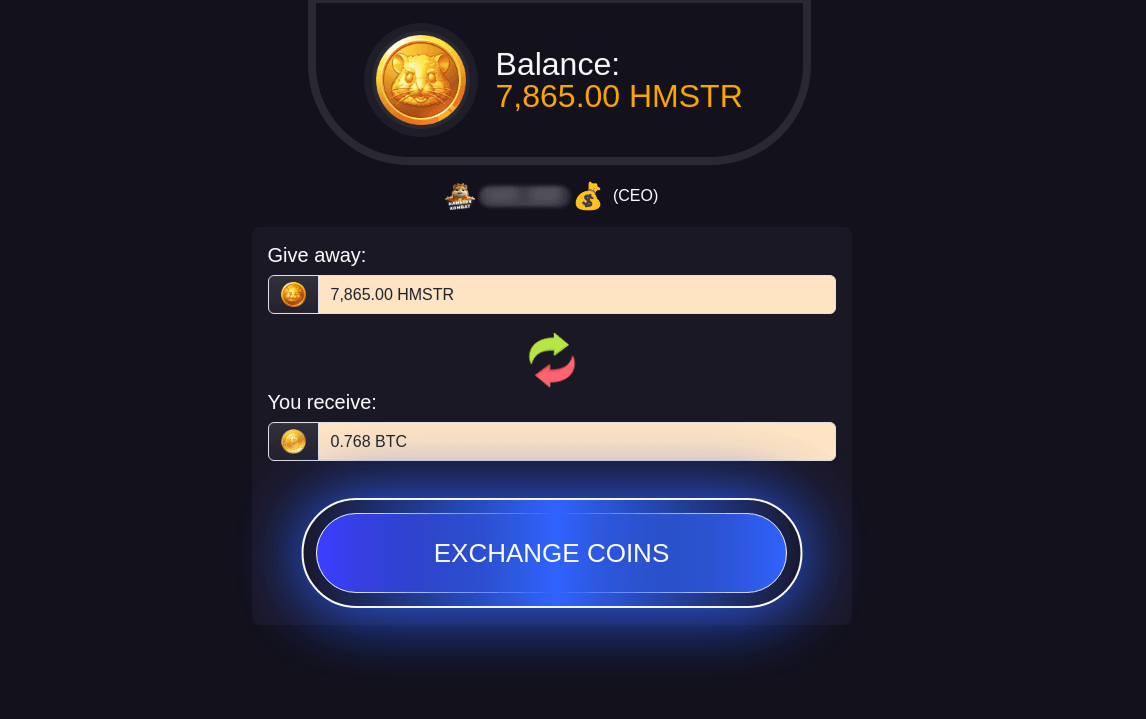
    To make it more convincing, the page displayed an exchange rate at which the “prize” would be converted.

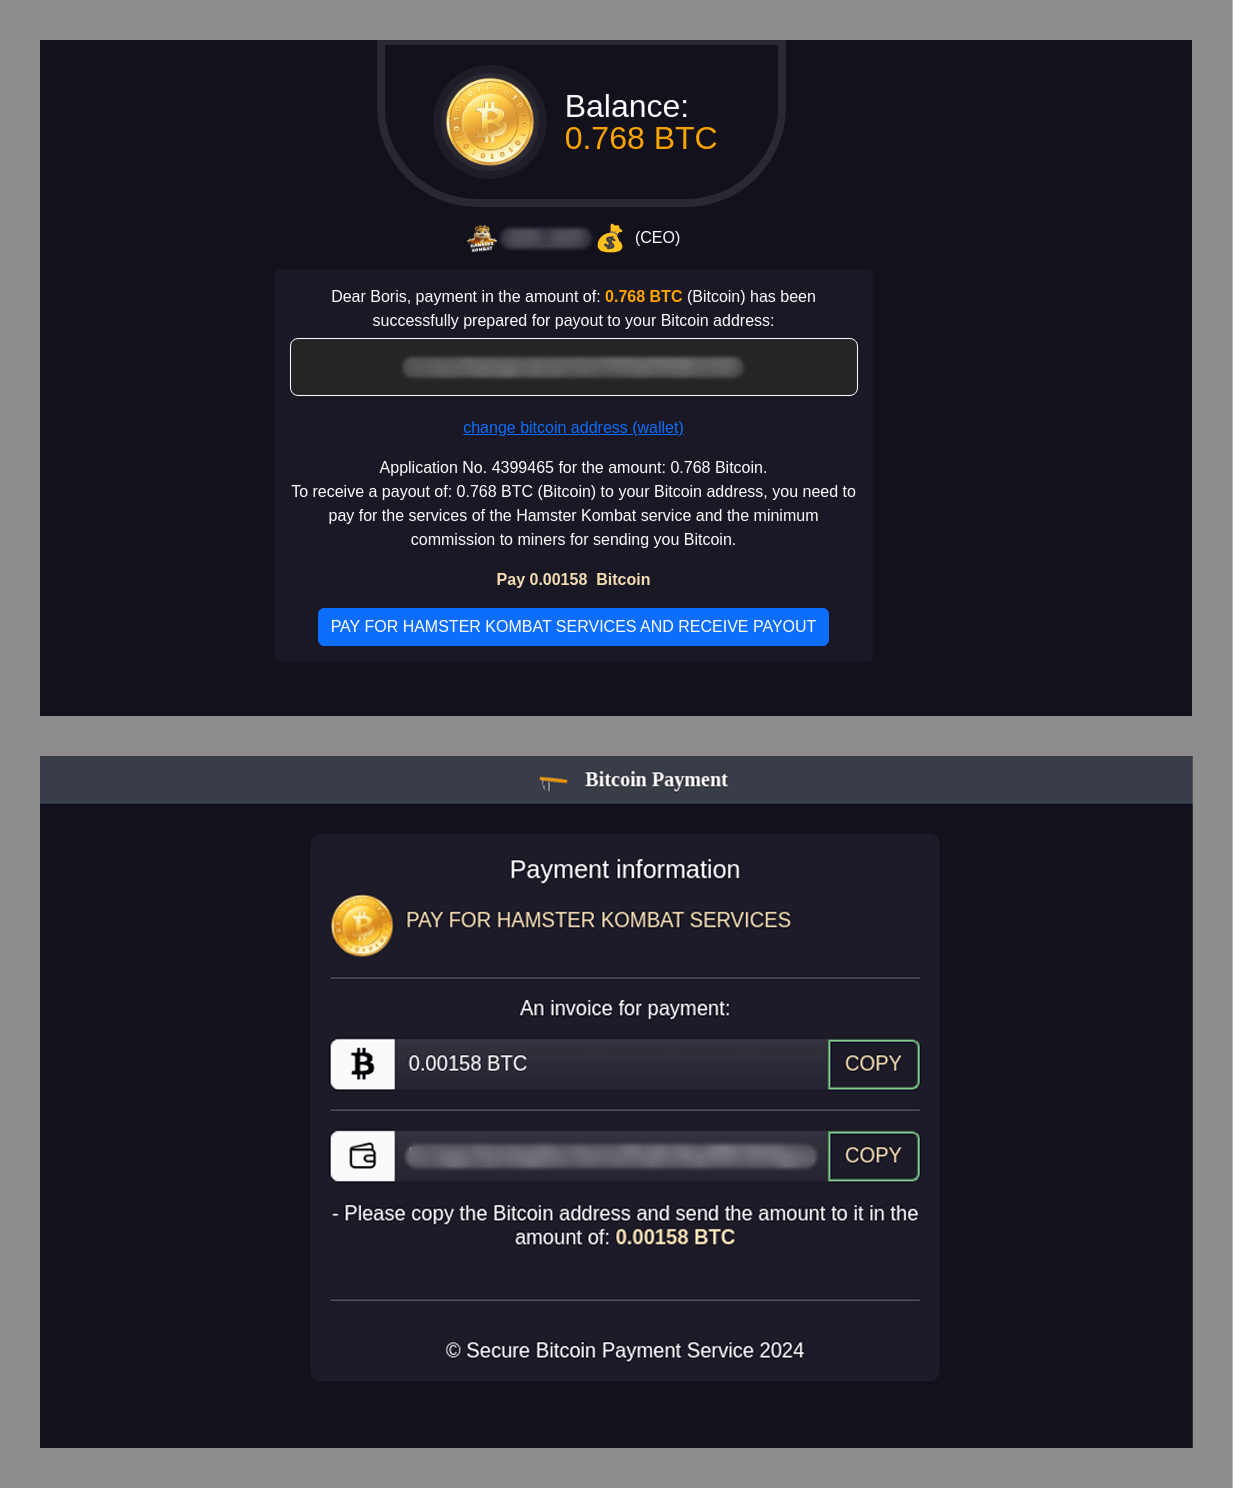
    However, after clicking the “Exchange coins” button, users were prompted to pay a commission for the service.

    Everyone who paid this fee lost their money and received no Bitcoin.

    Phishing attacks also targeted TON wallet users. In this case, scammers lured victims with promises of bonuses, requiring them to link their crypto wallets on fraudulent websites.

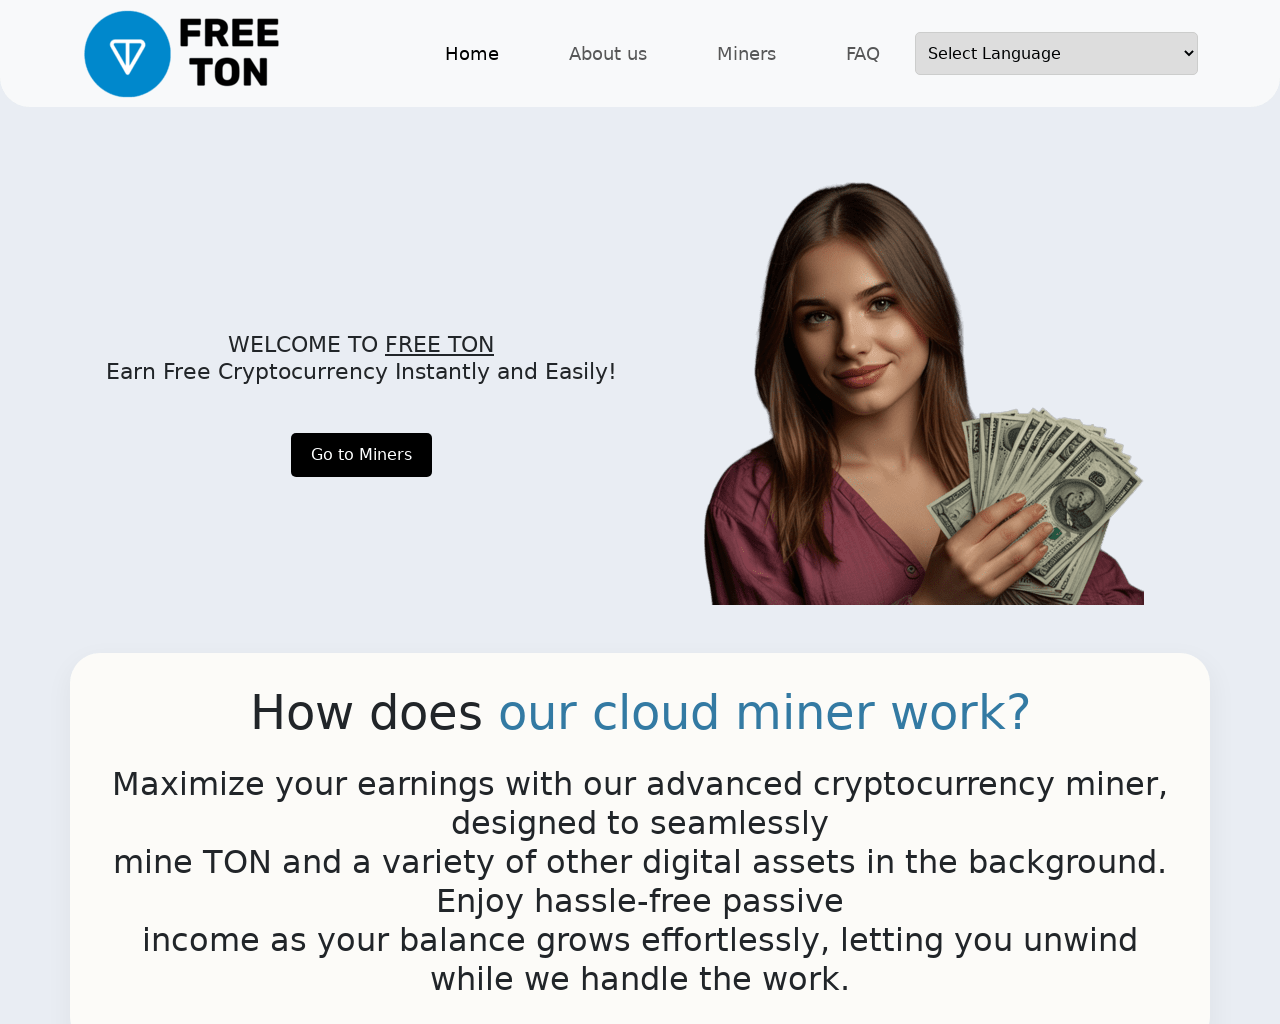
    TON cryptocurrency was also used as bait in scam schemes. In a classic scenario, users were promised a quick way to earn digital currency. Fraudsters advertised a cloud mining service that allegedly generated high profits without any effort. After registering, unsuspecting users could monitor their “earnings” but had to pay a commission in cryptocurrency to withdraw funds.

    Another “profitable” crypto scam resembled a Ponzi scheme: victims were required to recruit at least five new participants into the program—without receiving any money, of course. The scam site mimicked an online earning platform.

    Visitors were instructed to install Telegram and use an unofficial bot to activate a crypto wallet where profits would supposedly be deposited.

    According to the instructions, users then had to buy Toncoin and register in the program through a referral link from another participant. The scam worked by enticing people to make a small investment in the hopes of making big profits—the victims used their own funds to purchase the cryptocurrency for registration. But as with any pyramid scheme, only those at the top profited, while everyone else was left with nothing but empty dreams.

    All or nothing: multipurpose phishing

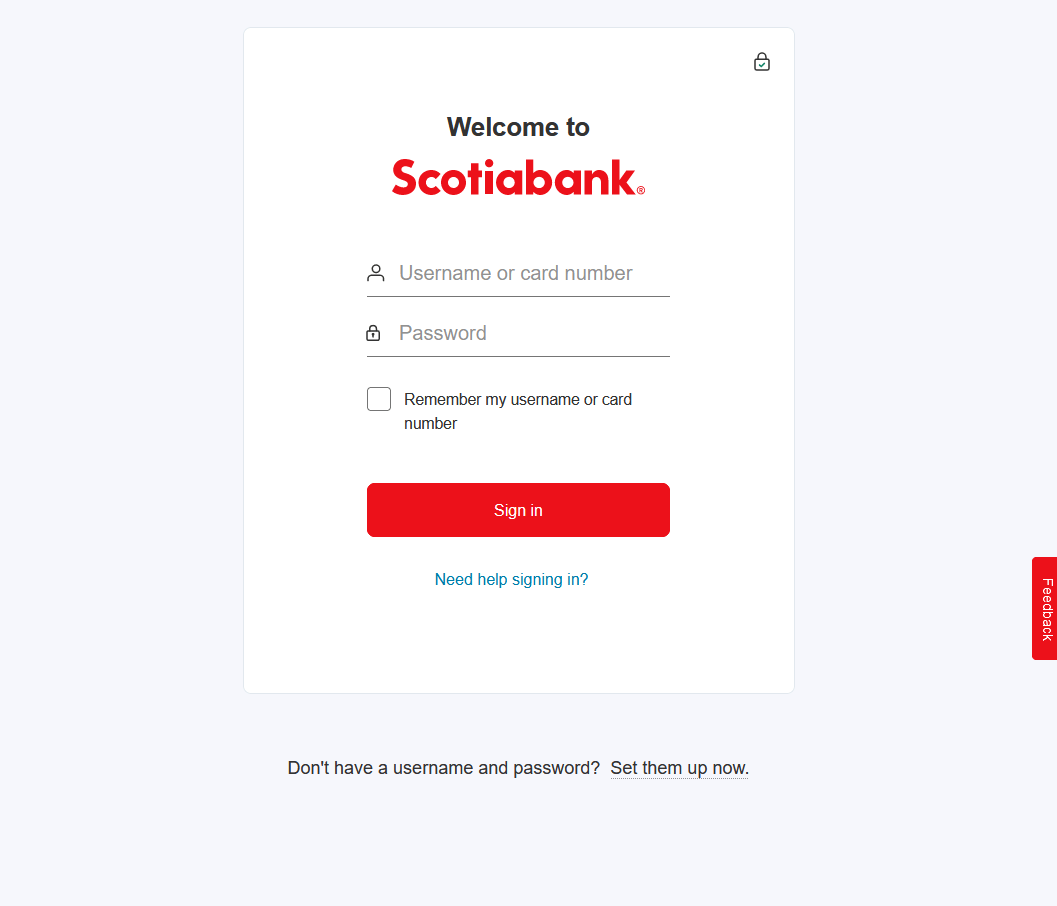
    Victims of phishing frequently included bank clients and users of government service portals. In such schemes, users first received a notification that they needed to update their account credentials. Cybercriminals used various communication channels to contact their victims: email, text messages, and chats in messaging apps. The victims were then led to fake sites where they were asked to provide their personal data. First, they entered their personal login credentials on the organization’s website.

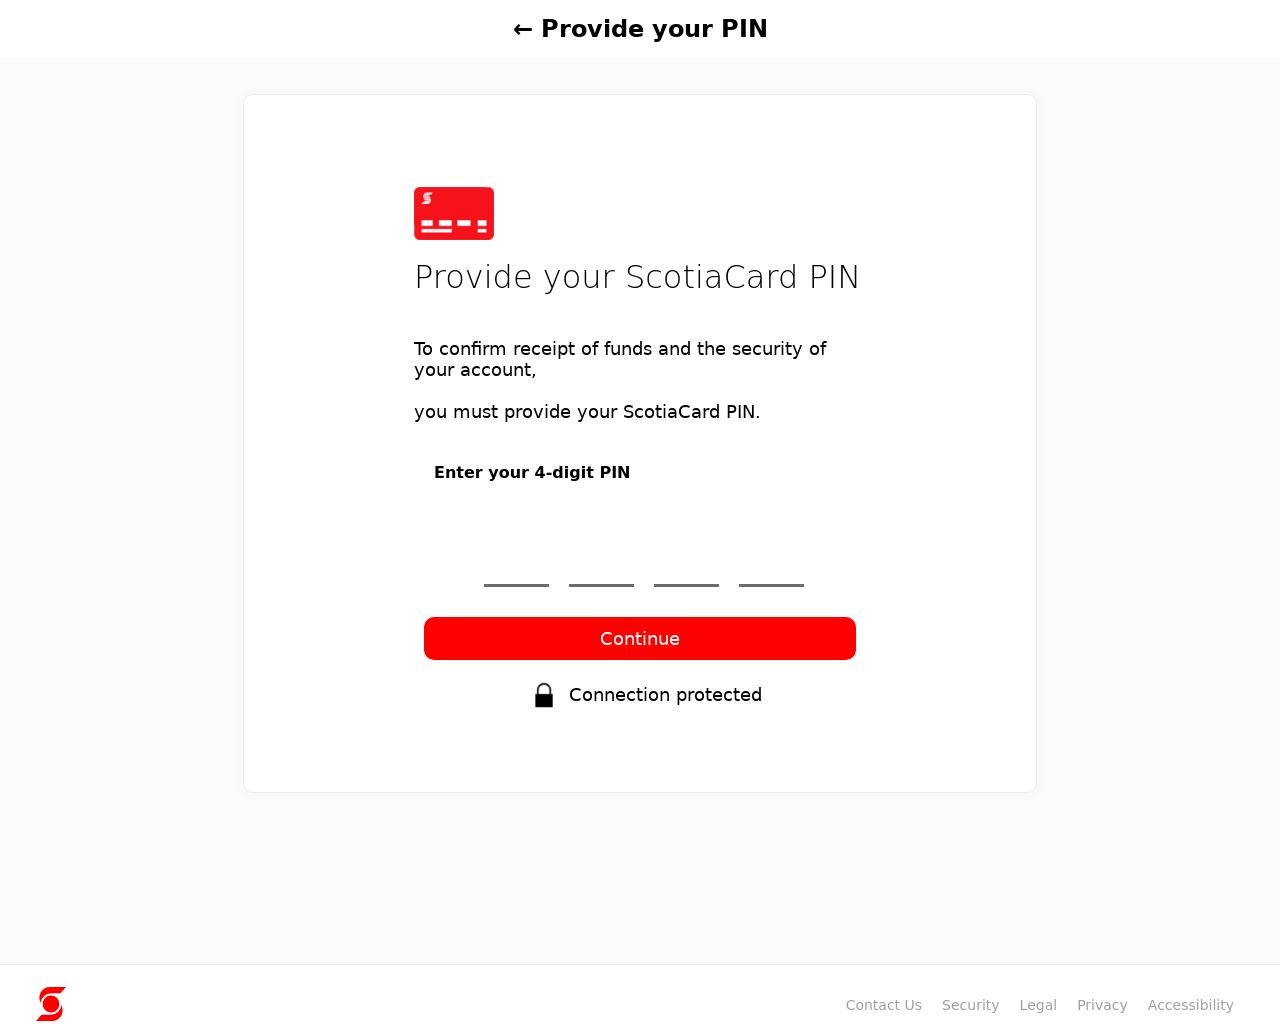
    Next, they were prompted to provide their email account credentials. The scammers also attempted to collect identity document details and other data, including the bank card PIN code.

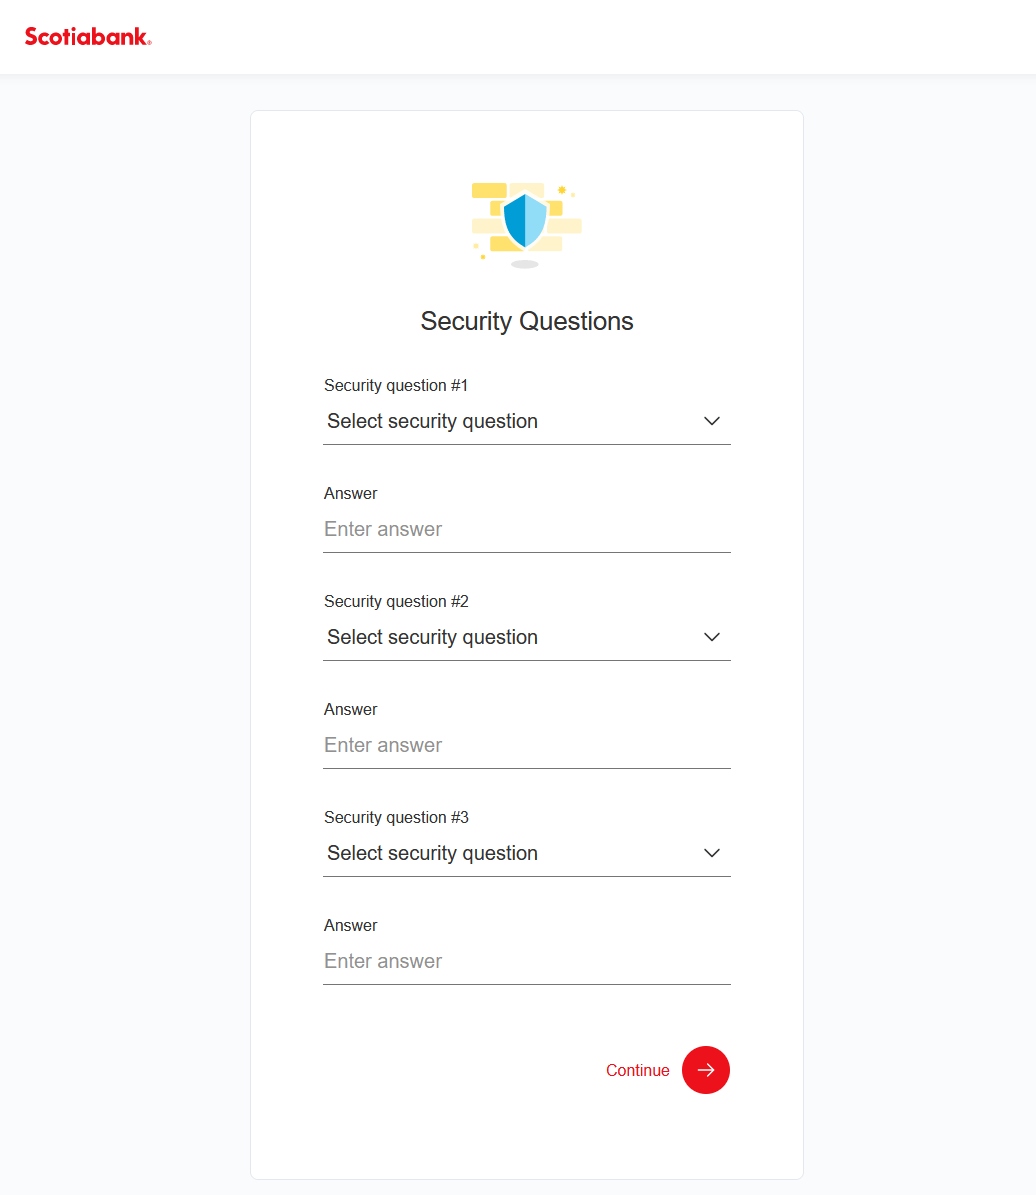
    Additionally, these phishing forms requested answers to security questions commonly used for additional verification in banking transactions.

    This way, the cybercriminals gained full access to the victim’s account. Even the PIN code could be useful for the scammers in gaining access to the account. Security questions served as an extra safeguard for fraudsters in case the bank’s security service detected suspicious activity.

    False idols

    Phishing schemes also exploited the images of real people. For example, users browsing YouTube could stumble upon ad videos of celebrities announcing giveaways for their fans. Clicking the link in such a video led users to a page containing a post supposedly from the celebrity’s social media account, explaining how to claim the prize. However, when attempting to collect the “winnings”, visitors were asked to pay a small commission—insignificant compared to the value of the “gift.” Needless to say, those who paid the fee lost their money. The prize never existed, and the video was nothing more than a deepfake.

    Spam in 2024

    Scams

    Token giveaway scam

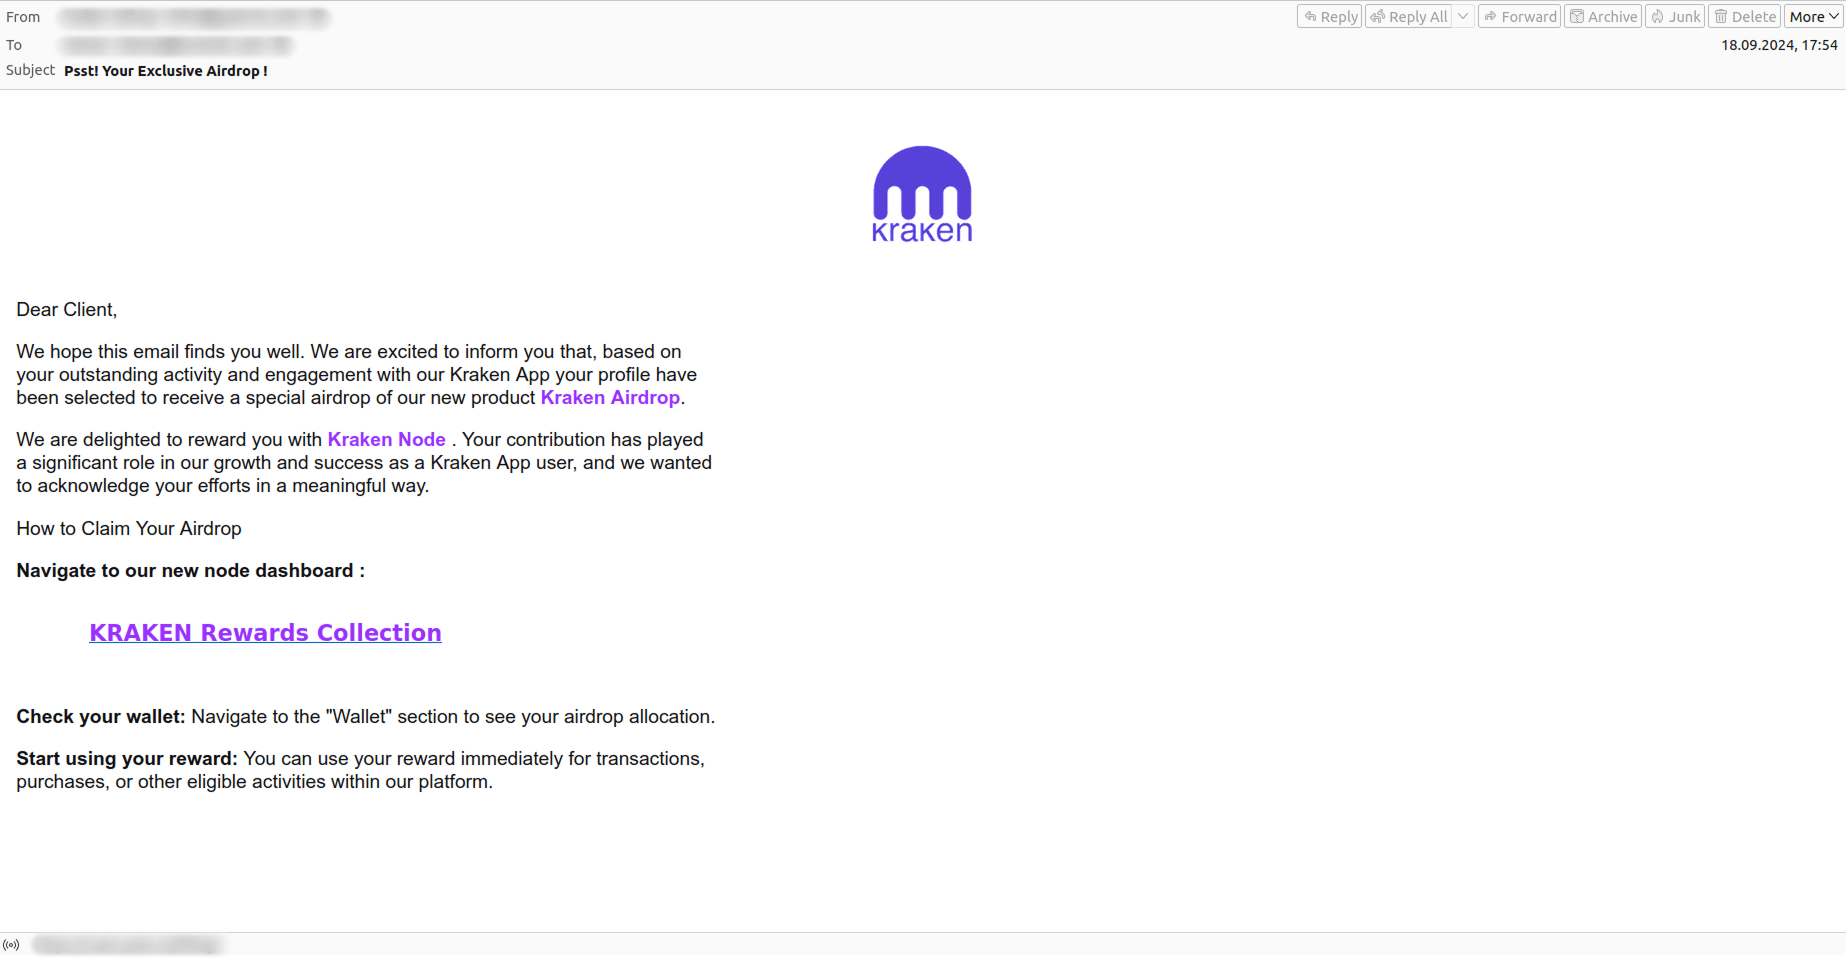
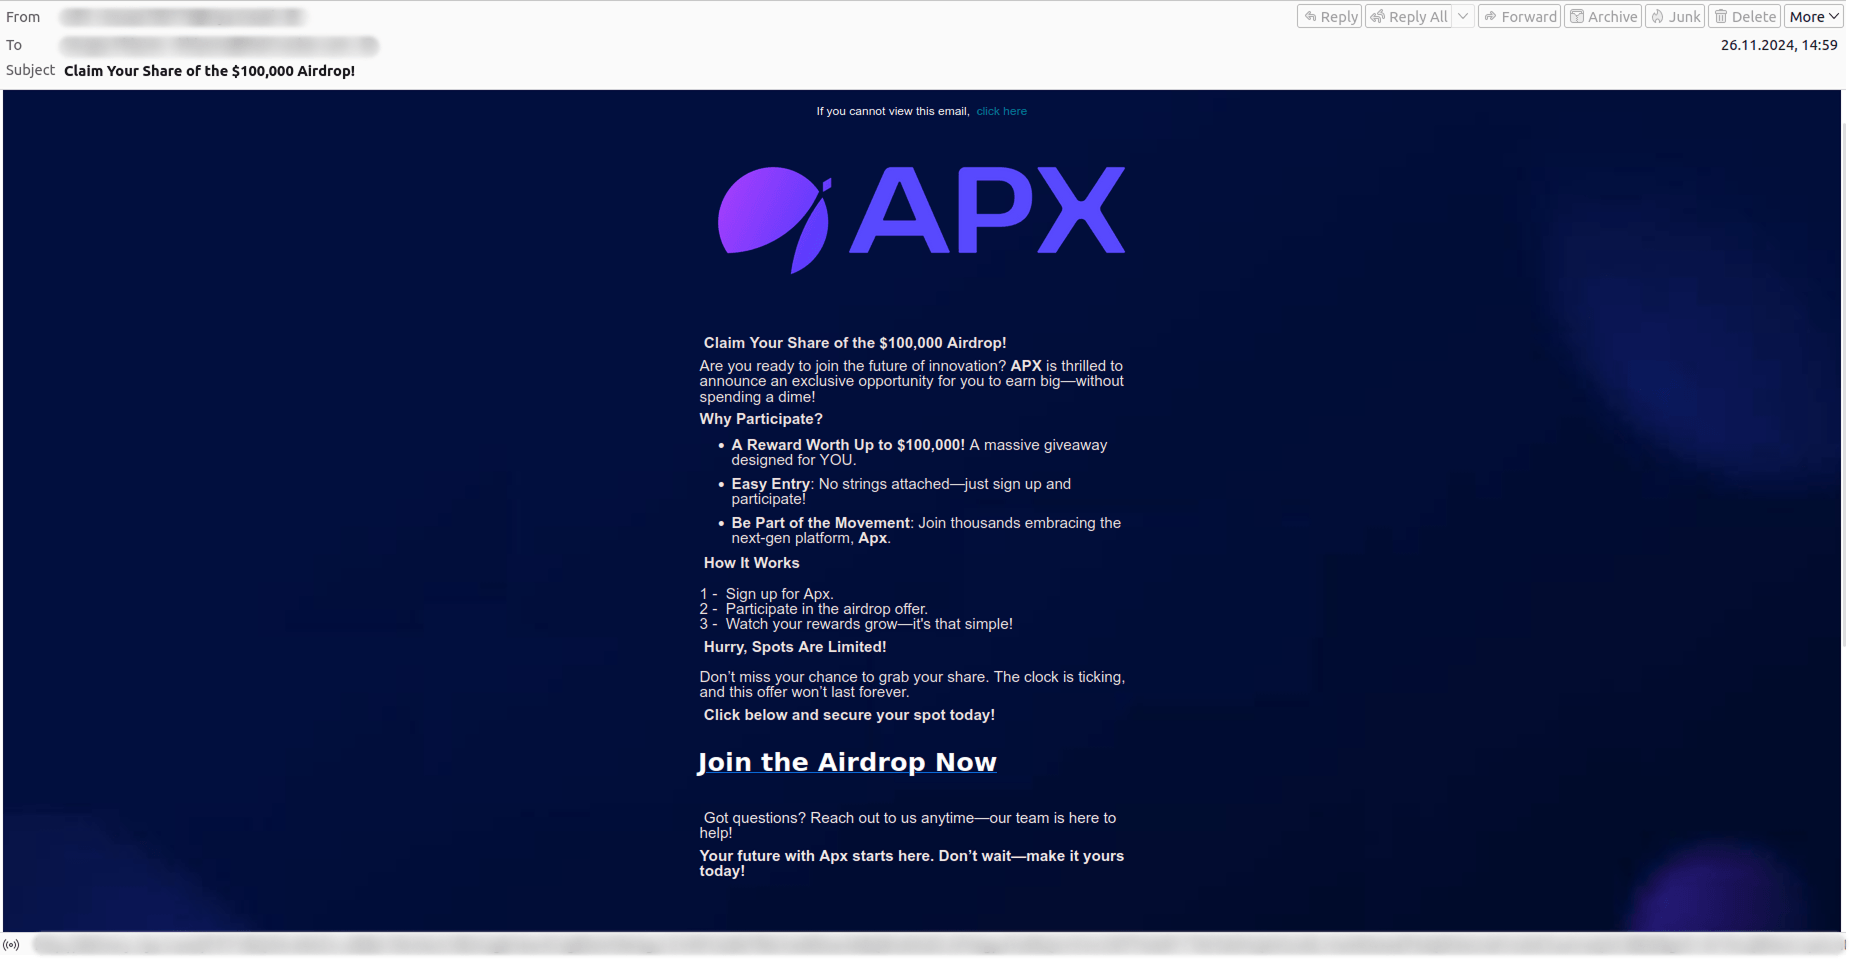
    Throughout the year, we frequently encountered emails announcing fake cryptocurrency airdrops, allegedly from teams of well-known crypto projects. The recipients, referred to as the platform’s “most valuable users,” were invited to participate in an “exclusive” event as a thank you for their loyalty and exceptional engagement.

    New users unfamiliar with cryptocurrency were lured in with a unique opportunity to take part in the token giveaway and win a large sum—all they had to do was register on the platform, which was, of course, fake.

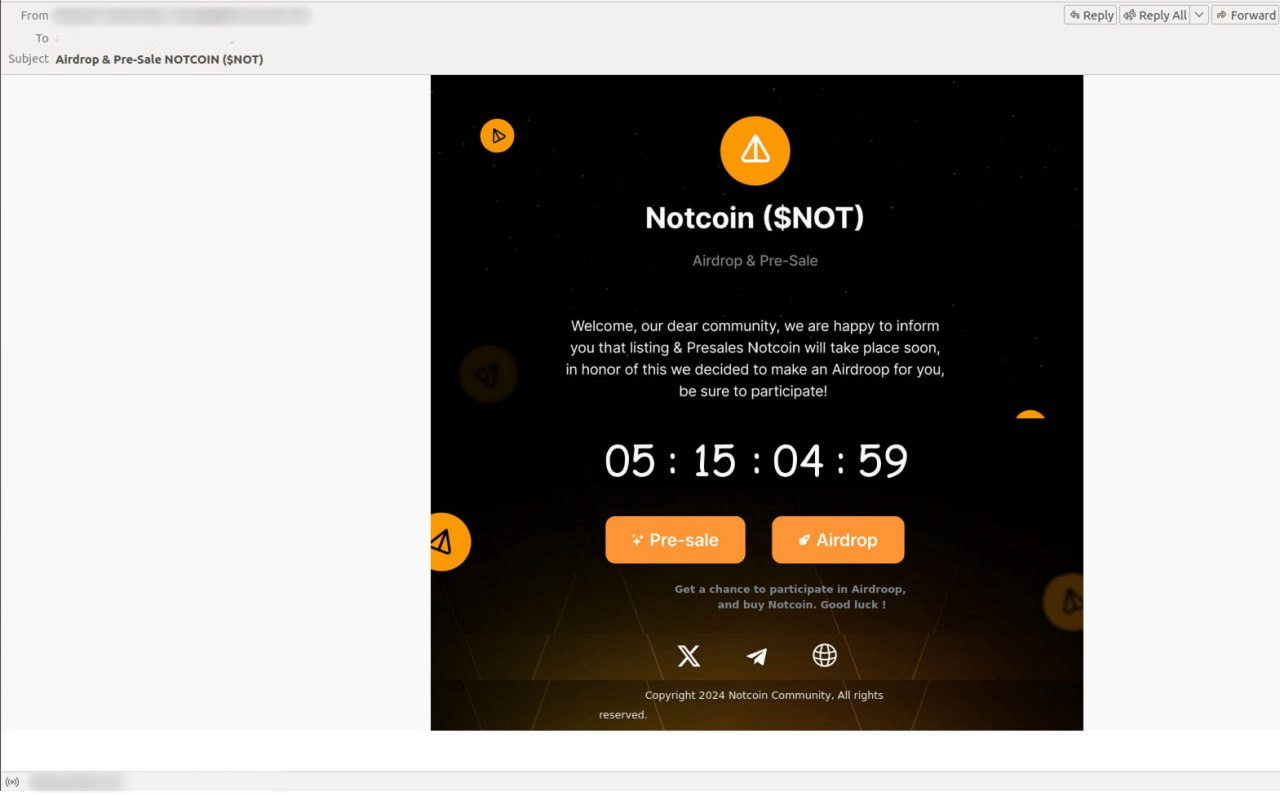
    Scammers in 2024 closely monitored cryptocurrency market news. For example, in the spring, ahead of Notcoin’s upcoming listing, scam messages appeared featuring countdown timers, urging potential victims to participate in an airdrop allegedly arranged just for them.

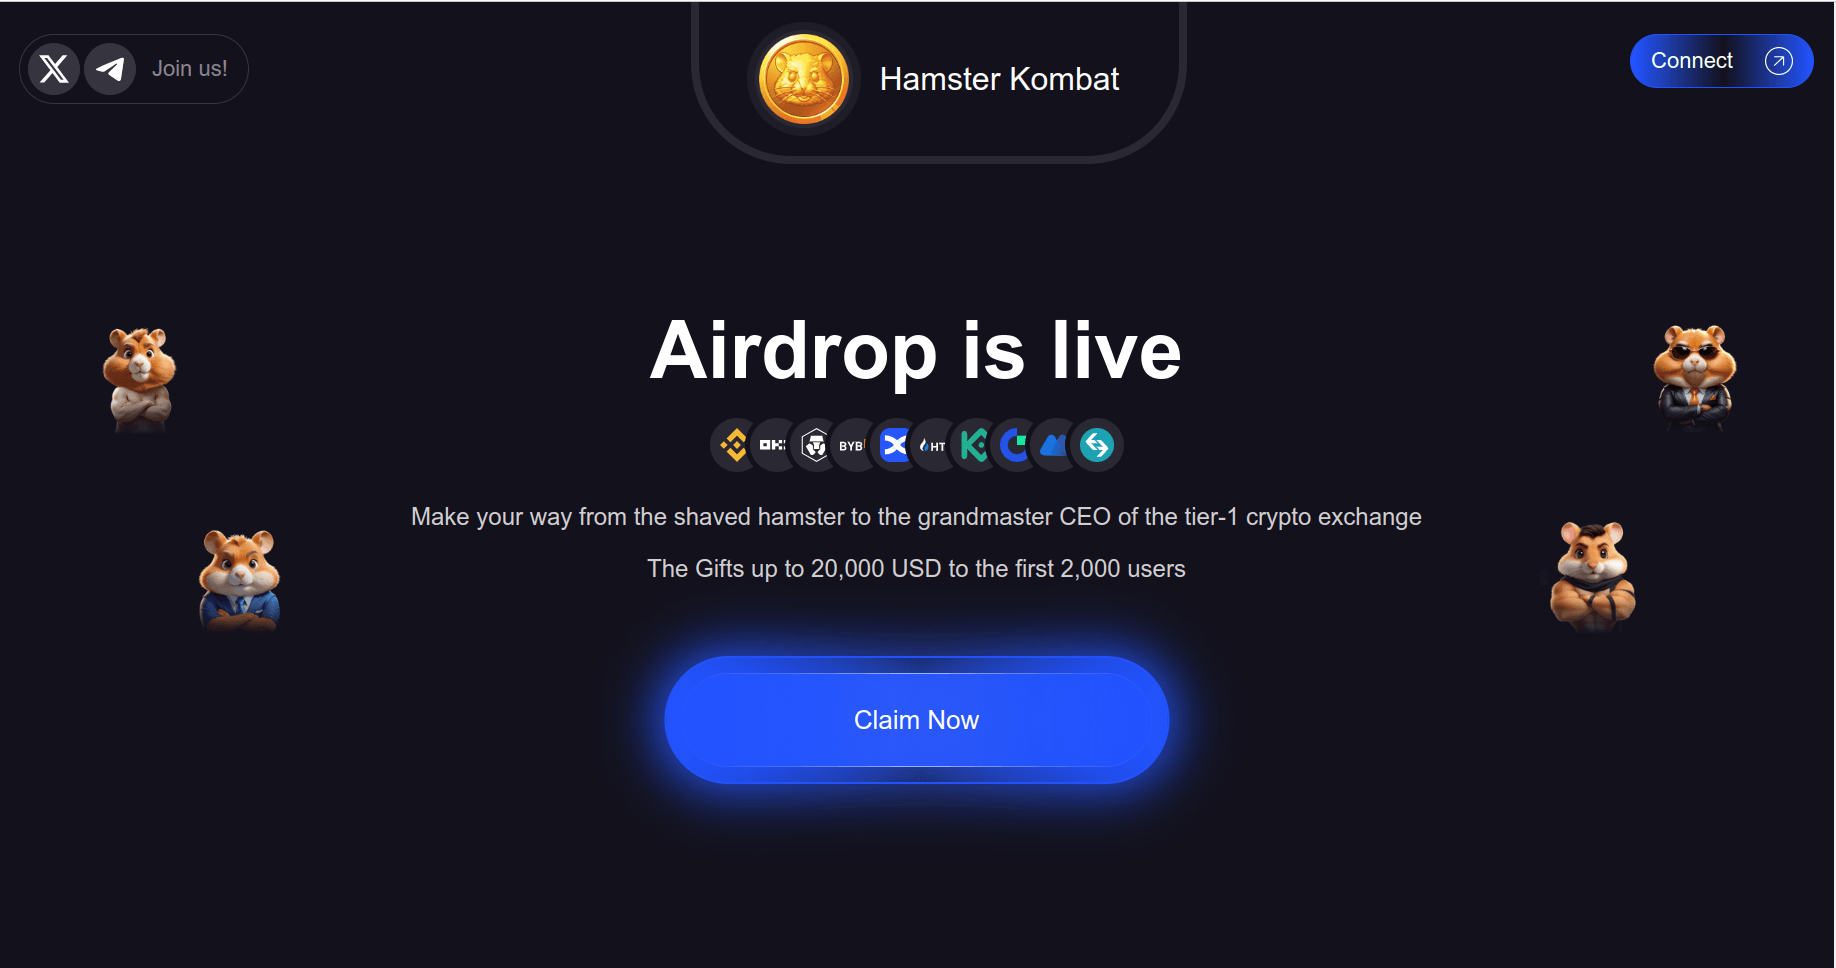
    Scam emails also targeted users of the cryptocurrency game Hamster Kombat, popular among Russian-speakers. Players eagerly awaited the HMSTR token listing, which was repeatedly postponed—a delay that scammers were quick to exploit. In the fall of 2024, they began sending emails pretending to be from the Hamster Kombat team, promising generous cash prizes if victims clicked a link to a fake game site.

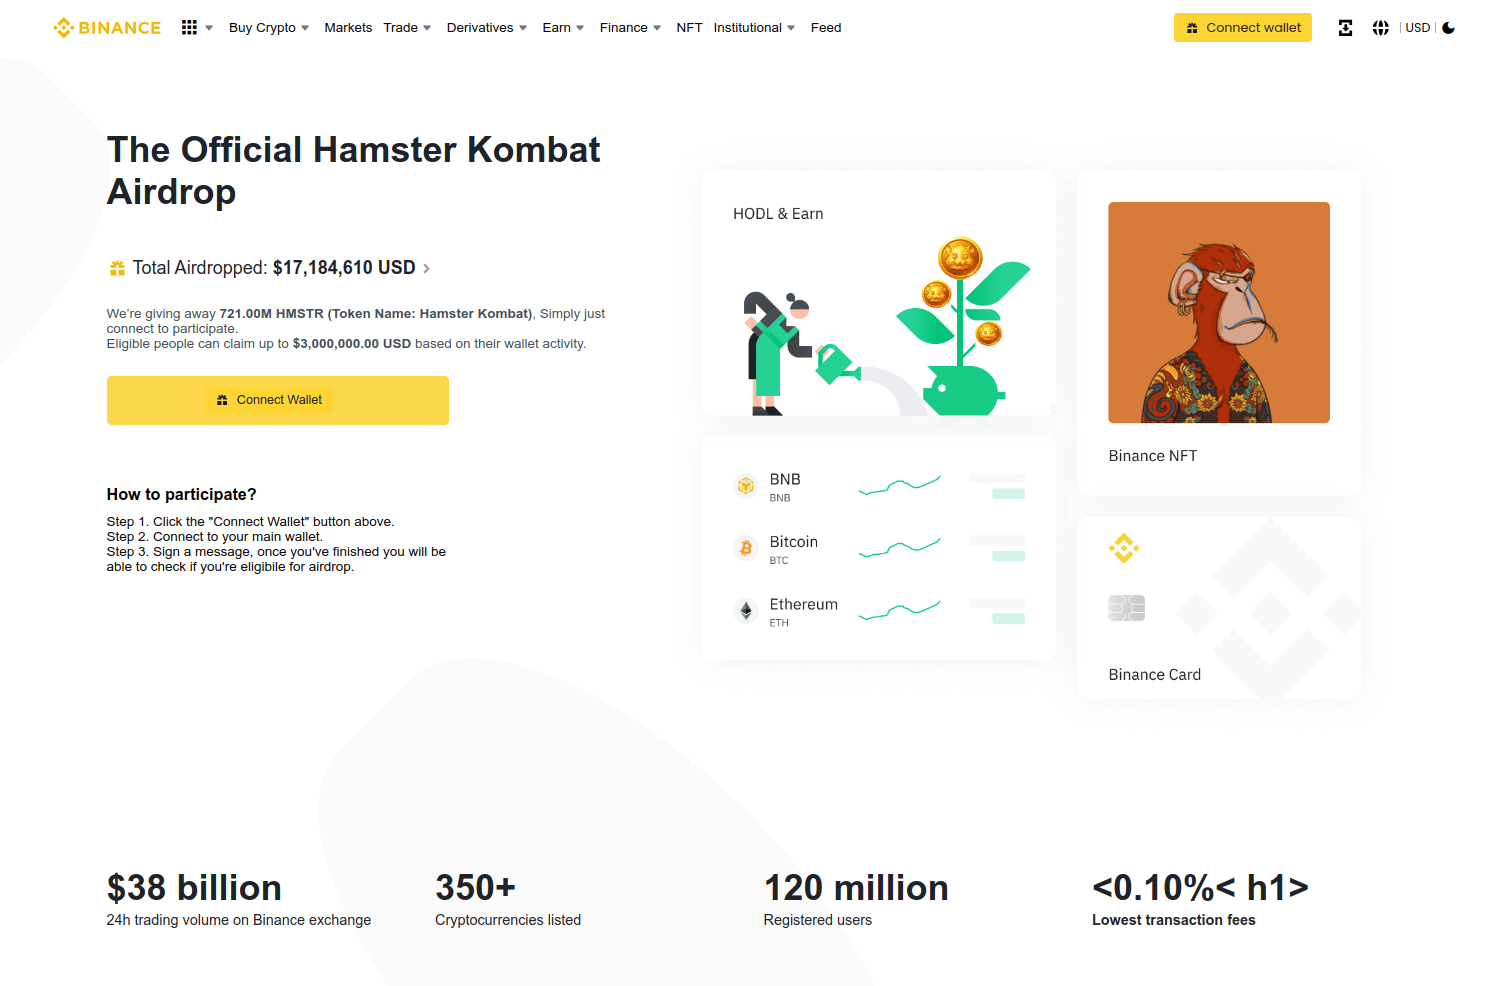
    Similar offers were distributed via a fraudulent website mimicking a major cryptocurrency exchange. In both cases, to claim the coveted tokens, victims had to link their cryptocurrency wallets.

    “Nigerian” scam

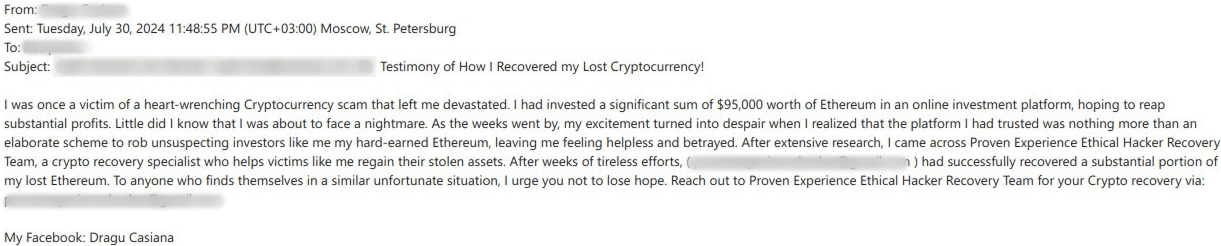
    In 2024, the Nigerian scam remained popular among spammers. Furthermore, fraudsters used both time-tested and trending themes to deceive victims. Cybercriminals employed various tricks and manipulations to engage with email recipients, with the ultimate goal of extracting money.

    Most often, users were lured into classic schemes: fraudsters posed as terminally ill wealthy individuals seeking a worthy heir, lottery winners eager to share their prize, or investors offering opportunities in a promising business. Sometimes, to evade suspicion, scammers “rescued” their victims from other fraudsters and offered to compensate them for any financial losses. For example, in the summer of 2024, we came across an interesting case where an alleged victim of crypto fraud suggested that fellow sufferers contact a group of noble hackers for help recovering lost cryptocurrency.

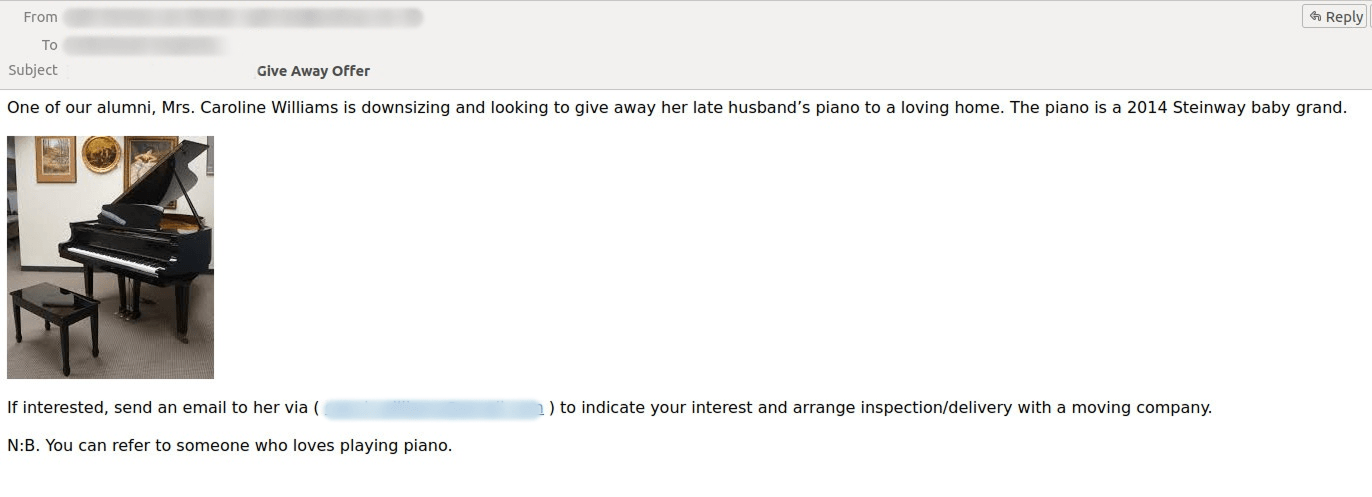
    Some scam offers were quite unexpected, as they didn’t promise vast riches, and, therefore, might not attract such a wide audience. In mid-to-late 2024, we saw scam emails claiming to be looking for new owners for pianos due to relocation or the previous owner’s passing.

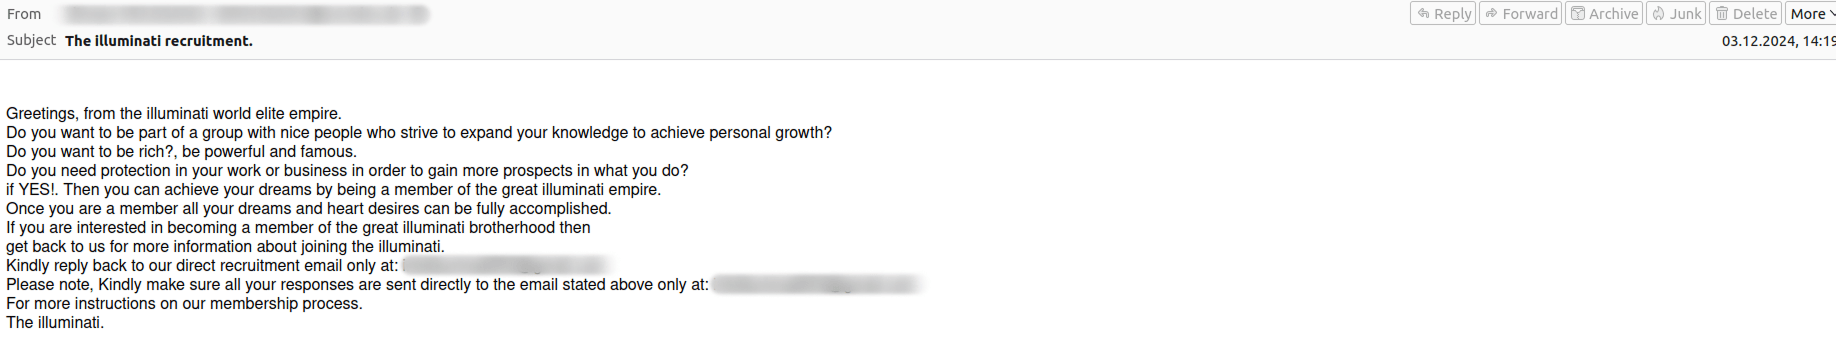
    We also encountered even more creative scam narratives. For example, an email allegedly sent from a secret society of Illuminati promising to share their wealth, power and fame if the recipients agree to join their grand brotherhood.

    Other “Nigerian” scam emails capitalized on current news events. Thus, the most talked-about event of 2024, the US presidential election, significantly influenced the types of scams we saw. For example, one scam email claimed that the recipients were incredibly lucky to be eligible to receive millions of dollars from Donald Trump’s foundation.

    Scam in the Russian segment

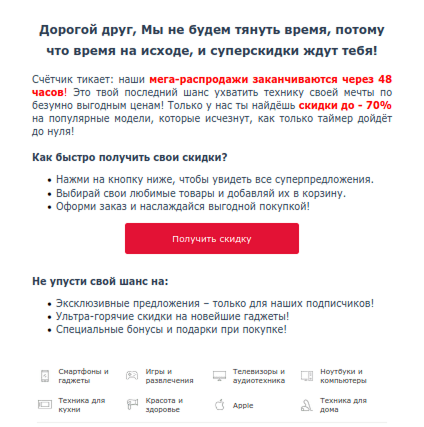
    Last year, the Russian segment of the internet was not spared from mass scam mailings. We frequently encountered schemes mimicking investment projects of major banks, promising users easy earnings and bonuses. Fraudsters also sent out emails with promotional offers from home appliance and electronics stores. Customers were informed of huge discounts on sales that were supposedly about to end.

    The links in such emails led to fraudulent websites that looked identical to legitimate online stores but stood out with extremely low prices. After paying for their desired items, customers lost their money, as orders were never actually placed.

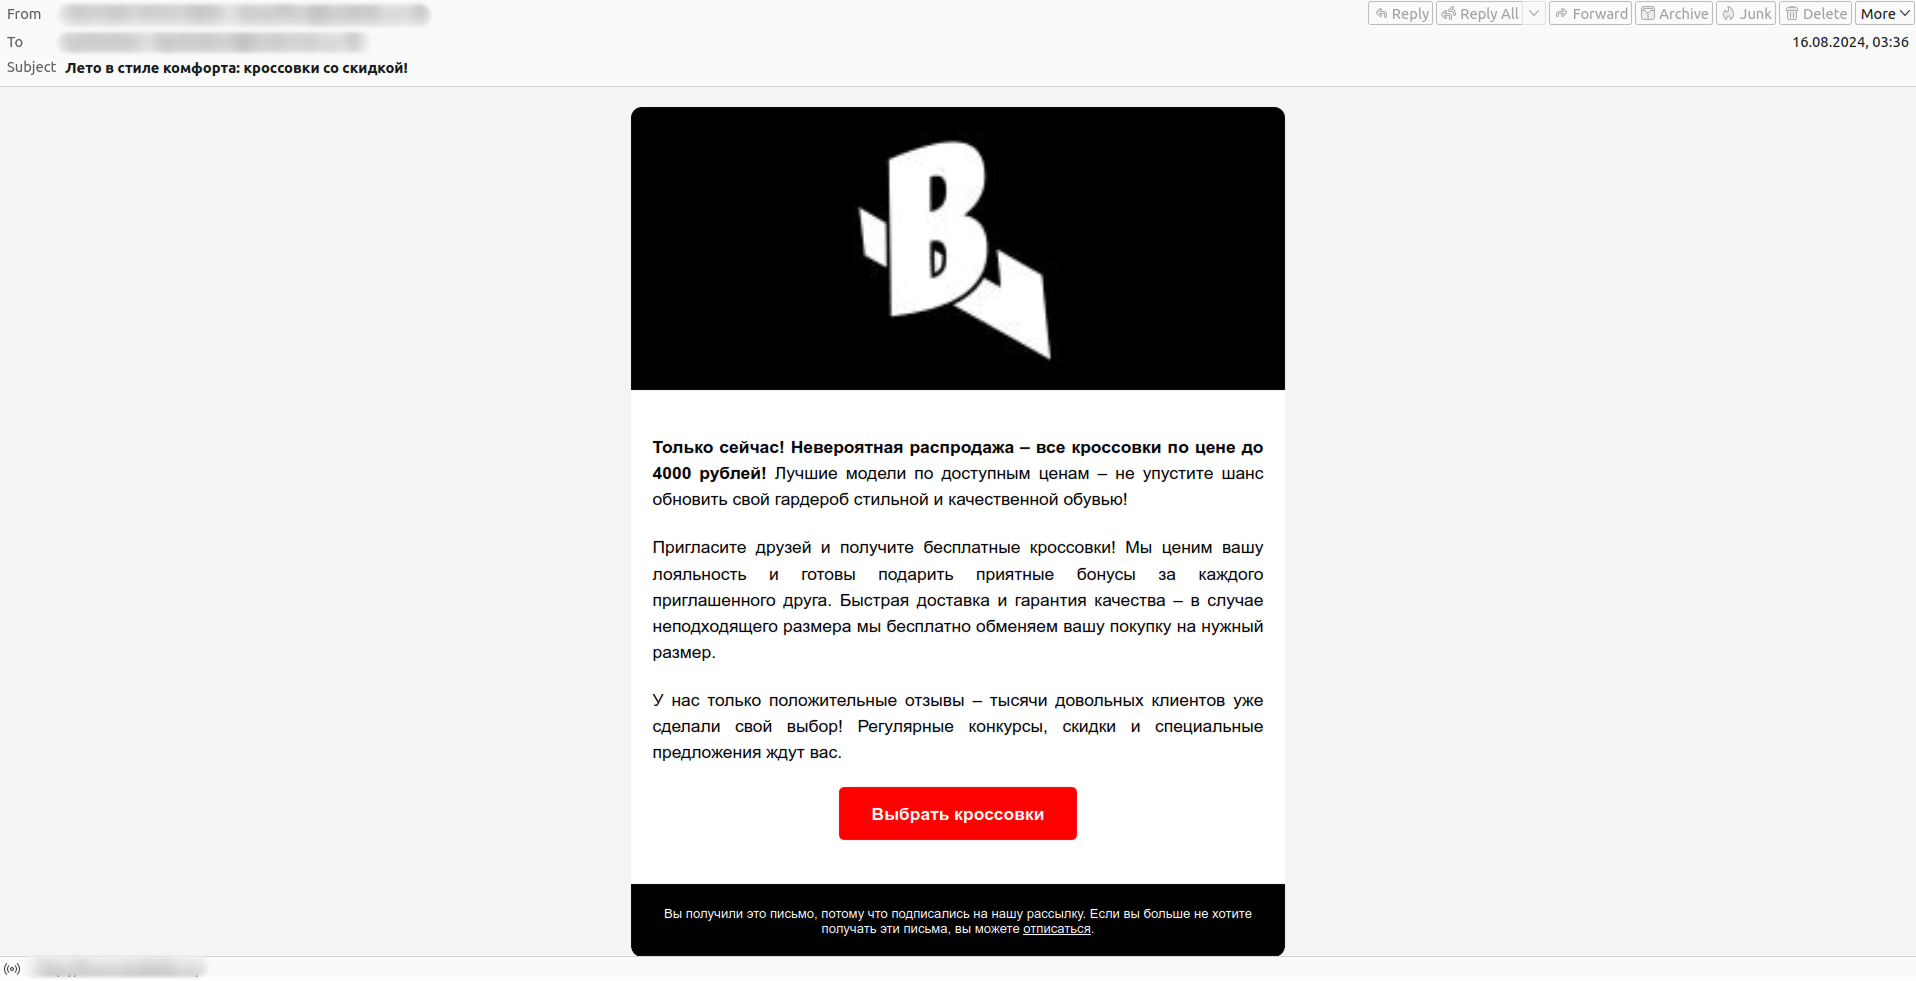
    Beyond electronics, scammers also offered other discounted products. In one such campaign, users received an email advertising a sneaker store selling popular models at affordable prices.

    Judging by the technical headers of the emails, both the sneaker store and electronics store promotions were sent by the same fraudsters.

    Additionally, we came across emails offering recipients to apply for debit or credit cards under favorable conditions. Unlike the electronics and shoe sale scams, these messages were legitimate referral programs from major banks, which enterprising spammers tried to monetize. Technically, such emails are not scams, as their links lead to real banking websites, and recipients do not face any risks. However, senders profit from registrations via the referral program. Nevertheless, we do not recommend clicking links from unknown senders, as seemingly harmless emails from a referral platform could be phishing or scam messages.

    Password-protected archives

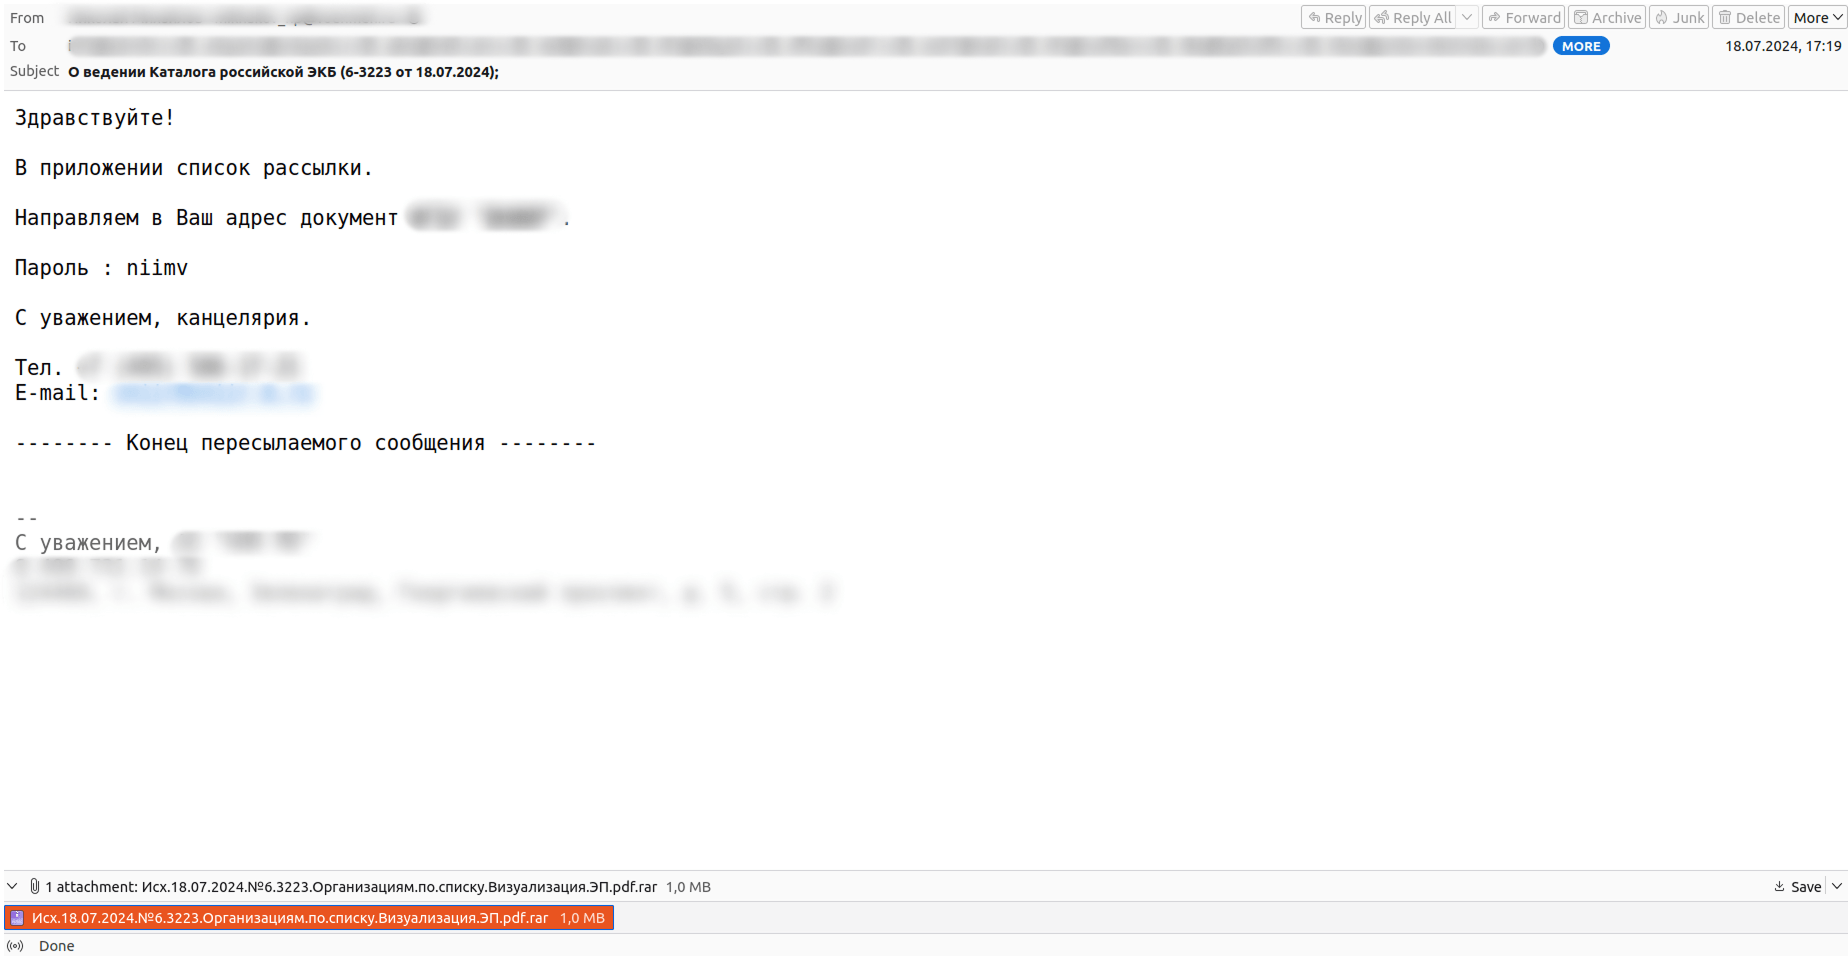
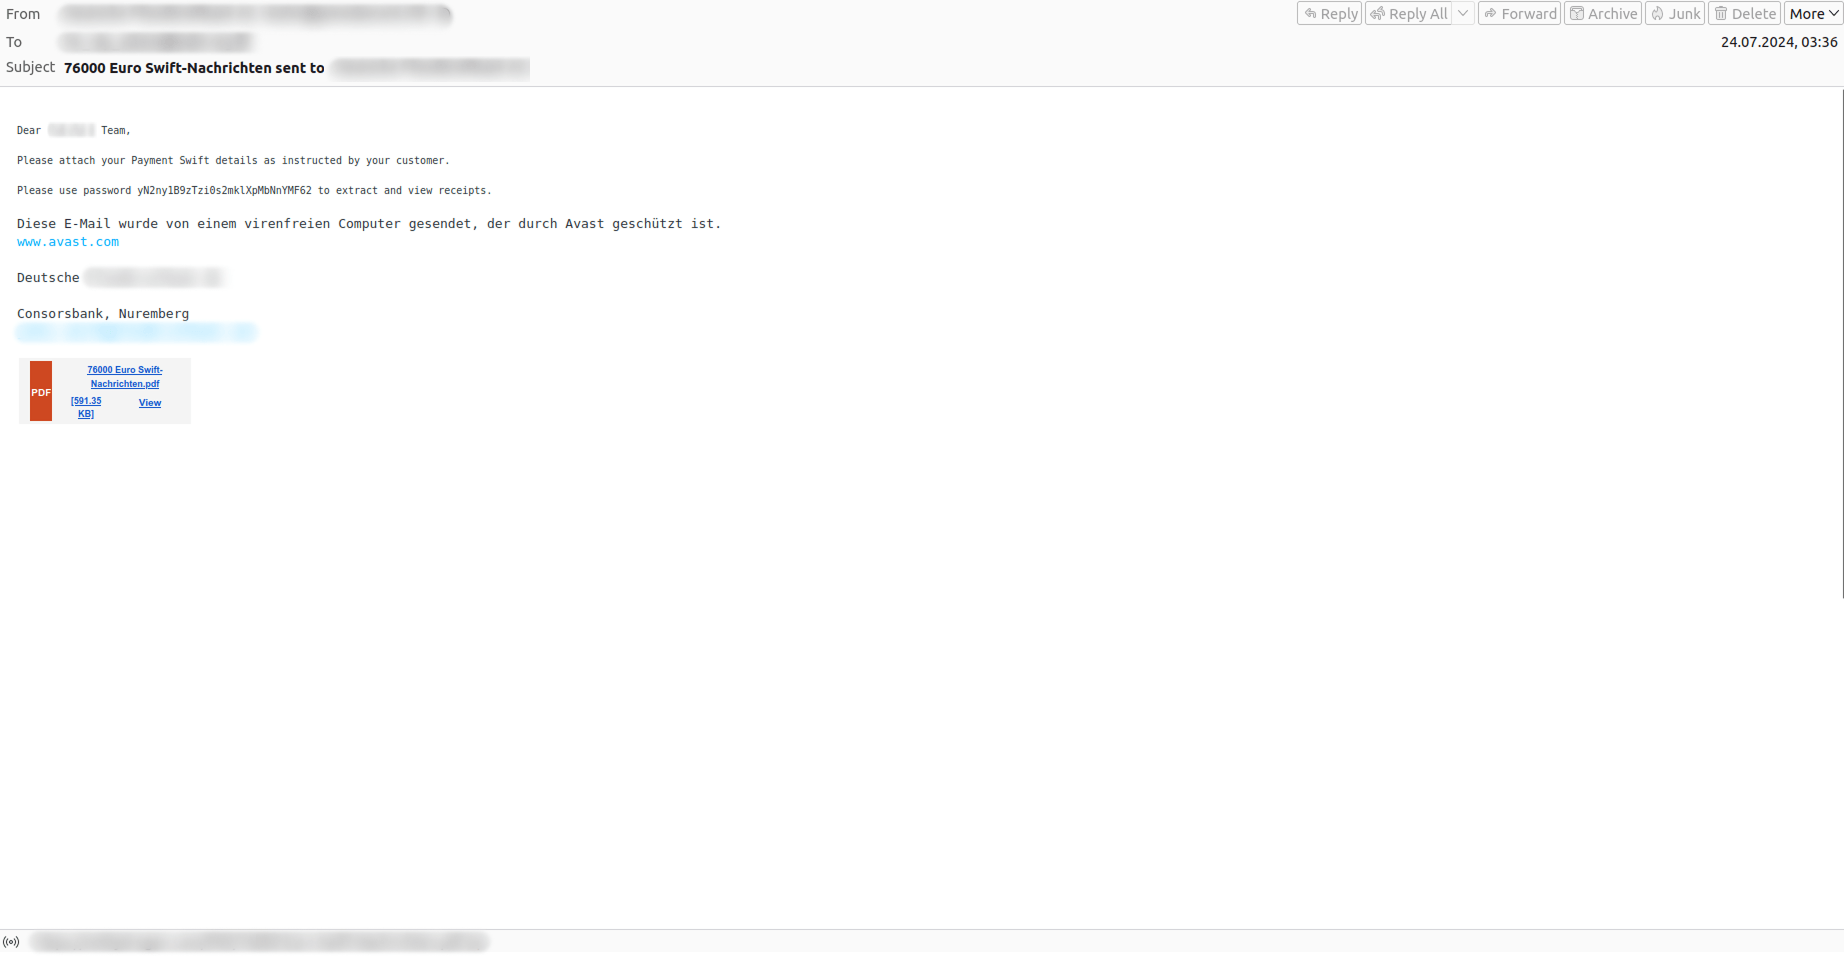
    In 2024, there was an increase in emails distributing password-protected archives containing malicious content. Sometimes, these files were included not as attachments but via download links, which also required a password. Presumably, this was the attackers’ attempt to bypass email security filters. Typically, the archive password was mentioned in the email text, and sometimes in the attachment’s filename. Notably, fraudsters often disguised malicious archives or links as files with other extensions, such as PDF, XLS, or DOC.

    Since April 2024, we have been recording similar distributions of files with the double extension .PDF.RAR, targeting employees of Russian companies in the government, financial, manufacturing, and energy sectors.

    We assume that these messages were sent from compromised email accounts of the recipients’ business partners. Some emails contained real correspondence, to which attackers replied with an email containing the malware. All the emails we examined in this campaign were unique. The attackers likely crafted messages to closely mimic the style of the compromised business partner.

    Similar messages containing malicious files were also found in other languages. However, unlike campaigns targeting Russian-speaking users, these had more general themes—attachments were disguised as invoices, commercial offers, supply orders, tender schedules, court notices, and other documents.

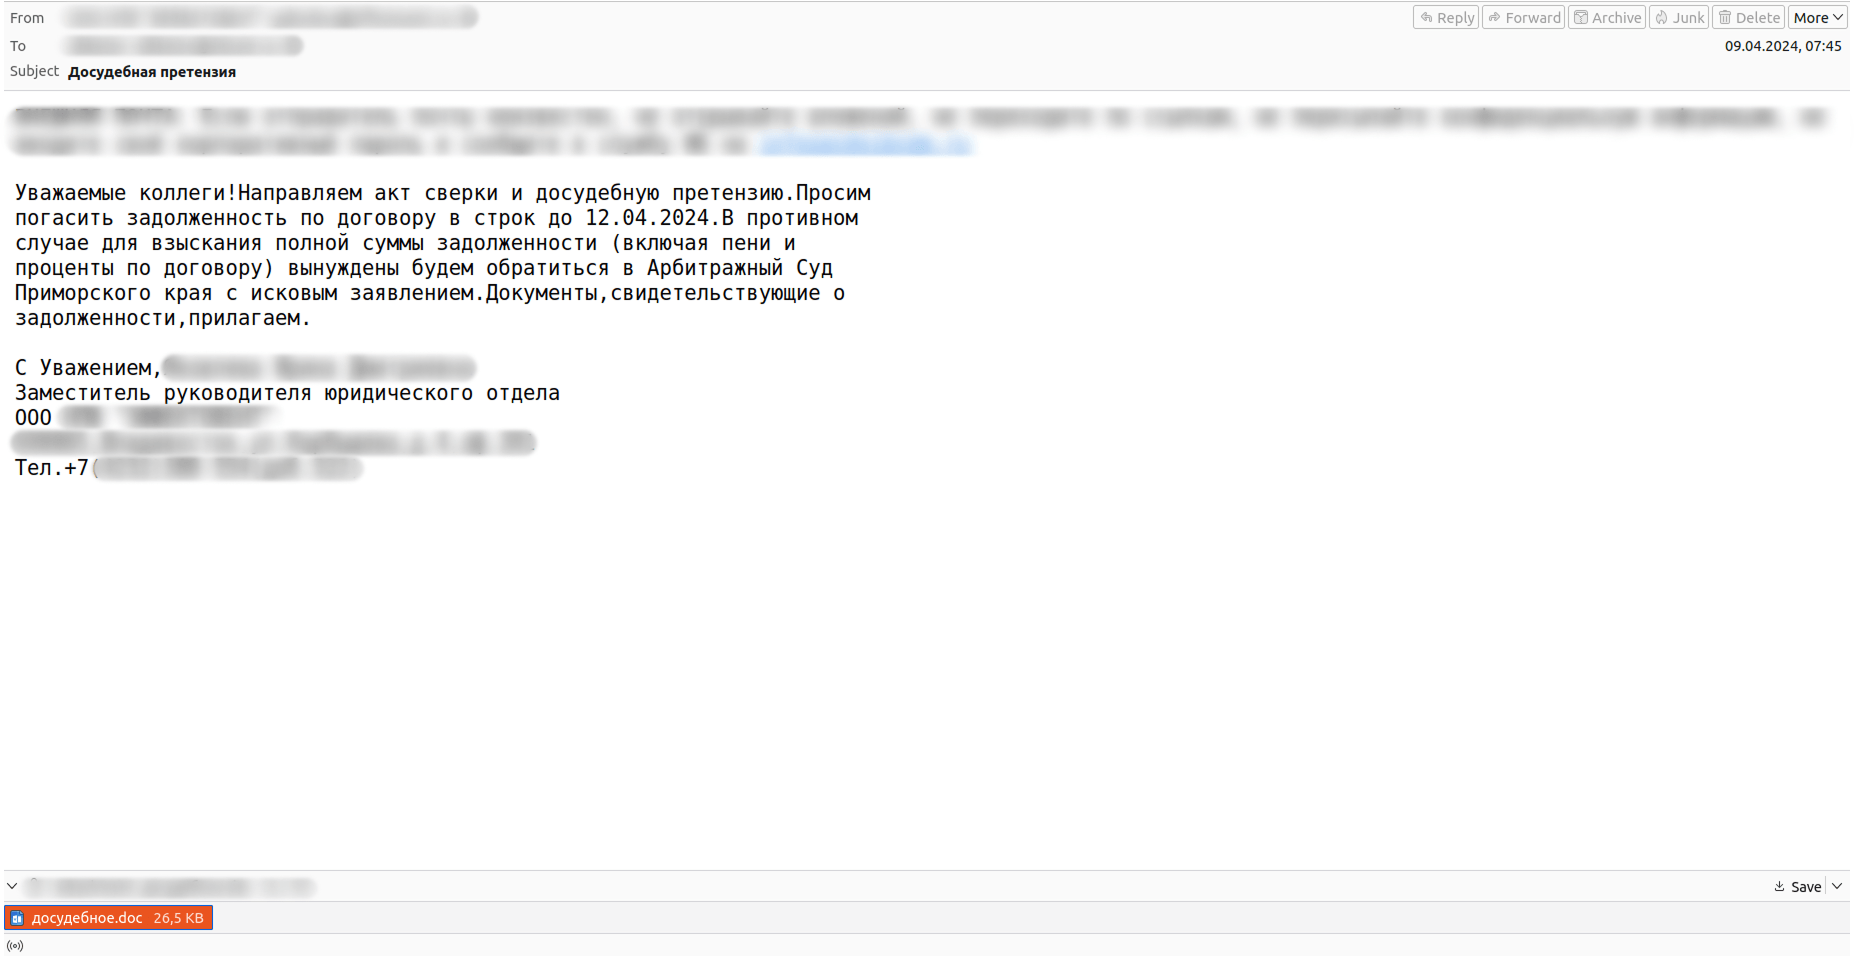
    Pre-trial claims and lawsuits

    Last year, attackers frequently threatened legal action to convince victims to click dangerous links or open malicious attachments. These messages primarily targeted Russian companies but were also observed in other languages. Typically, fraudsters posed as business partners, demanding debt repayment; otherwise, they “would be forced to take the matter to arbitration court.” In one such campaign, pre-trial claims in attachments were .DOC files containing VBA scripts. These scripts established connections with command servers and downloaded, saved, and executed malicious files on the victim’s device. Kaspersky’s products detect this payload with the verdict HEUR:Trojan-Downloader.MSOffice.Sload.gen.

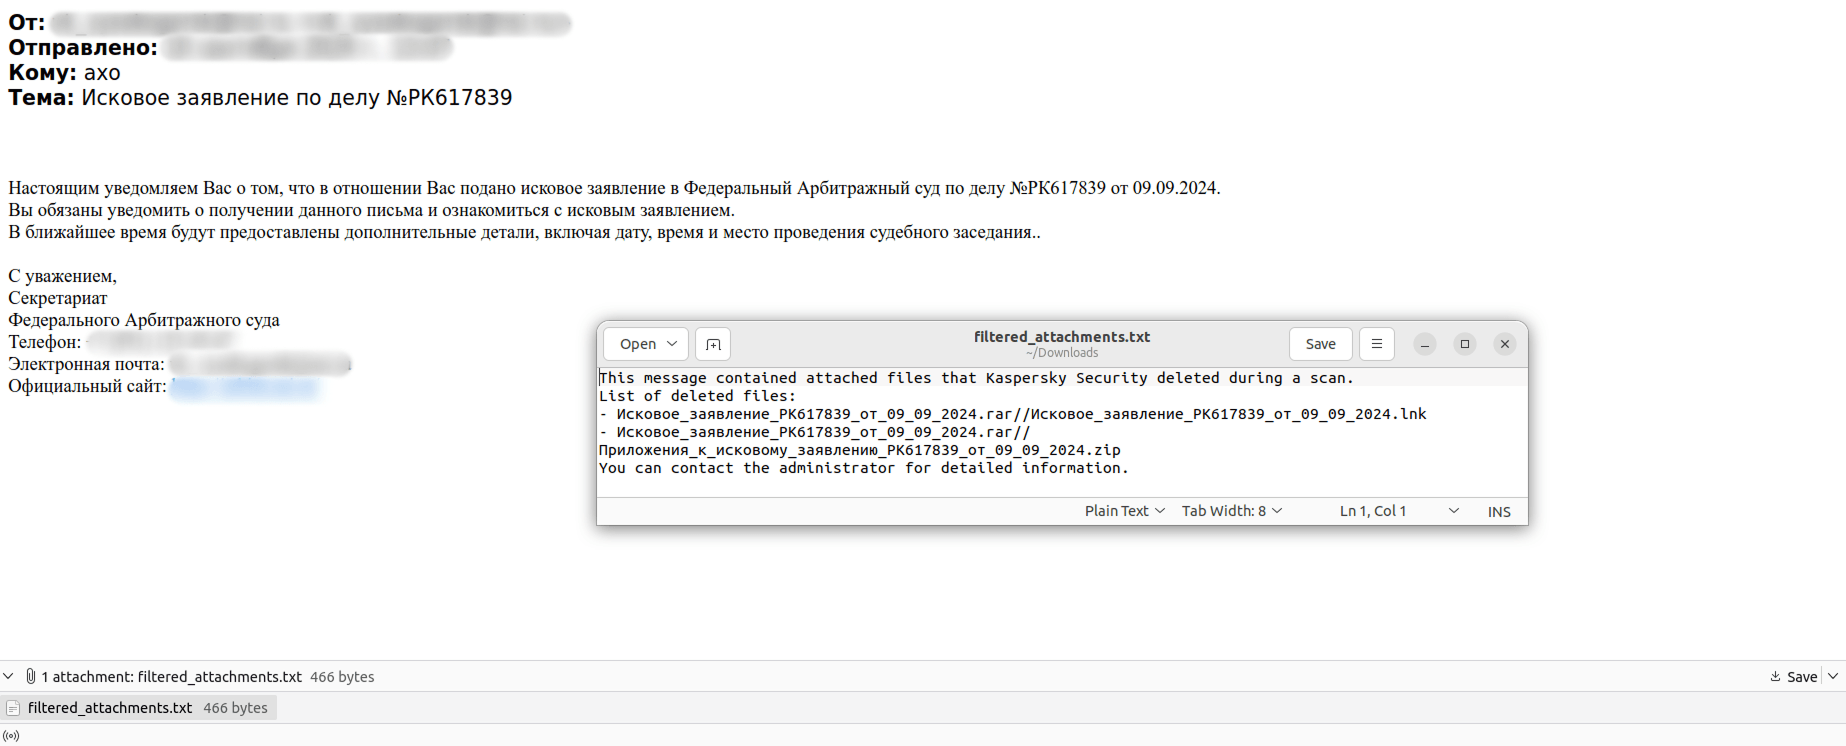
    In some cases, cybercriminals gave no reason for their legal threats but instead attempted to shock victims with an already “filed” lawsuit to pressure them into opening the attachment. Of course, it contained malware.

    Emails with malicious SVG files

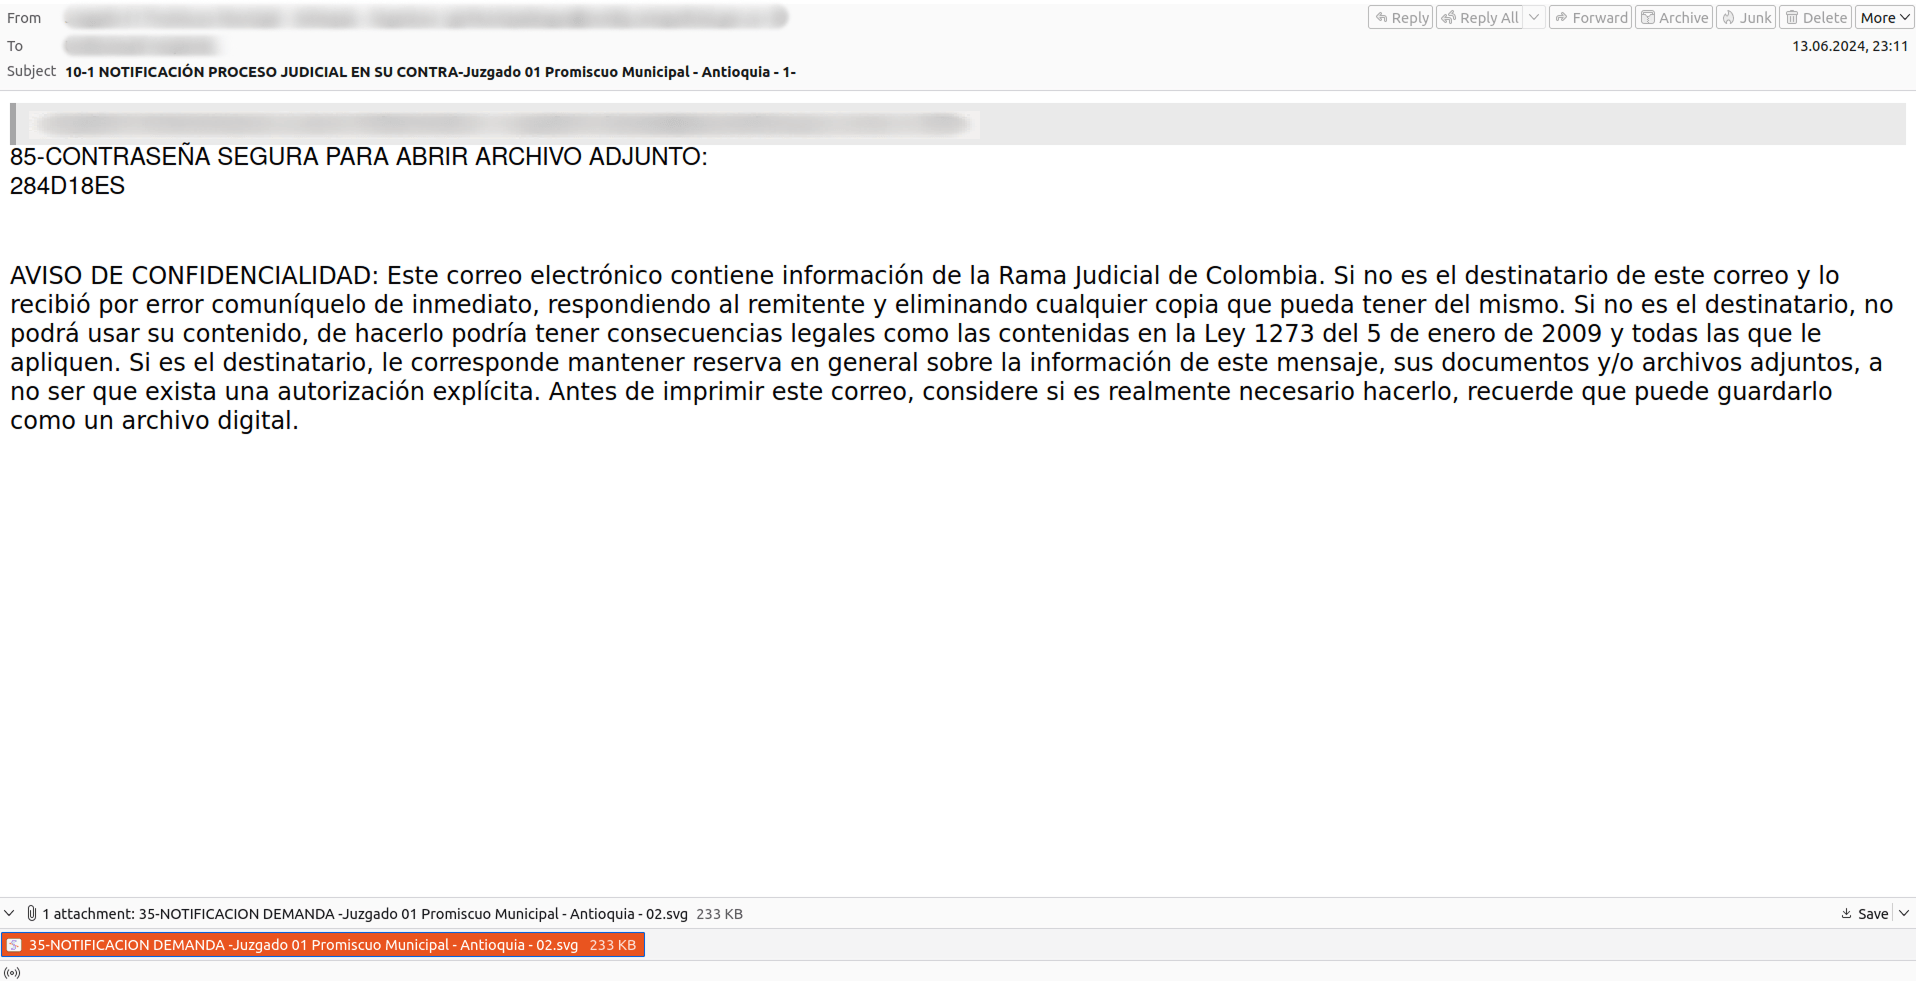
    According to our observations, the past year saw a rise in the distribution of malicious SVG files. Disguised as harmless images, these files contained scripts that downloaded and installed additional malware on the victim’s device. (Our solutions detect these scripts as Trojan.Script.Agent.sy and Trojan.Script.Agent.qe.) The emails we encountered were written in Spanish and posed as fake legal case notifications and court summons. The text included a password for opening the attached file.

    Threats to businesses

    Fake deals

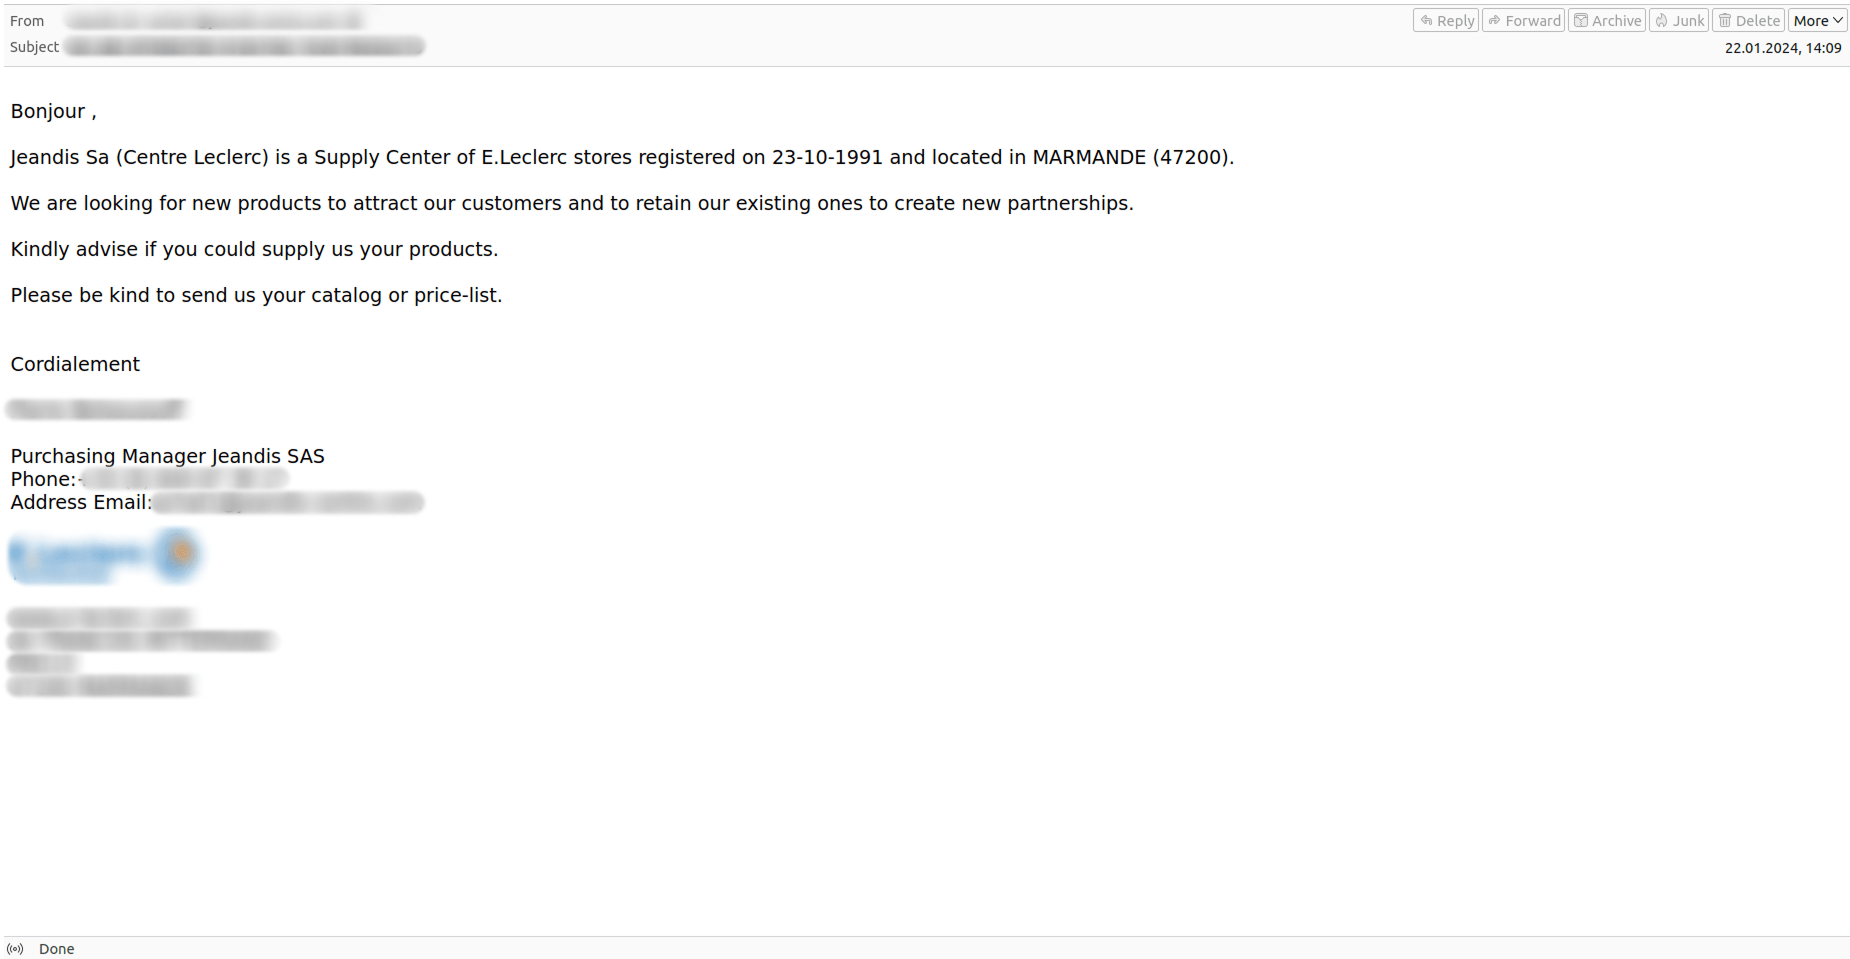
    A special category of emails that users complained about in 2024 was requests for quotation from suspicious senders. These emails were sent either from free email addresses or recently created domains. Attackers signed the emails with the names of large companies, included links to their websites, and sometimes even used official company logos. These emails followed a uniform template: the “buyers” briefly introduced themselves, expressed interest in the recipient’s products, and requested a catalog or price list. Interestingly, the fraudsters did not seem to care about the type of goods involved.

    If the recipient responded, events could unfold in two ways. In some cases, after receiving a reply to the initial seemingly legitimate request, the fraudsters sent malicious attachments or links in the next email.

    In another scenario, the “buyers” engaged in further correspondence with their “potential partner”—the victim—discussing details and insisting on their conditions, including post-payment and requiring the seller to cover customs duties. This meant that the supplier bore all the risks of delivery and could lose their goods without receiving any payment.

    Facebook

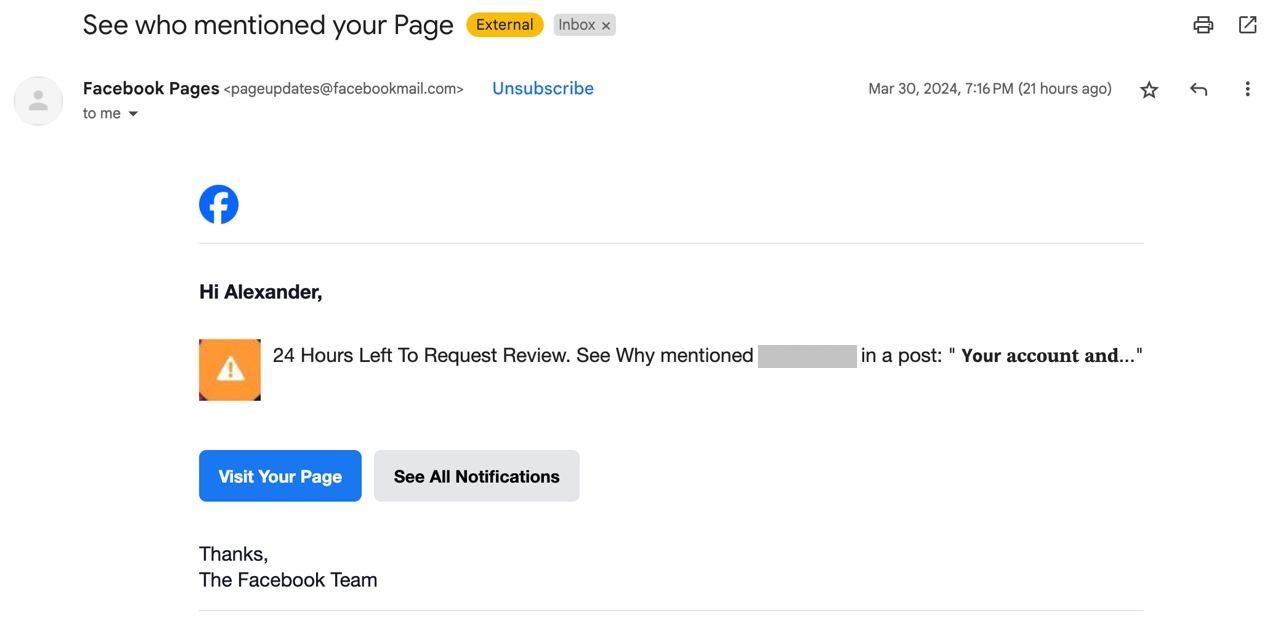
    In the spring of 2024, we discovered an interesting phishing email scheme that leveraged legitimate Facebook notifications. The service sent entirely legitimate emails to users mentioned in threatening posts. The attackers used compromised Facebook accounts, renamed to “24 Hours Left To Request Review. See Why,” and changed the profile picture to an icon featuring an orange exclamation mark.

    Then, the fraudsters created posts on these pages tagging the business accounts of potential victims. The tagged users received notifications from the alarmingly-named pages.

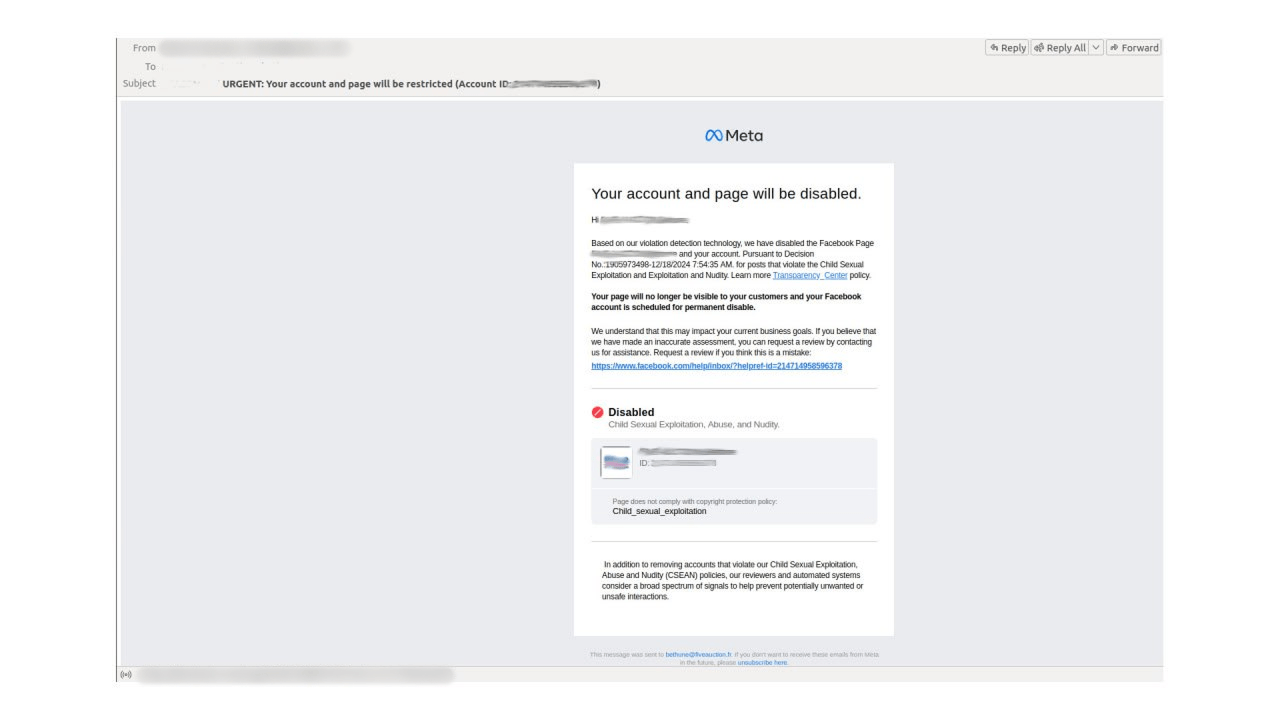
    These posts contained more details than the emails: victims were warned about an impending account ban due to a complaint from another user. To dispute the ban for violating service terms, the recipient of the “notification” was required to follow a phishing link from the post—leading to a fake site with Meta logos that requested Facebook login credentials.

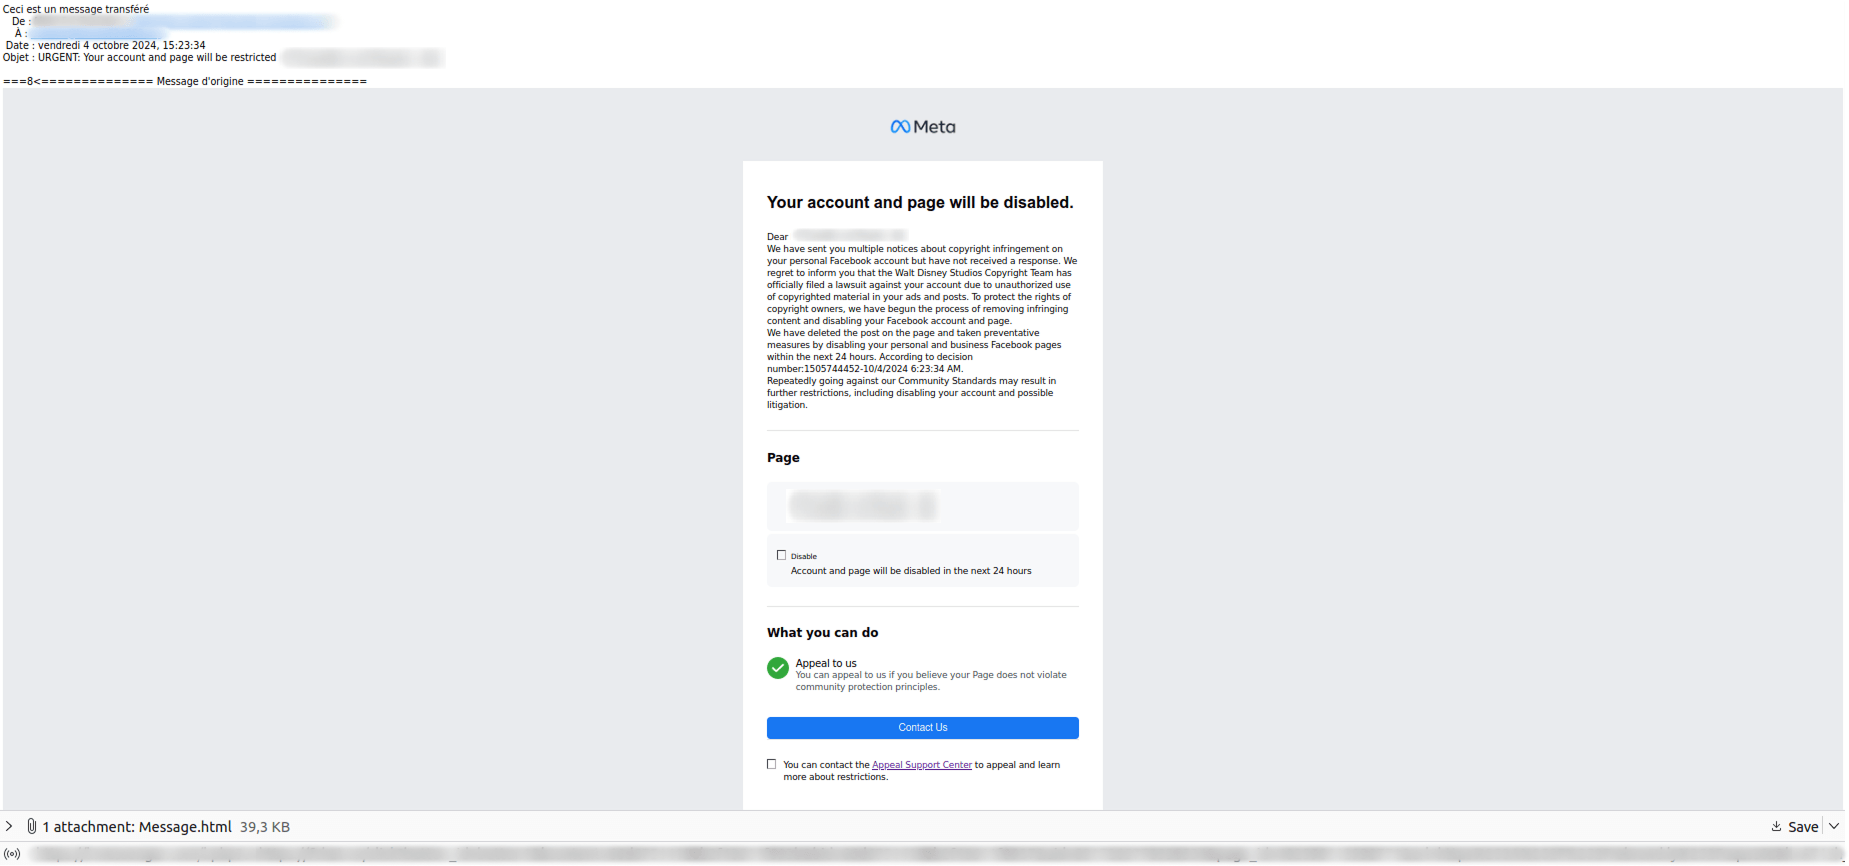
    We also found phishing emails containing legitimate Facebook links in October 2024, but this time without using the platform’s infrastructure. These emails contained notifications of lawsuits for copyright infringement and the removal of unlawful posts from the recipient’s profile. The target was warned that their personal and business pages would be blocked within 24 hours, pressuring them to take hasty and careless action.

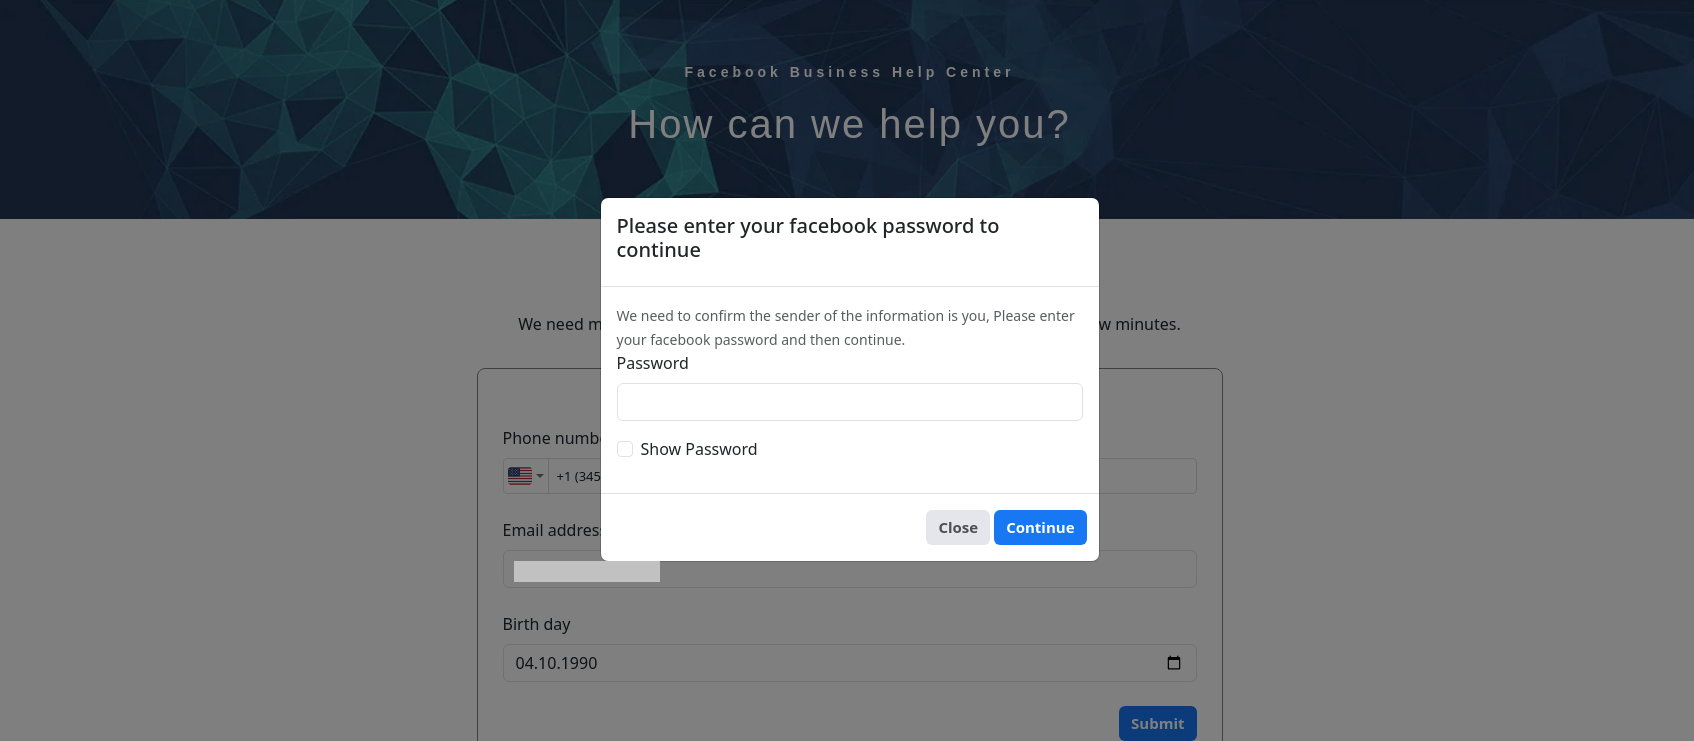
    However, they were immediately offered the chance to appeal by contacting the “Appeal Support Center.” The link in the email led to a phishing site disguised as Meta’s support service, where the victim was also asked to enter their profile password. To make the phishing link more convincing, a legitimate mechanism for redirecting users to external Facebook resources was used.

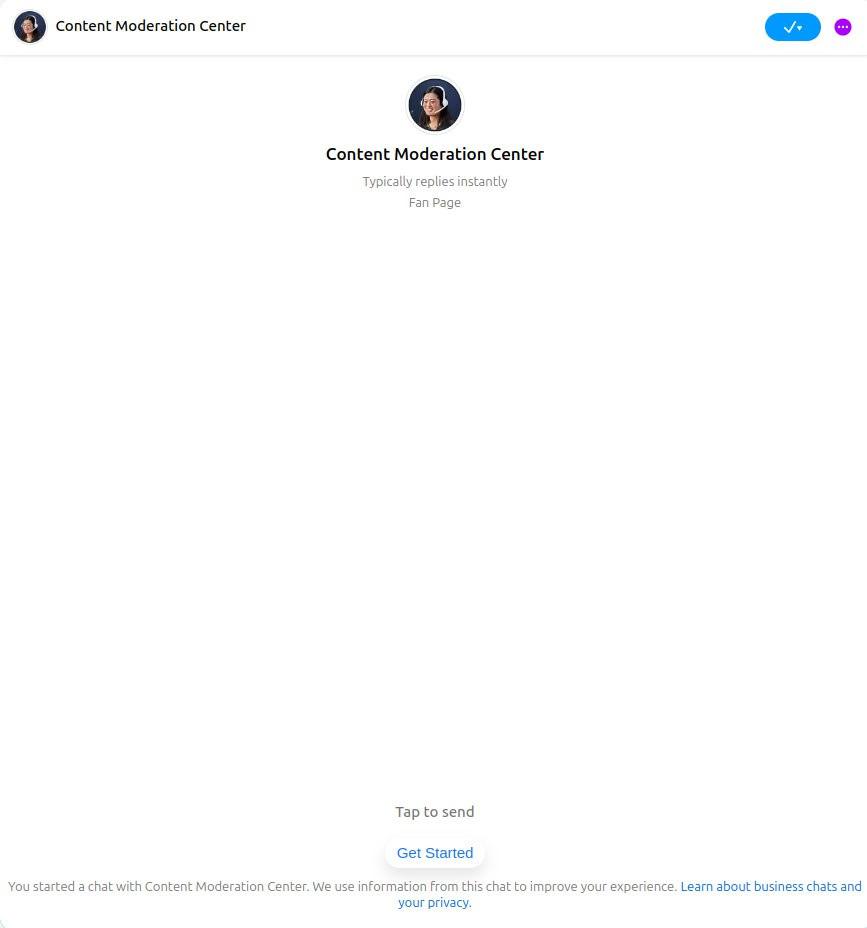
    At the end of 2024, we noticed an email campaign targeting companies promoting their business pages on Facebook. These emails mimicked official Meta for Business notifications and threatened to block the user’s account and business page for violating the platform’s rules and community policies.

    To dispute these accusations, the fraudsters urged the profile owners to click a link to contact “Facebook support” in a legitimate messenger. However, in reality, the victim was communicating with the owner of a fan page called “Content Moderation Center,” imitating an official support service employee. The scam could have been identified by the “Fan Page” label in the chat, though it was easy to miss.

    News agenda

    In 2024, scammers continued to exploit news agenda in spam campaigns.

    During the UEFA Euro 2024 football championship in Germany, emails began to appear offering merchandise with UEFA EURO 2024 logos.

    After Pavel Durov’s arrest in Paris, we noticed English-language messages calling for donations to supposedly fund his legal defense.

    In the fall of last year, a scam campaign began circulating, offering not-yet-released MacBook Pro M4 devices at low prices or even for free. The links in these emails led to fake websites imitating major marketplaces.

    Before Black Friday, we recorded a surge in spam offering exclusive discounts. The links in these messages lured victims to sites disguised as marketplaces, electronics stores, and financial institutions.

    B2B spam campaigns

    Online promotion services

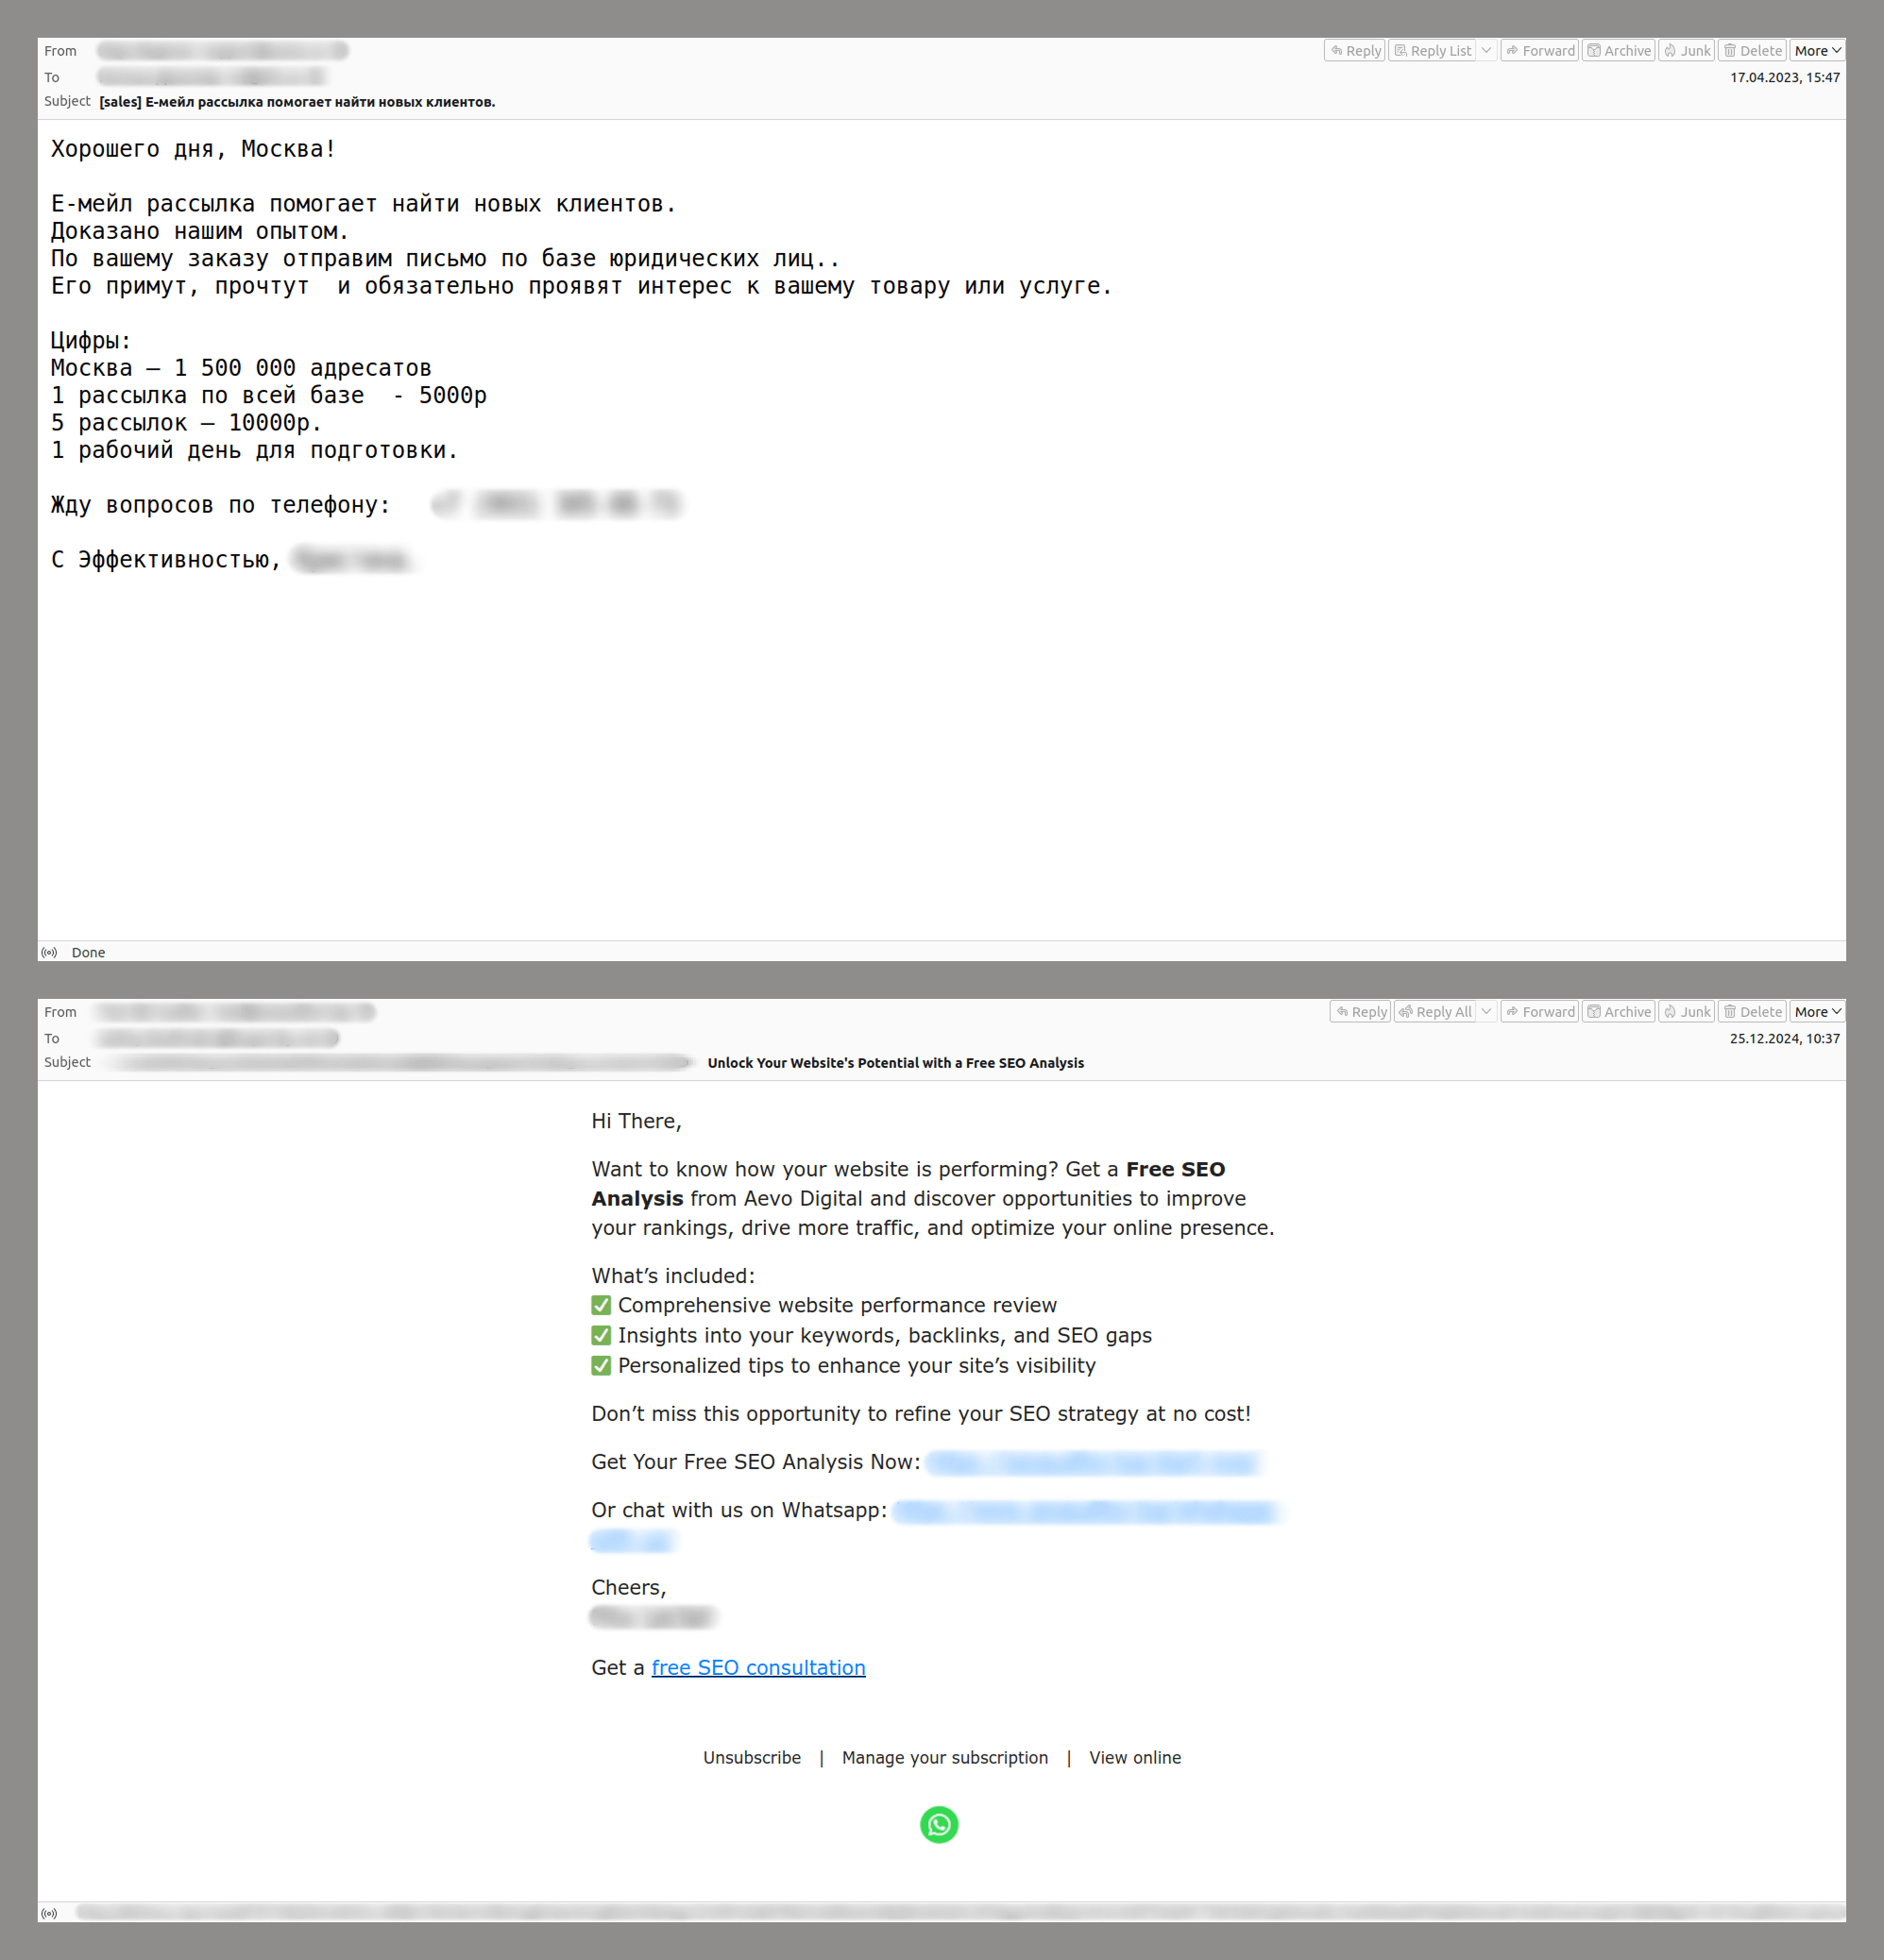
    One of the most common categories of spam email in 2024, complained of frequently by our corporate clients, was commercial offers for online promotion. Users were offered services such as creating or redesigning websites, setting up SEO tools, and purchasing databases with potential client contacts and other information. Other advertised services included guest post placement with backlinks to the client’s site, writing positive reviews, removing negative reviews, and creating personalized email campaigns. While these messages are not malicious or fraudulent, they are mass-distributed and unsolicited, causing inconvenience to users. The popularity of this type of spam is likely driven by the development of digital marketing tools and the search for new clients for small- and medium-sized businesses amid growing online competition.

    Buying likes and followers on social media

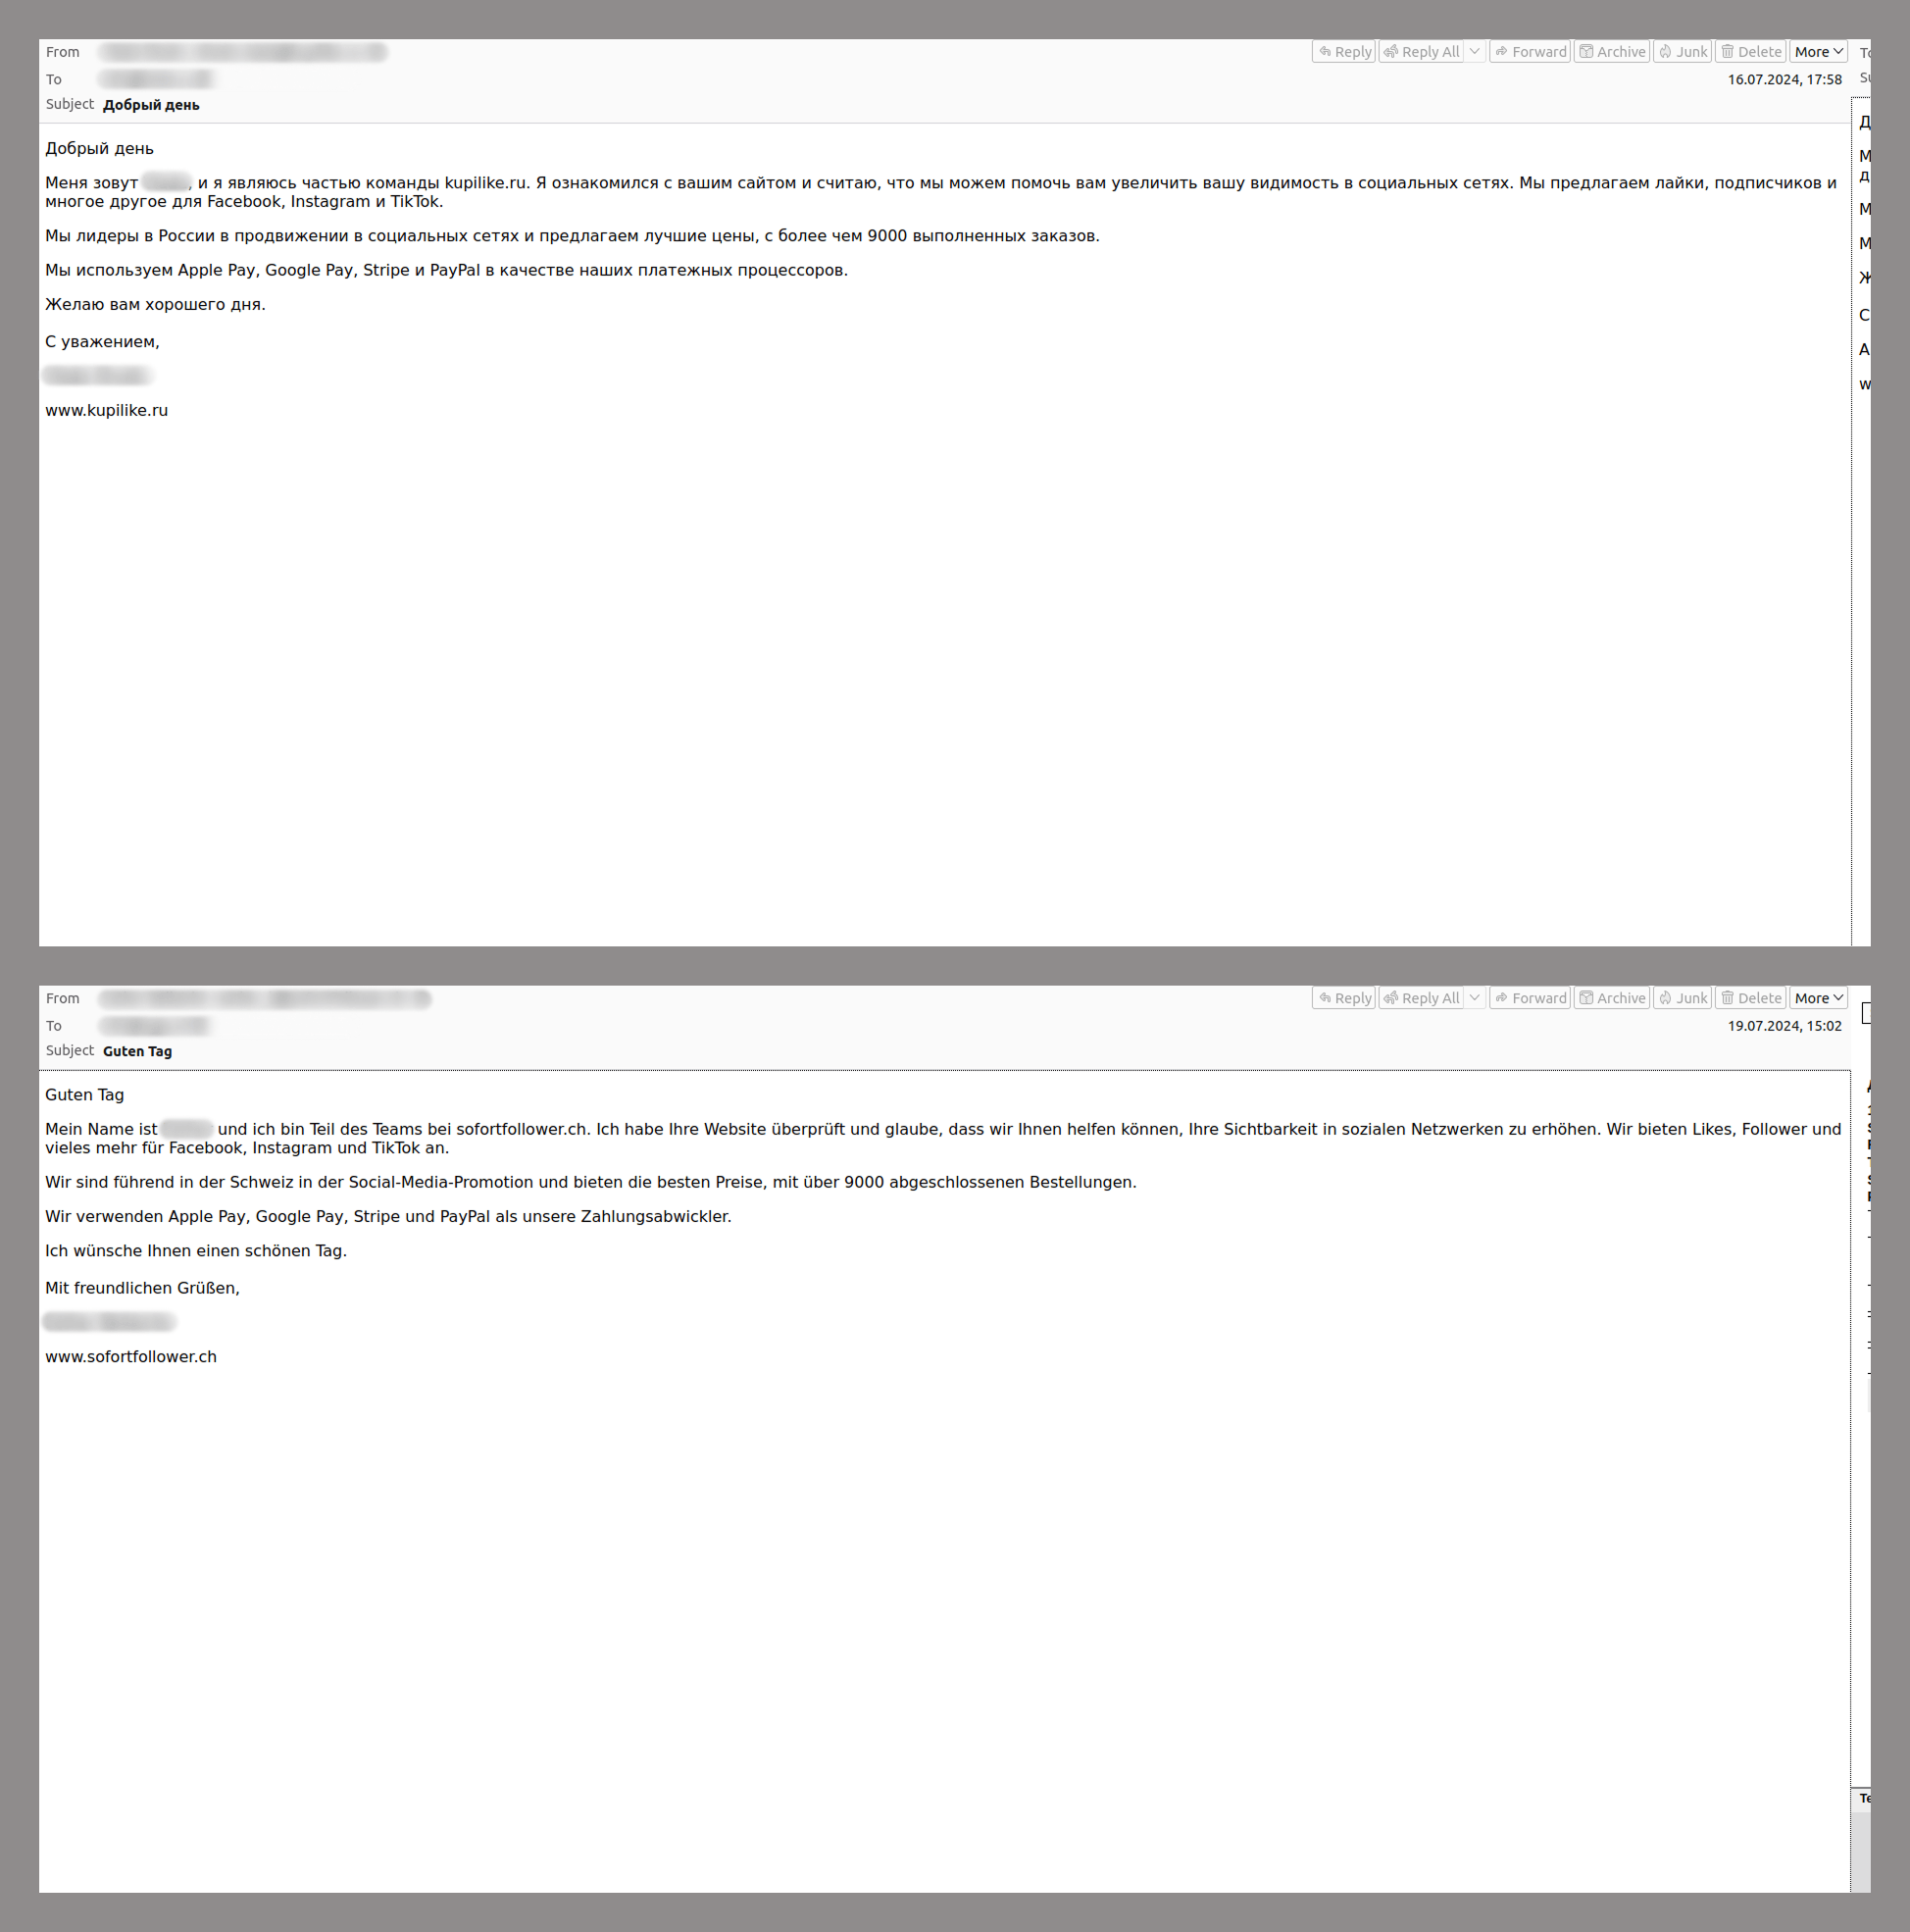
    We also frequently encountered business offers for the online promotion of company accounts on social media. Spammers sell fake likes and followers. They often pose as employees of real social media marketing firms, claiming to be industry leaders. At the end of their emails, the spammers included a link to a marketing platform and payment options for their services. One such campaign, which we observed throughout the past year and is still active, stood out due to the variety of languages used in the emails and the diversity of domain names. With these tactics, the spammers aimed to reach a global audience.

    AI in B2B emails

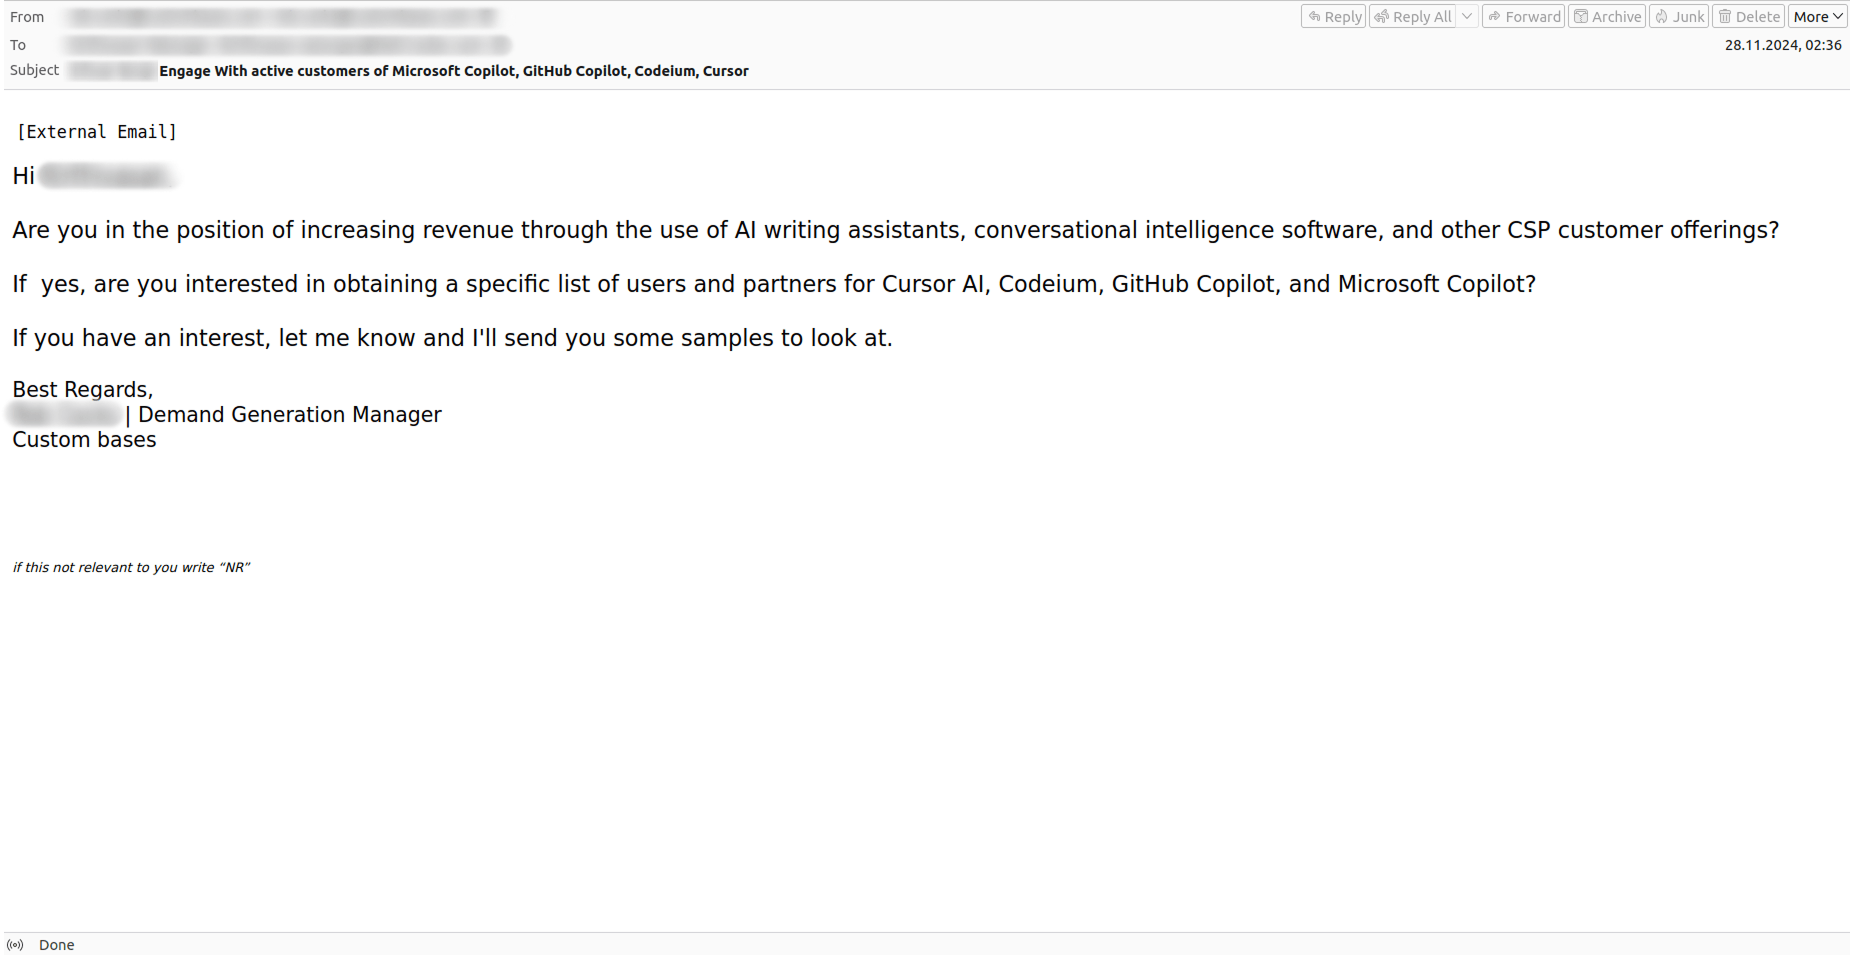
    The growing popularity of neural networks has led companies to actively integrate AI into their business processes. We assume that clients of such organizations, in turn, are drawn to service offers that incorporate neural networks. As a natural consequence of this trend, AI-driven solutions began appearing in spam campaigns advertising online marketing services.

    Spammers emphasized using AI, particularly ChatGPT, to perform various business tasks. We identified the following themes in these emails:

    • Attracting website traffic
    • Creating advanced lead generation strategies
    • Developing unique approaches tailored to a brand’s identity
    • Producing and publishing content
    • Launching personalized multi-channel marketing campaigns
    • Creating custom videos for YouTube channels

    Other topics also appeared in spam emails, but they all shared the same goal—enhancing business processes and attracting potential clients.

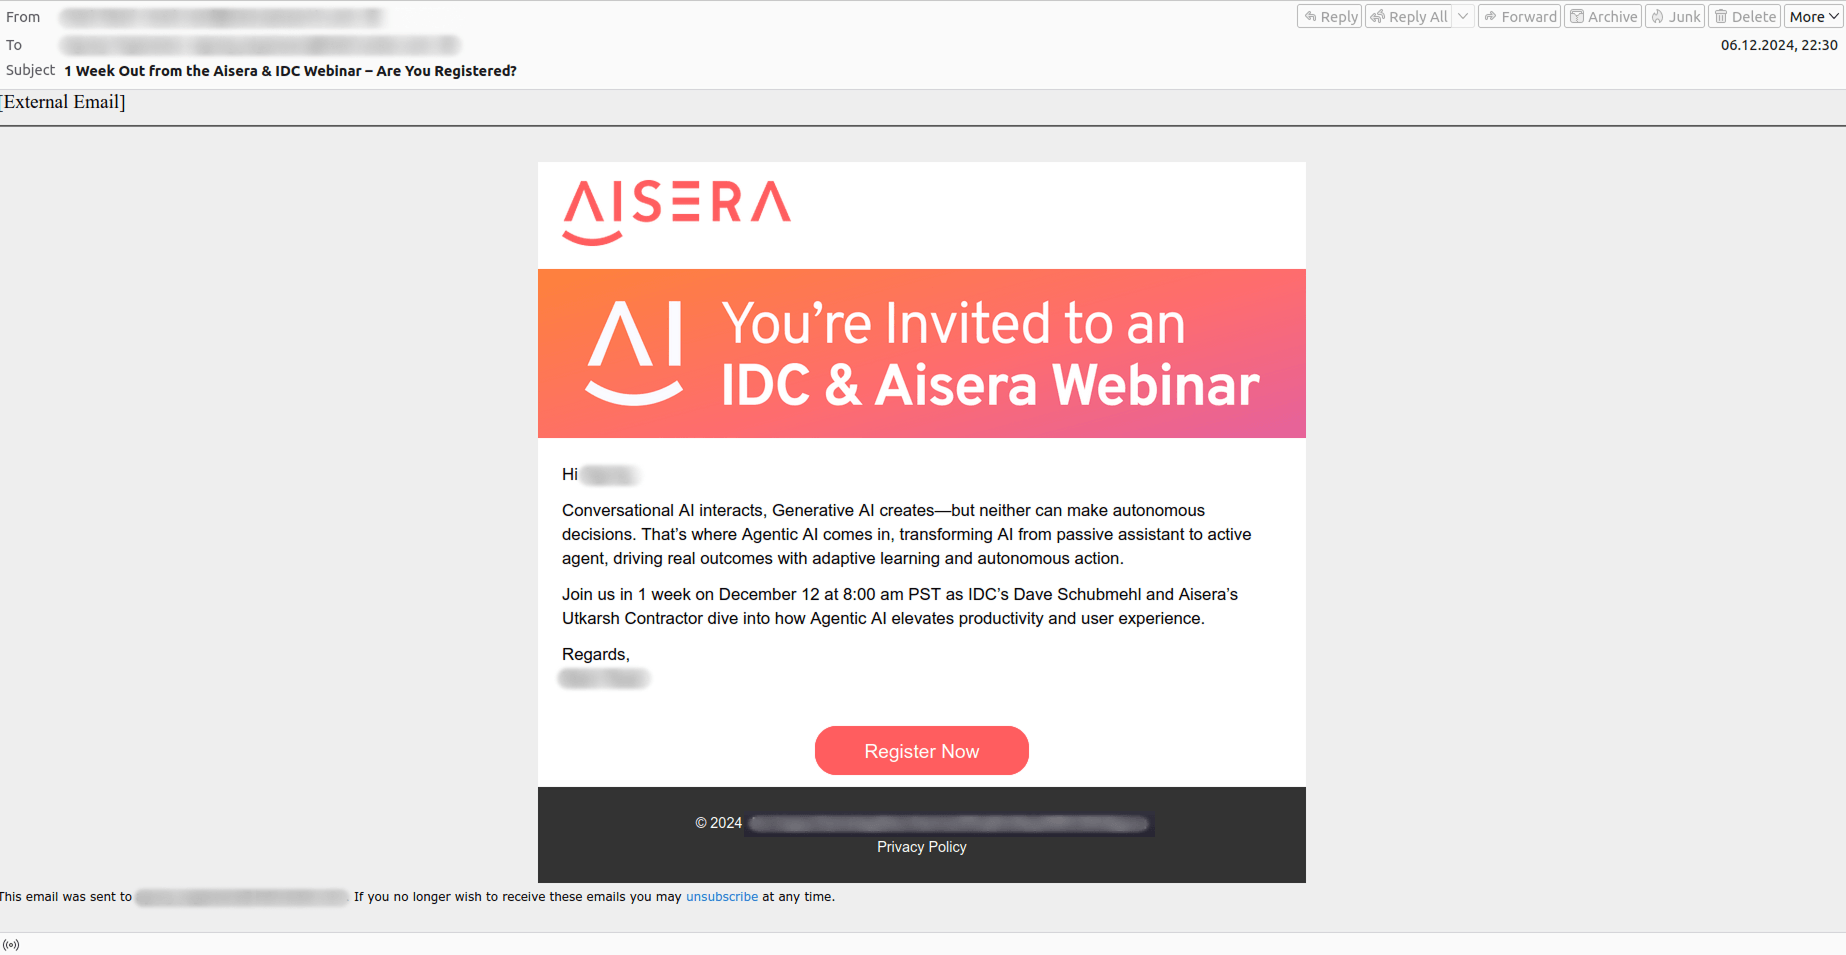
    Another particularly popular category of spam related to neural networks was advertising online events. Last year, we encountered numerous examples of emails promoting webinars about the promising capabilities and practical applications of AI in business operations.

    Targeted phishing in 2024

    In 2024, two main trends were observed in targeted phishing:

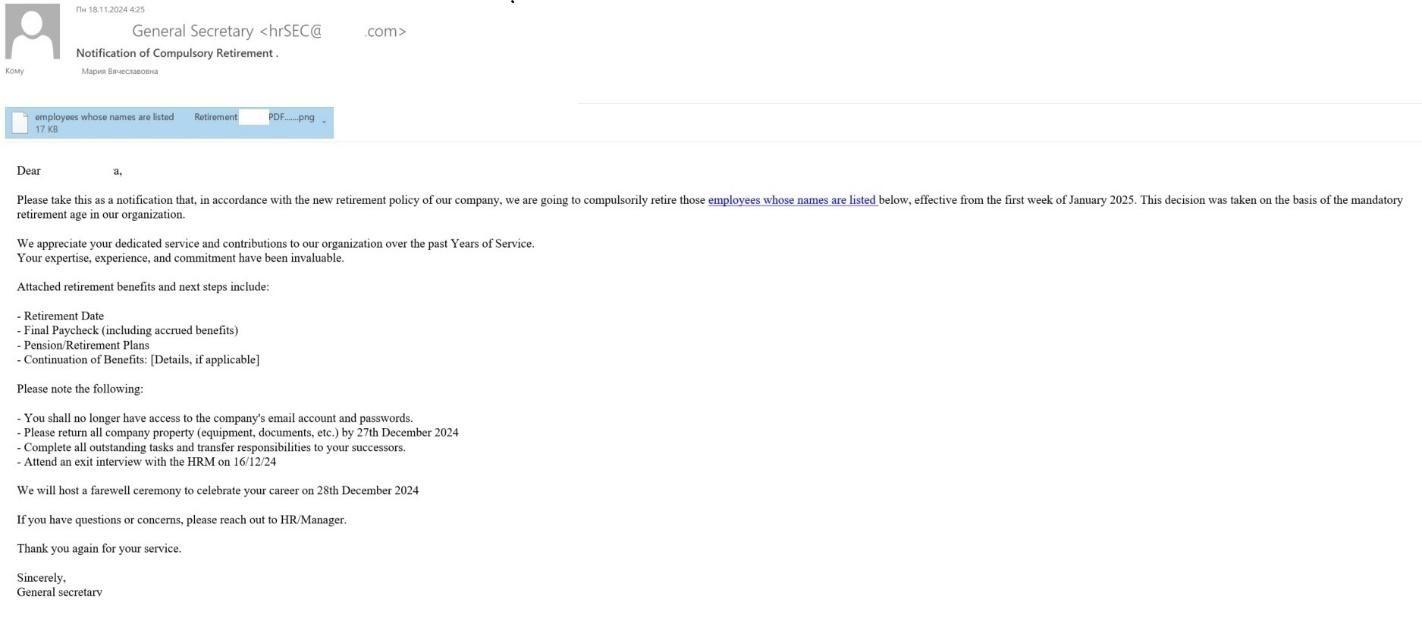
    1. Notifications on behalf of a company’s HR department. Employees were asked to fill out or sign a document, such as a vacation schedule, accessible via a link in an email. Sometimes, instead of routine requests, attackers resorted to more extravagant tactics—such as inviting employees to check if they were on a list of staff to be dismissed.

    Phishing email from HR

    In all these cases, the common factor was that clicking the link led the employee to a phishing login page instead of the actual corporate portal. Most often, attackers targeted Microsoft accounts, though some phishing forms mimicked internal corporate resources.

    Fake login form

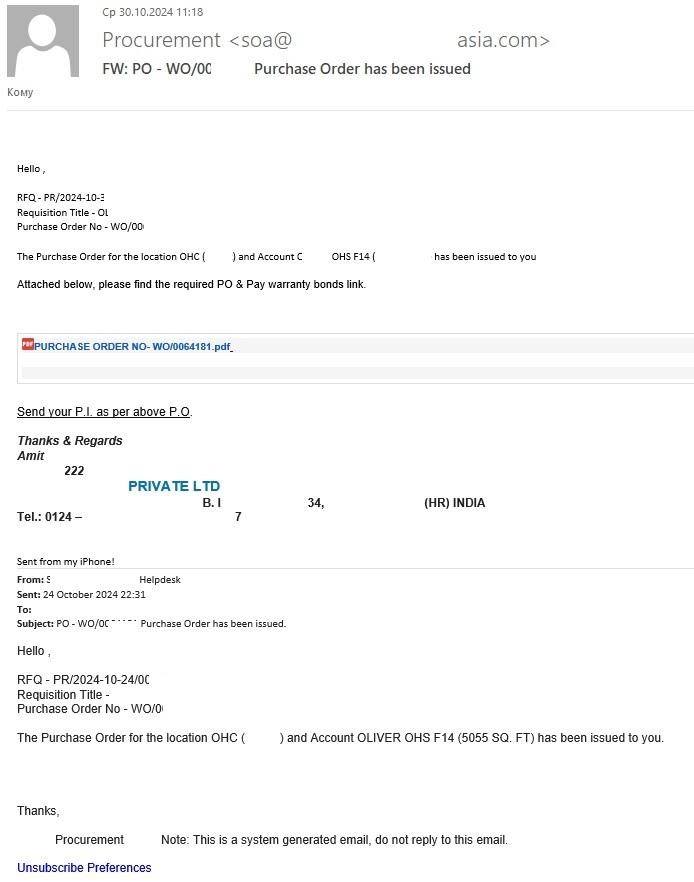
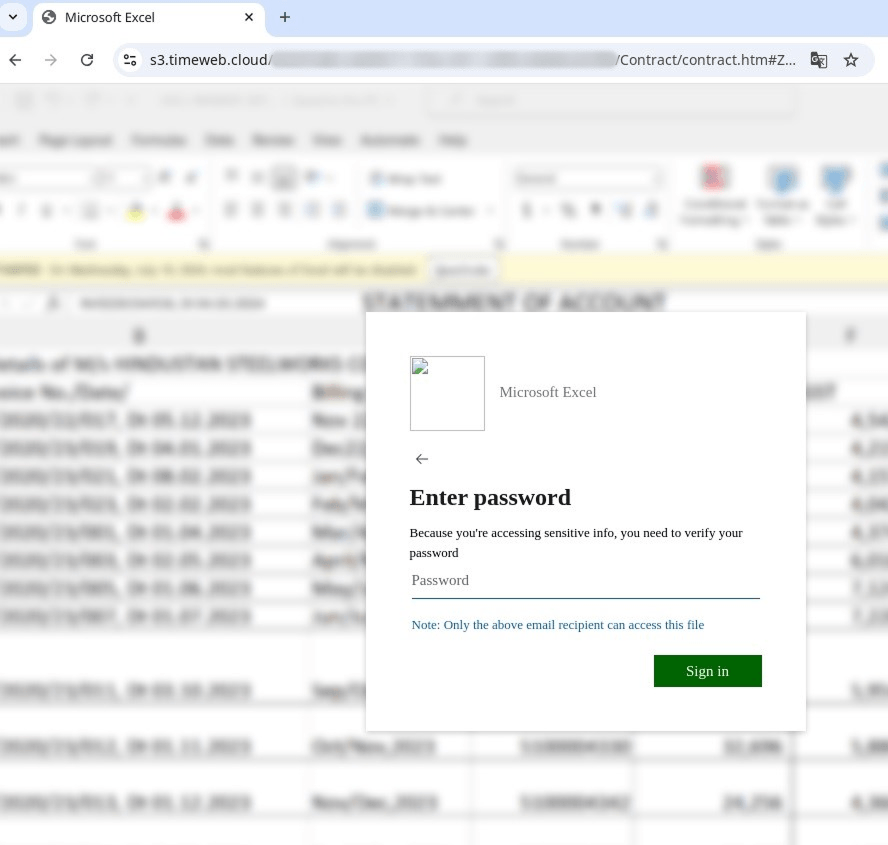
    1. Emails from a seller to a buyer, or vice versa. One common scheme involved a buyer or seller asking the victim to review an offer or respond to questions about product delivery and required specifications. These emails contained attached documents that actually concealed phishing links.

    Example of a phishing email from a seller

    When attempting to open the attachment, the user was redirected to a phishing page. As in the previous case, these fake forms harvested Microsoft credentials and corporate account logins.

    Fake password entry form

    Statistics: phishing

    The number of phishing attacks in 2024 increased compared to the previous year. Kaspersky solutions blocked 893,216,170 attempts to follow phishing links—26% more than in 2023.

    Number of Anti-Phishing triggerings, 2024 (download)

    Map of phishing attacks

    Users from Peru (19.06%) encountered phishing most often. Greece (18.21%) ranked second, followed by Vietnam (17.53%) and Madagascar (17.17%). They are closely followed by Ecuador (16.90%), Lesotho (16.87%) and Somalia (16.70%). The final places in the TOP 10 are occupied by Brunei (16.55%), Tunisia (16.51%) and Kenya (16.38%).

    Country/territory Share of attacked users*
    Peru 19.06
    Greece 18.21
    Vietnam 17.53
    Madagascar 17.17
    Ecuador 16.90
    Lesotho 16.87
    Somalia 16.70
    Brunei 16.55
    Tunisia 16.51
    Kenya 16.38

    * Share of users who encountered phishing out of the total number of Kaspersky users in the country/territory, 2024

    Top-level domains

    The most common domain zone hosting phishing sites remains the COM zone (29.78%)—its popularity has increased one and a half times compared to 2023. In second place is the XYZ domain (7.10%), which ranked fifth last year, followed by TOP (6.97%), which retained its position in the top ten. Next, with a slight margin from each other, are the ONLINE (4.25%) and SITE (3.87%) domain zones, where phishing sites were less actively hosted last year. The Russian RU domain (2.23%) and the global NET domain (2.02%) are in sixth and seventh place, respectively. Following them are CLICK (1.41%) and INFO (1.35%)—the year before, these zones were not frequently used. Closing the top ten is another national domain: UK, with a share of 1.33%.

    Most frequent top-level domains for phishing pages, 2024 (download)

    Organizations targeted by phishing attacks

    The rating of organizations targeted by phishers is based on the detections of the deterministic component in the Anti-Phishing system on user computers. The component detects all pages with phishing content that the user has tried to open by following a link in an email message or on the web, as long as links to these pages are present in the Kaspersky database.

    In 2024, the highest number of attempts to access phishing links blocked by Kaspersky solutions was associated with pages imitating various web services (15.75%), surpassing global internet portals (13.88%), which held the top position in 2023. The third and fourth positions in last year’s top ten also swapped places: banks moved ahead (12.86%), overtaking online stores at 11.52%. Attackers were also interested in social media (8.35%) and messengers (7.98%): attacks targeting them strengthened their positions in the ranking. For websites imitating delivery services, we observed a decline in phishing activity (6.55%), while the share of payment systems remained unchanged at 5.82%. Also included in the list of the most frequently targeted organizations were online games (5.31%) and blogs (3.75%).

    Distribution of organizations targeted by phishers, by category, 2024 (download)

    Statistics: spam

    Share of spam in email traffic

    In 2024, spam emails accounted for 47.27% of the total global email traffic, an increase of 1.27 p.p. compared to the previous year. The lowest spam levels were recorded in October and November, with average shares dropping to 45.33% and 45.20%, respectively. In December, we observed a seemingly slight upward trend in junk emails, resulting in the fourth quarter of the year being the calmest. Spam activity peaked in the summer, with the highest number of emails recorded in June (49.52%) and July (49.27%).

    Share of spam in global email traffic, 2024 (download)

    In the Russian internet segment, the average spam share exceeded the global figure, reaching 48.57%, which is 1.98 p.p. higher than in 2023. As in the rest of the world, spammers were least active at the end of the year: in the fourth quarter, 45.14% of emails were spam. However, unlike global trends, in Runet, we recorded four months during which the spam share exceeded half of all traffic: March (51.01%), June (51.53%), July (51.02%), and September (51.25%). These figures identified the third quarter as the most active, with a share of 50.46%. December was the calmest month, and interestingly, despite spam levels being generally high or the same in Russia, the number of spam emails in December was lower than the global figure: 44.56%.

    Share of spam in Runet email traffic, 2024 (download)

    Countries and territories where spam originated

    We continue to observe an increase in the share of spam sent from Russia—from 31.45% to 36.18%. The United States and mainland China, which held second and third place last year, swapped positions, with China’s share increasing by 6 p.p. (17.11%) and the US share decreasing by 3 p.p. (8.40%). Kazakhstan, which entered the top twenty for the first time last year, rose from eighth to fourth place (3.82%), pushing Japan (2.93%) down, and causing Germany, previously in fifth place, to drop one position with a share of 2.10%. India’s share slightly decreased, but the country moved up two positions from last year to seventh place. Conversely, the amount of spam sent from Hong Kong more than doubled (1.75%), allowing this territory to take eighth place in the top twenty. Next come Brazil (1.44%) and the Netherlands (1.25%), whose shares continued to decline.

    TOP 20 countries and territories where spam originated in 2024 (download)

    Malicious email attachments

    In 2024, Kaspersky solutions detected 125,521,794 attempts to open malicious email attachments, ten million fewer than the previous year. Interestingly, one of the peaks in email antivirus detections occurred in April—in contrast to 2023, when this month had the lowest malicious activity. In January and December, we observed a relative decrease in detections, while increases were noted in spring and autumn.

    Number of email antivirus detections, 2024 (download)

    The most common malicious email attachments were Agensla stealers (6.51%), which ranked second last year. Next were Badun Trojans (4.51%), which spread in archives disguised as electronic documents. The Makoob family moved from eighth to third place (3.96%), displacing the Noon spyware (3.62%), which collects browser passwords and keystrokes. The malicious Badur PDFs, the most common attachments in 2023, dropped to fifth place with a 3.48% share, followed by phishing HTML forms from the Hoax.HTML.Phish family (2.93%). Next in line were Strab spyware Trojans (2.85%), capable of tracking keystrokes, taking screenshots, and performing other typical spyware actions. Rounding out the top ten were SAgent VBS scripts (2.75%), which were not as actively used last year, the Taskun family (2.75%), which maintained its previous share, and PDF documents containing phishing links, Hoax.PDF.Phish (2.11%).

    TOP 10 malware families distributed as email attachments, 2024 (download)

    The list of the most widespread malware reflects trends similar to the distribution of families, with a few exceptions: the Hoax.HTML.Phish variant of malicious HTML forms dropped two positions (2.20%), and instead of a specific Strab Trojan sample, the top ten included the ISO image Trojan.Win32.ISO.gen, distributed via email (1.39%).

    TOP 10 malicious programs distributed as email attachments, 2024 (download)

    Countries and territories targeted by malicious mailings

    In 2024, users in Russia continued to face malicious email attachments more frequently than other countries, although the share of email antivirus detections in this country decreased compared to last year, to 11.37%. China ranked second (10.96%), re-entering the top twenty after several years. Next came Spain (8.32%), Mexico (5.73%), and Turkey (5.05%), which dropped one position each with a slight decline in malicious attachments. Switzerland (4.82%) took sixth place, appearing in the ranking for the first time. Following them were Vietnam (3.68%), whose share declined, and the UAE (3.24%), which strengthened its position in the ranking. Also among frequent targets of malicious spam were users from Malaysia (2.99%) and Italy (2.54%).

    TOP 20 countries and territories targeted by malicious mailings, 2024 (download)

    Conclusion

    Political and economic crises will continue to provide new pretexts for fraudulent schemes. In some cases presented in the 2024 report, we can observe the “greed” of cybercriminals: the use of two different company brands on the same page; a credible fake of a resource aimed not at stealing credentials but at stealing money; comprehensive questionnaires that can lead not only to loss of access to funds but also to identity theft. Such multi-layered threats may become a new trend in phishing and scam attacks.

    We continue to observe major news events being exploited in spam campaigns that promise easy earnings and discounted goods or services. The growing user interest in artificial intelligence tools is actively being leveraged by spammers to attract an audience, and this trend will undoubtedly continue.

    MIL OSI Economics

  • MIL-OSI United Kingdom: UK House Price Index for December 2024

    Source: United Kingdom – Government Statements

    The UK HPI shows house price changes for England, Scotland, Wales and Northern Ireland.

    Tom Curtis/Shutterstock.com

    The December data shows:

    • on average, house prices have fallen by 0.1% since November 2024
    • there has been an annual price rise of 4.6% which makes the average property in the UK valued at £268,000

    England

    In England the December data shows, on average, house prices have not changed since November 2024. The annual price rise of 4.3% takes the average property value to £291,000.

    The regional data for England indicates that:

    • East of England experienced the most significant monthly increase with a movement of 0.6%
    • Yorkshire and the Humber saw the greatest monthly price fall, with a fall of -0.8%
    • the North East experienced the greatest annual price rise, up by 6.7%
    • London saw the lowest annual price growth, at 0%

    Price change by region for England

    Region Average price December 2024 Annual change % since December 2023 Monthly change % since November 2024
    East Midlands £242,000 5.3 0.5
    East of England £340,000 4.4 0.6
    London £549,000 0 -0.3
    North East £161,000 6.7 0.5
    North West £211,000 5.4 -0.4
    South East £384,000 4.4 0.6
    South West £306,000 3.8 -0.3
    West Midlands £244,000 4.2 -0.4
    Yorkshire and the Humber £204,000 5.9 -0.8

    Repossession sales by volume for England

    The lowest number of repossession sales in October 2024 was in East of England.

    The highest number of repossession sales in October  2024 was in the North East.

    Repossession sales October 2024
    East Midlands 6
    East of England 0
    London 11
    North East 13
    North West 21
    South East 8
    South West 2
    West Midlands 5
    Yorkshire and the Humber 11
    England 77

    Average price by property type for England

    Property type December 2024 December 2023 Difference %
    Detached £472,000 £451,000 4.7
    Semi-detached £286,000 £271,000 5.4
    Terraced £240,000 £229,000 4.6
    Flat/maisonette £225,000 £222,000 1.6
    All £291,000 £279,000 4.3

    Funding and buyer status for England

    Transaction type Average price December 2024 Annual price change % since December 2023 Monthly price change % since November 2024
    Cash £277,000 3.7 0
    Mortgage £296,000 4.5 0
    First-time buyer £244,000 4.5 -0.3
    Former owner occupier £352,000 1.8 -0.3

    Building status for England

    Building status* Average price October 2024 Annual price change % since October 2023 Monthly price change % since Setpember 2024
    New build £420,000 17.7 -1.4
    Existing resold property £285,000 1.8 -0.3

    *Figures for the 2 most recent months are not being published because there are not enough new build transactions to give a meaningful result.

    London

    London shows, on average, house prices decreased by 0.3% since November 2024. House prices have shown no annual change meaning the average price of a property is £549,000.

    Average price by property type for London

    Property type December 2024 December 2023 Difference %
    Detached £1,110,000 £1,113,000 -0.3
    Semi-detached £691,000 £681,000 1.6
    Terraced £617,000 £609,000 1.3
    Flat/maisonette £440,000 £445,000 -1.3
    All £549,000 £549,000 0

    Funding and buyer status for London

    Transaction type Average price December 2024 Annual price change % since December 2023 Monthly price change % since November 2024
    Cash £580,000 -2. -0.5
    Mortgage £543,000 0.8 -0.2
    First-time buyer £473,000 0.2 -0.4
    Former owner occupier £677,000 -0.4 -0.1

    Building status for London

    Building status* Average price October 2024 Annual price change % since October 2023 Monthly price change % since September 2024
    New build £566,000 13.4 -4.1
    Existing resold property £553,000 -0.9 -2.9

    *Figures for the 2 most recent months are not being published because there are not enough new build transactions to give a meaningful result.

    Wales

    Wales shows, on average, house prices fell by 0.5% since November 2024. An annual price increase of 3% takes the average property value to £208,000

    There were 4 repossession sales for Wales in October 2024.

    Average price by property type for Wales

    Property type December 2024 December 2023 Difference %
    Detached £325,000 £319,000 1.9
    Semi-detached £206,000 £199,000 3.6
    Terraced £166,000 £160,000 3.6
    Flat/maisonette £132,000 £129,000 2.3
    All £208,000 £202,000 3

    Funding and buyer status for Wales

    Transaction type Average price December 2024 Annual price change % since December 2023 Monthly price change % since November 2024
    Cash £207,000 2.3 -1
    Mortgage £209,000 3.4 -0.3
    First-time buyer £179,000 3.5 -0.6
    Former owner occupier £248,000 2.4 -0.4

    Building status for Wales

    Building status* Average price October 2024 Annual price change % since October 2023 Monthly price change % since September 2024
    New build £362,000 20.5 -0.4
    Existing resold property £206,000 2.4 0.6

    *Figures for the 2 most recent months are not being published because there are not enough new build transactions to give a meaningful result.

    UK house prices

    UK house prices rose by 4.6% in the year to December 2024, up from the revised estimate of 3.9% in the 12 months to November 2024. On a non-seasonally adjusted basis, average house prices in the UK decreased by 0.1% between November 2024 and December 2024, compared with a decease 0.8% from the same period 12 months ago (November and December 2023).

    The UK Property Transactions Statistics showed that in December 2024, on a seasonally adjusted basis, the estimated number of transactions of residential properties with a value of £40,000 or greater was 96,000. This is 18.7% higher than a year ago (December 2023). Between November 2024 and December 24, UK transactions increased by 2.9% on a seasonally adjusted basis.

    House price monthly increase was highest in the East of England where prices increased by 0.6% in the year to December 2024. The highest annual growth was in the the North East, where prices increased by 6.7% in the year to December 2024.

    See the economic statement.

    The UK HPI is based on completed housing transactions. Typically, a house purchase can take 6 to 8 weeks to reach completion. As with other indicators in the housing market, which typically fluctuate from month to month, it is important not to put too much weight on one month’s set of house price data.

    Access the full UK HPI

    Background

    1. We publish the UK House Price Index (HPI) on the second or third Wednesday of each month with Northern Ireland figures updated quarterly. We will publish the January 2025 UK HPI at 9:30am on Wednesday 26 March 2025. See calendar of release dates.
    2. We have made some changes to improve the accuracy of the UK HPI. We are not publishing average price and percentage change for new builds and existing resold property as done previously because there are not currently enough new build transactions to provide a reliable result. This means that in this month’s UK HPI reports, new builds and existing resold property are reported in line with the sales volumes currently available.
    3. The UK HPI revision period has been extended to 13 months, following a review of the revision policy (see calculating the UK HPI section 4.4). This ensures the data used is more comprehensive.
    4. Sales volume data is available by property status (new build and existing property) and funding status (cash and mortgage) in our downloadable data tables. Transactions that require us to create a new register, such as new builds, are more complex and require more time to process. Read revisions to the UK HPI data.
    5. Revision tables are available for England and Wales within the downloadable data in CSV format. See about the UK HPI for more information.
    6. HM Land Registry, Registers of Scotland, Land & Property Services/Northern Ireland Statistics and Research Agency and the Valuation Office Agency supply data for the UK HPI.
    7. The Office for National Statistics (ONS) and Land & Property Services/Northern Ireland Statistics and Research Agency calculate the UK HPI. It applies a hedonic regression model that uses the various sources of data on property price, including HM Land Registry’s Price Paid Dataset, and attributes to produce estimates of the change in house prices each month. Find out more about the methodology used from the ONS and Northern Ireland Statistics & Research Agency.
    8. We take the UK Property Transaction statistics  from the HM Revenue and Customs (HMRC) monthly estimates of the number of residential and non-residential property transactions in the UK and its constituent countries. The number of property transactions in the UK is highly seasonal, with more activity in the summer months and less in the winter. This regular annual pattern can sometimes mask the underlying movements and trends in the data series. HMRC presents the UK aggregate transaction figures on a seasonally adjusted basis. We make adjustments for both the time of year and the construction of the calendar, including corrections for the position of Easter and the number of trading days in a particular month.
    9. UK HPI seasonally adjusted series are calculated at regional and national levels only. See data tables.
    10. The first estimate for new build average price (April 2016 report) was based on a small sample which can cause volatility. A three-month moving average has been applied to the latest estimate to remove some of this volatility.
    11. The UK HPI reflects the final transaction price for sales of residential property. Using the geometric mean, it covers purchases at market value for owner-occupation and buy-to-let, excluding those purchases not at market value (such as re-mortgages), where the ‘price’ represents a valuation.
    12. HM Land Registry provides information on residential property transactions for England and Wales, collected as part of the official registration process for properties that are sold for full market value.
    13. The HM Land Registry dataset contains the sale price of the property, the date when the sale was completed, full address details, the type of property (detached, semi-detached, terraced or flat), if it is a newly built property or an established residential building and a variable to indicate if the property has been purchased as a financed transaction (using a mortgage) or as a non-financed transaction (cash purchase).
    14. Repossession sales data is based on the number of transactions lodged with HM Land Registry by lenders exercising their power of sale.
    15. For England, we show repossession sales volume recorded by government office region. For Wales, we provide repossession sales volume for the number of repossession sales.
    16. Repossession sales data is available from April 2016 in CSV format. Find out more information about repossession sales.
    17. We publish CSV files of the raw and cleansed aggregated data every month for England, Scotland and Wales. We publish Northern Ireland data on a quarterly basis. They are available for free use and re-use under the Open Government Licence.
    18. HM Land Registry is a government department created in 1862. Its vision is: “A world-leading property market as part of a thriving economy and a sustainable future.”
    19. HM Land Registry’s purpose is: “We protect your land ownership and provide services and data that underpin an efficient and informed property market.”
    20. HM Land Registry safeguards land and property ownership valued at £8 trillion, enabling over £1 trillion worth of personal and commercial lending to be secured against property across England and Wales. The Land Register contains more than 26.5 million titles showing evidence of ownership for more than 89% of the land mass of England and Wales.
    21. For further information about HM Land Registry visit www.gov.uk/land-registry.
    22. Follow us on @HMLandRegistry, our blogLinkedIn and Facebook.

    Contact

    Press Office

    Trafalgar House
    1 Bedford Park
    Croydon
    CR0 2AQ

    Email HMLRPressOffice@landregistry.gov.uk

    Phone (Monday to Friday 8:30am to 5:30pm) 0300 006 3365

    Mobile (5:30pm to 8:30am weekdays, all weekend and public holidays) 07864 689 344

    Updates to this page

    Published 19 February 2025

    MIL OSI United Kingdom

  • MIL-OSI Asia-Pac: HK committed to Web3 ecosystem

    Source: Hong Kong Information Services

    Financial Secretary Paul Chan

    It is my pleasure to be here at Consensus Hong Kong 2025. Let me begin by expressing my heartfelt gratitude to CoinDesk for choosing Hong Kong as the first Asian city for hosting this iconic conference. Your decision underscores Hong Kong’s growing prominence as a global hub for Web3 and crypto innovation. This event also reflects our commitment to building a thriving digital asset ecosystem.

    Vast potential of Web3 and AI

    Consensus 2025 is a congregation of Web3 talent from around the world, and its agenda reflects the most pressing topics and trends in the Web3 space today. From the convergence of AI and blockchain to the tokenisation of real-world assets (RWA), crypto and consumers, and DeFi 2.0 (decentralised finance), the discussions here are set to shape the future landscape of digital finance and the digital economy.

    One of the most exciting developments is, of course, the intersection of AI and blockchain, where decentralised AI can unlock many new applications and opportunities. For example, AI can assist blockchain platforms in performing more accurate credit assessments, improving smart contract audits, providing tailored investment advice, and more.

    Globally, the application of Web3 in finance is gaining traction. Blockchain innovations not just reduce transaction costs but also enhance market transparency, and the efficiency and accessibility of financial services. Indeed, we are seeing more institutional adoption where traditional banks, asset managers and brokers increasingly integrate digital assets into their offerings. The benefits are clear. The World Economic Forum, for example, estimates that financial institutions could free up some US$100 billion per year by leveraging distributed ledger technology for collateral management.

    Hong Kong, with its advanced financial infrastructure and robust regulatory environment, is at the forefront of this transformation. Hong Kong has already made history by issuing the world’s first tokenised government green bonds in 2023, followed by a groundbreaking multi-currency issuance in 2024.

    Beyond finance, Web3 plus AI innovations are inspiring a host of applications in the real economy. From streamlining supply chain management to enhancing game players’ experience; and from improving healthcare management to making agricultural and industrial production more intelligent, they are empowering and transforming business operations and public services.

    Rapid tech innovation does not come without challenges. Often, the progress of innovation outpaces regulatory response, creating gaps that can lead to substantial risks. The fallout from several crypto exchanges’ failures in recent years serves as vivid reminders that we must pay attention to market integrity, investor protection, money laundering and cybersecurity risks, as financial products and services continue to innovate and digitalise.

    On a positive note, the history of financial innovations shows that we learnt and adapted fast, and put in better guardrails and became more resilient. The key to success lies in maintaining an open, fair, balanced and forward-looking regulatory approach that is conducive to the sustainable and responsible development of financial innovation, including Web3.

    Hong Kong’s unparalleled advantages

    This is the path taken by Hong Kong. While some major jurisdictions have recently begun to embrace cryptocurrencies, which has undoubtedly fuelled a boom of the crypto market, Hong Kong stands out as a market with consistent, predictable, forward-looking policies, and a balanced regulatory framework. For innovators and companies committed to building the future of Web3, or financial institutions looking to bridge traditional and digital finance, Hong Kong is where you want to be.

    Our regime is premised on the “same activity, same risk, same regulation” principle, which ensures a level playing field for all market participants. In this regard, Hong Kong has already put in place a licensing regime for digital asset trading platforms. Our Securities & Futures Commission has already issued nine such licences, with more in the pipeline. We are also advancing on the regulation of stable coins, and have introduced the relevant piece of legislation.

    To facilitate further innovation, regulatory sandboxes have been set up by our regulators to allow innovators to test and refine their ideas, and to get early regulatory feedback. Besides, initiatives like the Hong Kong Monetary Authority’s Project Ensemble are accelerating the development of tokenisation ecosystems, covering RWAs like fixed income, investment funds, green finance and trade finance.

    Indeed, this pro-innovation and collaborative regulatory approach is a unique value proposition of Hong Kong to Web3 innovators and participants.

    AI is constantly evolving and increasingly applied to finance. Its convergence with blockchain will create more use cases, with both new opportunities to be captured, and challenges to be addressed. Hong Kong has set out a clear policy stance on the use of AI in financial services. The Government and financial regulators are working closely with the industry to monitor technology and market development and establish a transparent supervisory framework.

    Hong Kong’s commitment to Web3 extends beyond regulation. We are investing heavily in the related infrastructure and talent development. Our Cyberport and Science Park have become vibrant hubs for Web3 innovation and fintech, while our universities and partnerships with the industry are nurturing generations of blockchain experts. Through talent admission schemes, we are also attracting top-notch professionals from around the world, ensuring that Hong Kong remains at the cutting edge of technological advancement.

    Concluding remarks

    Ladies and gentlemen, while the tides of change may ebb and flow, the quest for innovation has never stopped. The digital asset market today may somewhat resemble the early days of all great transformative paradigms: as new frontiers emerge, there will always be champions of progress and cautious observers. What remains true is that the market ultimately rewards those who dare to innovate, and adapt and persevere.

    The tides of change are upon us, and Hong Kong is ready to ride the wave. As the Web3 ecosystem continues to evolve, Hong Kong will remain a stable, open and vibrant market for digital assets. I am confident that global companies and institutions will join force with us to lead its development.

    Once again, my heartfelt thanks to CoinDesk for hosting this event in Hong Kong. I wish you all a productive and inspiring event over the next two days. And do remember to take some time to enjoy Hong Kong, Asia’s world city. Thank you.

    Financial Secretary Paul Chan gave these remarks at Consensus Hong Kong 2025 on February 19.

    MIL OSI Asia Pacific News

  • MIL-OSI: MFH’s Majority-Owned Subsidiary Aifinity Base Limited Plans to Manufacture Advanced Liquid Cooling Solutions for Nvidia® Chip-Powered AI Data Centers and High-Performance Computing

    Source: GlobeNewswire (MIL-OSI)

    NEW YORK, Feb. 19, 2025 (GLOBE NEWSWIRE) — Mercurity Fintech Holding Inc. (the “Company,” “we,” “us,” “our company,” or “MFH”) (Nasdaq: MFH), a digital fintech group, today announced the formation of a majority-owned subsidiary in Hong Kong, Aifinity Base Limited (“Aifinity”). Aifinity plans to manufacture advanced liquid cooling panels specifically tailored for artificial intelligence (AI) infrastructure, high-performance computing (HPC), and more specifically, to improve the efficiency and performance of Nvidia® chip-powered GPUs and other high-performance AI accelerators.

    Aifinity Base Limited, will focus on addressing the growing challenge of managing heat in increasingly powerful artificial intelligence (“AI”) systems. By combining innovative liquid cooling technology with smart, easy-to-deploy components, Aifinity intends to manufacture cooling panels to handle the intense heat generated by modern AI computing systems, provided that it can install its manufacturing machinery and equipment properly and timely. In the future, Aifinity aims to expand the cooling panel manufacturing further into comprehensive cooling solutions.

    Aifinity’s Strategic Focus Areas:

    • Next-generation liquid cooling technologies for AI infrastructure and high-density computing
    • Advanced manifold cooling systems optimized for AI accelerators
    • Quick-coupling solutions for efficient cooling system deployment
    • High-efficiency cooling components for data center operations
    • Comprehensive thermal management solutions for AI clusters

    Market Opportunity and Growth Strategy

    With the exponential growth in AI computing power and the increasing adoption of high-performance GPUs, Aifinity believes that the demand for advanced thermal management solutions has never been greater. The Company views this environment as a great opportunity to provide a comprehensive approach that spans customized cooling solutions for diverse AI computing environments, integrated smart monitoring systems for optimal performance, and energy-efficient designs that significantly reduce operating costs. Aifinity plans to leverage its holding company’s network to work closely with leading hardware manufacturers to develop optimized cooling solutions that address the specific needs of next-generation AI infrastructure.

    “Today’s AI systems generate intense heat, and they need cooling solutions that can keep up,” said Shi Qiu, CEO of the Company, the parent company of Aifinity. “Through Aifinity Base Limited, we would like to enter into the thermal management industry and later arrive at the forefront of thermal management innovation.”

    About Mercurity Fintech Holding Inc.
    Mercurity Fintech Holding Inc. is a digital fintech company with subsidiaries specializing in distributed computing, business consulting and financial brokerage business. Our dedication to compliance, innovation, and operational excellence ensures that we remain a trusted partner in the rapidly transforming digital financial landscape. For more information, please visit the Company’s website at https://mercurityfintech.com.

    Forward-Looking Statements
    This announcement contains forward-looking statements within the meaning of the safe harbor provisions of the Private Securities Litigation Reform Act of 1995. All statements other than statements of historical fact in this announcement are forward-looking statements. These forward-looking statements involve known and unknown risks and uncertainties and are based on current expectations and projections about future events and financial trends that the Company believes may affect its financial condition, results of operations, business strategy and financial needs. Investors can identify these forward-looking statements by words or phrases such as “may,” “will,” “expect,” “anticipate,” “aim,” “estimate,” “intend,” “plan,” “believe,” “potential,” “continue,” “is/are likely to” or other similar expressions. The Company undertakes no obligation to update forward-looking statements to reflect subsequent occurring events or circumstances, or changes in its expectations, except as may be required by law. Although the Company believes that the expectations expressed in these forward-looking statements are reasonable, it cannot assure you that such expectations will turn out to be correct, and the Company cautions investors that actual results may differ materially from the anticipated results.

    For more information, please contact:
    International Elite Capital Inc.
    Vicky Chueng
    Tel: +1(646) 866-7989
    Email: mfhfintech@iecapitalusa.com

    The MIL Network

  • MIL-OSI United Kingdom: Chancellor goes further and faster to drive growth by speeding up securities trades

    Source: United Kingdom – Executive Government & Departments

    Financial markets will be modernised to drive capital market competitiveness and deliver growth – the priority of the government’s Plan for Change.

    • Chancellor hosts senior representatives of investment banking and asset management sectors in No11 to hone Financial Services Growth and Competitiveness Strategy. 

    • Meeting comes as government goes further and faster to drive economic growth through the Plan for Change by speeding up settlement of securities trading, such as buying and selling shares. 

    • Change brings the UK in line with best-in-class international markets such as the US, strengthens capital markets competitiveness, and cut costs for investors. 

    • The government, the Financial Conduct Authority and the Bank of England support the industry recommendation to move to T+1 settlement in UK markets by 11 October 2027 and call on industry to engage with the recommendations and start their planning as soon as possible.

    In a meeting with the country’s top bankers, the Chancellor set out a plan to speed up settlement of securities trades which will make the UK’s capital markets more competitive to drive economic growth through the Plan for Change and put more money into people’s pockets. 

    The top brass from JP Morgan, Blackrock, Abrdn, Morgan Stanley, Goldman Sachs, Citi, Fidelity, and Schroders were welcomed into No11 Downing Street for breakfast this morning, as part of ongoing engagement with industry to hone the Financial Services Growth and Competitiveness Strategy – one of the eight key growth sectors identified in the Modern Industrial Strategy.

    Rachel Reeves spoke about the importance of going further and faster to drive growth and revealed that the Government had accepted all recommendations made by the Accelerated Settlement Technical Group – confirming that the UK will move to a ‘T+1’ standard for settling securities trades from 11 October 2027.

    The change means that a typical securities trade, such as buying and selling shares, would be settled the day after it is agreed – instead of the current two-day standard. Faster settlement will support economic growth by putting the UK at the forefront of modernised, highly efficient and automated capital markets, bringing the UK into line with key international markets such as the US and reducing costs for investors by limiting risks when making trades.

    Chancellor of the Exchequer, Rachel Reeves said: 

    I am determined to go further and faster to drive growth and put more money into people’s pockets through our Plan for Change. Speeding up the settlement of trades makes our financial markets more efficient and internationally competitive.

    Chief Executive Officer of the Financial Conduct Authority, Nikhil Rathi said: 

    We highlighted how the move to T+1 will make our markets more efficient and support growth in our recent letter to the Prime Minister. We will support industry as they move to T+1 and expect firms to engage and plan early.

    Governor of the Bank of England, Andrew Bailey said: 

    Shortening the UK securities settlement cycle to T+1 will bring important financial stability benefits from reduced counterparty credit risk in financial markets. It is important that firms and settlement infrastructures have robust plans for an orderly transition in October 2027. As part of this effort, the Bank looks forward to continuing dialogue with regulators in other markets which are pursuing similar changes.

    The government has accepted all the recommendations made by the Accelerated Settlement Technical Group, which has created a detailed implementation plan to ensure a smooth transition to T+1, and confirmed that it will bring forward legislation to implement the change, including setting the date to move to the new standard. 

    Terms of Reference have been published for the next phase of the project, which will continue to be led by the industry taskforce with Andrew Douglas as chair and HMT, the FCA and the Bank as observers. Industry chairs from the EU and Switzerland have also been invited to observe the UK industry taskforce to encourage alignment across Europe.

    The taskforce will oversee and manage implementation of the recommendations up until T+1 is successfully implemented, and for a short period afterwards to evaluate the short-term impacts.

    The government, the Financial Conduct Authority and the Bank of England support the industry recommendation to move to T+1 settlement in UK markets by 11 October 2027 and call on the industry to engage with the recommendations and start their planning as soon as possible.

    Notes to editors 

    Stakeholder commentary:

    Tiina Lee, Chief Executive Officer of Citi UK said:

    We welcome the move to a T+1 settlement cycle in UK markets and appreciate the hard work in achieving the alignment of timelines with the EU. Based on Citi’s experience with global investors, coordinated market reforms are critical to the growth and competitiveness of the UK. We look forward to working with other industry participants to ensure a smooth transition in October 2027.

    Conor Hillery, Deputy CEO & Head of Investment Banking in EMEA, JP Morgan, said:

    We welcome the Chancellor’s continued dialogue with UK financial services on its role in facilitating growth, which requires the right policy and regulatory framework. This move to a modern T+1 settlement cycle will contribute to keeping London as a competitive financial centre, so we support the government’s efforts to make it happen.

    Clare Woodman, Head of EMEA and CEO of Morgan Stanley said:

    We welcome the UK Government’s commitment to move to a T+1 settlement cycle in October 2027. The shift to a shorter settlement cycle will generate market efficiencies supporting the competitiveness of UK markets.

    Additional notes:

    • The Accelerated Settlement Taskforce recommended that the UK should move to T+1 by the end of 2027. The Technical Group was set up to recommend a detailed implementation plan, including determining the detailed technical and operational changes needed to move to T+1 as well as recommending a precise implementation date. 

    • The group’s recommendations are set out in The Accelerated Settlement Taskforce Technical Group report, published on 6 February. 

    • The government’s response to the report and Terms of Reference for the next stage of the project can be found on the Accelerated Settlement (T+1) GOV.UK page 

    • To support firms during the transition, the FCA has launched a webpage dedicated to the UK’s move to T+1 settlement, where firms can access further information, key messages and links to relevant materials.

    • The Bank will support the relevant financial market infrastructures (FMIs) it supervises during the transition to T+1. It will discuss with relevant FMIs their preparedness for T+1 settlement and will encourage them to take appropriate implementation action. 

    • The businesses in attendance at the meeting in No11 were: JP Morgan; Blackrock; Abrdn; Morgan Stanley; Goldman Sachs; City; Fidelity; Schroders. Pictures will be uploaded to HM Treasury’s Flickr.

    Updates to this page

    Published 19 February 2025

    MIL OSI United Kingdom

  • MIL-OSI: Bitget Launches A New Round of Global Builders Recruitment to Co-build the Bitget Ecosystem

    Source: GlobeNewswire (MIL-OSI)

    VICTORIA, Seychelles, Feb. 19, 2025 (GLOBE NEWSWIRE) — Bitget, the leading cryptocurrency exchange and Web3 company, announced the expansion of its global recruitment initiative Bitget Builders Program which invites crypto enthusiasts from various backgrounds to co-build the Bitget ecosystem while unlocking exclusive benefits, event access, and growth opportunities. 

    Starting February 2025, the Bitget Builders Program will launch a long-term global recruitment of builders who are exploring deeply in blockchain industry and in line with Bitget’s vision of driving blockchain innovation and adoption. The recruitment program is not limited to any specific country, so applications for this program are invited from all over the world. Builders will engage in a variety of roles that align with their skills and interests while gaining rewards for their contributions. Top-performing participants will have the opportunity to earn exclusive invitations to Token 2049 in Dubai, as well as a face-to-face meetup with Bitget COO Vugar Usi Zade.

    Build Bitget with Vugar” events will serve as a dialogue between Bitget’s leadership and its global community. Bitget COO Vugar Usi Zade will lead a series of interactive sessions to share insights into Bitget’s strategic vision, core values, and future roadmap. Through AMAs, workshops, and networking sessions, participants will gain firsthand knowledge of Bitget’s ecosystem strategy and collaborate on shaping its evolution. 

    So far over 5,000 participants in Bitget Builders Program have played a significant role in Bitget’s global expansion by organizing community events, promoting high-profile projects, and managing local engagement. This year, community managers will be upgraded to Bitget Builders and gain enhanced benefits. In addition, Bitget Builders will spearhead the “Global Meetup Tour,” kicking off in cities around the world to expand Bitget’s global footprint and strengthen community ties. 

    “The Bitget Builders Program embodies our belief in community-driven growth. By empowering builders with resources and recognition, we’re accelerating the creation of a more inclusive and innovative crypto ecosystem,” said Vugar Usi Zade, COO at Bitget. “Bitget believes Gen Z and younger crypto users, who grow up with the increasing adoption of crypto, will be playing a vital role in promoting crypto adoption. We’re excited to meet passionate individuals worldwide through our events and build Bitget’s future together.”

    The Bitget Builders Program is a pivotal component of the Blockchain4Youth charity project, which aims to empower young talents and foster innovation within the crypto space. This innovative initiative has successfully brought participants from more than 55 countries and is dedicated to providing opportunities with thriving Web3 talents, deeply integrating the next generation of crypto leaders into the Bitget ecosystem, and fostering a robust crypto community. 

    For more details on the Bitget Builders Program, users can visit here.

    About Bitget
    Established in 2018, Bitget is the world’s leading cryptocurrency exchange and Web3 company. Serving over 100 million users in 150+ countries and regions, the Bitget exchange is committed to helping users trade smarter with its pioneering copy trading feature and other trading solutions, while offering real-time access to Bitcoin priceEthereum price, and other cryptocurrency prices. Formerly known as BitKeep, Bitget Wallet is a world-class multi-chain crypto wallet that offers an array of comprehensive Web3 solutions and features including wallet functionality, token swap, NFT Marketplace, DApp browser, and more.
    Bitget is at the forefront of driving crypto adoption through strategic partnerships, such as its role as the Official Crypto Partner of the World’s Top Football League, LALIGA, in EASTERN, SEA and LATAM market, as well as a global partner of Turkish National athletes Buse Tosun Çavuşoğlu (Wrestling world champion), Samet Gümüş (Boxing gold medalist) and İlkin Aydın (Volleyball national team), to inspire the global community to embrace the future of cryptocurrency.

    For more information, users can visit: Website | Twitter | Telegram | LinkedIn | Discord | Bitget Wallet

    For media inquiries, users can contact: media@bitget.com

    Risk Warning: Digital asset prices are subject to fluctuation and may experience significant volatility. Investors are advised to only allocate funds they can afford to lose. The value of any investment may be impacted, and there is a possibility that financial objectives may not be met, nor the principal investment recovered. Independent financial advice should always be sought, and personal financial experience and standing carefully considered. Past performance is not a reliable indicator of future results. Bitget accepts no liability for any potential losses incurred. Nothing contained herein should be construed as financial advice. For further information, please refer to our Terms of Use.

    Contact

    Simran Alphonso
    media@bitget.com

    A photo accompanying this announcement is available at https://www.globenewswire.com/NewsRoom/AttachmentNg/6b5c114c-6fa7-4f71-922b-2000aaaf9b97

    The MIL Network

  • MIL-OSI Economics: Media release: North West Shelf extension delay another regulatory fail – Australian Energy Producers

    Source: Australian Petroleum Production & Exploration Association

    Headline: Media release: North West Shelf extension delay another regulatory fail – Australian Energy Producers

    The Federal Government’s decision to delay its assessment of the North West Shelf extension is a blow to Western Australia’s energy security and another example of how our national environmental laws are failing.

    Australian Energy Producers Chief Executive Samantha McCulloch said the North West Shelf project has been powering WA homes and industry for 40 years and will play a critical role in the state’s future energy security and economic prosperity.

    “After six years of environmental assessment and having secured state government approval, there is simply no justification for further regulatory delays,” Ms McCulloch said.

    “This is yet another example of the open-ended and uncertain approval processes that are driving away investment and damaging Australia’s reputation as a stable, predictable country to do business.

    “The extension of the North West Shelf project is needed to ensure reliable and affordable gas supply to Western Australians, with the Australian Energy Market Operator forecasting gas shortfalls in the State from 2030.”

    WA’s gas industry is a driving force behind the state’s economy, providing 54 per cent of WA’s primary energy and 60 per cent of the state’s electricity. The industry contributes $35 billion a year to the WA economy and supports more than 73,000 jobs in the state.

    Natural gas also provides more than half the energy used by WA’s mining and minerals processing sector and supports emissions reductions in WA and the region.

    A recent independent report by EnergyQuest found that without new gas investment, Western Australia would run out of gas for electricity from the early-2030s and its mining and industrial sectors would be left without gas from mid-2030s.

    “The Federal Government must provide certainty to the millions of WA households and businesses that depend on gas and rule out any further delays to this critical energy security project,” Ms McCulloch said.

    MIL OSI Economics

  • MIL-OSI United Kingdom: Flamingo Land accused of “distortion and disinformation” in mega-resort appeal

    Source: Scottish Greens

    Loch Lomond does not need a garish mega-resort

    Flamingo Land has been accused of “shifting the goalposts and using “distortion and disinformation” in its desperate bid to build a garish and widely opposed mega-resort on the shores of Loch Lomond.

    The application for a sprawling tourist resort on the southern shore of Loch Lomond at Balloch was unanimously rejected by the National Park’s board.

    This came after 155,000 people lodged their objections through a long-running campaign led by Scottish Green MSP Ross Greer. Objections also came in from the Woodland Trust, Ramblers Scotland, the National Trust for Scotland and environmental watchdog SEPA.

    The appeal has been slammed as “desperate” by Mr Greer, who has submitted a detailed response accusing the developer of distorting facts, shifting goalposts and making false assertions.

    Mr Greer said:

    “Flamingo Land’s appeal is based on distortion and disinformation. They are trying to shift the goalposts, bend the truth and misrepresent their own proposals. It is a desperate attempt to overturn the unanimous decision by the Park board to reject their application.

    “Our campaign to save Loch Lomond from Flamingo Land’s destructive proposals secured a record 155,000 objections. The National Park’s own expert planning officers even opposed it, as did Scotland’s national environment watchdog, SEPA and the Community Council.

    “The fact that Flamingo Land have come back with this outright nonsense shows the contempt they have for Balloch and Loch Lomond.

    “They have spent a decade trying to exhaust the community into submission, but they have lost at every step. I urge the Scottish Government to reject these catastrophic plans and end this sorry saga.”

    As Mr Greer documents in his objection, Flamingo Land’s appeal includes a number of errors and distortions:

    • Flamingo Land claims the National Park could have insisted the overall scale of the application be reduced. It is their responsibility as the applicant to reduce the size of their application, if that is what they think is necessary. Over the course of almost a decade they haven’t done this, they have just moved the pieces around the map. At no point during the planning hearing did they suggest a reduction in scale. Under planning law the Scottish Government must make a decision based on what Flamingo Land actually submitted, not a theoretical smaller application which they didn’t submit but seem to be suggesting now.
    • They are trying to use National Planning Framework policies on housing to argue in their favour, but this isn’t a housing development, it’s a tourist resort. Ross Greer’s submission states that this claim is outright misleading.
    • They claim the National Park’s assessment of the resort’s economic impact was ‘neutral’ when the Park report actually said ‘The scale of the development proposed with the identified risk of flooding, and reduction in the extent of woodland, is not compatable [sic] development in view of the National Park’s environment and economy.’ 
    • They are trying to claim an exemption from the flooding concerns which were fundamental to the National Park board’s rejection of their application, but still haven’t done the “further flood risk work” which SEPA say is required
    • They failed to update their Environmental Impact Assessment to reflect the (inadequate) flood mitigation proposals already included in the application. These mitigations would require groundwork in areas where their own testing found contamination close to the surface, creating a new risk.

    Flamingo Land’s plans included two hotels, a waterpark, over 100 woodland lodges, 370 parking spaces, a monorail, shops, restaurants and more on the proposed site at Balloch. Their own assessment shows that this would result in over 250 additional car journeys per hour on local roads at peak times.

    MIL OSI United Kingdom

  • MIL-OSI: Beincom Charts a Course for Community Growth and Innovation with 2025 Roadmap

    Source: GlobeNewswire (MIL-OSI)

    HO CHI MINH CITY, Vietnam, Feb. 19, 2025 (GLOBE NEWSWIRE) — Beincom, the social platform redefining how online communities connect and engage, recently unveiled an ambitious roadmap for 2025. Showcased at a recent event, the roadmap underscores Beincom’s commitment to fostering a vibrant ecosystem driven by user engagement and cutting-edge technology.

    The year 2025 promises to be transformative for Beincom, with key initiatives aimed at building a robust community and solidifying its place as a leader in the social networking space.

    Early 2025 will see Beincom officially operate as a fully integrated Web2-Web3 platform, moving beyond the ‘laying the foundation’ phase. All web3 features, including the highly anticipated $BIC token and $BIC Wallet, will be implemented on the mainnet, empowering users with new ways to interact and transact within the platform. Simultaneously, the debut of Beincom’s NFT marketplace will open doors for users to explore the exciting world of digital asset ownership.

    As 2025 progresses, Beincom will focus on expanding the utility of the $BIC token and exploring innovative revenue-generation models that benefit both the platform and its users. User experience remains paramount, with ongoing enhancements designed to make Beincom even more intuitive and enjoyable. The platform will also broaden the applications of NFTs, further integrating them into the Beincom experience.

    In the third quarter of 2025, Beincom plans a significant upgrade to the $MedalLegends platform and introduces integration between Group & Chat to strengthen community bonds and facilitate meaningful interactions.

    Culminating the year, Beincom will launch Deep-Ads and Token-Paid Direct Messaging (TPDM V1) features, offering novel approaches to advertising and creating more value-driven communication between users. The introduction of the Social Hub (V1) will further enhance Beincom’s ability to serve as a central hub for online communities, providing unparalleled tools and resources. As part of its ambitious plans, Beincom aims to host the “Community of the Year 2025 Awards”, continuing its tradition of honoring the most impactful communities on the platform.

    Beincom’s 2025 roadmap clearly signals its dedication to innovation and its vision for a future where online communities are more connected, empowered, and engaged than ever before.

    About Beincom:

    Beincom is a pioneering SocialFi platform on a mission to connect communities, provide real value, and promote creativity through blockchain technology. With a vision to become a leading “social hub”, Beincom is committed to continuously developing, innovating, and creating a sustainable ecosystem for its users.

    Register to become an early user of Beincom at: Sign Up

    For more details about Beincom, visit: X | Fanpage | Website

    Media contact:
    Beincom Global Ltd.
    Contact person: Mr. Nguyen Thuong – Associate Growth & Marketing Manager
    Email: marketing-growth@beincom.com

    Disclaimer: This content is provided by Beincom. The statements, views, and opinions expressed in this content are solely those of the sponsor and do not necessarily reflect the views of this media platform. We do not endorse, verify, or guarantee the accuracy, completeness, or reliability of any information presented. This content is for informational purposes only and should not be considered as financial, investment, or trading advice. Readers are strongly encouraged to conduct their own research and consult with a qualified financial advisor before investing in or trading cryptocurrency and securities .Please conduct your own research and invest at your own risk.

    Photos accompanying this announcement are available at:

    https://www.globenewswire.com/NewsRoom/AttachmentNg/f91dfbb1-90d4-4040-8b7a-f8078e0df232

    https://www.globenewswire.com/NewsRoom/AttachmentNg/34f0aa02-45f2-445b-bbaa-0b5c3fd8dc6a

    https://www.globenewswire.com/NewsRoom/AttachmentNg/cd0b2e10-2642-40c0-a297-1c425216e622

    The MIL Network

  • MIL-OSI Economics: Panasonic Group Q3 FY2025 Financial Results Key Points

    Source: Panasonic

    Headline: Panasonic Group Q3 FY2025 Financial Results Key Points

    Panasonic Group announced its financial results for the third quarter of FY2025 on February 4. This fact sheet provides an overview of the results in an easy-to-understand infographic format. For more detailed information, please refer to the full financial results and presentation.

    MIL OSI Economics

  • MIL-OSI: Terranet AB – Year-end report 2024

    Source: GlobeNewswire (MIL-OSI)

    Significant events during the fourth quarter 

    Agreement with an actor in the mining industry
    Terranet entered into a partnership agreement with a vehicle actor in the mining industry. The collaboration is part of the company’s strategy to enable the expansion of the technology into new application areas and strengthen BlincVision’s commercial potential.

    Product development plan for 2025
    Terranet presented an updated product development plan focusing on further developing the BlincVision prototype into an MVP (Minimum Viable Product). With an MVP that customers can test in their own vehicles, the path toward volume production can begin.

    TO8 exercised at 88 percent
    The company raised approximately SEK 17.2 million before issuance costs through the exercise of series TO8B warrants. The strong outcome reflects shareholders’ confidence in the company and its future development.

    Significant events after the end of the period

    New CEO appointed
    Terranet’s board has appointed Lars Lindell as the new CEO. Lars has over 30 years of international experience leading technology companies in the automotive and telecom industries. He will assume the role starting March 10, 2025. Until then, CFO Dan Wahrenberg will serve as interim CEO.

    Financial overview

      Oct – Dec
    2024
    Oct – Dec 2023 Jan – Dec 2024 Jan – Dec 2023
    Revenue (TSEK) 1 205 283 834
    Operating result (TSEK) -9,555 -9,219 -35,808 -35,926
    Financial items (TSEK) -482 -33.608 -3,292 -37,190
    Earnings per share (SEK) -0,01 -0,06 -0,04 -0,15
    Closing cash (TSEK) 18,541 29 006 18,541 29 006

    Comment from the CEO

    ” With new partnerships and progress in product development, we are laying the foundation for 2025.”

    The fourth quarter has brought several important advancements for Terranet. BlincVision was integrated into a partner’s vehicle and tested in a new environment. We initiated a collaboration with a player in the mining industry and secured funding for continued development. At the same time, we are preparing for 2025 with a new CEO and expanded resources within product development.

    BlincVision expands its application area
    In December, we took a step beyond the traditional automotive industry by entering into a collaboration agreement with a player in the mining industry. This partnership highlights BlincVision’s flexibility and its potential to create value across multiple sectors. By broadening the use of our technology, we strengthen our strategy and open up new opportunities for the future.

    Progress in development and innovation
    Over the past year, BlincVision has progressed from concept to prototype, successfully tested both in a lab environment and in moving vehicles. The autonomous braking at AstaZero marked a significant milestone, confirming the potential of our technology in real-world traffic scenarios. During the fourth quarter, BlincVision was integrated into a partner’s vehicle via MobilityXlab. Testing in new environments is evaluating the system’s robustness and adaptability. This collaboration provides valuable insights that help us meet our partner’s requirements and move closer to commercial application.

    Beyond the MobilityXlab partnership, Terranet remains actively involved in research projects aimed at enhancing traffic safety. Through the VERDAS and VERDAS2 projects, we collaborate with several leading players in the automotive industry.

    The communicated product development plan for 2025 sets clear milestones moving forward. The goal is to refine BlincVision into an MVP focusing on core functions. An MVP enables deeper customer dialogues on volume production. To accelerate progress, additional resources are being allocated to development.

    Strong participation in T08
    During the fourth quarter, subscription warrants of series T08 were exercised at a rate of 88 percent, adding SEK 17.2 million to the company before issuance costs. We thank our shareholders for your trust and for recognizing BlincVision’s potential to set a new standard for faster and more reliable driver assistance systems.

    New CEO
    In October, Magnus Andersson announced his resignation as CEO, and he left the company in early 2025. We thank Magnus for his dedication and leadership, which has taken the company from research and development to a prototype and partnership agreements. The board has appointed Lars Lindell as the new CEO. With over 30 years of international experience leading fast-growing tech companies, he will assume the role starting March 10, 2025. We look forward to welcoming Lars and starting the next chapter of Terranet’s development.

    Dan Wahrenberg
    Acting CEO
    Lund February 19, 2025

    This information is such that Terranet AB is required to make public in accordance with the EU’s Market Abuse Regulation (MAR). The information was made public by the Company’s contact person below on 19 February 2025, at 08.30 CET.

    For more information, please contact:
    Dan Wahrenberg, acting CEO
    E-mail: dan.wahrenberg@terranet.se

    About Terranet AB (publ) 
    Terranet’s goal is to save lives in urban traffic. The company develops innovative technical solutions for Advanced Driver Assistance Systems (ADAS) and Autonomous Vehicles (AV). Terranet’s anti-collision system BlincVision laser scans and detects road objects up to ten times faster than any other ADAS technology available today.
    The company is headquartered in Lund, with offices in Gothenburg and Stuttgart. Since 2017, Terranet has been listed on Nasdaq First North Premier Growth Market (Nasdaq: TERRNT-B).

    Follow our journey at: https://terranet.se/
    Terranet financial reports:  https://terranet.se/en/reports/

    Certified Adviser to Terranet is Mangold Fondkommission AB, 08-503 015 50, ca@mangold.se.

    Attachments

    The MIL Network

  • MIL-OSI China: ‘Ne Zha 2’ crowned world’s highest-grossing animated film

    Source: China State Council Information Office 3

    The record-breaking “Ne Zha 2” has now officially become the highest-grossing animated film of all time.

    A new poster to mark “Ne Zha 2” becoming the No. 1 animated film of all time. [Image courtesy of CMC Pictures]

    By Wednesday noon, the unstoppable Chinese animated sensation had grossed 12.42 billion yuan ($1.71 billion) worldwide according to Chinese box office tracker Maoyan Pro. This surpasses Disney and Pixar’s “Inside Out 2,” which claimed the top spot in animation history in 2024 by grossing $1.69 billion, per Box Office Mojo statistics. 

    As a result, “Ne Zha 2” has become the highest-grossing animated film globally and the eighth-highest-grossing film of all time, regardless of animation or live-action. Notably, it stands as the only Chinese or Asian film in a club dominated by Hollywood cinematic juggernauts.

    This is just one of many impressive milestones the film has achieved since its debut on Jan. 29, the first day of the Chinese New Year. Its accomplishments include becoming the highest-grossing Chinese film ever, the highest-grossing film in a single market globally, the first film to surpass $1 billion in a single market, and the first non-Hollywood film to enter the coveted billion-dollar club. 

    “Thanks to the support of countless audiences, we have been able to achieve these miraculous accomplishments,” said Wang Jing, executive producer of “Ne Zha 2,” during an event promoting movie-themed tourism on Feb. 17 at the China National Film Museum in Beijing. “Rooted in Chinese culture, ‘Ne Zha 2’ reflects the spirit of constant innovation and striving to move upward, embodied by Chinese animators, filmmakers and audiences, showcasing the brilliance of Chinese culture to the world.”

    “Congratulations to director Jiaozi and all Chinese animators,” said fellow animator Wang Yunfei, president of Its Cartoon Animation Studio. “Animation is an art form that creates new worlds and new life, which is why I still love it after 25 years in the industry.” Wang told China.org.cn that he hopes Chinese animators will embrace the belief that the journey itself is invaluable at this historic moment. “If you do not climb high mountains, you will not know how high the sky is. Keep your passion alive and continue forging ahead,” he said.

    A still from “Ne Zha 2.” [Image courtesy of Enlight Media]

    “Ne Zha 2” was developed over five years with a 4,000-strong team, featuring new characters, epic battle sequences and 1,900 special effects shots. In the film’s climactic battle, there are 200 million characters, showcasing wild imagination, a visual feast and immense workloads. The film involved the combined efforts of 138 Chinese animation and VFX companies, including teams that worked on previous animated hits and sci-fi blockbusters such as “Monkey King: Hero Is Back,” “Boonie Bears,” “Jiang Ziya: Legend of Deification” and “The Wandering Earth.”

    On social media, many animators who worked on the movie have expressed their excitement and happiness about joining the project, while a few also shared how exhausting the creative process was and how much of a perfectionist director Jiaozi is, challenging them to push their limits. Chen Xuguang, director of the Institute of Film, Television and Theatre at Peking University, noted that the film showcases the collaborative power of China’s creative ecosystem and signals an upgrade in both the film industry and its aesthetic standards.

    Wang Shiyong, founder and CEO of Wuhan-based 2:10 Animation, and his team contributed to many visually spectacular scenes in “Ne Zha 2.” He expressed pride in the film’s achievements and emphasized its significance to the Chinese animation industry. “The film’s outstanding box office performance will attract more investment and talent to the animation industry, injecting strong vitality into its development,” he said.

    As this world-class film climbs the global top 10 box office chart, its achievements have already stunned both domestic and international audiences, as well as industry insiders, showcasing the prowess and potential of Chinese cinema, culture and its market. Maoyan Pro analysts have now revised their projection for its total earnings to 15.1 billion yuan, which would be enough to place the film at No. 5 on the all-time global box office chart.

    The film drew significant international attention and interest after it opened overseas last week in North America, Australia, New Zealand, Fiji and Papua New Guinea. The film earned $7.2 million in North America from Feb. 14 through Sunday, setting a record for the highest opening weekend for any Chinese-language film in the past 20 years. Despite showing in only 660 theaters, it ranked No. 5 on the weekend chart, competing with Marvel’s “Captain America: Brave New World” which was shown in more than 4,000 theaters. In Australia, it secured third place with $1.5 million over the weekend.

    A new international poster to mark “Ne Zha 2.” [Image courtesy of Enlight Media]

    Both overseas critics and audiences have expressed their enjoyment of the movie. For example, critic Simon Abrams from RogerEbert.com wrote that “Ne Zha 2” is a “rare sequel that amplifies both its action and drama” without sacrificing much of what worked in the first movie, adding: “It’s also a rare blockbuster that offers something worthwhile for a wide-ranging audience.” Another critic, Fred Topel from Deadline.com, called the Chinese blockbuster “visually engaging,” noting that, “The rendering of martial arts battles is as graceful as DreamWorks Animation’s ‘Kung Fu Panda’ series. The myriad creatures should appeal to international fans of fantasy epics like ‘Game of Thrones’ and ‘The Lord of the Rings.’” On Rotten Tomatoes, its audience score has reached 99%, and on IMDb, it has also received an impressive 8.4/10 based on more than 4,300 user ratings.

    Distributors announced on Tuesday that the film will be released in China’s Hong Kong and Macao on Feb. 22, with plans to roll out in various international territories later this year, including Malaysia, Saudi Arabia, Japan and Greece.

    Additionally, “Ne Zha 2” is generating a ripple effect beyond movie theaters, showcasing how its positive influence extends to culture, tourism, catering, merchandise and stock markets, further boosting China’s vibrant consumption and dynamic economy.

    MIL OSI China News

  • MIL-OSI: Capital reserved for buybacks increased to $120 million over next 3 years

    Source: GlobeNewswire (MIL-OSI)

    THE INFORMATION CONTAINED HEREIN IS NOT FOR RELEASE, PUBLICATION OR DISTRIBUTION IN OR INTO AUSTRALIA, CANADA, ITALY, DENMARK, JAPAN, THE UNITED STATES, OR TO ANY NATIONAL OF SUCH JURISDICTIONS.

    St Peter Port, Guernsey   19 February 2025

    This announcement contains information that qualifies or may qualify as inside information under the UK Market Abuse Regulation and the EU Market Abuse Regulation.

    The person responsible for arranging the release of this announcement on behalf of NB Private Equity Partners Limited is James Christie, Company Secretary.

    NB Private Equity Partners (“NBPE” or the “Company”) increases capital reserved for buybacks

    In light of the current environment and the persistent level of discounts within the listed private equity sector and following a period of consultation with shareholders and advisors, the NBPE Board has decided to significantly increase the amount of capital reserved for buybacks and to clarify its capital allocation framework.

    NBPE has a strong history of returning capital to shareholders, having distributed over $420 million since inception, primarily in the form of dividends. The Board has also historically allocated meaningful capital to share buybacks, subject to certain undisclosed criteria. Given persistently wide discounts in the listed private equity sector, including NBPE, the Board has decided to reserve $120 million to be available for share buybacks over the next three years, subject to the criteria below.

    This decision underscores the Board’s confidence in NBPE’s portfolio and the NAV accretion opportunity that buybacks present. NBPE’s co-investment model provides the flexibility to increase the company’s allocation to buybacks due to the resulting low unfunded commitments and strong capital position. Maintaining the current dividend level and fully utilising the additional capital allocated to buybacks would result in NBPE returning approximately $250 million to shareholders over the next three years.

    In 2025 year to date, NBPE has repurchased 148,746 shares, amounting to $2.9 million and resulting in NAV accretion of ~$0.02 per share.

    Key Components of NBPE’s Capital Allocation Framework

    The Company’s capital allocation framework is made up of two pillars: allocating capital to NBPE’s investment program and returning capital to shareholders in the form of dividends and buybacks. In balancing these capital allocation pillars, the Board is focused on long term shareholder returns and considers factors such as the Company’s financial position, the discount to net asset value, NBPE’s investment level relative to targets and the vintage year diversification of the portfolio.

    New Investments

    Over the long term the Board views new investment as the principal use of the Company’s capital. The manager has a strong track record in co-investments and over the long term it is new investments that the Board expects will continue to drive performance and NAV growth. NBPE’s co-investment approach offers a compelling value proposition, with an industry leading manager sourcing and executing co-investments alongside top tier private equity firms. We believe that the long-term return potential and high fee efficiency of this approach offer a unique value proposition. Currently, NBPE is 102% invested. The Board considers a target investment range of 100-110% to be optimal, although investment levels may fluctuate above or below target. 

    Return of Capital

    • The Board remains committed to NBPE’s dividend policy, which targets an annualised yield on NAV of 3.0% or greater, with the goal of maintaining or prudently increasing the level of dividends over time.
    • In 2025 the Board expects to maintain the current dividend level of $0.47c per share, amounting to a capital return of ~$43 million which is 3.5% of current NAV.
    • The $120 million reserved for share buybacks will be available based on various parameters set out by the Board, including NBPE’s share price discount to NAV, market conditions, performance and other relevant information. The Board has allocated capital and instructed Jefferies (Company broker) to repurchase shares under the buyback program when specific criteria are met. In addition to regular market buybacks, capital is available for more opportunistic/targeted buybacks.
    • The Board will re-evaluate the Company’s buyback criteria on a quarterly basis, taking into account factors highlighted. 
    • The updated buyback proposal falls under the existing buyback program approved at the company’s AGM in June 2024, which permits the repurchase of up to 14.99% of the company’s issued shares annually. Shareholders will have the opportunity to vote on extending the program each year at the company’s AGM in June.

    William Maltby Chairman of NB Private Equity Partners Commented:

    “Following a period of consultation with shareholders and advisers and after thoughtful consideration, I am pleased to announce this significant increase in capital available for buybacks. In today’s environment and at current discount levels, the Board views share buybacks as an attractive and accretive use of capital, presenting an opportunity to drive returns for all shareholders. We have confidence in NBPE’s portfolio and remain committed to maximising returns for all investors over the short, medium and long term. This commitment includes returning capital through buybacks and dividends while continuing to make new investments where appropriate. This decision reflects the Company’s ongoing efforts to return capital to shareholders, which has resulted in over $420 million returned through dividends and share buybacks since inception.”

    For further information, please contact:

    NBPE Investor Relations        +44 (0) 20 3214 9002
    Luke Mason        NBPrivateMarketsIR@nb.com  

    Kaso Legg Communications        +44 (0)20 3882 6644

    Charles Gorman        nbpe@kl-communications.com
    Luke Dampier
    Charlotte Francis

    About NB Private Equity Partners Limited
    NBPE invests in direct private equity investments alongside market leading private equity firms globally. NB Alternatives Advisers LLC (the “Investment Manager”), an indirect wholly owned subsidiary of Neuberger Berman Group LLC, is responsible for sourcing, execution and management of NBPE. The vast majority of direct investments are made with no management fee / no carried interest payable to third-party GPs, offering greater fee efficiency than other listed private equity companies. NBPE seeks capital appreciation through growth in net asset value over time while paying a bi-annual dividend.

    LEI number: 213800UJH93NH8IOFQ77

    About Neuberger Berman
    Neuberger Berman is an employee-owned, private, independent investment manager founded in 1939 with over 2,800 employees in 26 countries. The firm manages $508 billion of equities, fixed income, private equity, real estate and hedge fund portfolios for global institutions, advisors and individuals. Neuberger Berman’s investment philosophy is founded on active management, fundamental research and engaged ownership. The firm’s leadership in stewardship and sustainable investing is recognized by the PRI based on its consecutive above median reporting assessment results. Neuberger Berman has been named by Pensions & Investments as the #1 or #2 Best Place to Work in Money Management for each of the last eleven years (firms with more than 1,000 employees). Visit www.nb.com for more information. Data as of 31 December 2024, unless otherwise noted.

    This press release appears as a matter of record only and does not constitute an offer to sell or a solicitation of an offer to purchase any security.

    NBPE is established as a closed-end investment company domiciled in Guernsey. NBPE has received the necessary consent of the Guernsey Financial Services Commission. The value of investments may fluctuate. Results achieved in the past are no guarantee of future results. This document is not intended to constitute legal, tax or accounting advice or investment recommendations. Prospective investors are advised to seek expert legal, financial, tax and other professional advice before making any investment decision. Statements contained in this document that are not historical facts are based on current expectations, estimates, projections, opinions and beliefs of NBPE’s investment manager. Such statements involve known and unknown risks, uncertainties and other factors, and undue reliance should not be placed thereon. Additionally, this document contains “forward-looking statements.” Actual events or results or the actual performance of NBPE may differ materially from those reflected or contemplated in such targets or forward-looking statements.

    The MIL Network

  • MIL-OSI: VAALCO Energy, Inc. Declares First Quarter 2025 Dividend

    Source: GlobeNewswire (MIL-OSI)

    HOUSTON, Feb. 19, 2025 (GLOBE NEWSWIRE) — VAALCO Energy, Inc. (NYSE: EGY; LSE: EGY) (“Vaalco” or the “Company”) today announced that it declared its quarterly cash dividend of $0.0625 per share of common stock for the first quarter of 2025 ($0.25 annualized), which is payable on March 28, 2025, to stockholders of record at the close of business on February 28, 2025. Future declarations of quarterly dividends and the establishment of future record and payment dates are subject to approval by the Board of Directors.

    George Maxwell, Vaalco’s Chief Executive Officer, commented, “We are pleased to announce our first quarter 2025 dividend, marking the beginning of the fourth year of paying a meaningful cash dividend to our shareholders. While we plan an active investment program in 2025, our ongoing operational and financial success has allowed us to continue returning cash to our shareholders. We remain committed to paying a sustainable, meaningful dividend to our shareholders while we grow Vaalco through both organic development activities across our diversified portfolio and inorganic growth opportunities.”

    About Vaalco

    Vaalco, founded in 1985 and incorporated under the laws of Delaware, is a Houston, Texas, USA based, independent energy company with a diverse portfolio of production, development and exploration assets across Gabon, Egypt, Cote d’Ivoire, Equatorial Guinea, Nigeria and Canada.

    For Further Information

       
    Vaalco Energy, Inc. (General and Investor Enquiries) +00 1 713 543 3422
    Website: www.vaalco.com
       
    Al Petrie Advisors (US Investor Relations) +00 1 713 543 3422
    Al Petrie / Chris Delange  
       
    Buchanan (UK Financial PR) +44 (0) 207 466 5000
    Ben Romney / Barry Archer VAALCO@buchanan.uk.com
       

    Forward Looking Statements

    This press release includes “forward-looking statements” within the meaning of Section 27A of the Securities Act of 1933, as amended (the “Securities Act”) and Section 21E of the Securities Exchange Act of 1934, as amended, which are intended to be covered by the safe harbors created by those laws and other applicable laws and may also include “forward-looking information” within the meaning of applicable Canadian securities laws (collectively, “forward-looking statements”). Where a forward-looking statement expresses or implies an expectation or belief as to future events or results, such expectation or belief is expressed in good faith and believed to have a reasonable basis. All statements other than statements of historical fact may be forward-looking statements. The words “anticipate,” “believe,” “estimate,” “expect,” “intend,” “forecast,” “outlook,” “aim,” “target,” “will,” “could,” “should,” “may,” “likely,” “plan” and “probably” or similar words may identify forward-looking statements, but the absence of these words does not mean that a statement is not forward-looking. Forward-looking statements in this press release include, but are not limited to, statements relating to expectations of future dividends to stockholders. Such forward-looking statements are subject to risks, uncertainties and other factors, which could cause actual results to differ materially from future results expressed, projected or implied by the forward-looking statements. These risks and uncertainties include, but are not limited to: risks relating to any unforeseen liabilities of Vaalco; the ability to generate cash flows that, along with cash on hand, will be sufficient to support operations and cash requirements; risks relating to the timing and costs of completion for scheduled maintenance of the FPSO servicing the Baobab field; and the risks described under the caption “Risk Factors” in Vaalco’s 2023 Annual Report on Form 10-K filed with the SEC on March 15, 2024 and subsequent Quarterly Reports on Form 10-Q filed with the SEC.

    Dividends beyond the first quarter of 2025 have not yet been approved or declared by the Board of Directors. The declaration and payment of future dividends remain at the discretion of the Board of Directors and will be determined based on Vaalco’s financial results, balance sheet strength, cash and liquidity requirements, future prospects, crude oil and natural gas prices, and other factors deemed relevant by the Board of Directors. The Board of Directors reserves all powers related to the declaration and payment of dividends. Consequently, in determining the dividend to be declared and paid on Vaalco’s common stock, the Board of Directors may revise or terminate the payment level at any time without prior notice.

    Inside Information

    This announcement contains inside information as defined in Regulation (EU) No. 596/2014 on market abuse which is part of UK domestic law by virtue of the European Union (Withdrawal) Act 2018 (“MAR”) and is made in accordance with the Company’s obligations under article 17 of MAR. The person responsible for arranging the release of this announcement on behalf of VAALCO is Matthew Powers, Corporate Secretary of VAALCO.

    The MIL Network

  • MIL-OSI: Viridien Announces its Full Year 2024 Financial Results on Thursday 27 February 2025, after Market Close

    Source: GlobeNewswire (MIL-OSI)

    Paris, France – February 19, 2025

    Fourth Quarter 2024 & Full Year 2024 financial results and conference call

    Viridien will announce its fourth quarter & full year 2024 financial results on Thursday, February 27th, after market close.

    • The press release and the presentation will be made available on our website www.viridiengroup.com at 5:45 pm (CET)
    • An English language analysts conference call is scheduled the same day at 6.00 pm (CET)

    Participants should register for the call here to receive a dial-in number and code or participate in the live webcast from here.

    A replay of the conference call will be made available the day after for a period of 12 months in audio format on the Company’s website www.viridiengroup.com.

    About Viridien:

    Viridien (www.viridiengroup.com) is an advanced technology, digital and Earth data company that pushes the boundaries of science for a more prosperous and sustainable future. With our ingenuity, drive and deep curiosity we discover new insights, innovations, and solutions that efficiently and responsibly resolve complex natural resource, digital, energy transition and infrastructure challenges. Viridien employs around 3,500 people worldwide and is listed as VIRI on the Euronext Paris SA (ISIN: FR001400PVN6).

    Contacts

    Attachment

    The MIL Network

  • MIL-Evening Report: Insider threat: cyber security experts on giving Elon Musk and DOGE the keys to US government IT systems

    Source: The Conversation (Au and NZ) – By Frank den Hartog, Professor of Information Systems, Research Chair in Critical Infrastructure, University of Canberra

    A few weeks ago, word started to come out that the newly minted United States Department of Government Efficiency (DOGE) had acquired unprecedented access to multiple US government computer systems.

    DOGE employees – tech billionaire Elon Musk and his affiliates – have been granted access to sensitive personal and financial data, as well as other data critical for national security. This has created a national and international outcry, and serious concerns have been raised about data security, privacy and potential influence.

    A group of 14 state attorneys-general attempted to have DOGE’s access to certain federal systems restricted, but a judge has denied the request.

    Questions of trust

    What are the deeper reasons behind this outcry? After all, Musk is far from the first businessman to gain political power.

    There is, of course, US President Donald Trump himself, alongside many more on both sides of politics. Most of them kept running their businesses at arm’s length and went back to them after a stint in Washington.

    So why are so many people alarmed now, but not before? The key word here is trust. Surveys suggest many people don’t trust Musk with this kind of access.

    Does that mean we trusted the others? The foundation of modern cyber security is not to trust anything or anybody in the first place.

    So while a lack of trust in Musk is one reason for disquiet, another is a lack of trust in the current state of cyber security in US government systems and procedures. And for good reason.

    An insider threat

    The situation in the US raises the spectre of what cyber experts call an “insider threat”. These concern cyber security incidents caused by people who have authorised access to systems and data.

    Cyber security relies on controlling the so-called “CIA triad” of confidentiality, integrity and availability. Insider threats can compromise all three.

    Authentication and subsequent authorisation of access has traditionally been an important measure to prevent cyber incidents from occurring. But apparently, that is not sufficient any more.

    Perhaps the most famous insider incident in history is Edward Snowden’s leak of classified documents from the US National Security Agency in 2013. Australia too has had its share of insider breaches – the 2000 Maroochy Shire attack is still a textbook example.

    Musk and his DOGE colleagues have now become insiders.

    How to reduce the risk of insider threat

    There are plenty of strategies organisations can follow to reduce the risk of insider threats:

    • more rigorous vetting of employees

    • giving users only the bare minimum access and privileges they need

    • continuously auditing who has access to what, and restricting access immediately when needed

    • authenticating and authorising users every time they access a different system or file (this is part of what is called a “zero trust architecture”)

    • monitoring for unusual behaviour regarding insiders accessing systems and files

    • developing and nurturing a cyber-aware culture in the organisation.

    In government systems, the public should be able to trust these procedures are being rigorously applied. However, when it comes to Musk and DOGE, it seems they are not. And that’s where the core of the problem lies.

    Clearances and a lack of care

    DOGE employees without security clearance reportedly have access to classified systems which would normally be considered quite sensitive.

    However, even security clearances offer no iron-clad guarantees.

    Security clearances assume someone can be trusted based on their past. But past performance can never guarantee the future.

    In the US, obtaining and holding a security clearance has become a status symbol. A clearance may also be a golden ticket to high-paying jobs and power, and hence subject to politics rather than independent judgement.

    And it seems little care has been taken to keep users’ access and privileges to a minimum.

    You might think DOGE’s employees, tasked with seeking out inefficiency, would only need read-only access to the US government IT systems. However, at least one of them temporarily had “write” access to the systems of the treasury, according to reports, enabling him to alter code controlling trillions in federal spending.

    It all comes down to trust

    Even if all possible access control and vetting procedures are in place and working perfectly, there will always be the problem of how to declassify information.

    Or to put it another way: how do you make somebody forget everything they knew when their clearance or access is revoked or downgraded?

    What Musk has seen, he can never unsee. And there is only so much that can be done to prevent this knowledge from leaking.

    Even if all procedures to protect against insider threats are followed perfectly (and they aren’t), nothing is 100% secure.

    We would still need a certain level of public trust that the obtained data and information would be dealt with responsibly. Has trust in Musk and his affiliates reached that level?

    According to recent polling, public opinion is still divided.

    Frank den Hartog is the Cisco Research Chair in Critical Infrastructure at the University of Canberra. He is an Adjunct Fellow at the University of New South Wales.

    Abu Barkat Ullah is a steering committee member for the Canberra Cyber Hub and has received several research grants from Australian government and private organisations.

    ref. Insider threat: cyber security experts on giving Elon Musk and DOGE the keys to US government IT systems – https://theconversation.com/insider-threat-cyber-security-experts-on-giving-elon-musk-and-doge-the-keys-to-us-government-it-systems-250046

    MIL OSI AnalysisEveningReport.nz

  • MIL-OSI Australia: Joint press conference, Volgren Buses, Brisbane

    Source: Australian Treasurer

    Anika Wells:

    Good morning, everybody. I’m Anika Wells, federal Member for Lilley. Welcome to the majestic kingdom of Lilley. It’s always great to be home and here at Volgren, where for the past 15 years in part of our manufacturing hub here on the Northside, Volgren has been not just helping commuters get to places on public transport but providing great secure jobs for auto electricians, for welders, for spray painters who live and love working here on the north side of Brisbane. So, welcome news yesterday for them with the RBA rate cut, it means that for the more than 90,000 people who are employed in Lilley here, working in places like Volgren or like the Brisbane Airport or like Westfield Chermside or like the Prince Charles Hospital, many of those people are mortgage holders and yesterday’s news means that they will be about $1,000 a year better off as a result of this rate cut.

    We know that is incredibly welcome news, and we know as the Albanese Labor government we have more work to do. And I say as the Aged Care Minister, you’ve seen this term us pump $15 billion into wage rises for aged care workers, some of the lowest paid people, some of the people who most needed a pay rise. We are seeing welcome results and green shoots in places like aged care, but it takes a while to turn the Queen Mary around and that’s why Murray, Jim and I are here to continue that work on cost‑of‑living relief, because the people in Lilley, their households are looking upwards of $90 a month better off as a result of yesterday’s decision, but we’re going to keep working hard for them. And to talk about that, here is Murray Watt.

    Murray Watt:

    Well, thanks very much, Anika. It’s a pleasure to join you and Jim in your electorate, thanks for having me in your electorate. And thanks to Stewart and the team here at Volgren for showing us around the incredible high‑tech manufacturing that’s going on here right here in Brisbane’s Northside. It was a pleasure to talk with a range of the tradespeople who are working here, and today we’ve had more encouraging news for the workers that we are meeting here today and for all workers across Australia.

    Building on yesterday’s rate cut from the RBA, today the Australian Bureau of Statistics has released its latest data on wage rises in our country. And what that data shows is that we have now had 5 consecutive quarters of wages growing above inflation in Australia under the Albanese Labor government. The last quarter, the December quarter 2024, showed real wage growth. So, wages growing above inflation by 0.5 per cent. And if you look at the whole year of 2024, we saw real wage growth of 0.8 per cent, leading to 5 consecutive quarters of real wage growth in Australia.

    Now, that stands in massive contrast to what we saw under the Coalition when we were first elected. The 5 quarters leading into the last election, we saw real wages going backwards under the Coalition. Wages were falling and not keeping pace with inflation. And over the last nearly 3 years, we’ve been able to turn that around to a point that wages are consistently now rising above inflation. And why does that matter?

    It matters because lifting wages is a crucial part of the Albanese government’s plan to assist Australians deal with their cost‑of‑living pressures. And it’s important to recognise that this is a real tribute to the Australian employers and workers who have delivered these wage rises, but it also demonstrates that the changes that we’ve made to Australia’s workplace laws are working as intended. At the last election, we said that we would get wages moving again, and we can now see that happening consistently over the last 5 quarters, and we need to remember that every single change Labor made to our workplace laws in this term of office was voted against by Peter Dutton and the Coalition. They have consistently tried to make life harder for Australians by stopping those wage rises, not to mention voting against everything we’ve done to deliver cost‑of‑living relief as well.

    And now, as we approach the end game heading into the next election, I think Australians are taking great notice of the fact that Peter Dutton is already on the record saying that if he wins the next election, he will unwind a number of the changes that we have made to workplace laws. Now, that’s code for sending pay backwards again. So, if you look at the Coalition’s record, when they were last in office, their deliberate policy was to keep wages low, and that’s what they did. In Opposition, they have voted against every step we’ve taken to get wages moving again. And now, as we get ready for the next election, they’re promising to take those gains away and to cut the pay of Australian workers at a time when people still need support.

    I’ve got no doubt that this will be a big issue as we head into the next campaign. But today is very encouraging news for Australian workers. I should also mention one facet of the data is that wages are rising faster in the private sector than they are in the public sector, which I think goes against a lot of what we see from the commentators. I’ll leave it at that. Happy to take questions, but I’ll hand them over to Jim now to carry on.

    Jim Chalmers:

    Thanks, Murray. Thanks, Anika, for having us in your patch. Thanks in particular to Stewart and all of your workers for welcoming us here. This is what a Future Made in Australia looks like. People working together to build, in this case the buses, but the manufacturing sector, we couldn’t be more supportive of the work that happens here in South East Queensland, but indeed right around Australia as well. When the Albanese government came to office, real wages were falling, and interest rates were rising. Now, real wages are growing, and interest rates have started to come down.

    For 5 consecutive quarters, real wages have been growing. They fell for 5 consecutive quarters under our Liberal and National predecessors, and that goes to the difference between the parties. Peter Dutton wants lower wages and higher interest rates. What we’ve been able to deliver is much lower inflation, higher real wages, low unemployment. We’ve got the Liberal debt down and now interest rates have started to come down as well. These outcomes aren’t accidental. They’re deliberate. We have been working around the clock for the best part of 3 years to fight inflation, to roll out cost‑of‑living help and to get real wages growing again in our country. And that’s because Labor’s reason for being is to make sure that there are more Australians working, earning more and keeping more of what they earn.

    That’s why today’s wages data is so encouraging because it shows that quarter after quarter after quarter, we’ve been able to get real wages growing again after they were falling for a prolonged period under our predecessors when we came to office. Earning more, keeping more of what they earn, that is the story of the labour market under this Albanese Labor government.

    We have got the lowest average unemployment rate of any government in the last 50 years. And what makes Australia unusual is we’ve been able to get inflation down while we get wages up and keep unemployment low. We’ve been able to deal with some of the debt that was left to us by the Liberals and we’re seeing interest rates starting to come down as well. Now, in New Zealand, they cut rates today as well, just like they cut rates in Australia yesterday. The difference is the New Zealand economy is in recession. Their unemployment rate is 5.1 per cent. We’ve been able to keep the economy ticking over, delivering real wages growth. We’ve been able to keep unemployment at 4.0 per cent, and all of that, I think, shows what Australians have achieved together over the course of the last 2 and a half to 3 years.

    We inherited a mess, and we’ve been working hard to clean it up. And you can see that very conspicuously when it comes to real wages growth. Just last week, Peter Dutton was making the case for higher interest rates. He is desperately disappointed that interest rates were cut yesterday and so has Angus Taylor. Angus Taylor even let it slip that Australians deserve an interest rate increase yesterday when he was responding to the Reserve Bank’s decision to cut interest rates.

    We welcome the news that interest rates are being cut in Australia. This is the rate relief that Australians desperately need and deserve after all of the progress that we’ve made together on inflation. When we came to office, inflation was much higher and rising. Now it is lower and falling. When we came to office, interest rates were going up; now they’re coming down. When we came to office, real wages were falling and now they’re growing again. All of these are deliberate design features of our economic policy, and that’s why we’re pleased to see the progress made today in wages and yesterday when it comes to interest rates.

    Happy to take some questions.

    Journalist:

    Does the wages data show that the economy is stabilising? Could it lead to further interest rate cuts?

    Chalmers:

    I don’t want to make predictions about future movements in interest rates. I welcome enthusiastically the Reserve Bank’s decision yesterday to cut rates because it will take some of the edge off mortgage costs for millions of Australians who desperately need that help. We understand that people are under substantial cost‑of‑living pressure, but more than acknowledge that, we’re doing something about it. Getting wages moving again, the tax cuts, the energy bill relief, cheaper early childhood education, cheaper medicine, rent assistance, all of this is about doing more than recognising people are under pressure and actually doing something about it. We know that one interest rate cut doesn’t automatically solve all of the challenges in our economy or all of the pressure on household budgets, but it will help, and that’s why we welcome it.

    Here, the contrast is really important. Peter Dutton wants higher interest rates and lower wages. If he had his way, Australians would be thousands of dollars worse off right now. They’ll be worse off still if he wins, and that’s because he will go after wages again, he’ll go after Medicare again, he’ll push up electricity prices with nuclear reactors and Australians would be worse off as a consequence. That means whenever the election is called, it’s a pretty simple choice: Labor getting wages moving again, helping with the cost of living, fighting inflation and building Australia’s future, a Future Made in Australia, versus Peter Dutton and the Coalition, who will make people worse off and take Australia backwards.

    Journalist:

    Do we expect a surplus in your next Budget?

    Chalmers:

    We’re not anticipating that in the government’s fourth Budget, we released not that long ago in the mid‑year update, the best assessment of the budget position. We have already delivered 2 budget surpluses. That’s the first time that’s happened in almost 2 decades and that’s helping in the fight against inflation as the Reserve Bank Governor says.

    The deficit for this year, it’s a deficit, but it’s smaller than what we inherited from our predecessors. And that’s a demonstration of our responsible economic management, which has been the defining feature of this Labor government.

    Journalist:

    [indistinct] some of the subdued reaction to the rate cut. I’ll refer to some headlines from some of the major newspapers saying it’s a rate relief with a catch, you’re the one‑cut wonder. Has that caught you by surprise?

    Chalmers:

    Well, I think the Liberal Party and their cheerleaders in the media were really disappointed when rates were cut, and we see that reflected in the commentary. A lot of that commentary is a political position dressed up as economic commentary. There are people associated with the Liberal Party who are very disappointed that rates were cut, or inflation’s come down substantially, or real wages are growing, or we’ve been able to deliver 2 [surpluses]. I try not to focus too much on the partisan commentary. I focus on the objective commentary, and any objective observer of the Australian economy under Labor would conclude that inflation is down substantially, wages are up, unemployment is low, the debt is down from what we inherited and interest rates have started to be cut as well. All 5 of those things are positive developments. We’re confident about the future of our economy, but we’re not complacent. We know that there are still cost‑of‑living pressures. That’s why the cost‑of‑living relief that we are rolling out, which Peter Dutton opposed, is so important.

    I thought the Reserve Bank Governor made a really important point yesterday. She said she’s optimistic about the future but alive to the risks in the economy. That’s a view that we share. There’s a lot of global economic uncertainty right now in particular, but we can be confident but not complacent about the future of our economy, given the progress that Australians have made together over the course of the last couple of years.

    Journalist:

    What do you make of Clive Palmer and his trumpet politics and sticking a million dollars into the [indistinct]?

    Chalmers:

    Any vote for a minor right‑wing party is the same as a vote for the major right‑wing party, and that puts Medicare and wages at risk. So, I say to Australians who are tempted by the big dollars of Clive Palmer and others to be very careful about where you put your vote at the next election. Any non‑Labor vote puts Medicare and wages at risk. And we know that because Peter Dutton has said that he will cut $350 billion, he needs to find $600 billion from somewhere for nuclear reactors and he won’t tell Australians where those cuts are going to come from.

    That should send a shiver up the spine of every Australian, and particularly every Australian worker, not telling us the agenda for secret cuts. And so, a vote for Clive Palmer or Pauline Hanson or any one of a number of these minor right‑wing parties is a vote for Peter Dutton, and that’s a vote for cuts that we won’t know about until after the election.

    Journalist:

    How would you categorise the Budget you’re putting together? Are we going to see more cost‑of‑living sugar hits like rebates, or is it going to be more responsible?

    Chalmers:

    The best hint I could give you for the government’s fourth Budget is that it will be like the first 3, and that means responsible. The government’s fourth Budget will be defined by responsible economic management, rolling out meaningful and substantial cost‑of‑living relief where that is responsible and affordable. That’s been the approach we took in the first 3, that’ll be the approach that we take in the fourth. We know even with the progress that we’ve made together on inflation and wages, and now interest rates, we know that people are still under pressure. What we do in every budget, not just this fourth Budget, is we weigh up the economic conditions, the budget pressures, the pressures on people in their household budgets, and we do the best that we can by them.

    Journalist:

    Will power bill rebates, do you classify that as responsible?

    Chalmers:

    We haven’t finalised the Budget yet, and obviously there are a whole range of measures which are under consideration, but not yet finalised. We’ve made it clear in our first 3 budgets, the tax cuts are helping people right now. The energy bill relief, early childhood education, cheaper medicines, getting wages moving again, rent assistance, Fee‑Free TAFE. We’ve shown a willingness before to fund cost‑of‑living help in a substantial way, but in a responsible way. And if we can afford to do more in the fourth Budget, of course, we’re considering that right now.

    Journalist:

    Do you intend to deliver a Budget before the election, Treasurer?

    Chalmers:

    That’s our expectation. We’ve spent some hours in the Cabinet room earlier this week putting together the Budget for the 25th of March, and we will continue to work towards that.

    The timing of the election is a matter for the Prime Minister, my job is to continue to work on the Budget with Katy Gallagher and other colleagues to make sure that we’re ready to go.

    Journalist:

    Wages have slowed, their growth has slowed. Should Australians expect this to continue?

    Chalmers:

    We want strong and sustainable wages growth, and we’re absolutely delighted to see that. For 5 consecutive quarters now, we’ve seen annual real wage growth in our economy because it was falling for 5 quarters when we came to office. I think, as I said before, our reason for being as a Labor government is to get more people working, earning more and keeping more of what they earn. Not as some kind of accidental outcome, but as a deliberate consequence of our economic strategy. The tax cuts are a big part of that, keeping more of what you earn.

    All of our policies on wages, which Murray is now responsible for, they are part of getting wages growing again. So, we’re seeing real wages growth. That’s a good thing. The Wage Price Index has moderated a little bit, but not a lot. Overwhelmingly, the story of the last 5 quarters has been real wages growth and that’s a good thing.

    Journalist:

    Will any pre‑election handouts stoke inflation?

    Chalmers:

    We’re obviously very conscious of the broader economic conditions when we finalise the Budget and not just when it comes to cost‑of‑living help. And what we’ve shown in our cost‑of‑living relief to date is we’ve been able to put downward pressure on electricity prices, on early childhood education, on rent as well, to take some of the edge off those cost‑of‑living pressures. That would be a similar approach that we would consider as we put the fourth Budget together.

    Again, it comes back to the choice and the contrast. Peter Dutton opposed our cost‑of‑living help. If he had his way, Australians would be thousands of dollars worse off right now and they’ll be worse off still if he wins, and that comes to the choice at the election: a Labor government working around the clock to get people better pay, to give every taxpayer a tax cut to help with their electricity bills – or Peter Dutton, who will come after wages again, come after Medicare again, push electricity prices up with these nuclear reactors. As we get closer to the election, whenever it is, the choice is really crystallising. Labor, helping with the cost of living, getting wages moving again, strengthening Medicare and building Australia’s future, versus Peter Dutton and the Coalition who will make people worse off and take Australia backwards.

    I’ll take one more question then I think we’re done here.

    Journalist:

    Can I ask you about the Whyalla steelworks? The ABC has been told that potentially that’s been placed into administration by the state government. Have you been briefed on that and have you got any assurances for workers?

    Chalmers:

    More than being briefed, a number of us have been in discussions with our South Australian counterparts for a little while now. We want to see a future for steel in Whyalla. That is a really important town, and we are big believers in the future of Whyalla. We’re big believers in the future of the Australian steel industry and Australian manufacturing more broadly. No government has been a bigger believer in a Future Made in Australia than ours, and so that’s really driven us in our conversations with our South Australian counterparts.

    The Prime Minister has been talking to Premier Malinauskas; Minister Husic’s been talking to his counterpart. I’ve been talking to Treasurer Mullighan, and we’ll have more to say about those discussions in due course.

    Journalist:

    Can’t say whether it has been placed into administration?

    Chalmers:

    We’ll have more to say about that when that’s appropriate. Thanks very much.

    MIL OSI News

  • MIL-OSI Economics: Asian Development Blog: Get Moving: Smarter Logistics Can Boost Efficiency and Cut Costs in South Asia

    Source: Asia Development Bank

    Enhancing multimodal transport, standardization, and digital integration can improve efficiency, reduce costs, and strengthen manufacturing in India, Bangladesh, and Nepal’s logistics sectors.

    The logistics sectors of India, Bangladesh, and Nepal face remarkably similar constraints that are central to their governments’ plans to expand the industries that rely heavily on logistics. 

    In each country, roads – the most heavily used form of transport – are overburdened, leading to a variety of problems, including slow and unpredictable delivery times. A lack of standardization in warehousing facilities means time is wasted on unpacking and repacking pallets to fit shelving racks following different standards.

    Insufficient multimodal infrastructure means that cargo cannot easily move between trains, trucks, and ships. These hindrances affect both economies and the environment alike, in that an inefficient logistics sector is a cost borne by both consumers, in the form of higher product prices, and the environment, in the form of added emissions from idling vehicles.

    India, for its part, has made the most progress in recent years toward alleviating logistics inefficiencies in the service of its broader economy, particularly in manufacturing. 

    India’s logistics sector, once plagued by inefficiencies, is undergoing a positive transformation. With a market size of approximately $200 billion, India transports 4.6 billion tons of freight annually. 

    The sector is projected to double in size by 2030, driven by aggressive expansion in road, rail, shipping and air freight. Recent improvements in road infrastructure, dedicated freight corridors and use of technological advancements in the logistics supply chain have set the stage for a more efficient logistics network. 

    India’s logistics sector now includes all key components needed for a modern economy, such as seamless transport across different modes (road, rail, air, and sea), efficient customs processing for domestic and international trade, and better management of ports, airports, and land borders. 

    From that and other significant policy reforms, India’s manufacturing sector has been on a steady growth trajectory, underpinned by significant policy and infrastructural reforms including in its logistics sector. India continues to experience rapid growth in its Manufacturing Purchasing Managers’ Index (PMI). 

    The latest Manufacturing PMI for December 2024 remains firmly within the expansionary zone, fueled by new business gains and robust demand. According to the RBI’s Industrial Outlook Survey, manufacturing firms anticipate further enhancements in Q4 FY25 and Q1 FY26. 

    India’s export landscape has also undergone substantial growth, with merchandise and services exports increasing significantly over the past two decades. Goods exports rose from $48.5 billion in 2000 to $467.5 billion in 2022. 

    Despite the recent very large outlays in infrastructure and policy reforms, India’s logistics sector is still confronted by several challenges also faced by Nepal and Bangladesh, where heavy investment in infrastructure is also still needed. 

    The transformation of the logistics sector is pivotal in fostering regional integration and economic development across South Asia.

    Like India, the logistics sectors of Bangladesh and Nepal need greater consolidation for regulatory bodies in the logistics sector, overarching standardization, and better institutional coordination. In Bangladesh, congestion in external trade is an additional complication.

    The development of the logistics sector has a profound impact on economic competitiveness and the environment. Improved logistics efficiency enhances supply chain resilience, reduces transaction costs, and boosts export competitiveness. 

    The integration of digital technologies and standardized processes facilitates smoother movement of goods, which is crucial for manufacturing growth and reduced greenhouse gas emissions.

    Logistics sector reforms are also expected to create substantial employment opportunities, both in urban and rural areas. The increased demand for skilled logistics workers, driven by private sector investments and process efficiency, will contribute to job creation. 

    Additionally, the digitization and automation of logistics processes will generate new types of employment, aligning with the evolving needs of the sector.

    Historically, Bangladesh has not fared well in the competitiveness and logistics rankings. For example, in the 2019 World Economic Forum’s Global Competitiveness Index, Bangladesh ranked 105th out of 141 countries, lagging other Asian nations such as India (68), Viet Nam (67), and Indonesia (50). Bangladesh ranked 88th of 139 in World Bank’s 2023 Logistics Performance Index, while India ranked 38th globally, up from 44th in 2019. 

    Bangladesh heavily relies on road-based cargo movement, with railways accounting for only about 4% of passenger and freight transport. Given the country’s dense population, expanding the road network poses significant challenges. 

    Therefore, shifting to rail transport and upgrading the rail network, including gauge conversion, could significantly enhance the logistics sector, improving efficiency in cargo evacuation and greener movement of goods. 

    Further, development of a multi-modal logistics park will be essential to facilitate freight aggregation and distribution, multimodal freight transport, integrated storage and warehousing, technology support, and value-added services. All of this contributes to a reduction in transit time and a streamlining of export processes. 

    Problems in Nepal are much more fundamental and revolve around basic infrastructure such as roads. Nepal, with its unique geographical challenges, can benefit from India’s experience in logistics sector reforms. Nepal should adopt a strategic approach to infrastructure development, focusing on improving road and rail connectivity to facilitate the movement of goods. 

    They also need to establish institutional arrangements for logistics planning at the national and local levels. Nepal can also leverage digitization and process reforms to enhance the efficiency and reliability of its logistics network. Logistics sector development is critical for paving the way for the economic diversification that Bangladesh and Nepal need as they transition away from least developed country status. 

    The transformation of the logistics sector is pivotal in fostering regional integration and economic development across South Asia.

    MIL OSI Economics

  • MIL-OSI: Wix Reports Fourth Quarter and Full Year 2024 Results

    Source: GlobeNewswire (MIL-OSI)

    Capping off a year of sustained growth acceleration and stronger than expected FCF generation – surpassing Rule of 40 in 2024 and on track to achieve Rule of 45 in 2025

    • Culminated a year of accelerated growth and innovation with Q4 bookings of $465 million, up 18% y/y, and Q4 revenue of $460 million, up 14% y/y
      • Steady growth acceleration in Self Creators coupled with continued strength in high-growth Partners, demonstrated by Partners revenue growth of 30% y/y in FY2024
      • Strong momentum across key product focus areas, including Studio, AI and commerce as well as solid business fundamentals and price increase benefit
    • Robust growth and a stable operating cost base drove FCF1 generation to nearly double in 2024 compared to previous year, resulting in continued profitability improvement with Q4 FCF margin of 29% and full year FCF1 margin of 28%
      • Achieved first year of positive GAAP operating income in Wix history
    • On track to achieve Rule of 45 in 2025 at high end of outlook through continued innovation-powered growth and further FCF margin expansion
    • Completed $200 million share repurchase plan in January, totaling $725 million in aggregate repurchases since August 2023

    NEW YORK — Wix.com Ltd. (Nasdaq: WIX), the leading SaaS website builder platform2, today reported financial results for the fourth quarter and full year 2024. In addition, the Company provided its initial outlook for the first quarter and full year 2025. Please visit the Wix Investor Relations website at https://investors.wix.com to view the Q4’24 Shareholder Update and other materials.

    “Wix sets a high standard for innovation and creativity, and we’re constantly exceeding expectations. This past year was one of exciting innovation as we introduced revolutionary AI solutions such as the new generation AI Website Builder. We also made meaningful enhancements to the Studio platform, including the AI visual sitemap and wireframe generator and Figma integration among new advanced design capabilities,” said Avishai Abrahami, Wix Co-founder and CEO. “2025 is poised to reimagine and expand the Self Creator experience with the launch of two transformative products planned for the spring and early fall. I strongly believe that these will deliver immense value to users and, in turn, accelerate Self Creator growth to double-digits in the years to come. We’re thrilled about these strategic enhancements, which are set to propel our business forward and establish a powerful foundation for the years ahead.”

    “We wrapped 2024 with accelerated growth and profitability, driven by successful execution of our product roadmap and pricing strategy as well as strong business fundamentals,” added Lior Shemesh, CFO at Wix. “With AI usage ramping from our growing suite of innovations and Studio continuing to win market share, we anticipate these to be even bigger growth engines in 2025 and beyond. Solid growth will be coupled with incremental efficiencies from new internal AI initiatives and a stable operating base, enabling us to continue to expand margins and set new profitability records. The high end of our outlook puts us at Rule of 45 in 2025 as we continue to prioritize balancing profitable growth through best-in-class innovation and steadfast execution.”

    Q4 2024 Financial Results

    • Total revenue in the fourth quarter of 2024 was $460.5 million, up 14% y/y
      • Creative Subscriptions revenue in the fourth quarter of 2024 was $329.7 million, up 11% y/y
      • Creative Subscriptions ARR increased to $1.343 billion as of the end of the quarter, up 13% y/y
    • Business Solutions revenue in the fourth quarter of 2024 was $130.7 million, up 21% y/y
      • Transaction revenue3 was $57.1 million, up 23% y/y
    • Partners revenue4 in the fourth quarter of 2024 was $168.1 million, up 29% y/y
    • Total bookings in the fourth quarter of 2024 were $464.6 million, up 18% y/y
      • Total bookings on a y/y constant currency basis were $466.2 million
      • Creative Subscriptions bookings in the fourth quarter of 2024 were $325.2 million, up 15% y/y
      • Business Solutions bookings in the fourth quarter of 2024 were $139.4 million, up 25% y/y
    • Total gross margin on a GAAP basis in the fourth quarter of 2024 was 69%
      • Creative Subscriptions gross margin on a GAAP basis was 84%
      • Business Solutions gross margin on a GAAP basis was 30%
    • Total non-GAAP gross margin in the fourth quarter of 2024 was 70%
      • Creative Subscriptions gross margin on a non-GAAP basis was 85%
      • Business Solutions gross margin on a non-GAAP basis was 32%
    • GAAP net income in the fourth quarter of 2024 was $48.0 million, or $0.86 per basic share or $0.80 per diluted share
    • Non-GAAP net income in the fourth quarter of 2024 was $117.1 million, or $2.10 per basic share or $1.93 per diluted share
    • Net cash provided by operating activities for the fourth quarter of 2024 was $133.7 million, while capital expenditures totaled $2.0 million, leading to free cash flow of $131.8 million

    FY 2024 Financial Results

    • Total revenue for the full year 2024 was $1.761 billion, up 13% y/y
      • Creative Subscriptions revenue for the full year 2024 was $1.265 billion, up 10% y/y
      • Business Solutions revenue for the full year 2024 was $495.7 million, up 21% y/y
        • Transaction revenue3 was $214.9 million, up 21% y/y
    • Partners revenue4 for the full year 2024 was $610.1 million, up 30% y/y
    • Total bookings for the full year 2024 were $1.830 billion, up 15% y/y
      • Creative Subscriptions bookings for the full year 2024 were $1.315 billion, up 12% y/y
      • Business Solutions bookings for the full year 2024 were $514.6 million, up 22% y/y
    • Total gross margin on a GAAP basis for the full year 2024 was 68%
      • Creative Subscriptions gross margin on a GAAP basis was 83%
      • Business Solutions gross margin on a GAAP basis was 29%
    • Total non-GAAP gross margin for the full year 2024 was 69%
      • Creative Subscriptions gross margin on a non-GAAP basis was 84%
      • Business Solutions gross margin on a non-GAAP basis was 30%
    • GAAP net income for the full year 2024 was $138.3 million, or $2.49 per basic share or $2.36 per diluted share
    • Non-GAAP net income for the full year 2024 was $383.3 million, or $6.90 per basic share or $6.39 per diluted share
    • Net cash provided by operating activities for the full year 2024 was $497.4 million, while capital expenditures totaled $19.3 million, leading to free cash flow of $478.1 million
    • Excluding the capex investment associated with our new headquarters office build out, free cash flow1 for the full year 2024 would have been $488.4 million, or 28% of revenue
    • Executed $466 million in repurchases of ordinary shares in 2024 as we remained committed to share count management and returning value to shareholders
    • Finished full year 2024 with 6.2 million total premium subscriptions as of December 31, 2024
    • Registered users as of December 31, 2024 were over 282 million
    • Total employee count as of December 31, 2024 was 5,283

    ____________________
    1 Free cash flow excluding expenses associated with the buildout of our new corporate headquarters.
    2 Based on number of active live sites as reported by competitors’ figures, independent third-party data and internal data as of Q3 2024.
    3 Transaction revenue is a portion of Business Solutions revenue, and we define transaction revenue as all revenue generated through transaction facilitation, primarily from Wix Payments, as well as Wix POS, shipping solutions and multi-channel commerce and gift card solutions.
    4 Partners revenue is defined as revenue generated through agencies and freelancers that build sites or applications for other users (“Agencies”) as well as revenue generated through B2B partnerships, such as LegalZoom or Vistaprint (“Resellers”). We identify Agencies using multiple criteria, including but not limited to, the number of sites built, participation in the Wix Partner Program and/or the Wix Marketplace or Wix products used (incl. Wix Studio). Partners revenue includes revenue from both the Creative Subscriptions and Business Solutions businesses.

    Financial Outlook

    We expect another year of robust bookings and revenue growth powered by existing key growth initiatives and ongoing product enhancements against a stable and positive demand environment:

    • With Studio continuing to outperform and AI usage and conversion benefits ramping, we anticipate these initiatives to be even bigger growth engines in 2025
       
    • We are continuously testing and rolling out product enhancements as well as new strategic initiatives, which are driving demonstrable added value to users. As a result, we expect incremental ARPS and conversion improvements.

      We expect top-line contribution from those enhancements and initiatives already rolled out and underway to layer in as we progress through the year, resulting in accelerated growth in 2H. This acceleration is anticipated for both revenue and bookings, even as bookings fully laps pricing tailwinds in mid-Q1’25.

    • While confident the new products in our pipeline, particularly the meaningful Self Creator offerings coming this year, will drive medium-term growth, we are incorporating almost no contribution from new products into our 2025 forecast.

    As a global company with ~40% of revenue derived in non-US dollar currencies, we began to experience adverse effects from outsized changes in FX rates beginning mid-Q4 and continuing YTD, particularly the US dollar to Euro and British pound exchange rates. Assuming late January spot rates, we anticipate strong FX headwinds to 2025 outlook.

    As such, we provide outlook for the year and the first quarter on both as-reported and constant currency bases.

      As-reported As-reported
    growth y/y
    FX impact Constant currency
    growth y/y
    Full year 2025        
    Bookings $2,025 – 2,060 million 11 – 13% ~$45 million 13 – 15%
    Revenue $1,970 – 2,000 million 12 – 14% ~$34 million 14 – 16%
    Free cash flow $590 – 610 million 30 – 31% margin ~$25 million 31 – 32% margin
    Q1’25        
    Revenue $469 – 473 million 12 – 13% ~$6 million 13 – 14%

    With a meaningful portion of our operating expenses denominated in non-US currencies, the strengthening US dollar is expected to drive a modest benefit to 2025 expenses. As a result, the net FX impact on free cash flow is expected to be smaller than the anticipated top-line headwinds.

    We believe our strong commitment to sustained top-line momentum and translating growth into additional operating leverage puts us on track to achieve Rule of 45 in 2025 at the high end of our outlook.

    Conference Call and Webcast Information

    Wix will host a conference call to discuss the results at 8:30 a.m. ET on Wednesday, February 19, 2025. A live and archived webcast of the conference call will be accessible from the “Investor Relations” section of the Company’s website at https://investors.wix.com/.

    About Wix.com Ltd.

    Wix is the leading SaaS website builder platform1 to create, manage and grow a digital presence. Founded  in 2006, Wix is a comprehensive platform providing users – self-creators, agencies, enterprises, and more – with industry-leading performance, security, AI capabilities and a reliable infrastructure. Offering a wide range of commerce and business solutions, advanced SEO and marketing tools, the platform enables users to take full ownership of their brand, their data and their relationships with their customers. With a focus on continuous innovation and delivery of new features and products, users can seamlessly build a powerful and high-end digital presence for themselves or their clients.

    For more about Wix, please visit our Press Room
    Media Relations Contact:  PR@wix.com 

    Non-GAAP Financial Measures and Key Operating Metrics

    To supplement its consolidated financial statements, which are prepared and presented in accordance with U.S. GAAP, Wix uses the following non-GAAP financial measures: bookings, cumulative cohort bookings, bookings on a constant currency basis, revenue on a constant currency basis, non-GAAP gross margin, non-GAAP operating income (loss), non-GAAP operating margin, non-GAAP net income (loss), non-GAAP net income (loss) per share, free cash flow, free cash flow on a constant currency basis, free cash flow, as adjusted, free cash flow margins, non-GAAP R&D expenses, non-GAAP S&M expenses, non-GAAP G&A expenses, non-GAAP operating expenses, non-GAAP cost of revenue expense, non-GAAP financial expense, non-GAAP tax expense (collectively the “Non-GAAP financial measures”). Measures presented on a constant currency or foreign exchange neutral basis have been adjusted to exclude the effect of y/y changes in foreign currency exchange rate fluctuations. Bookings is a non-GAAP financial measure calculated by adding the change in deferred revenues and the change in unbilled contractual obligations for a particular period to revenues for the same period. Bookings include cash receipts for premium subscriptions purchased by users as well as cash we collect from business solutions, as well as payments due to us under the terms of contractual agreements for which we may have not yet received payment. Cash receipts for premium subscriptions are deferred and recognized as revenues over the terms of the subscriptions. Cash receipts for payments and the majority of the additional products and services (other than Google Workspace) are recognized as revenues upon receipt. Committed payments are recognized as revenue as we fulfill our obligation under the terms of the contractual agreement. Bookings and Creative Subscriptions Bookings are also presented on a further non-GAAP basis by excluding, in each case, bookings associated with long term B2B partnership agreements. Non-GAAP gross margin represents gross profit calculated in accordance with GAAP as adjusted for the impact of share-based compensation expense, acquisition-related expenses and amortization, divided by revenue. Non-GAAP operating income (loss) represents operating income (loss) calculated in accordance with GAAP as adjusted for the impact of share-based compensation expense, amortization, acquisition-related expenses and sales tax expense accrual and other G&A expenses (income). Non-GAAP net income (loss) represents net loss calculated in accordance with GAAP as adjusted for the impact of share-based compensation expense, amortization, sales tax expense accrual and other G&A expenses (income), amortization of debt discount and debt issuance costs and acquisition-related expenses and non-operating foreign exchange expenses (income). Non-GAAP net income (loss) per share represents non-GAAP net income (loss) divided by the weighted average number of shares used in computing GAAP loss per share. Free cash flow represents net cash provided by (used in) operating activities less capital expenditures. Free cash flow, as adjusted, represents free cash flow further adjusted to exclude one-time cash restructuring charges and the capital expenditures and other expenses associated with the buildout of our new corporate headquarters. Free cash flow margins represent free cash flow divided by revenue. Non-GAAP cost of revenue represents cost of revenue calculated in accordance with GAAP as adjusted for the impact of share-based compensation expense, acquisition-related expenses and amortization. Non-GAAP R&D expenses represent R&D expenses calculated in accordance with GAAP as adjusted for the impact of share-based compensation expense, acquisition-related expenses and amortization. Non-GAAP S&M expenses represent S&M expenses calculated in accordance with GAAP as adjusted for the impact of share-based compensation expense, acquisition-related expenses and amortization. Non-GAAP G&A expenses represent G&A expenses calculated in accordance with GAAP as adjusted for the impact of share-based compensation expense, acquisition-related expenses and amortization. Non-GAAP operating expenses represent operating expenses calculated in accordance with GAAP as adjusted for the impact of share-based compensation expense, acquisition-related expenses and amortization. Non-GAAP financial expense represents financial expense calculated in accordance with GAAP as adjusted for unrealized gains of equity investments, amortization of debt discount and debt issuance costs and non-operating foreign exchange expenses. Non-GAAP tax expense represents tax expense calculated in accordance with GAAP as adjusted for provisions for income tax effects related to non-GAAP adjustments.

    The presentation of this financial information is not intended to be considered in isolation or as a substitute for, or superior to, the financial information prepared and presented in accordance with GAAP. The Company uses these non-GAAP financial measures for financial and operational decision making and as a means to evaluate period-to-period comparisons. The Company believes that these measures provide useful information about operating results, enhance the overall understanding of past financial performance and future prospects, and allow for greater transparency with respect to key metrics used by management in its financial and operational decision making.

    For more information on the non-GAAP financial measures, please see the reconciliation tables provided below. The accompanying tables have more details on the GAAP financial measures that are most directly comparable to non-GAAP financial measures and the related reconciliations between these financial measures. The Company is unable to provide reconciliations of free cash flow, free cash flow, as adjusted, bookings, cumulative cohort bookings, non-GAAP gross margin, and non-GAAP tax expense to their most directly comparable GAAP financial measures on a forward-looking basis without unreasonable effort because items that impact those GAAP financial measures are out of the Company’s control and/or cannot be reasonably predicted. Such information may have a significant, and potentially unpredictable, impact on our future financial results.

    Wix also uses Creative Subscriptions Annualized Recurring Revenue (ARR) as a key operating metric. Creative Subscriptions ARR is calculated as Creative Subscriptions Monthly Recurring Revenue (MRR) multiplied by 12. Creative Subscriptions MRR is calculated as the total of (i) the total monthly revenue of all Creative Subscriptions in effect on the last day of the period, other than domain registrations; (ii) the average revenue per month from domain registrations multiplied by all registered domains in effect on the last day of the period; and (iii) monthly revenue from other partnership agreements including enterprise partners.

    Forward-Looking Statements

    This document contains forward-looking statements, within the meaning of the safe harbor provisions of the Private Securities Litigation Reform Act of 1995 that involve risks and uncertainties. Such forward-looking statements may include projections regarding our future performance, including, but not limited to revenue, bookings and free cash flow, and may be identified by words like “anticipate,” “assume,” “believe,” “aim,” “forecast,” “indication,” “continue,” “could,” “estimate,” “expect,” “intend,” “may,” “plan,” “potential,” “predict,” “project,” “outlook,” “future,” “will,” “seek” and similar terms or phrases. The forward-looking statements contained in this document, including the quarterly and annual guidance, are based on management’s current expectations, which are subject to uncertainty, risks and changes in circumstances that are difficult to predict and many of which are outside of our control. Important factors that could cause our actual results to differ materially from those indicated in the forward-looking statements include, among others, our expectation that we will be able to attract and retain registered users and partners, and generate new premium subscriptions, in particular as we continuously adjust our marketing strategy and as the macro-economic environment continues to be turbulent; our expectation that we will be able to increase the average revenue we derive per premium subscription, including through our partners; our expectation that new products and developments, as well as third-party products we will offer in the future within our platform, will receive customer acceptance and satisfaction, including the growth in market adoption of our online commerce solutions and our Wix Studio product; our expectations regarding our ability to develop relevant and required products using artificial intelligence (“AI”), the regulatory environment impacting AI and AI-related activities, including privacy and intellectual property, and potential competitive impacts from AI tools; our assumption that historical user behavior can be extrapolated to predict future user behavior, in particular during turbulent macro-economic environments; our prediction of the future revenues and/or bookings generated by our user cohorts and our ability to maintain and increase such revenue growth, as well as our ability to generate and maintain elevated levels of free cash flow and profitability; our expectation to maintain and enhance our brand and reputation; our expectation that we will effectively execute our initiatives to improve our user support function through our Customer Care team, and continue attracting registered users and partners, and increase user retention, user engagement and sales; our ability to successfully localize our products, including by making our product, support and communication channels available in additional languages and to expand our payment infrastructure to transact in additional local currencies and accept additional payment methods; our expectation regarding the impact of fluctuations in foreign currency exchange rates, interest rates, potential illiquidity of banking systems, and other recessionary trends on our business; our expectations relating to the repurchase of our ordinary shares and/or Convertible Notes pursuant to our repurchase program; our expectation that we will effectively manage our infrastructure; our expectation to comply with AI, privacy, and data protection laws and regulations as well as contractual privacy and data protection obligations; our expectations regarding the outcome of any regulatory investigation or litigation, including class actions; our expectations regarding future changes in our cost of revenues and our operating expenses on an absolute basis and as a percentage of our revenues, as well as our ability to achieve and maintain profitability; our expectations regarding changes in the global, national, regional or local economic, business, competitive, market, and regulatory landscape, including as a result of Israel-Hamas war and/or the Israel-Hezbollah hostilities and/or the Ukraine-Russia war and any escalations thereof and potential for wider regional instability and conflict; our planned level of capital expenditures and our belief that our existing cash and cash from operations will be sufficient to fund our operations for at least the next 12 months and for the foreseeable future; our expectations with respect to the integration and performance of acquisitions; our ability to attract and retain qualified employees and key personnel; and our expectations about entering into new markets and attracting new customer demographics, including our ability to successfully attract new partners large enterprise-level users and to grow our activities, including through the adoption of our Wix Studio product, with these customer types as anticipated and other factors discussed under the heading “Risk Factors” in the Company’s annual report on Form 20-F for the year ended December 31, 2023 filed with the Securities and Exchange Commission on March 22, 2024. The preceding list is not intended to be an exhaustive list of all of our forward-looking statements. Any forward-looking statement made by us in this press release speaks only as of the date hereof. Factors or events that could cause our actual results to differ may emerge from time to time, and it is not possible for us to predict all of them. We undertake no obligation to publicly update any forward-looking statements, whether as a result of new information, future developments or otherwise.

    Wix.com Ltd.
    CONSOLIDATED STATEMENTS OF OPERATIONS – GAAP
    (In thousands, except loss per share data)
                   
      Three Months Ended   Year Ended
      December 31,   December 31,
      2024   2023   2024   2023
      (unaudited)   (unaudited)
    Revenues              
    Creative Subscriptions $ 329,732   $ 296,154   $ 1,264,975   $ 1,152,007
    Business Solutions 130,723   107,617   495,675   409,658
      460,455   403,771   1,760,650   1,561,665
                   
    Cost of Revenues              
    Creative Subscriptions 52,671   52,794   213,422   215,515
    Business Solutions 90,965   73,319   351,213   297,013
      143,636   126,113   564,635   512,528
                   
    Gross Profit 316,819   277,658   1,196,015   1,049,137
                   
    Operating expenses:              
    Research and development 127,186   125,743   495,281   481,293
    Selling and marketing 106,629   103,642   425,457   399,577
    General and administrative 46,984   43,401   175,136   160,033
    Impairment, restructuring and other costs   3,103     32,614
    Total operating expenses 280,799   275,889   1,095,874   1,073,517
    Operating income (loss) 36,020   1,769   100,141   (24,380)
    Financial income, net 16,355   6,461   51,820   62,474
    Other income (expenses), net (94)   44   (36)   (255)
    Income before taxes on income 52,281   8,274   151,925   37,839
    Income tax expenses 4,257   5,320   13,603   4,702
    Net income $ 48,024   $ 2,954   $ 138,322   $ 33,137
                   
    Basic net income per share $ 0.86   $ 0.05   $ 2.49   $ 0.58
    Basic weighted-average shares used to compute net income per share 55,786,201   57,317,815   55,579,368   56,829,962
                   
    Diluted net income per share $ 0.80   $ 0.05   $ 2.36   $ 0.57
    Diluted weighted-average shares used to compute net income per share 60,648,791   59,085,757   59,953,371   58,403,037
                   
    Wix.com Ltd.
    CONDENSED CONSOLIDATED BALANCE SHEETS
    (In thousands)
               
       
       December 31,    December 31,
       2024    2023
    Assets  (unaudited)    (audited)
    Current Assets:          
    Cash and cash equivalents $ 660,939   $ 609,622
    Short-term deposits   106,844     212,709
    Restricted deposits   773     2,125
    Marketable securities   338,593     140,563
    Trade receivables   46,166     57,394
    Prepaid expenses and other current assets   126,887     47,792
    Total current assets   1,280,202     1,070,205
               
    Long-Term Assets:          
    Prepaid expenses and other long-term assets   27,021     34,296
    Property and equipment, net   128,155     136,928
    Marketable securities   6,135     64,806
    Intangible assets, net   22,141     28,010
    Goodwill   49,329     49,329
    Operating lease right-of-use assets   399,861     420,562
    Total long-term assets   632,642     733,931
               
    Total assets $ 1,912,844   $ 1,804,136
               
    Liabilities and Shareholders’ Deficiency          
    Current Liabilities:          
    Trade payables $ 48,003   $ 38,305
    Employees and payroll accruals   142,007     56,581
    Deferred revenues   661,171     592,608
    Current portion of convertible notes, net   572,880    
    Accrued expenses and other current liabilities   63,246     76,556
    Operating lease liabilities   27,907     24,981
    Total current liabilities   1,515,214     789,031
    Long Term Liabilities:          
    Long-term deferred revenues   89,271     83,384
    Long-term deferred tax liability   1,965     7,167
    Convertible notes, net       569,714
    Other long-term liabilities   16,021     7,699
    Long-term operating lease liabilities   369,159     401,626
    Total long-term liabilities   476,416     1,069,590
               
    Total liabilities   1,991,630     1,858,621
               
    Shareholders’  Deficiency          
    Ordinary shares   107     110
    Additional paid-in capital   1,840,574     1,539,952
    Treasury Stock   (1,025,167)     (558,875)
    Accumulated other comprehensive loss   7,242     4,192
    Accumulated deficit   (901,542)     (1,039,864)
    Total shareholders’ deficiency   (78,786)     (54,485)
               
    Total liabilities and shareholders’ deficiency $ 1,912,844   $ 1,804,136
               
    Wix.com Ltd.
    CONDENSED CONSOLIDATED STATEMENTS OF CASH FLOWS
    (In thousands)
                           
                           
      Three Months Ended   Year Ended
      December 31,   December 31,
      2024   2023   2024   2023
      (unaudited)   (unaudited)
    OPERATING ACTIVITIES:                      
    Net income $ 48,024   $         2,954   $ 138,322   $        33,137
    Adjustments to reconcile net loss to net cash provided by operating activities:                      
    Depreciation   6,278     6,725     25,246     20,492
    Amortization   1,460     1,488     5,869     5,954
    Share based compensation expenses   61,801     58,195     240,721     224,625
    Amortization of debt discount and debt issuance costs   793     789     3,166     4,194
    Changes in accrued interest and exchange rate on short term and long term deposits   (635)     (586)     852     (2,415)
    Non-cash impairment, restructuring and other costs       3,567         26,699
    Amortization of premium and discount and accrued interest on marketable securities, net   (7,838)     4,237     (13,381)     8,346
    Remeasurement loss (gain) on Marketable equity       (10,296)     (3,367)     (30,608)
    Changes in deferred income taxes, net   (7)     (2,035)     (5,196)     (8,784)
    Changes in operating lease right-of-use assets   4,351     7,174     24,246     27,231
    Changes in operating lease liabilities   (2,821)     16,701     (33,086)     (31,333)
    Loss on foreign exchange, net   2,471         3,906    
    Decrease (increase) in trade receivables   4,058     (2,794)     11,228     (15,308)
    Decrease in prepaid expenses and other current and long-term assets   (63,684)     (10,845)     (76,963)     (20,105)
    Increase (decrease) in trade payables   17,329     15,120     12,893     (52,455)
    Increase (decrease) in employees and payroll accruals   66,407     (8,307)     85,426     (29,532)
    Increase in short term and long term deferred revenues   1,609     2,788     74,450     76,193
    Increase (decrease) in accrued expenses and other current liabilities   (5,860)     5,505     3,083     11,915
    Net cash provided by operating activities   133,736     90,380     497,415     248,246
    INVESTING ACTIVITIES:                      
    Proceeds from short-term deposits and restricted deposits   97,051     131,754     276,697     625,495
    Investment in short-term deposits and restricted deposits   (25,540)     (99,725)     (170,332)     (297,917)
    Investment in marketable securities       (2,607)     (267,209)     (6,732)
    Proceeds from marketable securities   15,000     33,690     125,176     250,960
    Purchase of property and equipment and lease prepayment   (1,562)     (9,582)     (17,813)     (63,021)
    Capitalization of internal use of software   (401)     (408)     (1,523)     (3,028)
    Investment in other assets               (111)
    Proceeds from investment in other assets $       $ 550    
    Proceeds from sale of equity securities       19,203     22,148     68,671
    Purchases of investments in privately held companies   (1,000)     (76)     (3,160)     (7,603)
    Net cash provided by investing activities   83,548     72,249     (35,466)     566,714
    FINANCING ACTIVITIES:                      
    Proceeds from exercise of options and ESPP shares   6,692     898     59,576     39,660
    Purchase of treasury stock       (58,698)     (466,302)     (127,017)
    Repayment of convertible notes               (362,667)
    Net cash provided by (used in) financing activities   6,692     (57,800)     (406,726)     (450,024)
    Effect of exchange rates on cash, cash equivalent and restricted cash   (2,471)         (3,906)    
    INCREASE (DECREASE) IN CASH AND CASH EQUIVALENTS   221,505     104,829     51,317     364,936
    CASH AND CASH EQUIVALENTS—Beginning of period   439,434     504,793     609,622     244,686
    CASH AND CASH EQUIVALENTS—End of period $ 660,939   $ 609,622   $ 660,939   $ 609,622
                           
    Wix.com Ltd.
    KEY PERFORMANCE METRICS
    (In thousands)
                           
      Three Months Ended   Year Ended
      December 31,   December 31,
      2024   2023   2024   2023
      (unaudited)   (unaudited)
    Creative Subscriptions   329,732     296,154     1,264,975     1,152,007
    Business Solutions   130,723     107,617     495,675     409,658
    Total Revenues $ 460,455   $ 403,771   $ 1,760,650   $ 1,561,665
                           
    Creative Subscriptions   325,203     283,501     1,315,445     1,174,776
    Business Solutions   139,389     111,503     514,607     422,727
    Total Bookings $ 464,592   $ 395,004   $ 1,830,052   $ 1,597,503
                           
    Free Cash Flow $ 131,773   $ 80,390   $ 478,079   $ 182,197
    Free Cash Flow excluding HQ build out and restructuring costs $ 131,773   $ 90,125   $ 488,404   $ 246,058
    Creative Subscriptions ARR $ 1,343,070   $ 1,192,814   $ 1,343,070   $ 1,192,814
                           
                           
    Wix.com Ltd.
    RECONCILIATION OF REVENUES TO BOOKINGS
    (In thousands)
                           
      Three Months Ended   Year Ended
      December 31,   December 31,
       2024    2023    2024    2023
      (unaudited)   (unaudited)
    Revenues      460,455   $        403,771   $    1,760,650   $    1,561,665
    Change in deferred revenues   1,609     2,788     74,450     76,193
    Change in unbilled contractual obligations   2,528     (11,555)     (5,048)     (40,355)
    Bookings $     464,592   $        395,004   $    1,830,052      1,597,503
                           
    Y/Y growth   18%           15%      
                           
                           
      Three Months Ended   Year Ended
      December 31,   December 31,
       2024    2023    2024    2023
      (unaudited)   (unaudited)
    Creative Subscriptions Revenues $ 329,732   $ 296,154   1,264,975   $ 1,152,007
    Change in deferred revenues   (7,057)     (1,098)     55,518     63,124
    Change in unbilled contractual obligations   2,528     (11,555)     (5,048)     (40,355)
    Creative Subscriptions Bookings 325,203   283,501   $ 1,315,445   1,174,776
                           
    Y/Y growth   15%           12%      
                           
      Three Months Ended   Year Ended
      December 31,   December 31,
       2024    2023    2024    2023
      (unaudited)   (unaudited)
    Business Solutions Revenues $ 130,723   107,617   $ 495,675   $ 409,658
    Change in deferred revenues   8,666     3,886     18,932     13,069
    Business Solutions Bookings $ 139,389   $ 111,503   514,607   $ 422,727
                           
    Y/Y growth   25%           22%      
                           
                           
    Wix.com Ltd.
    RECONCILIATION OF COHORT BOOKINGS
    (In millions)
                  Year Ended
                  December 31,
                   2024    2023
                  (unaudited)
    Q1 Cohort revenues             $ 45   $ 45
    Q1 Change in deferred revenues               16     15
    Q1 Cohort Bookings             $ 61   $ 60
                           
                           
    Wix.com Ltd.
    RECONCILIATION OF REVENUES AND BOOKINGS EXCLUDING FX IMPACT
    (In thousands)
          Three Months Ended
          December 31,
                   2024    2023
          (unaudited)
    Revenues                  460,455   403,771
    FX  impact on Q4/24 using Y/Y rates               (110)    
    Revenues excluding FX impact             460,345   403,771
                           
    Y/Y growth               14%      
                           
          Three Months Ended
          December 31,
                   2024    2023
          (unaudited)
    Bookings             464,592   395,004
    FX  impact on Q4/24 using Y/Y rates               1,600    
    Bookings excluding FX impact             466,192   395,004
                           
    Y/Y growth               18%      
                           
                           
    Wix.com Ltd.
    TOTAL ADJUSTMENTS GAAP TO NON-GAAP
    (In thousands)
                           
                           
      Three Months Ended   Year Ended
      December 31,   December 31,
        2024     2023     2024     2023
    (1) Share based compensation expenses: (unaudited)   (unaudited)
    Cost of revenues 3,466   $ 3,675   $ 14,146   $ 15,013
    Research and development   32,320     31,982     126,462     119,482
    Selling and marketing   9,625     11,232     38,755     41,277
    General and administrative   16,390     11,306     61,358     48,853
    Total share based compensation expenses   61,801     58,195     240,721     224,625
    (2) Amortization   1,834     1,488     6,243     5,954
    (3) Acquisition related expenses       9     6     472
    (4) Amortization of debt discount and debt issuance costs   793     789     3,166     4,194
    (5) Impairment, restructuring and other costs       3,103         32,614
    (6) Sales tax accrual and other G&A expenses   881     137     1,464     748
    (7) Unrealized loss (gain) on equity and other investments       (10,296)     (2,536)     (30,608)
    (8) Non-operating foreign exchange income   3,767     15,287     (4,703)     1,499
    (9) Provision for income tax effects related to non-GAAP adjustments       2,368     583     (4,337)
    Total adjustments of GAAP to Non GAAP 69,076   71,080   $ 244,944   235,161


    Wix.com Ltd.
    RECONCILIATION OF GAAP TO NON-GAAP GROSS PROFIT
    (In thousands)
                           
                           
      Three Months Ended   Year Ended
      December 31,   December 31,
       2024    2023    2024    2023
      (unaudited)   (unaudited)
    Gross Profit $ 316,819   $ 277,658   $ 1,196,015   $ 1,049,137
    Share based compensation expenses   3,466     3,675     14,146     15,013
    Acquisition related expenses       5         229
    Amortization   667     667     2,669     2,669
    Non GAAP Gross Profit   320,952     282,005     1,212,830     1,067,048
                           
    Non GAAP Gross margin   70%     70%     69%     68%
                           
                           
      Three Months Ended   Year Ended
      December 31,   December 31,
       2024    2023    2024    2023
      (unaudited)   (unaudited)
    Gross Profit – Creative Subscriptions $ 277,061   $ 243,360   $ 1,051,553   $ 936,492
    Share based compensation expenses   2,482     2,695     10,232     11,081
    Non GAAP Gross Profit – Creative Subscriptions   279,543     246,055     1,061,785     947,573
                           
    Non GAAP Gross margin – Creative Subscriptions   85%     83%     84%     82%
                           
                           
      Three Months Ended   Year Ended
      December 31,   December 31,
       2024    2023    2024    2023
      (unaudited)   (unaudited)
    Gross Profit – Business Solutions 39,758   $ 34,298   $ 144,462   $ 112,645
    Share based compensation expenses   984     980     3,914     3,932
    Acquisition related expenses       5         229
    Amortization   667     667     2,669     2,669
    Non GAAP Gross Profit – Business Solutions   41,409     35,950     151,045     119,475
                           
    Non GAAP Gross margin – Business Solutions   32%     33%     30%     29%
                           
                           
    Wix.com Ltd.
    RECONCILIATION OF OPERATING INCOME (LOSS) TO NON-GAAP OPERATING INCOME
    (In thousands)
                           
      Three Months Ended   Year Ended
      December 31,   December 31,
       2024    2023    2024     2023
      (unaudited)   (unaudited)
    Operating income (loss) 36,020   $ 1,769   $ 100,141   $ (24,380)
    Adjustments:                      
    Share based compensation expenses   61,801     58,195     240,721     224,625
    Amortization   1,834     1,488     6,243     5,954
    Impairment, restructuring and other charges       3,103         32,614
    Sales tax accrual and other G&A expenses   881     137     1,464     748
    Acquisition related expenses       9     6     472
    Total adjustments 64,516   $ 62,932   $ 248,434   $ 264,413
                           
    Non GAAP operating income 100,536   $ 64,701   348,575   240,033
                           
    Non GAAP operating margin   22%     16%     20%     15%
                           
                           
    Wix.com Ltd.
    RECONCILIATION OF NET INCOME TO NON-GAAP NET INCOME AND NON-GAAP NET INCOME PER SHARE
    (In thousands, except  per share data)
                           
      Three Months Ended   Year Ended
      December 31,   December 31,
       2024    2023    2024    2023
      (unaudited)   (unaudited)
    Net income $ 48,024   $ 2,954   $ 138,322   $ 33,137
    Share based compensation expenses and other Non GAAP adjustments   69,076     71,080     244,944     235,161
    Non-GAAP net income$ $ 117,100   74,034   $ 383,266   $ 268,298
                           
    Basic Non GAAP net income per share $ 2.10   $ 1.29   $ 6.90   $ 4.72
    Weighted average shares used in computing basic Non GAAP net income per share   55,786,201     57,317,815     55,579,368     56,829,962
                           
    Diluted Non GAAP net income per share $ 1.93   $ 1.22   $ 6.39   $ 4.39
    Weighted average shares used in computing diluted Non GAAP net income per share   60,648,791     60,512,505     59,953,371     61,106,462
                           
                           
    Wix.com Ltd.
    RECONCILIATION OF NET CASH PROVIDED BY OPERATING ACTIVITIES TO FREE CASH FLOW
    (In thousands)
                           
      Three Months Ended   Year Ended
      December 31,   December 31,
       2024    2023    2024    2023
      (unaudited)   (unaudited)
    Net cash provided by operating activities 133,736   90,380   $ 497,415   $ 248,246
    Capital expenditures, net   (1,963)     (9,990)     (19,336)     (66,049)
    Free Cash Flow 131,773   80,390   $ 478,079   182,197
                           
    Restructuring and other costs       1,411         5,915
    Capex related to HQ build out       8,324     10,325     57,946
    Free Cash Flow excluding HQ build out and restructuring costs 131,773   90,125   488,404   $ 246,058
                           

    Attachments

    The MIL Network

  • MIL-Evening Report: Official interest rates have been cut, but not everyone is a winner

    Source: The Conversation (Au and NZ) – By Isaac Gross, Lecturer in Economics, Monash University

    Gumbariya/Shutterstock

    The Reserve Bank’s decision to cut interest rates for the first time in four years has triggered a round of celebration.

    Mortgage holders are cheering the fact their monthly repayments are now slightly lower, while the Albanese government hopes the small easing in the cost of living will lift voters’ moods.

    This is despite the Reserve Bank’s warnings that further rate cuts may not eventuate, depending on how much further progress is made on taming inflation.

    But it’s important to remember not everybody benefits from an interest rate cut. Some will be worse off.

    Savers lose out

    Not all Australian households are net borrowers. Many are net savers, retirees or prospective homebuyers, who actually lose out when rates fall.

    For starters, only about a third of households are in hock to the banks when it comes to a monthly mortgage repayment.

    Another third of households have paid off their mortgage entirely, and so don’t benefit from a reduction in mortgage interest rates. And the remaining third are renters, who also don’t pay a mortgage.

    So while this news is generally a good thing for borrowers, a fall in mortgage rates only directly benefits a minority of households.

    Here are some of the ways lower interest rates might actually hurt rather than help the typical Australian household.

    Higher house prices

    One of the most immediate effects of lower interest rates is their impact on the housing market. With cheaper borrowing costs, more buyers can afford larger loans, bidding up house prices. This is great if you already own a home, but terrible if you’re still trying to buy one.

    For young Australians locked out of home ownership, a rate cut makes things even harder. It drives prices higher, forcing prospective buyers to stretch their finances further just to get a foot in the market. Reserve Bank calculations suggest that, in the long run, higher house prices from lower rates can outweigh the benefit of lower mortgage repayments.

    Lower returns on savings

    If you’re a saver rather than a borrower, interest rate cuts are unequivocally bad news. Whether you’re saving for a home deposit, retirement, or just an emergency fund, lower rates mean you earn less on your bank deposits. The money in your savings account is now growing more slowly, making it harder to build wealth over time.

    Indeed, more than 20 banks actually cut their term deposit rates in advance of the Reserve Bank’s decision on Tuesday, according to Canstar research.

    Analysis of HILDA data, which surveys household wealth and income, suggests net savers tend to be younger households without property, retirees living off savings, and those who are not in full-time employment. For these groups, lower rates mean less income and fewer financial opportunities.

    Retirees will feel the squeeze

    Many retirees rely on income from interest-bearing assets such as term deposits or cash savings. When rates fall, their returns shrink. The cost-of-living crisis has made it harder for retirees on a fixed income to fund their lifestyles, and a rate cut only makes things worse.

    While some retirees have exposure to the stock market via superannuation, many prefer the stability of cash savings. With rates falling, they face the tough choice of either reducing their spending or taking on more investment risk in their old age.

    Bad news for the dollar, and overseas travellers

    When the Reserve Bank cuts rates, it tends to weaken the Australian dollar. A weaker dollar makes overseas travel more expensive for Australians. That pint of beer in London, that piña colada in Puerto Rico, or that shopping trip to New York all become pricier.

    For Australians planning international holidays, rate cuts are a blow. A strong Australian dollar makes travel cheaper, and lower rates work against that. So while mortgage holders might celebrate, anyone hoping to travel overseas finds themselves worse off.

    woman in a paris street
    A weaker dollar will make overseas travel more expensive.
    Shutterstock


    Read more:
    Heading on an overseas holiday? The Australian dollar tumbled this week – but that’s not bad news for everyone


    More expensive imports

    Just as a weaker Australian dollar makes travel more expensive, it also increases the cost of imported goods. And Australia imports a lot – especially cars and petrol.

    Since the closure of domestic car manufacturing, all new vehicles sold in Australia are imported. Petrol, the second-largest import, is also sensitive to currency fluctuations. When the Australian dollar weakens due to lower interest rates, the cost of these essential goods rises. For the millions of Australians who rely on their cars for daily life, this is a significant financial burden.

    This isn’t to say rate cuts don’t benefit a large portion of Australians. Anyone with a significant mortgage debt will find themselves with lower monthly repayments, and that’s undoubtedly a financial relief.

    But the public narrative around interest rates tends to treat cuts as a universal good, ignoring the many Australians who are left worse off.

    Falling interest rates are a sign the high inflation that has caused the cost-of-living crisis has abated. That is an economic success that ought to be celebrated. But that now rates are falling again, we should at least acknowledge the costs that come with them.

    The Conversation

    Isaac Gross does not work for, consult, own shares in or receive funding from any company or organisation that would benefit from this article, and has disclosed no relevant affiliations beyond their academic appointment.

    ref. Official interest rates have been cut, but not everyone is a winner – https://theconversation.com/official-interest-rates-have-been-cut-but-not-everyone-is-a-winner-250140

    MIL OSI AnalysisEveningReport.nz