Category: Statistics

  • MIL-OSI Global: ‘There has never been a more dangerous time to take drugs’: the rising global threat of nitazenes and synthetic opioids

    Source: The Conversation – UK – By Philip A. Berry, Visiting Research Fellow, King’s College London

    US Drug Enforcement Administration images accompanying a warning about the emergence of nitazenes in Washington DC, June 2022 USDEA

    In the early hours of September 14 2021, three men parked in a quiet car park in the southern English market town of Abingdon-on-Thames. The men, returning from a night out, had pulled over to smoke heroin.

    Unknown to them, the drug had been fortified with a nitazene compound called isotonitazene, a highly potent new synthetic opioid. Two of the men, Peter Haslam and Adrian Davies, overdosed and went into cardiac arrest. The third, Michael Parsons, tried to save them and himself by injecting naloxone, an opioid overdose antidote. Despite paramedics also trying to resuscitate Haslam and Davies, both died at the scene.

    Their deaths were among at least 27 fatalities linked to nitazenes that year in the UK. Since then, nitazenes – otherwise known as 2-benzylbenzimidazole opioids – have become more prevalent in the UK’s illegal drug supply, leading some experts to warn that they are a major new threat because of their extreme potency.

    In June 2023, the UK’s most recent outbreak of deaths linked to synthetic opioids emerged in the West Midlands when drug dealers used nitazenes to fortify low-purity heroin. By August, there were 21 nitazene-related fatalities in Birmingham alone. In some cases, dealers also added xylazine (colloquially known as “tranq”), a non-opioid sedative used by vets.

    The increasing availability of these and other synthetic drugs led the UK’s National Crime Agency (NCA) to warn in August 2024 that “there has never been a more dangerous time to take drugs”. Like Haslam and Davies, many heroin users are unaware they might also be consuming nitazenes, which significantly increase the risk of overdose.

    Given their potency, only a small amount of nitazene is required to produce a fatal dose. While some studies have concluded that nitazenes are even more potent than the synthetic opioid fentanyl, which causes many thousands of deaths in the US, the NCA judges it a “realistic possibility” that the potency of both substances are “broadly equivalent” – making them roughly 50 times more potent than heroin.


    Illicit drug use is damaging large parts of the world socially, politically and environmentally. Patterns of supply and demand are changing rapidly. In our new longform series Addicted, leading drug experts bring you the latest insights on drug use and production as we ask: is it time to declare a planetary emergency?


    Officially, more than 400 deaths plus many non-fatal overdoses were linked to nitazenes in the UK between June 2023 and January 2025. But this is likely to be an underestimate because of gaps within forensic and toxicology reporting. These figures come amid record levels of drug-related deaths in England and Wales. In 2023, there were 5,448 deaths related to drug poisoning, an 11% increase on the previous year and the highest total since records began in 1993.

    This is of particular concern given that the UK has the largest heroin market in Europe, comprising around 300,000 users in England alone. While nitazene-related deaths are still relatively low (although by no means insignificant) compared with those from heroin and other opioids, these new synthetic opioids are cheap and easy to buy, and offer dealers multiple advantages over traditional plant-based drugs.

    Unlike opium, nitazenes and other synthetic opioids can be produced anywhere in the world using precursor chemicals that are often uncontrolled and widely available. Producer countries including China and India have not yet banned all nitazene compounds, meaning they are sold legally – mostly online. Chemical manufacturing companies in these countries can synthesise nitazenes at scale using a comparatively easy three or four-step process.

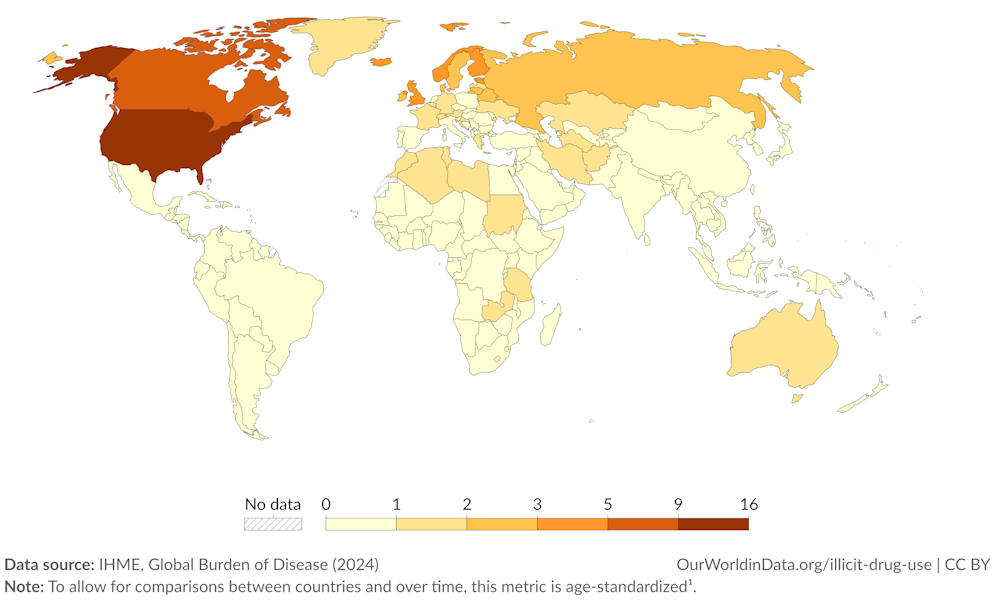
    Opioid use death rates around the world:

    Estimated deaths from opioid use disorders per 100,000 people in 2021.
    Our World In Data, CC BY

    For the past 15 years, I have researched and advised on the international narcotics industry, especially the Afghan drug trade, as an academic, UK Home Office official and consultant. I’ve observed many shifts within global drug markets, and I believe the increasing availability of synthetic drugs in the UK and Europe may represent a new chapter in illicit drug use here – with the emergence of nitazenes only adding to these concerns.

    A brief history of synthetic opioids

    New synthetic opioids (NSOs) are one of the fastest-growing groups of new psychoactive substances around the world. The EU Drugs Agency (EUDA) currently monitors 81 NSOs – the fourth-largest group of drugs under observation.

    NSOs largely fall into two broad groups: fentanyl and its analogues, and non-fentanyl-structured compounds – these include nitazenes, among many other substances.

    Many of these “new” synthetic opioids have, in fact, existed for decades. Nitazenes were first synthesised in the 1950s by the Swiss pharmaceutical company, Ciba Aktiengesellschaft, as pain-relieving analgesics, although they were never approved for medical use.

    Prior to 2019, there had only been limited reports of nitazenes in the illegal drug supply – including a “brownish looking powder” found in Italy in 1966; the discovery of a lab in Germany in 1987; several nitazene-related deaths in Moscow in 1998; and a US chemist illegally producing the drug for personal use in 2003. But since nitazenes re-emerged at the end of the last decade, over 20 variants have been discovered.

    Paul Janssen, the Belgian chemist who first made fentanyl.
    Johnson & Johnson

    The most common NSO in the illegal drug market, fentanyl, was first synthesised by Belgian chemist Paul Janssen in 1960. Fentanyl, which is roughly 100 times more potent than morphine, was approved in the US in 1968 for pharmaceutical use as an analgesic.

    Over the next four decades, however, illegally produced fentanyl resulted in three relatively small outbreaks of deaths in the US. A fourth, larger fentanyl outbreak in Chicago, Detroit and Philadelphia resulted in about 1,000 deaths between 2005 and 2007.

    The current US fentanyl crisis started in 2013, expanding to affect much of the country. Between 2014 and 2019, Chinese companies were the main manufacturers of finished fentanyl substances in the US – to combat this, both the Obama and Trump administrations lobbied Beijing to curtail the fentanyl industry.

    The Chinese government responded by controlling specific fentanyl analogues. However, every time an analogue was banned, chemists there would slightly adjust the formula to produce a new compound that mirrored the banned substance.

    China finally banned all fentanyl-related substances in May 2019, prompting two significant changes in the drug’s supply: a slowdown in the development of new fentanyl analogues, and a reduction in their direct sale to the US from China. Instead, Chinese companies increasingly sent fentanyl precursors to Mexican drug cartels who would synthesise fentanyl (or counterfeit medication) in clandestine labs, before smuggling it across the US border. Consequently, Mexico is now the primary source of fentanyl in the US.

    But these supply changes led to another shift in the global drugs arena, as China’s chemical and pharmaceutical businesses – keen to develop new markets – adjusted their focus to producing uncontrolled synthetic substances, including nitazenes. At the same time, they expanded their geographical focus from North America to include Europe and the UK.

    The nitazene supply chain

    Producing nitazenes is a relatively low-cost exercise. They are largely manufactured in laboratories – both legal and illegal – in China, before being smuggled to the UK and Europe via fast parcel and post networks.

    Nitazenes’ high potency means only small quantities are required, making them easier to transport and harder for border officials to detect. Some Chinese vendors have reportedly been offering to hide nitazenes in legitimate goods such as dog food and catering supplies, to circumvent custom controls. All of this decreases the risk to sellers, and lessens the price of doing business.

    In March 2024, two China-based sellers operating on the dark web were selling a kilo of nitazene for between €10,000 and €17,000 (£12,000-£20,000). During roughly the same period, a kilo of heroin at the wholesale level in the UK was selling for between £23,000 and £26,000. Once bought, nitazenes are largely used to fortify low-purity heroin, although the drug can also be made into pills.

    Video by The Guardian.

    Nitazenes are not limited to the dark web. They are widely and openly advertised on the internet, social media and music streaming platforms. In February 2024, one China-based e-commerce site displayed 85 advertisements for nitazenes. Such sites also sell a range of other synthetic drugs, including fentanyl analogues and precursors, xylazines, cannabinoids and methamphetamine.

    This means drug dealers in the UK and across the world no longer need to have established connections to underworld figures to source illegal drugs. With a click of a mouse, they can have them delivered to their home address. In this sense, the internet has democratised the drug trade by widening access beyond “traditional” criminals.

    In the UK, while the supply of nitazenes is currently assessed as “low”, a number of smaller-scale organised crime groups are importing them to fortify low-purity heroin, before largely dealing it at the “county lines” level. This involves organised crime groups moving drugs – primarily heroin and crack cocaine – across towns, cities and county borders within the UK, using mobile phones or another form of “deal line” to sell to customers.

    In November 2023, Leon Brown from West Bromwich was imprisoned for seven years for dealing drugs containing nitazenes – a verdict described as “a great result in our ongoing efforts to tackle county lines drug dealing” by detective sergeant Luke Papps of the South Worcestershire county lines team.

    A few larger UK criminal networks have also been involved in nitazene distribution. In October 2023, the police and Border Force conducted raids across north London, arresting 11 people. They dismantled a drug processing site and seized 150,000 tablets containing nitazene – the UK’s largest ever seizure of synthetic opioids – as well as a pill-pressing machine, a firearm, more than £60,000 in cash and £8,000 in cryptocurrency. The police suspected the group had been selling the tablets on the dark web.

    Anecdotal reports suggest there have been mixed reactions to the introduction of nitazenes into the illegal drug supply. Richard, a recovering heroin user from Bristol, told Vice magazine that, given their potency, some “people are scared of [nitazenes]” while others are “actively seeking” them.

    As has been the case with fentanyl in the US, users build up tolerance and therefore seek stronger doses. Manny, a heroin user from Bristol, told Vice: “I smoked [heroin cut with nitazenes] and it felt like the first time I’d ever taken drugs.”

    Video by Vice.

    UK-based criminals also use the dark web to export nitazenes abroad. In October 2023, the Australian Border Force identified 22 nitazene discoveries in packages shipped to the country via mail cargo from the UK. British criminals have also trafficked counterfeit medicines containing nitazenes to Ireland and Norway.

    Use of nitazenes is now being detected all over the world. Within Europe, Ireland experienced several nitazene outbreaks in 2023-24 while in Estonia, nitazenes now account for a large share of overdose deaths – a trend also seen (to a lesser extent) in Latvia. Preliminary data suggests at least 150 deaths were linked to nitazenes in Europe in 2023.

    Nitazenes have also been discovered in fake pain medication such as benzodiazepines, oxycodone and diazepam, which widens the number of people at risk to include those with no opioid tolerance. The death in July 2023 of Alex Harpum, a 23-year-old British student who was preparing for a career as an opera singer, was a stark reminder of the danger of buying fake medicine online that may have been contaminated with nitazenes.

    The nitazene ‘boom’ and the global heroin trade

    For decades, Afghanistan was the world’s largest opium producer and the source of most of Europe’s heroin. Then in April 2022, the ruling Taliban announced a comprehensive prohibition on the use, trade, transport, production, import and export of all drugs. As a result, poppy cultivation has fallen to historically low levels for a second consecutive year.

    While this has not, as yet, translated into a shortage of heroin on European streets, including in the UK and Germany, some indicators suggest a slowdown in heroin supplies to the UK. In the year March 2023-24, the quantity of heroin seized in the UK fell by 54%, from 950kg to 441kg. This is the lowest quantity of heroin seized since 1989, when about 350kg was intercepted.

    The NCA assesses that the Taliban ban has created market “uncertainty”. The wholesale price of heroin has increased from roughly £16,000 per kilo prior to the COVID-19 pandemic to about £26,000, while anecdotal reports suggest average heroin purity for users dropped to under 30% (often to 10-20%) in 2024, compared with around 35% in 2023 and 45% in 2022.

    Video by UN Story.

    Even without the Taliban’s ban, heroin is not easy to produce and supply. Cultivating opium poppy is labour-intensive, taking five or six months. The static nature of opium fields means they are visible and susceptible to eradication; poppy crops can also be negatively affected by blight or drought.

    Converting opium into heroin base is also a labour-intensive process that can involve (depending on the production method) at least 17 steps. Acetic anhydride, the main chemical used to convert morphine into heroin, is relatively expensive compared with synthetic precursors. Moreover, heroin is a bulky product, which means it is harder to move in large volumes.

    While the relationship between events in opiate-producer countries and the introduction of synthetic opioids to consumer markets should not be overstated, this new type of drug offers economic advantages to criminals whose “sole motivation is greed”.

    For decades, Turkish, Kurdish and Pakistani criminal networks have been responsible for importing heroin into the UK. Once in the UK, both Turkish and British groups largely control its wholesale supply, with some participation of Albanian gangs.

    To date, there is little evidence to suggest these groups have transitioned to supplying NSOs, including nitazenes. The shifting dynamics in the global drug supply chain, however, could upend traditional markets and the gangs who profit from them.

    America’s synthetic drug crisis

    The synthetic opioid fentanyl has devastated the US, having been linked to about 75,000 deaths in 2023 alone. It is the primary cause of death for Americans aged 18-49. Canada, too, has experienced a wave of deaths: between January 2016 and June 2024, there were 49,105 apparent opioid deaths there, with fentanyl implicated in a large proportion.

    While the North American nitazene market is still small in comparison, the US, followed by Canada, has reported the highest number of unique nitazenes to the UN Office on Drugs and Crime’s Early Warning Advisory on New Psychoactive Substances.

    More than 4,300 reports of nitazenes have reached the US National Forensic Laboratory Information System since 2019. They are typically used to fortify fentanyl and other opioids, which can produce a fatal concoction.

    Efforts to stem the flow of NSOs, including nitazenes, from China to the US and elsewhere will prove challenging. And even if China does implement stricter controls, other countries could step in to fill the void. According to the Commission on Combating Synthetic Opioid Trafficking:

    The overall sizes of these industries, limited oversight efforts and political incentives contribute to an atmosphere of impunity among firms and individuals associated with those industries.

    While US and Chinese counter-narcotics cooperation ended in 2022 amid increasing geopolitical tensions, the following November’s summit in Woodside, California, between presidents Joe Biden and Xi Jinping saw them agree to recommence collaboration.

    As a result, China recently closed several chemical companies that were shipping fentanyl precursors and nitazenes to the US. These vendors used encrypted platforms and cryptocurrency to conduct the deals, and mislabelled the consignments to try to ensure the substances evaded border controls. China has also outlawed more chemicals and substances, including several nitazene variants.

    But President Trump’s imposition of tariffs on imports from China – which sit alongside proposed taxes on imports from Canada and Mexico, in part for supposedly not doing enough to curb the trafficking of fentanyl and its precursors to the US – threatens this counter-narcotics cooperation.

    While nitazenes are not yet widely available in the US, their presence within some fentanyl batches is complicating the US opioid crisis – and according to some experts, has the potential to further increase the already shocking number of synthetic opioid-related deaths.

    The UK response to nitazenes

    Successive UK governments have made tackling NSOs a high priority. Shortly after the most recent nitazene-related deaths were discovered in the UK in summer 2023, the NCA launched Project Housebuilder to lead and coordinate the law enforcement and public health response.

    This was soon followed by the establishment of a government-wide Synthetic Opioids Taskforce “to improve…understanding, preparedness and mitigation against this evolving threat”. Chris Philp, then the UK’s combatting drugs minister, stated that “synthetic opioids are at the top of [this government’s] list because of the harm they cause”.

    The taskforce has taken a range of measures, such as controlling more NSOs as class A drugs, conducting more intelligence operations at UK borders, widening access to naloxone, and enhancing the UK’s real-time, multi-source drug surveillance system. The government also worked with the US and Canada to learn from their experiences.

    Recently, the current UK government banned a further six synthetic opioids and introduced a generic definition of nitazenes as class A drugs. And the UK’s current government, unlike its Conservative predecessor, has also indicated its willingness to consider evidence from the UK’s first drug consumption facility, which recently opened in Glasgow.


    Read more:
    Drug deaths are rising and overdose prevention centres save lives, so why is the UK unwilling to introduce them?


    Other policy measures worthy of consideration include expanding drug checking services whereby drug users submit drugs to a lab to test what is in them, then are provided with information about the sample. These services offer vital information to the public and authorities about current drug trends.

    While there is high uncertainty about what is going to happen next in the UK regarding illicit drug trends, the evolution of the US drug landscape over generations provides some important lessons.

    Lessons from the US

    The US fentanyl crisis shows drug markets can change quickly with long-lasting consequences. Most heroin on US streets contains – or has been replaced by – fentanyl. According to DEA seizure data, US heroin seizures declined by nearly 70% between 2019 and 2023, whereas fentanyl seizures have increased by 451%.

    However, illegal drug markets evolve in different ways and at different paces. In May 1989, Douglas Hogg, a UK Home Office minister, travelled to the US and the Bahamas on a fact-finding mission about crack cocaine, a drug that was predicted to spread from the US to the UK. Upon his return, Hogg noted:

    The ethnic, social and economic characters of many of our big cities are very similar to those in the US. If they have a crack problem, why should not we? … The use of crack in Great Britain is likely to develop very substantially over the next few years.

    But this “crack invasion”, as some called it, did not materialise in the UK to the extent it had in the US – and the same was true about a predicted wave of methamphetamine use in the UK, which remains low compared with the US.

    It is also unlikely the UK and Europe will experience a synthetic opioid crisis on the same scale as the US. The first wave of the US crisis was driven by extensive overprescription of opioids for pain relief. This increased the number of people addicted to opioids, some of whom later turned to heroin, before transitioning to fentanyl. In contrast, large-scale opioid prescriptions have not been a major issue in the UK or Europe, although there is some diversion of legal fentanyl into the illegal drug market in Europe.

    Video by The Brookings Institution.

    According to Alex Stevens, professor of criminology at the University of Sheffield, another factor differentiating the US and Europe is the provision of drug treatment and harm reduction programmes. Opioid users in Europe, and to a lesser extent in the UK, are much more likely to be in medication-assisted treatment than their US counterparts, thus reducing the number of people at risk. These interventions are reinforced by different socioeconomic factors in much of Europe, such as lower economic inequality, stronger social protections, and better healthcare systems.

    None of this, though, means the nitazene threat in the UK and Europe should be underestimated, nor that use and supply of these drugs (and other NSOs) will not increase from its current relatively low base. As the NCA recently warned:

    While a zero-tolerance approach from law enforcement, plus advice to users on the heightened dangers, may contain or slow the current uptake, we must prepare for these substances to become widely available, both unadvertised in fortified mixes and in response to user demand as a more potent high.

    The future of new synthetic opioids

    Predicting the future of NSO use and trafficking is a challenging task. Projections for Europe range from existing opiate stockpiles ensuring that heroin consumer markets remain serviced (assuming the Taliban ban is short-lived), to a heroin shortage which results in more drug dealers turning to NSOs to plug the shortfall, which in turn could lead to lasting changes in European drug markets (as happened in a few countries following the Taliban’s first opium ban in 2000-01).

    In such a scenario, it is possible that Turkish criminal networks may exploit their links with Mexico’s Sinaloa cartel to source NSOs. Mexican criminal gangs also operate in Europe, which may increase the likelihood of them trying to open a new NSO market on the continent.

    There is also evidence that some Italian criminal organisations have entered the NSO marketplace. In November 2023, Italian authorities announced the seizure of 100,000 doses of synthetic drugs, including fentanyl, as part of operation Painkiller, a joint Italian-American initiative.

    Given the many advantages for criminal groups of NSOs, it seems likely they are here to stay. A key question is whether nitazenes (or other NSOs) will supplant traditional heroin as the opioid of choice, as they have done in the US, or remain at relatively low levels in Europe, co-existing with or mixed into the heroin supply.

    In December 2023, Paul Griffiths, the EUDA’s scientific director, told Vice: “We’re not seeing much new initiation of heroin use in Europe. So in five to ten years … as heroin users get older and more vulnerable, we’re not going to have much of an opiate problem left.”

    But he warned that if heroin use does dry up: “You might then see opioids appearing in other forms and preparations, such as pills, that could potentially become popular among younger age groups who currently do not appear attracted to injecting heroin.”

    While previous NSO outbreaks in the UK were relatively short-lived and limited in scale, the most recent nitazene outbreak, which started in summer of 2023, has been more sustained, covered more parts of the UK, and involved more fatalities. The broader trend in Europe also suggests the prevalence and variations of NSOs are increasing at a faster pace than in previous years.

    Notwithstanding, nitazene use and supply in the UK currently remains relatively low. In fact, the rate of nitazene-linked deaths – at least those officially reported – decreased between spring 2024 and the end of the year.

    In the short term, then, it seems unlikely there will be a nitazene “explosion”. Rather, criminal groups will probably try to increasingly embed nitazenes into the UK drug market at a similar pace to the last 18 months.

    However, this situation could change rapidly in future, especially if larger criminal networks involved in heroin importation switch to smuggling NSOs, and there is a genuine shortage of Afghan heroin. This problem would be compounded if drug users start seeking nitazenes, thus creating demand for them.

    Either way, the UK government, along with its European partners, should continue to reinforce the whole drug system, to prepare for the worst-case scenario.


    For you: more from our Insights series:

    To hear about new Insights articles, join the hundreds of thousands of people who value The Conversation’s evidence-based news. Subscribe to our newsletter.

    Philip A. Berry does not work for, consult, own shares in or receive funding from any company or organisation that would benefit from this article, and has disclosed no relevant affiliations beyond their academic appointment.

    ref. ‘There has never been a more dangerous time to take drugs’: the rising global threat of nitazenes and synthetic opioids – https://theconversation.com/there-has-never-been-a-more-dangerous-time-to-take-drugs-the-rising-global-threat-of-nitazenes-and-synthetic-opioids-247268

    MIL OSI – Global Reports

  • MIL-OSI Global: Experts have challenged the medical case against Lucy Letby. What about the statistical evidence?

    Source: The Conversation – UK – By Christian Yates, Senior Lecturer in Mathematical Biology, University of Bath

    An international panel of medical experts have thrust Lucy Letby back into the spotlight. At a press conference convened by Letby’s legal team, the experts cast doubt over the former nurse’s conviction. Letby was given 15 whole-life sentences for murdering seven babies and attempting to murder seven more.

    Speaking at the press conference in London, retired neonatologist Dr Shoo Lee told the assembled reporters: “In all cases death or injury were due to natural causes or just bad medical care.”

    Why should we take Dr Lee’s word for it? Well, in part, because he is the author of a key paper on air embolisms, one of the methods that Letby was accused of using to kill babies, which formed a key part of the prosecution’s evidence at the trial.

    He also claims that the paper’s findings were misinterpreted at the trial and that a newly updated version of the article would help exonerate Letby rather than convict her.

    The Letby conviction has always attracted critical attention because there were no witnesses who could confirm they saw her attacking any of the babies she was convicted of murdering. Nor did anyone see her perform actions that could have constituted the attempted murders of seven others.

    Consequently, the prosecution used statistics alongside the medical evidence the expert panel has now cast doubt upon. So how solid is that statistical evidence?

    A key piece of statistical evidence is a chart which showed that Lucy Letby was on duty every time one of the crimes of which she was accused occurred, but that none of the other nursing staff were.

    On the face of it, it seems quite damning. But when you think about it, it’s unsurprising that Letby’s column is the only one full of crosses. Any of the events at which she was not present she would not have been charged with and consequently wouldn’t appear on the chart.

    This is an example of what is known in statistics as the Texas sharpshooter fallacy.

    The fallacy is named for a story about a Texan cowboy who likes to head out to his barn after a few drinks for target practice. Invariably, the barn wall gets peppered with random bullet holes during the inebriated exercise, and purely by chance some of these holes are clustered.

    One morning the savvy “sharpshooter” gets out his paint cans and daubs a target around this cluster of holes to give the impression of accuracy to anyone who didn’t see the process by which they were made and to draw attention away from the other more dispersed bullet holes.

    The sharpshooter fallacy occurs when a conclusion is drawn based only on data consistent with a given hypothesis, ignoring data that doesn’t support the proposed conclusion.

    Imagine, for example, you made a chart similar to the one used to convict Letby, this time including only those deaths at which a different member of the nursing staff was present. It’s entirely possible – for example, if they were present for deaths at which Letby was not – that their name would be above the only column full of crosses and not Letby’s.

    Indeed, it later transpired that the table did not include six other deaths that occurred during the same period and with which Letby was not charged. The jury was not told about these other deaths.

    As Jane Hutton, a professor of medical statistics at the University of Warwick argues: “If you want to find out what went wrong, you need to consider all deaths, not just a subset of them.”

    She also points out that it’s important to consider how likely the other alternative causes of death were at the struggling Countess of Chester neonatal unit.

    The prosecutor’s fallacy

    The probability of so many deaths on a neonatal unit in such a short period should be quite low. At first glance, this might seem to make the alternative explanation of murder seem more likely. But this is a classic statistical error.

    This mistake is so common in courtrooms that it is known as the prosecutor’s fallacy. The argument starts by showing that, if the suspect is innocent, seeing a particular piece of evidence is extremely unlikely.

    For Letby, this is the assertion that if she was innocent of killing these babies, the probability of them dying due to other causes is extremely low. The prosecutor then deduces, incorrectly, that an alternative explanation – the suspect’s guilt – is extremely likely.

    The argument neglects to take into account any other possible alternative explanations, in which the suspect is innocent, such as the death of these babies due to inadequate care. It also neglects the possibility that the explanation that the prosecution is proposing, in which the suspect is guilty, may be just as uncommon as the alternative explanations, if not more so.

    By just presenting the low probability of these seven babies dying naturally, the inference that an untrained jury is invited to draw runs something along these lines: “The deaths of these babies from natural causes is extremely rare, so the odds that the deaths are the result of murder is correspondingly extremely high.”

    However, it must also be taken into account, when weighing up the evidence, that multiple infant murders are also extremely uncommon. What really matters is the relative likelihoods of the different explanations. Weighing these very unusual events against each other is not an easy thing to do.

    Criminal cases review

    Other statistical issues with the case also deserve more attention: the high number of deaths at the Countess of Chester, even excluding the babies that Letby has been convicted of murdering. Or the possibility of false positive medical identifications of murder, for example.

    Whether Letby’s team’s appeal to the Criminal Cases Review Commission will be successful or not remains to be seen. The statistical issues over the case, when taken alongside the doubts about the medical evidence, mean that there is certainly a possibility.

    Throughout all this, it’s important to remember the families affected by the events at the Countess of Chester Hospital. Whatever the ultimate truth of the matter, this ongoing case will undoubtedly make dealing with their grief more difficult.

    Christian Yates does not work for, consult, own shares in or receive funding from any company or organisation that would benefit from this article, and has disclosed no relevant affiliations beyond their academic appointment.

    ref. Experts have challenged the medical case against Lucy Letby. What about the statistical evidence? – https://theconversation.com/experts-have-challenged-the-medical-case-against-lucy-letby-what-about-the-statistical-evidence-249221

    MIL OSI – Global Reports

  • MIL-OSI USA: PHRC discusses 2024 ‘No Hate in Our State’ Report

    Source: US State of Pennsylvania

    February 05, 2025Harrisburg, PA

    PHRC discusses 2024 ‘No Hate in Our State’ Report

    The Pennsylvania Human Relations Commission (PHRC) joined by state and local leaders at the state Capitol, discuss their newly released 2024 ‘No Hate in Our State’ report, which details trending discrimination statistics throughout the Commonwealth. The speakers discussed programs and initiatives offered by the PHRC and others to help eliminate hate and build a community of support and understanding.

    PHRC Executive Director Chad Dion Lassiter said, “As the Commonwealth’s civil rights enforcement agency, it is our responsibility to not only investigate all complaints of discrimination, but to truly live up to our vision, ‘that all people in Pennsylvania will live, work, and learn free from unlawful discrimination.’”

    In 2025, the PHRC will mark 70 years since its creation. It was crafted from two pieces of legislation, the Pennsylvania Fair Employment Act of 1955 (later changed to the Pennsylvania Human Relations Act in 1997) and the Pennsylvania Fair Educational Opportunities Act of 1961. In general, Pennsylvania law prohibits discrimination based on race, color, religious creed, ancestry, age (40 and over), sex, national origin, familial status (only in housing), disability, and the use, handling, or training of support or guide animals for disability. Retaliation for filing a complaint, opposing unlawful behavior, or assisting investigations is also illegal.

    Speakers in Order:
    Amanda Brothman – Communications Director, Pennsylvania Human Relations Commission (PHRC)
    Chad Dion Lassiter – Executive Director, PHRC
    Senator Vincent Hughes – 7th District, Montgomery & Philadelphia Counties
    Michael Hardiman – Commissioner, PHRC
    Ahmet Tekelioglu – Executive Director, CAIR
    Yemi Baitista – Chair, Adams County Advisory Council to the PHRC
    Rep. Christopher Rabb – 200th District, Philadelphia County
    Rev. Marshall Mitchell – Senior Pastor of Salem Baptist Church

    MIL OSI USA News

  • MIL-OSI Europe: ASIA/PHILIPPINES – “State of food emergency” while the country is in electoral campaign

    Source: Agenzia Fides – MIL OSI

    Foto di Eduardo Prim su Unsplash

    Manila (Agenzia Fides) – The state of “food emergency” declared by the Philippine government to counter the “rice crisis” – due to an “extraordinary” increase in the price of the country’s staple food – “is an economic problem, but it also has political implications: we are in the electoral campaign, with a view to the elections in May, and the rice issue will influence this period. It will be used by politicians to capitalize on the consensus for or against President Marcos”, underlines Antonio Ledesma, Archbishop Emeritus of Cagayan de Oro on the island of Mindanao, in an interview with Fides.“In Mindanao”, says the Jesuit, “there is discontent at the moment, but people can still buy rice at the market. Of course, this is an important issue and we are in a precarious balance”. “There are farmers who have a low income from growing rice for sale,” the Archbishop continued. “Their situation overlaps with the problem of imports, since domestic demand in the Philippines cannot be met by local production. Making the country self-sufficient in rice needs and finding measures to achieve this is an open and protracted problem.These are all issues that affect the common good, but they are now entering the electoral campaign and are in danger of being instrumentalized,” he explains.The declaration of rice food emergency was signed on February 4 and allows for the release of rice stocks from the National Food Authority (NFA) to stabilize prices “and ensure that rice, a staple food for millions of Filipinos, remains accessible to consumers,” said Agriculture Secretary Francisco Tiu Laurel Jr. A release of 300,000 tons of rice, about 30,000 per month, is planned for a period of 10 months to stabilize the market through lower prices. The NFA will start selling its rice stocks in selected markets to government-controlled companies at a price of 36 pesos per kilo, while rice currently sells between 50 and 60 pesos per kilo. This will benefit both consumers and local farmers as rice will be available at a lower price. The food safety emergency will remain in effect until it is lifted by the department. In this regard, Laurel stressed that food prices have remained high despite the decline in global rice prices and the reduction of tariffs on imported rice in July 2024. According to the Philippine Statistics Authority (PSA), rice inflation reached 4.2 percent at the end of 2024, with a steady increase. In this situation, welfare programs for the sale of cheaper rice in centers and outlets under the “Rice for all” program were launched to help the country’s citizens, especially from the poorer sections of the population. In the Catholic communities, to support the food security of the poorest, the “Pondo ng Pinoy” program is active, an anti-poverty initiative that was first launched in the Diocese of Manila in 2004 and has now spread to 30 dioceses. The basis of the program is the formula “a little for many”, in which as many people as possible are invited to donate 25 cents every day as a gesture of charity towards those in need. (PA) (Agenzia Fides, 7/2/2025)
    Share:

    MIL OSI Europe News

  • MIL-OSI Russia: “The situation in Russian science looks stable and positive”

    Translartion. Region: Russians Fedetion –

    Source: State University Higher School of Economics – State University Higher School of Economics –

    © Higher School of Economics

    On the eve of Russian Science Day, TASS held a press conference dedicated to the results of the third round of the comprehensive study “We do science in Russia” He was conducted Institute for Statistical Research and Economics of Knowledge (ISSEZ) HSE. The authors of the study and experts representing higher education, research institutes and industry spoke about the state of domestic science, the drivers of its development, the dynamics of change and the barriers that need to be overcome.

    The first “Making Science in Russia” study was conducted in 2017, the second round took place in 2022, and the third from October to November 2024.

    Present and future

    As explained by the first vice-rector, director of the HSE ISSEK Leonid Gokhberg, the basis of the study was the results of a survey of the heads of 719 universities and leading scientific organizations, which make up almost the entire core of Russian science. These are “the key players who make the weather in this area and determine its development with their daily practices.”

    The assessment was carried out on 87 factors grouped into 8 large blocks, which made it possible to determine the sentiment index in Russian science. In the second step, the researchers identified 47 measures of state scientific and technical policy, assessed their effectiveness on a number of parameters and rated them.

    “The situation in Russian science looks stable and positive, there is progress compared to previous rounds of the study,” Leonid Gokhberg noted. For example, assessments related to the institutional conditions of functioning of universities and scientific organizations have improved – first of all, we are talking about increasing awareness of policy measures and regulation of important aspects of their daily life (regulation of state assignments and state purchases, tender procedures, etc.).

    Representatives of the scientific sphere assess the prospects for the coming years even more optimistically. Expectations are connected with further increase in the efficiency of scientific research, cooperation with business and stimulation of investment inflow from commercial structures, development of the information base of science.

    At the same time, the situation looks different in different sectors. “Universities are feeling the best, and this correlates with the measures of their support that have been launched in recent years and have had a rather positive impact on the development of university science,” Leonid Gokhberg stated.

    Financing

    The director continued the topic Center for Statistics and Monitoring of Science and Innovation ISSEK Ekaterina Streltsova, touching upon “the most sensitive issue” – funding of science.

    This block received the most restrained assessment from the scientific community, but this does not mean that everything is bad. Science is financed from many sources, and the study showed that the situations with different sources differ for different organizations. Key sources of budgetary financing are assessed more restrainedly in general, since they may not be very relevant for non-profit organizations that participated in the survey (for example, grants from Russian scientific foundations).

    “We see a significant improvement in the situation for all types of organizations compared to 2022, as budget expenditures on science are steadily increasing. This year, almost 3% of federal budget funds are planned to be allocated to support science, this is the highest figure in the last ten years, and we hope that funding for science will continue to increase,” Ekaterina Streltsova emphasized.

    Organizations of all types were skeptical about the provision of funding from state companies and especially from business, and, in her opinion, this is a predictable result given the current structure of funding for Russian science. In recent years, the business sector has provided about 30% of the costs of science, and although this figure has increased compared to 2010, measures are needed to stimulate investment.

    Of all the sources of funds, foreign organizations received the lowest ratings. “It was these ratings that influenced the overall score for the entire area and pulled it down, and this is understandable,” says Ekaterina Streltsova. “Foreign resources have never been significant for the development of Russian science; in the last five to six years, the share of these sources in the total volume of expenses has not exceeded 2.5%.”

    Personnel and equipment

    Ekaterina Streltsova noted that the human resources potential received a positive assessment for most factors: the managers are satisfied with both the quantitative and qualitative characteristics of the scientific personnel they work with. Compared to 2022, some values have improved due to the implementation of a whole range of measures. Difficulties are associated with attracting foreign researchers and participation in international projects.

    The assessment of material and technical conditions is also quite stable: organizations are generally optimistic about the availability of scientific equipment and consumables, but many note the complication of supplies from abroad. The availability of access to specialized domestic software and Russian AI-based systems is assessed cautiously, but it is in this area that expectations are high and positive.

    The weak point remains the commercialization of results – their promotion and implementation in the economy. For example, universities and research organizations are actively involved in patent activities, but their contribution to the development of licensing activities in the domestic market is still limited. Obviously, this is due, among other things, to insufficient dialogue between science and business. “Although the situation has improved somewhat compared to 2022, we see that the intensity of interaction with business in the form of joint laboratories, basic departments, and so on is still assessed rather restrainedly, which, of course, requires further implementation, including of the measures already in force,” concluded Ekaterina Streltsova.

    “A most interesting analysis”

    The results of the study “Making Science in Russia” were commented on by representatives of science, higher education and industry.

    Director of the Joint Institute for Nuclear Research, Academician of the Russian Academy of Sciences Grigory Trubnikov noted that HSE scientists conducted “a most interesting analysis.” In his opinion, over three rounds of research, “analytics has taken off,” it has a large audience, and the data can be trusted.

    Commenting on the conclusions about science funding, he put forward the hypothesis that the problem is not that it should be increased, say, twofold, but that “science should be done faster” — this is the main request of the scientific community. If we remove the obstacles associated with control, procurement procedures, academic mobility, and foreign restrictions, then the competitiveness of Russian science will increase.

    Grigory Trubnikov also noted that in terms of international cooperation, everything depends on the specific organization, and things are going well at his institute in Dubna – cooperation with China, Mexico, Brazil is developing, and this is a noticeable trend in general.

    Stanislav Terekhov, head of the laboratory of antibiotic resistance at the Institute of Bioorganic Chemistry of the Russian Academy of Sciences, highly praised the existing measures to support science, including the creation of youth laboratories (his laboratory is one of them). In his opinion, this allows the best personnel to be retained in the country and students and postgraduates to be integrated into laboratory practice, but state support should be supplemented by private initiatives.

    Science and Business

    Director of the Institute of Translational Medicine and Biotechnology at Sechenov University Vadim Tarasov emphasized the links between science and business in his speech. In his opinion, the Priority 2030 program “gave universities a huge opportunity to be flexible in their interactions with industry,” and now it is necessary to set goals for 10-15 years ahead, understanding what technologies the country needs to ensure sovereignty, and which ones are worth entering foreign markets with.

    First Vice President for MTS Technologies, Head of the MTS Basic Department at HSE Pavel Voronin also highly praised the study, calling it very complete and high-quality.

    In his opinion, science is the foundation for technology, and “the geopolitical situation requires us to invest more in this fundamental part,” but the economic situation forces many companies in the market to approach finances prudently. When it is necessary to monitor expenses more closely, the first thing that is cut is unpredictable, long-term investments. “From a business point of view, it is important not to get caught in these scissors, to correctly determine priorities and leave a certain share of investments for long-term research,” concluded Pavel Voronin.

    Head of the scientific and technical cooperation department of the State Corporation Rosatom Ekaterina Chaban stated that in her corporation “every scientific project is also a business project” and confirmed the researchers’ findings on the successful attraction of young people to science. In the scientific division of Rosatom, out of 2 thousand scientists, 38% are under 35 years old, 48% are under 39 years old, and among the directors of institutes there are scientists and designers under 40 years old. “The corporation does a lot to maintain the influx of young people and retain young personnel,” she explained.

    Please note: This information is raw content directly from the source of the information. It is exactly what the source states and does not reflect the position of MIL-OSI or its clients.

    MIL OSI Russia News

  • MIL-OSI Economics: Asian Development Blog: Preparing the Nation for Integration: Timor-Leste’s Path to ASEAN

    Source: Asia Development Bank

    Timor-Leste has taken major steps toward joining the Association of Southeast Asian Nations, but challenges remain. Strengthening governance, promoting investments, expanding trade, and enhancing human capital are still needed

    Timor-Leste is a young democracy facing significant development challenges. The poverty rate remains high at 41.8% and economic growth has been volatile, affected by both external and domestic shocks.

    The economy relies heavily on public spending and petroleum revenues. Long-standing structural challenges such as a weak private sector, inadequate infrastructure, a lack of skilled labor, and a challenging business environment, present daunting obstacles to economic diversification and long-term growth.

    Recognizing the role that regional cooperation and integration can play in addressing these challenges, Timor-Leste has long pursued membership in the Association of Southeast Asian Nations (ASEAN). This has been a strategic priority and a cornerstone of its economic development and foreign policy.

    ASEAN membership is expected to drive domestic policy and institutional reforms while expanding markets and reduce costs. It should also diversify the economy, attract trade and investments, and improve access to technology and skills.  

    Since applying for ASEAN membership in 2011, Timor-Leste has undertaken significant reforms, investments, and policy alignments—establishing a Directorate-General for ASEAN Affairs, modernizing customs, and engaging the private sector—to meet the requirements for full membership.

    Supported by partners like the Asian Development Bank, the country has accelerated capacity-building initiatives and advanced infrastructure, trade, renewable energy, and agriculture to foster broader economic opportunities.

    But more needs to be done for Timor-Leste to reap the full benefits of ASEAN.

    Timor-Leste requires comprehensive capacity-building initiatives to enhance the technical knowledge and skills of government officials and stakeholders. Developing and implementing targeted training workshops and seminars in key areas, especially those focused on specialized areas and sectoral drivers of growth, such as tourism or agriculture, will be crucial. Establishing mentorship programs that pair ASEAN expertise with Timor-Leste sectoral counterparts will provide knowledge transfer.

    Timor-Leste has made significant progress toward ASEAN accession, but continued collaboration, investment in human capital, and infrastructure improvements remain crucial for fully integrating into the region and maximizing economic opportunities.

    To ensure harmonization with ASEAN standards, expert guidance will be needed to assist in the review and improvement of government legislation, rules, and procedures. Facilitating peer-to-peer learning opportunities and best practices exchanges with other ASEAN member states that have successfully implemented core provisions will be beneficial. Providing resources and tools to assist in drafting and updating legislation to ensure compliance with core provisions is essential.

    Upgrading transport infrastructure is also crucial, requiring a strategic approach involving the development of comprehensive transport plans, substantial financial investments, and the engagement of specialized transport engineering expertise.

    Key areas of support include sustainable financing for road maintenance, capacity building, and technical assistance to strengthen planning, monitoring, and project supervision. Enhancing border protection and monitoring, improving equipment and resource allocation, and incorporating environmentally sustainable practices are also key elements.

    By aligning with international standards and focusing on regional integration, Timor-Leste can foster connectivity, streamline trade processes, and contribute significantly to overall economic growth and regional integration. Furthermore, developing ICT infrastructure is vital. Assisting in the design and implementation of automation and digitization projects for public services and trade facilitation measures will enhance efficiency.

    Timor-Leste requires comprehensive support to address its human capital challenges and improve labor force participation and food security. Key initiatives from ASEAN member states and other partners include promoting higher education through international education fairs, prioritizing Timorese students for university admissions, and establishing student and labor exchange programs.

    For basic education, creating teacher training centers and improving English language proficiency is a key priority. Online learning platforms will ensure continuous skill development and retention. The government has renewed focus on early childhood development, supported by the 2024 general state budget.

    Additional initiatives like the Inter-Ministerial Taskforce and the National Health Sector Nutrition Strategic Plan (2022-2026) target stunting and malnutrition, with the goal to reduce stunting from 47% to 25% by 2030. Promoting sustainable agricultural practices and strengthening healthcare infrastructure are also crucial.

    Timor-Leste is committed to modernizing its financial systems, developing e-payment solutions, and enhancing financial literacy and inclusion. Strengthening the business sector will create more opportunities for trade and investment.

    Supporting local businesses through capacity-building training focused on ASEAN trade, marketing, financial access policies, connectivity, and digital skills will ease integration barriers. Improving infrastructure and internet access through financial assistance will help businesses overcome critical barriers. Connecting with the ASEAN Business Advisory Council and other ASEAN members will boost trade and investment linkages.

    Timor-Leste aims to establish strong connections with ASEAN officials, stakeholders, and bodies, such as central banks and national statistics institutes. Government agencies represent Timor-Leste’s interests at ASEAN meetings and working groups. On the private sector side, Timor Leste’s Chamber of Commerce and Industry has participated in meetings with the ASEAN Business Advisory Council as an observer.

    Timor-Leste has made significant progress toward ASEAN accession, implementing key reforms and strengthening its economic and institutional frameworks. However, continued collaboration with ASEAN member states and development partners is crucial to overcoming remaining challenges.

    By sustaining momentum in governance, trade, and infrastructure improvements, Timor-Leste can fully integrate into the region and unlock new opportunities for growth. Stakeholders must remain engaged in supporting this journey, ensuring that the country maximizes the benefits of ASEAN membership for its people and economy.

    Bold Sandagdorj, country economist at ADB’s Timor-Leste Resident Mission, contributed to this blog post.
     

    MIL OSI Economics

  • MIL-OSI United Kingdom: Phenomenal figures released for York’s Park & Ride

    Source: City of York

    Figures released today show that 2024 was the busiest year for York’s Park & Ride since 2017, with the total number of journeys exceeding 4.5 million, almost one million higher than in 2023.

    December saw the most trips for a decade, recording nearly 500,000 journeys, a 3.5% increase on the previous highest monthly total set in December 2016.

    City of York Council estimates that people boarding at the Park & Ride sites in December resulted in over 61,700 cars not travelling into central York – equivalent to a line of traffic that would be long enough to reach central London.

    In December, First Bus sold 148,310 tickets at the Park & Ride sites alone (the remaining journeys being people who joined the bus along the route or were returning from the city centre). Industry standard definition of occupancy per car for a leisure trip is 2.4 people. This gives us a total of 61,700 cars that didn’t come into the city centre over Christmas. Google Maps shows that the road route from York Minster to Westminster Abbey is 210 miles. If we say a car takes up 6 metres of space on the road, 61,700 times 6 metres is 230 miles. Therefore, 61,700 cars would stretch all the way to central London.

    York’s Enhanced Bus Partnership, which oversees £17.2 million of government funding for the Bus Service Improvement Plan, ran a marketing campaign to promote the Park & Ride as well as direct bus services for six weeks before Christmas. Working with Make It York and all bus operators, the social media posts and adverts reached over 2.2 million people in a campaign targeting towns and cities where previous research has shown Christmas Market visitors come from.

    Councillor Kate Ravilious, Executive Member for Economy and Transport at City of York Council, said:

    Just shy of half a million journeys in one month is an incredible milestone to reach, so thank you to all the residents and visitors for using the Park & Ride, and thank you to First Bus for increasing the number of buses available during this incredibly busy period.

    First Bus invested in more services on the network in November and December, increasing frequency on several routes to support the York local and visitor economy in anticipation of customer demand. First Bus replicates this investment during other busy periods to keep York visitors and commuters moving sustainably throughout the year.

    Cllr Ravilious continued:

    The numbers are phenomenal but we do also need to recognise that York still experienced congested streets in the run up to Christmas, so while we are delighted, we continue our work throughout the year to support and promote the city’s bus services as well as other sustainable forms of transport.

    “Our young people’s ticketing and marketing campaigns, which and are funded by central government, have over the last 12 months helped make bus use more attractive and given more people more options, and we will soon be consulting on improvements to the Park & Ride sites.”

    Kayleigh Ingham, Commercial Director of First Bus North & West Yorkshire, said:

    The superb performance throughout 2024 is a tribute to the commitment and high standards of service delivered by the First Bus team.

    “We’ve demonstrated that bus is an easy and sustainable way to travel into York. We’re attracting more customers due to good value fares, zero-emission buses, and our service, which is delivered with a smile. The benefits this brings, with cleaner air and quieter city centre roads, contributes to York’s environmental targets.”

    Sarah Loftus, Managing Director of Make It York, said:

    It is wonderful to see the great results for bus travel for the year and 500,000 journeys during the Christmas period is fantastic.

    “We are very fortunate to have a bus service within the city that supports both demand and sustainability. Collaboration between all parties on communicating key messages was key and we look forward to working with and supporting the transport sector throughout 2025.”

    These Park & Ride figures follow the Department for Transport’s own statistics released late in 2024 which show that York’s bus services as a whole (including all local services and the Park & Ride) are once again in the top ten of all local authorities for the number of bus trips per resident. An average of 70.6 journeys per head of population in 2023 and 2024 ranks York the best in Yorkshire and nationally sits 9th out of 90 English local authority areas.

    The data also showed that York’s bus trips are up 35% from 2021 and 2022, almost quadrupled from 2020 and 2021 and now back within 3% of the level they were in 2019 and 2020 (the year before COVID-19). This is one of the best post-pandemic recovery rates in the country.

    In addition to December’s figures, November 2024 was the busiest November ever recorded, with 10% more passengers than the previous record set in 2016.

    MIL OSI United Kingdom

  • MIL-Evening Report: WA Labor has thumping Newspoll lead a month before election; federal Labor improves

    Source: The Conversation (Au and NZ) – By Adrian Beaumont, Election Analyst (Psephologist) at The Conversation; and Honorary Associate, School of Mathematics and Statistics, The University of Melbourne

    The Western Australian state election will be held on March 8. A Newspoll, conducted January 29 to February 4 from a sample of 1,039, gave Labor a 56–44 lead, from primary votes of 42% Labor, 32% Liberals, 3% Nationals, 12% Greens, 4% One Nation and 7% for all Others.

    At the March 2021 WA election, Labor won 53 of the 59 lower house seats on a two-party vote of 69.7–30.3, a record high for either major party at any state or federal election. Labor won 59.9% of the primary vote.

    A 56–44 result in Labor’s favour would still be a thumping victory, but it would represent a 14% swing to the Liberals from 2021. Labor will lose many seats, but they are very likely to easily retain a lower house majority.

    Labor Premier Roger Cook had a net approval of +18, with 55% satisfied and 37% dissatisfied. Liberal leader Libby Mettam had a net approval of -2, with 41% dissatisfied and 39% satisfied. Cook led Mettam as better premier by 54–34.

    While this Newspoll is very good for state Labor, only 35% of WA voters said the Anthony Albanese federal Labor government deserved to be re-elected, while 50% said it was “time to give someone else a go”.

    Federal Essential poll: Coalition remains ahead on respondent preferences

    A national Essential poll, conducted January 29 to February 2 from a sample of 1,150, gave the Coalition a 49–47 lead by respondent preferences including undecided (48–47 in mid-January). The Coalition has led by one or two points in the past four Essential polls.

    Primary votes were 36% Coalition (down one), 30% Labor (steady), 12% Greens (steady), 8% One Nation (up one), 1% UAP (down one), 9% for all Others (up two) and 4% undecided (down one). These primary votes imply a Labor lead by about 50.5–49.5 by 2022 election preference flows.

    The poll graph below includes the latest polls from Essential and Morgan, but not the DemosAU poll. In the last two weeks, the Morgan poll has trended to Labor, with Labor’s two-party share using 2022 flows increasing from 48% to 50.5%.

    On action to combat antisemitism, 9% thought the government was doing too much, 30% said it was doing enough and 43% believed it was not doing enough. On the importance of antisemitism, 40% said it was a major issue, 48% a minor issue and 12% not an issue. Issue salience will be greatly overstated by questions that ask about one issue; it’s best to ask about various issues.

    By 37–31, respondents supported tax discounts of $20,000 for small businesses to pay for meals and entertainment for staff and clients. The question did not mention that this idea was proposed by Opposition Leader Peter Dutton.

    By 77–16, voters thought there should be laws requiring equal salaries for men and women in the same position, but by 49–45 they said gender equality has come far enough already. On social and economic inequality, 57% (down two since May 2024) thought it is increasing, 29% (up three) staying about the same and 10% (up one) decreasing.

    Core inflation dropped in December quarter

    The Australian Bureau of Statistics released inflation data for the December quarter on January 29. Headline inflation was up 0.2% in December, unchanged from the September quarter, with annual inflation down from 2.8% to 2.4%. The peak annual inflation was 7.8% in December 2022.

    Core (trimmed mean) inflation increased 0.5% in December, down from 0.8% in September, for an annual rate of 3.2%, down from 3.6% in September. Annual core inflation peaked at 6.8% in December 2022.

    The ABC’s report said financial markets thought there was now a 90% chance of an interest rate cut when the Reserve Bank board meets on February 17–18. A rate cut would be good news for the government.

    Morgan and DemosAU polls are tied

    A national Morgan poll, conducted January 27 to February 2 from a sample of 1,694, had a 50–50 tie by headline respondent preferences, a two-point gain for Labor since the previous poll. This is the first time the Coalition has not led in a Morgan poll since late November.

    Primary votes were 38.5% Coalition (down two), 30% Labor (up 0.5), 11.5% Greens (steady), 5.5% One Nation (down 0.5), 10.5% independents (up 1.5) and 4% others (up 0.5). By 2022 election flows, Labor led by 50.5–49.5, a 1.5-point gain for Labor.

    The previous Morgan poll, conducted January 20–26 from a sample of 1,567, gave the Coalition a 52–48 lead by respondent preferences, unchanged from the January 13–19 poll.

    Primary votes were 40.5% Coalition (down 1.5), 29.5% Labor (up one), 11.5% Greens (down 1.5), 6% One Nation (up two), 9% independents (up 0.5) and 3.5% others (down 0.5). By 2022 election flows, the Coalition led by 51–49, a one-point gain for Labor.

    A DemosAU national poll, conducted January 28 to February 1 from a sample of 1,238, had a 50–50 tie, unchanged since November. Primary votes were 38% Coalition (steady), 33% Labor (up one), 12% Greens (steady), 7% One Nation (steady) and 10% for all Others (down one).

    DemosAU is using 2022 election flows for its polls. The primary votes would be expected to give Labor a 51–49 lead, so rounding probably contributed to the tie.

    Freshwater breakdowns of young men and young women

    The Financial Review had breakdowns of voting intentions and other questions from the last three national Freshwater polls on January 28. These polls were conducted from November to January from an overall sample of 3,160. This analysis focused on differences between men and women aged 18–34.

    Among young women, Labor and the Greens each had 32% of the primary vote, while the Coalition was at just 25%. Among young men, Labor had 36%, the Coalition 32% and the Greens 20%. I estimate young women would vote Labor by about 65–35 and young men by 59–41 after preferences.

    While there is a difference between young men and women, Labor would easily win the overall youth vote in this poll. Labor’s problems in the overall polls are due to older voters skewing to the Coalition.

    Young women preferred Albanese as PM to Dutton by 58–27, while young men preferred Albanese by 55–37. With young women, Albanese was at net -11 approval and Dutton at net -22. With young men, Albanese was at net +6 approval and Dutton at net -6. Young men were much more positive than young women about the direction of the country and the economy.

    Adrian Beaumont does not work for, consult, own shares in or receive funding from any company or organisation that would benefit from this article, and has disclosed no relevant affiliations beyond their academic appointment.

    ref. WA Labor has thumping Newspoll lead a month before election; federal Labor improves – https://theconversation.com/wa-labor-has-thumping-newspoll-lead-a-month-before-election-federal-labor-improves-248437

    MIL OSI AnalysisEveningReport.nz

  • MIL-OSI: NMI Holdings, Inc. Reports Fourth Quarter and Full Year 2024 Financial Results; Announces Additional $250 Million Share Repurchase Authorization

    Source: GlobeNewswire (MIL-OSI)

    EMERYVILLE, Calif., Feb. 06, 2025 (GLOBE NEWSWIRE) — NMI Holdings, Inc. (Nasdaq: NMIH) today reported net income of $86.2 million, or $1.07 per diluted share, for the fourth quarter ended December 31, 2024, which compares to $92.8 million, or $1.15 per diluted share, for the third quarter ended September 30, 2024 and $83.4 million, or $1.01 per diluted share, for the fourth quarter ended December 31, 2023. Adjusted net income for the quarter was $86.1 million, or $1.07 per diluted share, which compares to $92.8 million, or $1.15 per diluted share, for the third quarter ended September 30, 2024 and $83.4 million, or $1.01 per diluted share, for the fourth quarter ended December 31, 2023.

    Net income for the full year ended December 31, 2024 was $360.1 million, or $4.43 per diluted share, which compares to $322.1 million, or $3.84 per diluted share, for the year ended December 31, 2023. Adjusted net income for the year was $365.6 million, or $4.50 per diluted share, which compares to $322.1 million, or $3.84 per diluted share, for the year ended December 31, 2023. The non-GAAP financial measures adjusted net income and adjusted diluted earnings per share are presented in this release to enhance the comparability of financial results between periods. See “Use of Non-GAAP Financial Measures” and our reconciliation of such measures to their most comparable GAAP measures, below.

    The company also announced today that its Board of Directors has authorized an additional $250 million share repurchase plan effective through December 31, 2027.

    Adam Pollitzer, President and Chief Executive Officer of National MI, said, “The fourth quarter capped another year of standout success for National MI. In 2024, we delivered strong operating performance, generated significant NIW volume and consistent growth in our insured portfolio, and achieved record financial results and a 17.4% return on equity. We have a strong customer franchise, a talented team driving us forward every day, an exceptionally high-quality book covered by a comprehensive set of risk transfer solutions, and a robust balance sheet supported by the significant earnings power of our platform. Looking forward, we’re well-positioned to continue delivering differentiated growth, returns and value for our shareholders, and today’s incremental $250 million share repurchase authorization will provide investors with further ability to access value as we continue to perform, grow our earnings and compound book value.”

    Selected fourth quarter 2024 highlights include:

    • Primary insurance-in-force at quarter end was $210.2 billion, compared to $207.5 billion at the end of the third quarter and $197.0 billion at the end of the fourth quarter of 2023.
    • Net premiums earned were $143.5 million, compared to $143.3 million in the third quarter and $132.9 million in the fourth quarter of 2023.
    • Total revenue was $166.5 million, compared to $166.1 million in the third quarter and $151.4 million in the fourth quarter of 2023.
    • Insurance claims and claim expenses were $17.3 million, compared to $10.3 million in the third quarter and $8.2 million in the fourth quarter of 2023. Loss ratio was 12.0%, compared to 7.2% in the third quarter and 6.2% in the fourth quarter of 2023.
    • Underwriting and operating expenses were $31.1 million, compared to $29.2 million in the third quarter and $29.7 million in the fourth quarter of 2023. Expense ratio was 21.7%, compared to 20.3% in the third quarter and 22.4% in the fourth quarter of 2023.
    • Net income was $86.2 million, compared to $92.8 million in the third quarter and $83.4 million in the fourth quarter of 2023. Diluted EPS was $1.07, compared to $1.15 in the third quarter and $1.01 in the fourth quarter of 2023.
    • Shareholders’ equity was $2.2 billion at quarter end and book value per share was $28.21. Book value per share excluding the impact of net unrealized gains and losses in the investment portfolio was $29.80, up 4% compared to $28.71 in the third quarter and 17% compared to $25.54 in the fourth quarter of 2023.
    • Annualized return on equity for the quarter was 15.6%, compared to 17.5% in the third quarter and 18.0% in the fourth quarter of 2023.
    • At quarter-end, total PMIERs available assets were $3.1 billion and net risk-based required assets were $1.8 billion.
        Quarter
    Ended
    Quarter
    Ended
    Quarter
    Ended
    Change(1) Change(1)
        12/31/2024 9/30/2024 12/31/2023 Q/Q Y/Y
    INSURANCE METRICS ($billions)
    Primary Insurance-in-Force $ 210.2   $ 207.5   $ 197.0   1  % 7  %
    New Insurance Written – NIW   11.9     12.2     8.9   (2 )% 34  %
               
    FINANCIAL HIGHLIGHTS (Unaudited, $millions, except per share amounts)
    Net Premiums Earned $ 143.5   $ 143.3   $ 132.9   0  % 8  %
    Net Investment Income   22.7     22.5     18.2   1  % 25  %
    Insurance Claims and Claim Expenses   17.3     10.3     8.2   67  % 110  %
    Underwriting and Operating Expenses   31.1     29.2     29.7   7  % 5  %
    Net Income   86.2     92.8     83.4   (7 )% 3  %
    Diluted EPS $ 1.07   $ 1.15   $ 1.01   (7 )% 6  %
    Book Value per Share (excluding net unrealized gains and losses) (2) $ 29.80   $ 28.71   $ 25.54   4  % 17  %
    Loss Ratio   12.0  %   7.2  %   6.2  %    
    Expense Ratio   21.7  %   20.3  %   22.4  %    

    (1) Percentages may not be replicated based on the rounded figures presented in the table.
    (2) Book value per share (excluding net unrealized gains and losses) is defined as total shareholders’ equity, excluding the after-tax effects of unrealized gains and losses on our investment portfolio, divided by shares outstanding.

    Conference Call and Webcast Details

    The company will hold a conference call, which will be webcast live today, February 6, 2025, at 2:00 p.m. Pacific Time / 5:00 p.m. Eastern Time. The webcast will be available on the company’s website, www.nationalmi.com, in the “Investor Relations” section. The conference call can also be accessed by dialing (844) 481-2708 in the U.S., or (412) 317-0664 internationally, by referencing NMI Holdings, Inc.

    About NMI Holdings, Inc.

    NMI Holdings, Inc. (NASDAQ: NMIH), is the parent company of National Mortgage Insurance Corporation (National MI), a U.S.-based, private mortgage insurance company enabling low down payment borrowers to realize home ownership while protecting lenders and investors against losses related to a borrower’s default. To learn more, please visit www.nationalmi.com.

    Cautionary Note Regarding Forward-Looking Statements

    Certain statements contained in this press release or any other written or oral statements made by or on behalf of the Company in connection therewith may constitute forward-looking statements within the meaning of Section 27A of the Securities Act of 1933, as amended, Section 21E of the Securities Exchange Act of 1934, as amended, and the U.S. Private Securities Litigation Reform Act of 1995 (the “PSLRA”). The PSLRA provides a “safe harbor” for any forward-looking statements. All statements other than statements of historical fact included in or incorporated by reference in this release are forward-looking statements, including any statements about our expectations, outlook, beliefs, plans, predictions, forecasts, objectives, assumptions or future events or performance. These statements are often, but not always, made through the use of words or phrases such as “anticipate,” “believe,” “can,” “could,” “may,” “predict,” “assume,” “potential,” “should,” “will,” “estimate,” “perceive,” “plan,” “project,” “continuing,” “ongoing,” “expect,” “intend” and similar words or phrases. All forward-looking statements are only predictions and involve estimates, known and unknown risks, assumptions and uncertainties that may turn out to be inaccurate and could cause actual results to differ materially from those expressed in them. Many risks and uncertainties are inherent in our industry and markets. Others are more specific to our business and operations. Important factors that could cause actual events or results to differ materially from those indicated in such statements include, but are not limited to: changes in general economic, market and political conditions and policies (including changes in interest rates and inflation) and investment results or other conditions that affect the U.S. housing market or the U.S. markets for home mortgages, mortgage insurance, reinsurance and credit risk transfer markets, including the risk related to geopolitical instability, inflation, an economic downturn (including any decline in home prices) or recession, and their impacts on our business, operations and personnel; changes in the charters, business practices, policies, pricing or priorities of Fannie Mae and Freddie Mac (collectively, the GSEs), which may include decisions that have the impact of decreasing or discontinuing the use of mortgage insurance as credit enhancement generally, or with first time homebuyers or on very high loan-to-value mortgages; or changes in the direction of housing policy objectives of the Federal Housing Finance Agency (“FHFA”), such as the FHFA’s priority to increase the accessibility to and affordability of homeownership for low-and-moderate income borrowers and underrepresented communities; our ability to remain an eligible mortgage insurer under the private mortgage insurer eligibility requirements (“PMIERs”) and other requirements imposed by the GSEs, which they may change at any time; retention of our existing certificates of authority in each state and the District of Columbia (“D.C.”) and our ability to remain a mortgage insurer in good standing in each state and D.C.; our future profitability, liquidity and capital resources; actions of existing competitors, including other private mortgage insurers and government mortgage insurers such as the Federal Housing Administration, the U.S. Department of Agriculture’s Rural Housing Service and the U.S. Department of Veterans Affairs, and potential market entry by new competitors or consolidation of existing competitors; adoption of new or changes to existing laws, rules and regulations that impact our business or financial condition directly or the mortgage insurance industry generally or their enforcement and implementation by regulators, including the implementation of the final rules defining and/or concerning “Qualified Mortgage” and “Qualified Residential Mortgage”; U.S. federal tax reform and other potential changes in tax law and their impact on us and our operations; legislative or regulatory changes to the GSEs’ role in the secondary mortgage market or other changes that could affect the residential mortgage industry generally or mortgage insurance industry in particular; potential legal and regulatory claims, investigations, actions, audits or inquiries that could result in adverse judgements, settlements, fines or other reliefs that could require significant expenditures or have other negative effects on our business; our ability to successfully execute and implement our capital plans, including our ability to access the equity, credit and reinsurance markets and to enter into, and receive approval of, reinsurance arrangements on terms and conditions that are acceptable to us, the GSEs and our regulators; lenders, the GSEs, or other market participants seeking alternatives to private mortgage insurance; our ability to implement our business strategy, including our ability to write mortgage insurance on high quality low down payment residential mortgage loans, implement successfully and on a timely basis, complex infrastructure, systems, procedures, and internal controls to support our business and regulatory and reporting requirements of the insurance industry; our ability to attract and retain a diverse customer base, including the largest mortgage originators; failure of risk management or pricing or investment strategies; decrease in the length of time our insurance policies are in force; emergence of unexpected claim and coverage issues, including claims exceeding our reserves or amounts we had expected to experience; potential adverse impacts arising from natural disasters including, with respect to affected areas, a decline in new business, adverse effects on home prices, and an increase in notices of default on insured mortgages; climate risk and efforts to manage or regulate climate risk by government agencies could affect our business and operations; potential adverse impacts arising from the occurrence of any man-made disasters or public health emergencies, including pandemics; the inability of our counter-parties, including third party reinsurers, to meet their obligations to us; failure to maintain, improve and continue to develop necessary information technology systems or the failure of technology providers to perform; effectiveness and security of our information technology systems and digital products and services, including the risks these systems, products or services may fail to operate as expected or planned, or expose us to cybersecurity or third-party risks (including the exposure of our confidential customer and other information); and ability to recruit, train and retain key personnel. These risks and uncertainties also include, but are not limited to, those set forth under the heading “Risk Factors” detailed in Item 1A of Part I of our Annual Report on Form 10-K for the year ended December 31, 2023, as subsequently updated through other reports we file with the SEC. All subsequent written and oral forward-looking statements attributable to the Company or persons acting on its behalf are expressly qualified in their entirety by these cautionary statements. We caution you not to place undue reliance on any forward-looking statement, which speaks only as of the date on which it is made, and we undertake no obligation to publicly update or revise any forward-looking statement to reflect new information, future events or circumstances that occur after the date on which the statement is made or to reflect the occurrence of unanticipated events except as required by law.

    Use of Non-GAAP Financial Measures

    We believe the use of the non-GAAP measures of adjusted income before tax, adjusted net income, adjusted diluted EPS, adjusted return-on-equity, adjusted expense ratio, adjusted combined ratio and book value per share (excluding net unrealized gains and losses) enhances the comparability of our fundamental financial performance between periods, and provides relevant information to investors. These non-GAAP financial measures align with the way the company’s business performance is evaluated by management. These measures are not prepared in accordance with GAAP and should not be viewed as alternatives to GAAP measures of performance. These measures have been presented to increase transparency and enhance the comparability of our fundamental operating trends across periods. Other companies may calculate these measures differently; their measures may not be comparable to those we calculate and present.

    Adjusted income before tax is defined as GAAP income before tax, excluding the pre-tax effects of net realized gains or losses from our investment portfolio, periodic costs incurred in connection with capital markets transactions, and other infrequent, unusual or non-operating items in the periods in which such items are incurred.

    Adjusted net income is defined as GAAP net income, excluding the after-tax effects of net realized gains or losses from our investment portfolio, periodic costs incurred in connection with capital markets transactions, and other infrequent, unusual or non-operating items in the periods in which such items are incurred. Adjustments to components of pre-tax income are tax effected using the applicable federal statutory tax rate for the respective periods.

    Adjusted diluted EPS is defined as adjusted net income divided by adjusted weighted average diluted shares outstanding. Adjusted weighted average diluted shares outstanding is defined as weighted average diluted shares outstanding, adjusted for changes in the dilutive effect of non-vested shares that would otherwise have occurred had GAAP net income been calculated in accordance with adjusted net income. There will be no adjustment to weighted average diluted shares outstanding in the periods that non-vested shares are anti-dilutive under GAAP.

    Adjusted return on equity is calculated by dividing adjusted net income on an annualized basis by the average shareholders’ equity for the period.

    Adjusted expense ratio is defined as GAAP underwriting and operating expenses, excluding the pre-tax effects of periodic costs incurred in connection with capital markets transactions, divided by net premiums earned.

    Adjusted combined ratio is defined as the total of GAAP underwriting and operating expenses, excluding the pre-tax effects of periodic costs incurred in connection with capital markets transactions and insurance claims and claims expenses, divided by net premiums earned.

    Book value per share (excluding net unrealized gains and losses) is defined as total shareholders’ equity, excluding the after-tax effects of unrealized gains and losses on investments, divided by shares outstanding.

    Although adjusted income before tax, adjusted net income, adjusted diluted EPS, adjusted return-on-equity, adjusted expense ratio, adjusted combined ratio and book value per share (excluding net unrealized gains and losses) exclude certain items that have occurred in the past and are expected to occur in the future, the excluded items: (1) are not viewed as part of the operating performance of our primary activities; or (2) are impacted by market, economic or regulatory factors and are not necessarily indicative of operating trends, or both. These adjustments, and the reasons for their treatment, are described below.

    (1) Net realized investment gains and losses. The recognition of the net realized investment gains or losses can vary significantly across periods as the timing is highly discretionary and is influenced by factors such as market opportunities, tax and capital profile, and overall market cycles that do not reflect our current period operating results.
    (2) Capital markets transaction costs. Capital markets transaction costs result from activities that are undertaken to improve our debt profile or enhance our capital position through activities such as debt refinancing and capital markets reinsurance transactions that may vary in their size and timing due to factors such as market opportunities, tax and capital profile, and overall market cycles.
    (3) Other infrequent, unusual or non-operating items. Items that are the result of unforeseen or uncommon events, and are not expected to recur with frequency in the future. Identification and exclusion of these items provides clarity about the impact special or rare occurrences may have on our current financial performance. Past adjustments under this category include infrequent, unusual or non-operating adjustments related to severance, restricted stock modification and other expenses incurred in connection with the CEO transition announced in September 2021 and the effects of the release of the valuation allowance recorded against our net federal and certain state net deferred tax assets in 2016 and the re-measurement of our net deferred tax assets in connection with tax reform in 2017. We believe such items are infrequent or non-recurring in nature, and are not indicative of the performance of, or ongoing trends in, our primary operating activities or business.
    (4) Net unrealized gains and losses on investments. The recognition of the net unrealized gains or losses on investment can vary significantly across periods and is influenced by factors such as interest rate movement, overall market and economic conditions, and tax and capital profiles. These valuation adjustments may not necessarily result in economic gains or losses and not reflective of ongoing operations.

    Investor Contact
    Gregory Epps
    Manager, Investor Relations and Treasury
    Investor.relations@nationalmi.com

    Consolidated statements of operations and comprehensive income (unaudited) For the three months ended
    December 31,
      For the year ended
    December 31,
        2024       2023       2024       2023  
      (In Thousands, except for per share data)
    Revenues              
    Net premiums earned $ 143,520     $ 132,940     $ 564,688     $ 510,768  
    Net investment income   22,718       18,247       85,316       67,512  
    Net realized investment gains (losses)   33             23       (33 )
    Other revenues   233       193       944       756  
    Total revenues   166,504       151,380       650,971       579,003  
    Expenses              
    Insurance claims and claim expenses   17,253       8,232       31,544       22,618  
    Underwriting and operating expenses   31,092       29,716       118,397       110,699  
    Service expenses   184       185       723       771  
    Interest expense   7,102       8,066       36,896       32,212  
    Total expenses   55,631       46,199       187,560       166,300  
                   
    Income before income taxes   110,873       105,181       463,411       412,703  
    Income tax expense   24,706       21,768       103,305       90,593  
    Net income $ 86,167     $ 83,413     $ 360,106     $ 322,110  
                   
    Earnings per share              
    Basic $ 1.09     $ 1.03     $ 4.51     $ 3.91  
    Diluted $ 1.07     $ 1.01     $ 4.43     $ 3.84  
                   
    Weighted average common shares outstanding              
    Basic   78,997       81,005       79,844       82,407  
    Diluted   80,623       82,685       81,273       83,854  
                   
    Loss ratio (1)   12.0  %     6.2  %     5.6  %     4.4  %
    Expense ratio (2)   21.7  %     22.4  %     21.0  %     21.7  %
    Combined ratio (3)   33.7  %     28.5  %     26.6  %     26.1  %
                   
    Net income $ 86,167     $ 83,413     $ 360,106     $ 322,110  
    Other comprehensive (loss) income, net of tax:              
    Unrealized (losses) gains in accumulated other comprehensive loss, net of tax (benefit) expense of $(11,374) and $19,580 for the three months ended December 31, 2024 and 2023, and $3,921 and $17,113 for the years ended December 31, 2024 and 2023, respectively   (42,787 )     73,660       15,113       64,380  
    Reclassification adjustment for realized (gains) losses included in net income, net of tax expense (benefit) of $7 and $0 for the three months ended December 31, 2024 and 2023, and $0 and $(7) for the years ended December 31, 2024, and 2023, respectively   (26 )                 26  
    Other comprehensive (loss) income, net of tax   (42,813 )     73,660       15,113       64,406  
    Comprehensive income $ 43,354     $ 157,073     $ 375,219     $ 386,516  

    (1) Loss ratio is calculated by dividing insurance claims and claim expenses by net premiums earned.
    (2) Expense ratio is calculated by dividing underwriting and operating expenses by net premiums earned.
    (3) Combined ratio may not foot due to rounding.

    Consolidated balance sheets (unaudited) December 31, 2024   December 31, 2023
    Assets (In Thousands, except for share data)
    Fixed maturities, available-for-sale, at fair value (amortized cost of $2,876,343 and $2,542,862 as of December 31, 2024 and December 31, 2023, respectively) $ 2,723,541     $ 2,371,021  
    Cash and cash equivalents (including restricted cash of $90 and $1,338 as of December 31, 2024 and December 31, 2023, respectively)   54,308       96,689  
    Premiums receivable, net   82,804       76,456  
    Accrued investment income   22,386       19,785  
    Deferred policy acquisition costs, net   64,327       62,905  
    Software and equipment, net   25,681       30,252  
    Intangible assets and goodwill   3,634       3,634  
    Reinsurance recoverable   32,260       27,514  
    Prepaid federal income taxes   322,175       235,286  
    Other assets   18,857       16,965  
    Total assets $ 3,349,973     $ 2,940,507  
           
    Liabilities      
    Debt $ 415,146     $ 397,595  
    Unearned premiums   65,217       92,295  
    Accounts payable and accrued expenses   103,164       86,189  
    Reserve for insurance claims and claim expenses   152,071       123,974  
    Deferred tax liability, net   386,192       301,573  
    Other liabilities   10,751       12,877  
    Total liabilities   1,132,541       1,014,503  
           
    Shareholders’ equity      
    Common stock – $0.01 par value; 87,902,626 shares issued and 78,600,726 shares outstanding as of December 31, 2024 and 87,334,138 shares issued and 80,881,280 shares outstanding as of December 31, 2023 (250,000,000 shares authorized)   879       873  
    Additional paid-in capital   1,004,692       990,816  
    Treasury stock, at cost: 9,301,900 and 6,452,858 common shares as of December 31, 2024 and December 31, 2023, respectively   (246,594 )     (148,921 )
    Accumulated other comprehensive loss, net of tax   (124,804 )     (139,917 )
    Retained earnings   1,583,259       1,223,153  
    Total shareholders’ equity   2,217,432       1,926,004  
    Total liabilities and shareholders’ equity $ 3,349,973     $ 2,940,507  
    Non-GAAP Financial Measure Reconciliations (unaudited)
      As of and for the three months ended   For the year ended December 31,
      12/31/2024   9/30/2024   12/31/2023     2024       2023  
    As Reported (In Thousands, except for per share data)
    Revenues                  
    Net premiums earned $ 143,520     $ 143,343     $ 132,940     $ 564,688     $ 510,768  
    Net investment income   22,718       22,474       18,247       85,316       67,512  
    Net realized investment gains (losses)   33       (10 )           23       (33 )
    Other revenues   233       285       193       944       756  
    Total revenues   166,504       166,092       151,380       650,971       579,003  
    Expenses                  
    Insurance claims and claim expenses   17,253       10,321       8,232       31,544       22,618  
    Underwriting and operating expenses   31,092       29,160       29,716       118,397       110,699  
    Service expenses   184       208       185       723       771  
    Interest expense   7,102       7,076       8,066       36,896       32,212  
    Total expenses   55,631       46,765       46,199       187,560       166,300  
                       
    Income before income taxes   110,873       119,327       105,181       463,411       412,703  
    Income tax expense   24,706       26,517       21,768       103,305       90,593  
    Net income $ 86,167     $ 92,810     $ 83,413     $ 360,106     $ 322,110  
                       
    Adjustments:                  
    Net realized investment (gains) losses   (33 )     10             (23 )     33  
    Capital markets transaction costs                     6,966        
    Adjusted income before taxes   110,840       119,337       105,181       470,354       412,736  
                       
    Income tax (benefit) expense on adjustments (1)   (7 )     2             1,458       7  
    Adjusted net income $ 86,141     $ 92,818     $ 83,413     $ 365,591     $ 322,136  
                       
    Weighted average diluted shares outstanding   80,623       81,045       82,685       81,273       83,854  
                       
    Diluted EPS $ 1.07     $ 1.15     $ 1.01     $ 4.43     $ 3.84  
    Adjusted diluted EPS $ 1.07     $ 1.15     $ 1.01     $ 4.50     $ 3.84  
                       
    Return on equity   15.6  %     17.5  %     18.0  %     17.4  %     18.2  %
    Adjusted return on equity   15.6  %     17.5  %     18.0  %     17.6  %     18.2  %
                       
    Expense ratio (2)   21.7  %     20.3  %     22.4  %     21.0  %     21.7  %
    Adjusted expense ratio (3)   21.7  %     20.3  %     22.4  %     21.0  %     21.7  %
                       
    Combined ratio (4)   33.7  %     27.5  %     28.5  %     26.6  %     26.1  %
    Adjusted combined ratio (5)   33.7  %     27.5  %     28.5  %     26.6  %     26.1  %
                       
    Book value per share (6) $ 28.21     $ 27.67     $ 23.81          
    Book value per share (excluding net unrealized gains and losses) (7) $ 29.80     $ 28.71     $ 25.54          

    (1) Marginal tax impact of non-GAAP adjustments is calculated based on our statutory U.S. federal corporate income tax rate of 21%, except for those items that are not eligible for an income tax deduction.
    (2) Expense ratio is calculated by dividing underwriting and operating expenses by net premiums earned.
    (3) Adjusted expense ratio is calculated by dividing adjusted underwriting and operating expense (underwriting and operating expenses excluding costs related to capital markets reinsurance transactions) by net premiums earned.
    (4) Combined ratio is calculated by dividing the total of underwriting and operating expenses and insurance claims and claim expenses by net premiums earned.
    (5) Adjusted combined ratio is calculated by dividing the total of adjusted underwriting and operating expenses (underwriting and operating expenses excluding costs related to capital market reinsurance transaction) and insurance claims and claim expenses by net premiums earned.
    (6) Book value per share is calculated by dividing total shareholders’ equity by shares outstanding.
    (7) Book value per share (excluding net unrealized gains and losses) is defined as total shareholders’ equity, excluding the after-tax effects of unrealized gains and losses on our investment portfolio, divided by shares outstanding.

    Historical Quarterly Data  2024    2023 
      December 31   September 30   June 30   March 31   December 31
      (In Thousands, except for per share data)
    Revenues                  
    Net premiums earned $ 143,520     $ 143,343     $ 141,168     $ 136,657     $ 132,940  
    Net investment income   22,718       22,474       20,688       19,436       18,247  
    Net realized investment gains (losses)   33       (10 )                  
    Other revenues   233       285       266       160       193  
    Total revenues   166,504       166,092       162,122       156,253       151,380  
    Expenses                  
    Insurance claims and claim expenses   17,253       10,321       276       3,694       8,232  
    Underwriting and operating expenses   31,092       29,160       28,330       29,815       29,716  
    Service expenses   184       208       194       137       185  
    Interest expense   7,102       7,076       14,678       8,040       8,066  
    Total expenses   55,631       46,765       43,478       41,686       46,199  
                       
    Income before income taxes   110,873       119,327       118,644       114,567       105,181  
    Income tax expense   24,706       26,517       26,565       25,517       21,768  
    Net income $ 86,167     $ 92,810     $ 92,079     $ 89,050     $ 83,413  
                       
    Earnings per share                  
    Basic $ 1.09     $ 1.17     $ 1.15     $ 1.10     $ 1.03  
    Diluted $ 1.07     $ 1.15     $ 1.13     $ 1.08     $ 1.01  
                       
    Weighted average common shares outstanding                  
    Basic   78,997       79,549       80,117       80,726       81,005  
    Diluted   80,623       81,045       81,300       82,099       82,685  
                       
    Other data                  
    Loss ratio (1)   12.0  %     7.2  %     0.2  %     2.7  %     6.2  %
    Expense ratio (2)   21.7  %     20.3  %     20.1  %     21.8  %     22.4  %
    Combined ratio (3)   33.7  %     27.5  %     20.3  %     24.5  %     28.5  %

    (1) Loss ratio is calculated by dividing insurance claims and claim expenses by net premiums earned.
    (2) Expense ratio is calculated by dividing underwriting and operating expenses by net premiums earned.
    (3) Combined ratio may not foot due to rounding.

    Portfolio Statistics

    The table below highlights trends in our primary portfolio as of the date and for the periods indicated.

    Primary portfolio trends As of and for the three months ended
      December 31,
    2024
      September 30,
    2024
      June 30,
    2024
      March 31,
    2024
      December 31,
    2023
      ($ Values In Millions, except as noted below)
    New insurance written (NIW) $ 11,925     $ 12,218     $ 12,503     $ 9,398     $ 8,927  
    New risk written   3,134       3,245       3,335       2,486       2,354  
    Insurance-in-force (IIF) (1)   210,183       207,538       203,501       199,373       197,029  
    Risk-in-force (RIF) (1)   56,113       55,253       53,956       52,610       51,796  
    Policies in force (count) (1)   659,567       654,374       645,276       635,662       629,690  
    Average loan size ($ value in thousands) (1) $ 319     $ 317     $ 315     $ 314     $ 313  
    Coverage percentage (2)   26.7  %     26.6  %     26.5  %     26.4  %     26.3  %
    Loans in default (count) (1)   6,642       5,712       4,904       5,109       5,099  
    Default rate (1)   1.01  %     0.87  %     0.76  %     0.80  %     0.81  %
    Risk-in-force on defaulted loans (1) $ 545     $ 468     $ 401     $ 414     $ 408  
    Average net premium yield (3)   0.27  %     0.28  %     0.28  %     0.28  %     0.27  %
    Earnings from cancellations $ 0.8     $ 0.8     $ 1.0     $ 0.6     $ 1.0  
    Annual persistency (4)   84.6 %     85.5 %     85.4 %     85.8 %     86.1 %
    Quarterly run-off (5)   4.5 %     4.0 %     4.2 %     3.6 %     3.4 %

    (1) Reported as of the end of the period.
    (2) Calculated as end of period RIF divided by end of period IIF.
    (3) Calculated as net premiums earned, divided by average primary IIF for the period, annualized.
    (4) Defined as the percentage of IIF that remains on our books after a given twelve-month period.
    (5) Defined as the percentage of IIF that is no longer on our books after a given three-month period.

    NIW, IIF and Premiums

    The tables below present primary NIW and primary IIF, as of the dates and for the periods indicated.

    Primary NIW For the three months ended
      December 31,
    2024
      September 30,
    2024
      June 30,
    2024
      March 31,
    2024
      December 31,
    2023
      (In Millions)
    Monthly $ 11,688   $ 11,978   $ 12,288   $ 9,175   $ 8,614
    Single   237     240     215     223     313
    Total $ 11,925   $ 12,218   $ 12,503   $ 9,398   $ 8,927
    Primary IIF As of
      December 31,
    2024
      September 30,
    2024
      June 30,
    2024
      March 31,
    2024
      December 31,
    2023
      (In Millions)
    Monthly $ 192,228   $ 189,241   $ 184,862   $ 180,343   $ 177,764
    Single   17,955     18,297     18,639     19,030     19,265
    Total $ 210,183   $ 207,538   $ 203,501   $ 199,373   $ 197,029

    The following table presents the amounts related to the company’s quota-share reinsurance transactions (the 2016 QSR Transaction, 2018 QSR Transaction, 2020 QSR Transaction, 2021 QSR Transaction, 2022 QSR Transaction, 2022 Seasoned QSR Transaction, 2023 QSR Transaction, and 2024 QSR Transaction and collectively, the QSR Transactions), insurance-linked note transactions (the 2021-1 ILN Transaction, and 2021-2 ILN Transaction and collectively, the ILN Transactions), and traditional reinsurance transactions (the 2022-1 XOL Transaction, 2022-2 XOL Transaction, 2022-3 XOL Transaction, 2023-1 XOL Transaction, 2023-2 XOL Transaction, and 2024 XOL Transaction and collectively, the XOL Transactions) for the periods indicated.

      For the three months ended
      December 31,
    2024
      September 30,
    2024
      June 30,
    2024
      March 31,
    2024
      December 31,
    2023
      (In Thousands)
    The QSR Transactions                  
    Ceded risk-in-force $ 13,024,200     $ 12,968,039     $ 12,815,434     $ 12,669,207     $ 12,626,541  
    Ceded premiums earned   (41,596 )     (41,761 )     (41,555 )     (41,269 )     (41,218 )
    Ceded claims and claim expenses (benefits)   4,075       2,449       (138 )     659       2,447  
    Ceding commission earned   9,997       10,152       10,222       10,292       9,561  
    Profit commission   20,149       21,883       24,351       23,407       22,057  
                       
    The ILN Transactions (1)                  
    Ceded premiums $ (4,217 )   $ (4,302 )   $ (5,858 )   $ (5,976 )   $ (6,305 )
                       
    The XOL Transactions                  
    Ceded premiums $ (9,969 )   $ (9,760 )   $ (9,403 )   $ (9,223 )   $ (8,302 )

    (1) Effective July 25, 2024 and December 27, 2024, NMIC exercised its optional termination rights to terminate and commute its previously outstanding excess-of-loss reinsurance agreements with Oaktown Re III Ltd. and Oaktown Re V Ltd., respectively. In connection with the terminations and commutations, the insurance-linked notes issued by Oaktown Re III Ltd. and Oaktown Re V Ltd. were redeemed in full with a distribution of remaining collateral assets.

    The tables below present our total primary NIW by FICO, loan-to-value (LTV) ratio, and purchase/refinance mix for the periods indicated.

    Primary NIW by FICO For the three months ended   For the year ended
      December 31,
    2024
      September 30,
    2024
      December 31,
    2023
      December 31,
    2024
      December 31,
    2023
      (In Millions)
    >= 760 $ 6,508   $ 6,615   $ 4,564   $ 24,808   $ 22,995
    740-759   2,090     2,057     1,542     8,098     6,769
    720-739   1,621     1,529     1,280     5,907     5,484
    700-719   890     1,040     816     3,794     2,816
    680-699   575     652     568     2,392     1,946
    <=679   241     325     157     1,045     463
    Total $ 11,925   $ 12,218   $ 8,927   $ 46,044   $ 40,473
    Weighted average FICO   758     757     755     757     760
    Primary NIW by LTV For the three months ended   For the year ended
      December 31,
    2024
      September 30,
    2024
      December 31,
    2023
      December 31,
    2024
      December 31,
    2023
      (In Millions)
    95.01% and above $ 1,510     $ 1,568     $ 990     $ 5,908     $ 3,713  
    90.01% to 95.00%   5,370       5,720       4,107       21,149       18,929  
    85.01% to 90.00%   3,740       3,584       2,947       13,994       13,597  
    85.00% and below   1,305       1,346       883       4,993       4,234  
    Total $ 11,925     $ 12,218     $ 8,927     $ 46,044     $ 40,473  
    Weighted average LTV   92.1  %     92.3  %     92.2  %     92.3  %     92.1  %
    Primary NIW by purchase/refinance mix For the three months ended   For the year ended
      December 31,
    2024
      September 30,
    2024
      December 31,
    2023
      December 31,
    2024
      December 31,
    2023
      (In Millions)
    Purchase $ 10,799   $ 11,708   $ 8,759   $ 43,921   $ 39,629
    Refinance   1,126     510     168     2,123     844
    Total $ 11,925   $ 12,218   $ 8,927   $ 46,044   $ 40,473

    The table below presents a summary of our primary IIF and RIF by book year as of December 31, 2024.

    Primary IIF and RIF As of December 31, 2024
      IIF   RIF
    Book Year (In Millions)
    2024 $ 43,560   $ 11,552
    2023   34,284     9,047
    2022   47,598     12,703
    2021   50,699     13,634
    2020   21,145     5,795
    2019 and before   12,897     3,382
    Total $ 210,183   $ 56,113

    The tables below present our total primary IIF and RIF by FICO and LTV, and total primary RIF by loan type as of the dates indicated.

    Primary IIF by FICO As of
      December 31, 2024   September 30, 2024   December 31, 2023
      (In Millions)
    >= 760 $ 105,315   $ 103,764   $ 98,034
    740-759   37,321     36,830     34,829
    720-739   29,343     28,930     27,755
    700-719   19,766     19,654     18,734
    680-699   13,374     13,326     12,867
    <=679   5,064     5,034     4,810
    Total $ 210,183   $ 207,538   $ 197,029
    Primary RIF by FICO As of
      December 31, 2024   September 30, 2024   December 31, 2023
      (In Millions)
    >= 760 $ 27,883   $ 27,396   $ 25,523
    740-759   10,006     9,850     9,207
    720-739   7,926     7,788     7,387
    700-719   5,383     5,337     5,021
    680-699   3,615     3,590     3,433
    <=679   1,300     1,292     1,225
    Total $ 56,113   $ 55,253   $ 51,796
    Primary IIF by LTV As of
      December 31, 2024   September 30, 2024   December 31, 2023
      (In Millions)
    95.01% and above $ 23,555   $ 22,644   $ 19,609
    90.01% to 95.00%   103,472     101,872     95,415
    85.01% to 90.00%   64,290     63,568     60,348
    85.00% and below   18,866     19,454     21,657
    Total $ 210,183   $ 207,538   $ 197,029
    Primary RIF by LTV As of
      December 31, 2024   September 30, 2024   December 31, 2023
      (In Millions)
    95.01% and above $ 7,345   $ 7,054   $ 6,062
    90.01% to 95.00%   30,563     30,100     28,184
    85.01% to 90.00%   15,956     15,777     14,961
    85.00% and below   2,249     2,322     2,589
    Total $ 56,113   $ 55,253   $ 51,796
    Primary RIF by Loan Type As of
      December 31, 2024   September 30, 2024   December 31, 2023
               
    Fixed 98  %   98  %   98  %
    Adjustable rate mortgages:          
    Less than five years          
    Five years and longer 2     2     2  
    Total 100  %   100  %   100  %

    The table below presents a summary of the change in total primary IIF during the periods indicated.

    Primary IIF As of and for the three months ended
      December 31, 2024   September 30, 2024   December 31, 2023
      (In Millions)
    IIF, beginning of period $ 207,538     $ 203,501     $ 194,781  
    NIW   11,925       12,218       8,927  
    Cancellations, principal repayments and other reductions   (9,280 )     (8,181 )     (6,679 )
    IIF, end of period $ 210,183     $ 207,538     $ 197,029  


    Geographic Dispersion

    The following table shows the distribution by state of our primary RIF as of the periods indicated:

    Top 10 primary RIF by state As of
      December 31, 2024   September 30, 2024   December 31, 2023
    California 10.1  %   10.1  %   10.2  %
    Texas 8.6     8.7     8.7  
    Florida 7.3     7.4     7.6  
    Georgia 4.1     4.1     4.1  
    Washington 3.9     3.9     4.0  
    Illinois 3.8     3.9     4.0  
    Virginia 3.7     3.8     3.9  
    Pennsylvania 3.4     3.4     3.4  
    Ohio 3.3     3.2     3.0  
    North Carolina 3.2     3.1     3.0  
    Total 51.4  %   51.6  %   51.9  %

    The table below presents selected primary portfolio statistics, by book year, as of December 31, 2024.

      As of December 31, 2024
    Book year Original
    Insurance
    Written
      Remaining
    Insurance
    in Force
      %
    Remaining
    of Original
    Insurance
      Policies
    Ever in
    Force
      Number
    of Policies
    in Force
      Number
    of Loans
    in
    Default
      # of
    Claims
    Paid
      Incurred
    Loss Ratio
    (Inception
    to Date)
    (1)
      Cumulative
    Default Rate
    (2)
      Current
    Default
    Rate
    (3)
      ($ Values in Millions)    
    2015 and prior $ 16,035   $ 885   6  %   67,989   4,903   99   208   2.7  %   0.5  %   2.0  %
    2016   21,187     1,498   7  %   83,626   8,076   158   187   1.7  %   0.4  %   2.0  %
    2017   21,582     1,867   9  %   85,897   10,577   267   184   1.9  %   0.5  %   2.5  %
    2018   27,295     2,433   9  %   104,043   13,152   420   184   2.5  %   0.6  %   3.2  %
    2019   45,141     6,214   14  %   148,423   27,442   511   97   2.0  %   0.4  %   1.9  %
    2020   62,702     21,145   34  %   186,174   73,926   598   51   1.4  %   0.3  %   0.8  %
    2021   85,574     50,699   59  %   257,972   167,892   1,679   74   3.5  %   0.7  %   1.0  %
    2022   58,734     47,598   81  %   163,281   138,915   2,002   68   17.9  %   1.3  %   1.4  %
    2023   40,473     34,284   85  %   111,994   98,711   725   10   14.4  %   0.7  %   0.7  %
    2024   46,044     43,560   95  %   120,747   115,973   183     6.2  %   0.2  %   0.2  %
    Total $ 424,767   $ 210,183       1,330,146   659,567   6,642   1,063            

    (1) Calculated as total claims incurred (paid and reserved) divided by cumulative premiums earned, net of reinsurance.
    (2) Calculated as the sum of the number of claims paid ever to date and number of loans in default divided by policies ever in force.
    (3) Calculated as the number of loans in default divided by number of policies in force.

    The following table provides a reconciliation of the beginning and ending reserve balances for primary insurance claims and claim expenses:

      For the three months ended
    December 31,
      For the year ended
    December 31,
        2024       2023       2024       2023  
      (In Thousands)
    Beginning balance $ 135,520     $ 116,078     $ 123,974     $ 99,836  
    Less reinsurance recoverables (1)   (29,214 )     (25,956 )     (27,514 )     (21,587 )
    Beginning balance, net of reinsurance recoverables   106,306       90,122       96,460       78,249  
                   
    Add claims incurred:              
    Claims and claim expenses incurred:              
    Current year (2)   21,674       17,298       93,206       78,285  
    Prior years (3)   (4,421 )     (9,789 )     (61,662 )     (56,390 )
    Total claims and claim expenses incurred (4)   17,253       7,509       31,544       21,895  
                   
    Less claims paid:              
    Claims and claim expenses paid:              
    Current year (2)   458       481       638       600  
    Prior years (3)   3,290       1,181       7,555       3,575  
    Reinsurance terminations         (491 )           (491 )
    Total claims and claim expenses paid   3,748       1,171       8,193       3,684  
                   
    Reserve at end of period, net of reinsurance recoverables   119,811       96,460       119,811       96,460  
    Add reinsurance recoverables (1)   32,260       27,514       32,260       27,514  
    Ending balance $ 152,071     $ 123,974     $ 152,071     $ 123,974  

    (1) Related to ceded losses recoverable under the QSR Transactions
    (2) Related to insured loans with their most recent defaults occurring in the current year. For example, if a loan defaulted in a prior year and subsequently cured and later re-defaulted in the current year, the default would be included in the current year. Amounts are presented net of reinsurance and included $83.5 million attributed to net case reserves and $8.1 million attributed to net IBNR reserves for the year ended December 31, 2024, $70.6 million attributed to net case reserves and $6.3 million attributed to net IBNR reserves for the year ended December 31, 2023.
    (3) Related to insured loans with defaults occurring in prior years, which have been continuously in default before the start of the current year. Amounts are presented net of reinsurance and included $54.1 million attributed to net case reserves and $6.3 million attributed to net IBNR reserves for the year ended December 31, 2024, $50.9 million attributed to net case reserves and $4.5 million attributed to net IBNR reserves for the year ended December 31, 2023.
    (4) Excludes a $0.7 million termination fee for the year ended December 31, 2023 incurred in connection with the amendment of the 2020 QSR Transaction.

    The following table provides a reconciliation of the beginning and ending count of loans in default:

      For the three months ended
    December 31,
      For the year ended
    December 31,
      2024    2023    2024    2023 
    Beginning default inventory 5,712     4,594     5,099     4,449  
    Plus: new defaults 2,742     2,039     8,757     6,758  
    Less: cures (1,684 )   (1,458 )   (6,899 )   (5,892 )
    Less: claims paid (108 )   (70 )   (276 )   (199 )
    Less: rescission and claims denied (20 )   (6 )   (39 )   (17 )
    Ending default inventory 6,642     5,099     6,642     5,099  

    The following table provides details of our claims paid, before giving effect to claims ceded under the QSR Transactions, for the periods indicated:

      For the three months ended
    December 31,
      For the year ended
    December 31,
        2024       2023       2024       2023  
      ($ Values In Thousands)
    Number of claims paid (1)   108       70       276       199  
    Total amount paid for claims $ 4,777     $ 2,060     $ 10,491     $ 5,192  
    Average amount paid per claim $ 44     $ 29     $ 38     $ 26  
    Severity (2)   65  %     64  %     61  %     55  %

    (1) Count includes 32 and 88 claims settled without payment during the three months and year ended December 31, 2024, respectively, and 23 and 70 claims settled without payment during the three months and year ended December 31, 2023, respectively.
    (2) Severity represents the total amount of claims paid including claim expenses divided by the related RIF on the loan at the time the claim is perfected, and is calculated including claims settled without payment.

    The following table shows our average reserve per default, before giving effect to reserves ceded under the QSR Transactions, as of the dates indicated:

    Average reserve per default: As of
      December 31, 2024   December 31, 2023
      (In Thousands)
    Case (1) $ 21.0   $ 22.4
    IBNR (1) (2)   1.9     1.9
    Total $ 22.9   $ 24.3

    (1) Defined as the gross reserve per insured loan in default.
    (2) Amount includes claims adjustment expenses.

    The following table provides a comparison of the PMIERs available assets and net risk-based required asset amount as reported by NMIC as of the dates indicated:

      As of
      December 31, 2024   September 30, 2024   December 31, 2023
      (In Thousands)
    Available assets $ 3,108,211   $ 3,006,892   $ 2,717,804
    Net risk-based required assets   1,828,807     1,735,790     1,516,140

    The MIL Network

  • MIL-Evening Report: Gaza: we analysed a year of satellite images to map the scale of agricultural destruction

    Source: The Conversation (Au and NZ) – By Lina Eklund, Associate Senior Lecturer, Lund University

    Part of North Gaza in November 2023, and again in July 2024.

    SkySat imagery © 2025/Planet Labs PBC

    The ceasefire agreed between Israel and Hamas makes provisions for the passage of food and humanitarian aid into Gaza. This support is much needed given that Gaza’s agricultural system has been severely damaged over the course of the war.

    Over the past 17 months we have analysed satellite images across the Gaza Strip to quantify the scale of agricultural destruction across the region. Our newly published research reveals not only the widespread extent of this destruction but also the potentially unprecedented pace at which it occurred. Our work covers the period until September 2024 but further data through to January 2025 is also available.

    Before the war, tomatoes, peppers, cucumbers and strawberries were grown in open fields and greenhouses, and olive and citrus trees lined rows across the Gazan landscape. The trees in particular are an important cultural heritage in the region, and agriculture was a vital part of Gaza’s economy. About half of the food eaten there was produced in the territory itself, and food made up a similar portion of its exports.

    By December 2023, only two months into the war, there were official warnings that the entire population of Gaza, more than 2 million people, was facing high levels of acute food insecurity. While that assessment was based on interviews and survey data, the level of agricultural damage across the whole landscape remained out of view.

    Most olive and citrus trees are gone

    To address this problem, we mapped the damage to tree crops – mostly olive and citrus trees – in Gaza each month over the course of the war up until September 2024. Together with our colleagues Dimah Habash and Mazin Qumsiyeh, we did this using very high-resolution satellite imagery, detailed enough to focus on individual trees.

    We first visually identified tree crops with and without damage to “train” our computer program, or model, so it knew what to look for. We then ran the model on all the satellite data. We also looked over a sample of results ourselves to confirm it was accurate.

    Our results showed that between 64% and 70% of all tree crop fields in Gaza had been damaged. That can either mean a few trees being destroyed, the whole field of trees completely removed, or anything in between. Most damage took place during the first few months of the war in autumn 2023. Exactly who destroyed these trees and why is beyond the scope of our research or expertise.

    In some areas, every greenhouse is gone

    As greenhouses look very different in satellite images, we used a separate method to map damage to them. We found over 4,000 had been damaged by September 2024, which is more than half of the total we had identified before the start of the war.

    Greenhouses and the date of initial damage between October 2023 and September 2024.
    Yin et al (2025)

    In the south of the territory, where most greenhouses were found, the destruction was fairly steady from December 2023 onwards.

    But in north Gaza and Gaza City, the two most northerly of the territory’s five governorates, most of the damage had already taken place by November and December 2023. By the end of our study period, all 578 greenhouses there had been destroyed.

    North Gaza and Gaza City have also seen the most damage to tree crop fields. By September 2024, over 90% of all tree crops in Gaza City had been destroyed, and 73% had been lost in north Gaza. In the three southern governorates, Khan Younis, Deir al-Balah and Rafah, around 50% of all tree crops had been destroyed.

    Agricultural damage is common in armed conflict, and has been documented with satellite analysis in Ukraine since the 2022 Russian invasion, in Syria and Iraq during the ISIS occupation in 2015, and in the Caucasus during the Chechen wars in the 1990s and 2000s.

    The exact impact can differ from conflict to conflict. War may directly damage lands, as we have seen in Gaza, or it may lead to more fallow areas as infrastructure is damaged and farmers are forced to flee. A conflict also increases the need for local agricultural production, especially when food imports are restricted.

    Our assessment shows a very high rate of direct and extensive damage to Gaza’s agricultural system, both compared to previous conflict escalations there in 2014 and 2021, and in other conflict settings. For example, during the July-August war in 2014, around 1,200 greenhouses were damaged in Gaza. This time round at least three times as many have been damaged.

    Agricultural attacks are unlawful

    Attacks on agricultural lands are prohibited under international law. The Rome Statute of the International Criminal Court from 1998 defines the intentional use of starvation of civilians through “depriving them of objects indispensable to their survival” as a war crime. The Geneva conventions further define such indispensable objects as “foodstuffs, agricultural areas for the production offoodstuffs, crops, livestock, drinking water installations and supplies and irrigation works”.

    Our study provides transparent statistics on the extent and timing of damage to Gaza’s agricultural system. As well as documenting the impacts of the war, we hope it can help the massive rebuilding efforts that will be required.

    Restoring Gaza’s agricultural system goes beyond clearing debris and rubble, and rebuilding greenhouses. The soils need to be cleaned from possible contamination. Sewage and irrigation infrastructure need to be rebuilt.

    Such efforts may take a generation or more to complete. After all, olive and citrus trees can take five or more years to become productive, and 15 years to reach full maturity. After previous attacks on Gaza the trees were mostly replanted, and perhaps the same will happen again this time. But it’s for good reason they say that only people with hope for the future plant trees.

    Lina Eklund receives funding from the Swedish National Space Agency and the Strategic Research Area: The Middle East in the Contemporary World (MECW) at the Centre for Advanced Middle Eastern Studies, Lund University, Sweden.

    He Yin receives funding from NASA.

    Jamon Van Den Hoek receives funding from NASA.

    ref. Gaza: we analysed a year of satellite images to map the scale of agricultural destruction – https://theconversation.com/gaza-we-analysed-a-year-of-satellite-images-to-map-the-scale-of-agricultural-destruction-248796

    MIL OSI AnalysisEveningReport.nz

  • MIL-OSI United Nations: Experts of the Committee on the Elimination of Discrimination against Women Praise Belarus for Progress in Preventing Trafficking, Ask about Criminalisation of HIV Transmission and Reported Repression of Civil Society

    Source: United Nations – Geneva

    The Committee on the Elimination of Discrimination against Women today concluded its consideration of the ninth periodic report of Belarus, with Committee Experts praising the State’s progress in preventing trafficking, and raising questions about the criminalisation of HIV transmission and reports of repression of civil society.

    Elgun Safarov, Committee Expert and Rapporteur for Belarus, and other Experts commended Belarus’ awareness-raising projects on the prevention of trafficking and women’s empowerment.

    One Committee Expert noted that Belarus had a high number of criminal cases related to HIV.  Transmission of HIV was penalised with imprisonment of up to five years. Was the State party rethinking this law?

    Mr. Safrov said many very important non-governmental organizations had been closed recently.  What were the reasons for these closures?  There were reports of repression of women journalists and activists.

    Several other Experts expressed concern about reports that women who expressed dissent were punished and detained.  What plans were in place to protect women activists from gender-based violence and State repression?  Why were civil society organizations engaged in the protection of human rights dissolved by the State?

    Introducing the report, Larysa Belskaya, Permanent Representative of Belarus to the United Nations Office at Geneva and head of the delegation, said Belarus strived to fully ensure equal rights and opportunities for women in all spheres. In an extremely difficult geopolitical situation, Belarus progressively built a society where every person could have decent living conditions and benefit society.

    The delegation said Belarus had taken measures to eliminate trafficking in persons and to identify and rehabilitate victims.  In 2024, authorities identified 1,500 cases of suspected trafficking and identified several victims, including minors.  The State worked with civil society to build the capacity of law enforcement staff related to trafficking; 90 training sessions had been held in 2024.

    Concerning the transmission of HIV, the delegation said that in 2023, nine women had been penalised for transmitting HIV and 12 women were penalised in 2022.  The State party was continuing to reduce the stringency of HIV legislation.  A draft law had been developed to decriminalise unintentional transmission of HIV.  Penalties for the deliberate transmission of HIV would remain.

    The delegation said the Committee’s assessments related to repression were not appropriate.  The protests that took place in Belarus over the reporting period were in many cases not peaceful.  Certain extremist actions were taken by media workers.  The Government was working to increase understanding of the situation.

    Civil society in Belarus was active, the delegation added.  The State party had over 1,500 civil society organizations, including women’s organizations.  In 2020, there was an attempt to carry out a coup d’etat by several non-governmental organizations engaged in anti-Government activities.  A court decision held these organizations and their members responsible for violating the law.  This should not be considered repression of civil society.  In 2023, a new law on the activities of civil society was adopted that required organizations to re-register.  Many non-governmental organizations had not completed the new registration procedure and had been shut down.  Citizens were entitled to renew the activities of previous non-governmental organizations.

    In closing remarks, Ms. Belskaya said Belarus had achieved much in terms of gender equality and empowering women.  The discussion helped the State party to identify the remaining issues to be addressed. The Committee’s recommendations would be carefully considered by the National Council on Gender Equality and used to construct the next national action plan on gender equality

    In her closing remarks, Nahla Haidar, Committee Chair, commended the State party for its efforts and encouraged it to implement the Committee’s recommendations for the benefit of all women and girls in Belarus.

    The delegation of Belarus consisted of representatives from the Ministry of Labour and Social Protection; Ministry of Health; and the Permanent Mission of Belarus to the United Nations Office at Geneva.

    The Committee will issue the concluding observations on the report of Belarus at the end of its ninetieth session on 21 February.  All documents relating to the Committee’s work, including reports submitted by States parties, can be found on the session’s webpage.  Meeting summary releases can be found here.  The webcast of the Committee’s public meetings can be accessed via the UN Web TV webpage.

    The Committee will next meet at 10 a.m. on Friday, 7 February to consider the eighth periodic report of Luxembourg (CEDAW/C/LUX/8).

    Report

    The Committee has before it the ninth periodic report of Belarus (CEDAW/C/BLR/9).

    Presentation of Report

    LARYSA BELSKAYA, Permanent Representative of Belarus to the United Nations Office at Geneva and head of the delegation, said Belarus was committed to the principles of the Convention and strived to fully ensure equal rights and opportunities for women and men in all spheres.  Its Gender Gap Index score had almost halved from 0.152 in 2014 to 0.096 in 2024, placing the country 29th out of 166 countries.  In an extremely difficult geopolitical situation, Belarus preserved its State, peace and tranquillity, and progressively built a society of equal opportunities, where every person could have decent living conditions and benefit society.

    Over the years, the Government had made serious efforts to implement the Convention and had achieved concrete results for the advancement of women.  Gender policy was coordinated by the National Council on Gender Policy.  Every five years, national action plans on gender equality were adopted.  This year, the sixth national action plan (2021-2025), the goals and objectives of which were linked to the Sustainable Development Goals, was being implemented.  Work was also progressively being carried out to introduce mechanisms for gender analysis of legislation and gender budgeting in the development of draft State plans and programmes. 

    The National Statistical Committee had developed thematic information systems that made it possible to analyse the situation in the field of gender equality.  The “Gender Statistics Web Portal” contained 178 gender statistics.  In 2020, the Labour Code introduced a norm establishing paternity leave of up to 14 days within six months after the birth of the child.  The Government was also working to calculate the value of unpaid domestic services not included in gross domestic product.  The final data would be published in June 2025.

    Belarussian women were actively promoted to managerial positions.  In the National Assembly, the share of women in 2023 was 36 per cent. At the same time, in the House of Representatives, their share was 40.6 per cent.  Women accounted for 47 per cent of local self-government bodies. Among senior civil servants, the share of women in 2023 was 54.6 per cent; among judges, 64.4 per cent.

    Labour legislation provided for parents with family responsibilities an additional day off from work per month or reduced working days, flexible forms of employment, and remote employment.  The country guaranteed access for all citizens to health care, education, social services, culture and sports.  At the birth of a child, the State provided material support to all families and the payment of insurance premiums.  Benefits for pregnancy, childbirth and temporary disability had been increased, as had social support for parents raising a child with disabilities.  Since 2015, the State also provided a one-time non-cash provision equalling 10,000 United States dollars at the birth or adoption of third or subsequent children.

    The Belarussian Women’s Union, which united 162,000 women, worked to raise the status of women in society and their role in all spheres of life, and there were 15 more women’s organizations in Belarus.  In total, as of October 2024, there were 1,466 public associations; 18 new public associations were registered in 2024. 

    In Belarus, the literacy rate of the population aged 15 and over was almost 100 per cent. General secondary education was compulsory for all.  The percentage of women in higher education was about 53 per cent.  Almost 92 per cent of women aged 16-72 used the Internet.

    For several years, there had been a decrease in the female working age unemployment rate, from 3.1 per cent in 2019 to 2.7 per cent in 2023.  This figure was lower than the male unemployment rate, which was 4.1 per cent in 2023.  More than 42 per cent of employed women had completed higher education and 70 per cent of civil servants were women.  The share of women among researchers in Belarus was 39.2 per cent.  In 2024, for the first time, a female cosmonaut from Belarus, Marina Vasilevskaya, flew to the International Space Station.  Belarus was also actively developing women’s entrepreneurship; the representation of women in this area was 36.4 per cent.  In 2023, the first Forum of Women Entrepreneurs was held, with the active participation of the Belarussian Women’s Union.

    Every woman, regardless of income, had the opportunity to receive any type of medical care free of charge.  Unprecedented measures were being taken in the country to protect motherhood and childhood, to accompany women during pregnancy, and to carry out annual medical examinations.  Belarus was among the 25 countries with the highest rating in terms of access to sexual and reproductive health, information and education.  The proportion of women using various types of contraception increased from 39.9 per cent in 2010 to 53.2 per cent in 2021. The number of abortions per 1,000 women of childbearing age over the past 10 years had decreased by almost two times to 6.2 per cent in 2023.  Since 2011, no cases of illegal abortions had been registered in the country.

    Specific measures were being taken in Belarus to prevent domestic violence.  In 2022, protective measures for victims and preventive measures against violators were strengthened.  Every year, about 15,000 victims turned to regional social service centres for help.  A network of “crisis” rooms was being developed, with 134 rooms having been established as of 2024.  There were no restrictions on the time in which people could live in these rooms; in the first half of 2024, 81 women lived in them.  Public and international organizations were involved in aiding women victims of domestic violence.

    From today’s dialogue, Belarus expected practical and implementable recommendations that would allow it to implement high international standards in State policy to ensure equal rights and expand opportunities for women.

    Questions by a Committee Expert 

    ELGUN SAFAROV, Committee Expert and Rapporteur for Belarus, said that Belarus had developed family and women policy, implemented many awareness-raising projects on the prevention of trafficking and women’s empowerment, organised several international conferences on women in entrepreneurship and science, and adopted several legislative acts on women rights protection during the reporting period. He expressed appreciation for the State party’s activities for the harmonisation of legislation and measures for the adoption of international standards. 

    However, the Committee had witnessed multiple violations of women’s rights.  The State party did not have comprehensive anti-discrimination legislation that specifically prohibited discrimination against women, including direct and indirect discrimination, and also had no specific, stand-alone legislation on gender equality, or a law explicitly focused on ending all forms of gender-based violence, including domestic violence.  Sexual harassment in the workplace remained unaddressed in legislation, and laws prohibited women’s participation in certain jobs. 

    There were many problems related to access to justice for women.  There needed to be effective remedies for victims of discrimination.  There was no special body for deciding cases related to discrimination against women.  HIV transmission was criminalised.  Why had some women lawyers’ licenses been terminated?

    What measures were in place to incorporate a definition of equality between women and men in the Constitution and the Criminal Code?  What mechanisms were in place to protect against discrimination?  Had the Convention been translated into Belarussian? Were there any court cases that had referenced the Convention?  Why had closed court sessions been held to try women who had participated in peaceful demonstrations?  How were lawyers appointed?  Did the State party keep data on criminal cases related to gender?

    Responses by the Delegation

    The delegation said Belarus did not have a comprehensive definition of discrimination against women in its legislation, but principles of equality were included in the Constitution and various laws.  The Government had considered developing a single act on discrimination, but had found that existing legislation sufficiently banned discrimination. Legal amendments were introduced in 2022 to provide women and men with equal opportunities in employment, training and education.  The rights of victims of sexual discrimination needed to be restored under law. All complaints of discrimination, including from women and foreign citizens, needed to be reviewed by relevant State authorities within a tight deadline.  Discriminatory norms were not permitted in legislation.  Follow-up on implementation of gender legislation was carried out by a dedicated group of the National Council on Gender Policy.

    The Bar Association carried out activities to inform citizens about how they could access legal aid.  Women who lodged a complaint related to workplace discrimination or the deprivation of parental rights, as well as pregnant women, vulnerable families and victims of trafficking, received legal aid free of charge. Women in prisons could receive legal aid when they submitted complaints.  Women could choose their own lawyer, or were appointed one if they could not afford one.

    Belarus had two national languages: Belarussian and Russian.  Russian was more represented in State correspondence, but this did not hinder access to information on legislation for the population.  The Convention was part of the national legal system and had been referenced in court proceedings.  The Criminal Code recognised undermining of women’s bodily integrity as an offence.  There were around 50 cases related to bodily harm in the first half of 2024, and 44 cases of other sexual offences.

    Questions by Committee Experts 

    A Committee Expert commended the Government on efforts to align policies with the Sustainable Development Goals. However, the Committee was concerned by the absence of an independent national human rights institution, and by the exclusion of civil society organizations that worked to safeguard women’s rights.  Would the State party consider establishing a national human rights institution in line with the Paris Principles?  Which Government agency was responsible for protecting women’s rights.

    The Expert welcomed the policy to promote gender empowerment and gender sensitive budgeting.  How would the national action plan on gender equality be monitored?  How would the State party ensure the meaningful participation of civil society in this regard?

    The Committee was deeply concerned by the increasingly shrinking civic space.  Many women human rights defenders faced detention and restriction of activities. What plans were in place to protect women activists from gender-based violence and State repression?  Why were civil society organizations that were engaged in the protection of human rights dissolved by the State?

    Belarus had not adopted a national action plan on women, peace and security.  Would it consider developing such a plan to mainstream gender perspectives into peacebuilding efforts?

    One Committee Expert said the share of women in regional leadership positions was low and there were very few female ambassadors.  Women who peacefully expressed diverse political opinions were at a high risk of being treated as extremists.  Had the State party implemented temporary special measures to ensure gender equality in recent years?  Were there measures to increase the representation of women in leadership positions, as well as in employment and education?  What measures were in place to support vulnerable women and to mitigate the impact of the COVID-19 pandemic on gender equality?

    Responses by the Delegation

    The delegation said Belarus had State and public institutions protecting human rights, including the national councils on gender equality, children and disability, and the Environmental Committee, among others.  The State had conducted consultations with civil society, international organizations and State agencies in 2017 related to the establishment of a national human rights institution.  Belarus believed that creating a national human rights institution was not a priority as its existing bodies were working efficiently to protect human rights. This issue could be examined in more detail at a later stage.

    The National Council on Gender Equality coordinated and monitored the implementation of national action plans on gender equality.  From 2023 to 2024, a gender assessment methodology for legislation was adopted. Based on assessments, problems had been identified and measures were being planned to address them in the next national action plan.

    Belarus was not a party to any conflict currently, so it had not implemented special measures related to women, peace and security.  However, the Government had taken measures to protect Ukrainian refugees.  Over 200,000 people had arrived from Ukraine in the past three years, more than half of whom were women.  Belarus offered refugees temporary protection and the choice of becoming Belarussian citizens.

    Civil society in Belarus was active. The State party had over 1,500 civil society organizations, as well as professional unions and women’s organizations. The Belarussian Women’s Union actively engaged with State authorities.  There were also specialised civil society organizations supporting vulnerable women.  The process for registering a civil society organization was simple and transparent; the State did not interfere in the registration of such organizations and provided regular support to existing organizations.  Under the law on civil society organizations, such organizations could be closed based on court decisions finding that the organization had carried out unlawful propaganda or violated State legislation. 

    Citizens active in social activities had the right to be defended but were held liable when they violated the law. In 2020, there was an attempt to carry out a coup d’etat by several non-governmental organizations engaged in anti-Government activities.  A court decision had held these organizations and their members responsible for violating the law.  This should not be considered repression of civil society.  After these events, laws on civil society were amended to provide incentives for more constructive civic activities.  Non-governmental organizations in Belarus needed to work cooperatively with the State and could not be funded from abroad.

    Questions by Committee Experts

    A Committee Expert welcomed that the State party had not ruled out establishing a national human rights institution and called for serious consideration of its establishment.  The Expert called for the development of a dedicated policy on women, peace and security.  How many women’s organizations participated in the development and analysis of the national action plan on gender equality?

    Another Committee Expert welcomed advances in protection from domestic violence, including the law on crisis prevention.  However, gender stereotypes were spread in media communications and women were systematically silenced and controlled by the State – women who expressed dissent were attacked, punished and detained.  Vulnerable women were often blamed and stigmatised when they sought protection.  The State party implemented restraining orders for only 30 days and perpetrators were not expelled from homes. 

    Would the State party adopt a comprehensive strategy to address gender stereotyping, a comprehensive law against domestic violence, and penal protection against marital rape?  How would the State party protect victims in criminal proceedings?  What remedies had been provided to victims in recent years?  How many persons had been convicted for domestic violence crimes? What services were provided in crisis rooms and how were personnel in these rooms trained?  Why did the rooms also house men?  Over 30 non-governmental organizations managing hotlines and shelters had been closed; why was this?

    One Committee Expert commended the State party for addressing trafficking in persons by ratifying international conventions on trafficking and developing comprehensive laws related to trafficking.  Could the State party provide data on trafficking and prostitution?  What measures were in place to protect women with disabilities from trafficking and to identify victims of trafficking?  How many investigations into trafficking had been carried out and how many persons were convicted?  How was the State party strengthening protections for women and girls against trafficking, promoting their access to justice, and building the capacity of State officials on the gendered aspects of trafficking?

    Responses by the Delegation

    The delegation said analysis of the national action plan on gender equality was carried out twice a year. The Belarus Women’s Union was represented in the National Commission on Gender Equality and other bodies.  The State party also closely cooperated with the Red Cross and other international organizations, and supported organizations of persons with disabilities.  Seventy per cent of civil servants were women; 50 per cent were in middle management positions and were involved in preparing important political decisions.

    Eliminating gender stereotypes was one of the goals of the national action plan for gender equality.  The State party was working to enhance the role of fathers in carrying out domestic tasks and was working with civil society on a joint project encouraging responsible fatherhood.  There was a programme on State television that presented case studies of successful professional women.

    Persons who perpetrated domestic violence were required to leave the homes where victims lived, and authorities monitored compliance.  The law on preventing domestic violence had been amended to address violence against former partners and cohabitants.  The number of protective measures that had been implemented had increased significantly from around 18,000 in 2022 to 33,000 in 2024.  The Government supported victims to stay in their homes.  There were awareness raising campaigns in place to inform potential victims about reporting channels and preventing gender-based violence.  All types of bodily harm were criminalised.

    Every year, around 17,500 complaints of domestic violence were made.  If women victims required temporary housing, it was provided. Shelters could be accessed 24 hours a day by victims and their children without documentation.  There were hundreds of crisis rooms available, including 132 equipped for children.  Work was underway to ensure access to the rooms for persons with disabilities.

    Belarus had taken measures to eliminate trafficking in persons and to identify and rehabilitate victims.  In 2024, authorities identified 1,500 cases of suspected trafficking and identified several victims, including minors. The State worked with civil society to build the capacity of law enforcement staff related to trafficking; 90 training sessions had been held in 2024.  Specialists had been hired to support victims of various forms of trafficking.  The State was also working to align national trafficking legislation with international norms, and various awareness raising campaigns on trafficking were also in place. Involvement in prostitution was an administrative offence; however, victims of trafficking were not prosecuted, but were provided with support.

    Questions by Committee Experts

    A Committee Expert welcomed that legislation was being amended regarding domestic violence, which needed to be made an aggravated circumstance in homicide offences.  What measures were in place to ensure the safety of victims of domestic violence?

    Another Committee Expert commended progress being made related to trafficking and prostitution.

    ELGUN SAFAROV, Committee Expert and Rapporteur for Belarus, asked why there was a shortage of female Belarussian ambassadors.  None of the chambers of Parliament had female chairs; there were no parliamentary committees working to protect women’s rights; and only one out of 24 Ministers was a woman.  Why was this? How many Deputy Ministers were women? To what extent were women represented in the technological sector?

    Many very important non-governmental organizations had been closed recently.  What were the reasons for these closures?  There were reports of repression of women journalists and activists.

    One Committee Expert noted progress made in reducing statelessness through nationalisation efforts. However, 2,473 women remained stateless in the State party.  Were there programmes addressing statelessness?  When would the State party ratify the 1954 and 1967 United Nations conventions on statelessness?  The State party had not established a clear procedure for protecting migrant mothers and newborns.  Would it do so?

    Responses by the Delegation

    The delegation said the law on prevention of violence included a clause on educational programmes for perpetrators. The State party was interested in best practices in this field in other countries.

    Women made up around 70 per cent of Belarus’ Ministry of Foreign Affairs.  At a time, Belarus had four female ambassadors.  Appointment to ambassadorial roles was based on competitive selection and there was a shortage of women applicants.  Women were broadly represented as deputy chairs of parliamentary committees and made up around 50 per cent of the members of local councils. Belarus aimed to improve women’s representation in all fields.

    The Committee’s assessments related to repression were not appropriate.  The protests that took place in Belarus over the reporting period were in many cases not peaceful.  Certain extremist actions were taken by media workers.  The Government was working to increase understanding of the situation.

    In 2023, a new law on the activities of civil society was adopted that required organizations to re-register. Many non-governmental organizations had not completed the new registration procedure and had been shut down. Citizens were entitled to renew the activities of previous non-governmental organizations.

    Belarus strived to eradicate statelessness.  The number of stateless women in Belarus had significantly decreased by around 5,000 persons over the past 10 years, thanks to the work of authorities in collaboration with United Nations bodies.  The State supported stateless persons and their children to apply for Belarussian citizenship.  It was continuing work towards ratification of the United Nations conventions on statelessness.  The Government had not received reports of unlawful treatment of stateless persons. Stateless persons in Belarus were primarily citizens of the former Soviet Union.  Their numbers were low; the number of stateless children was less than 10.  To receive citizenship, people needed to demonstrate that they had sufficient income and had not committed offences.

    Questions by a Committee Expert 

    A Committee Expert said Belarus had near universal enrolment of girls and boys in primary education.  Educational instructions could reproduce harmful tropes of men as breadwinners and women as caregivers.  What measures were in place to enforce the role of men as caregivers? Only 23 per cent of persons in science, technology, engineering and maths education were women.  What measures were in place to promote their participation?  Only 17 per cent of university professors were female.  How would this be addressed?  Many students had been arrested and prosecuted for their engagement in protest movements.  Nine of the 11 students detained were women, including a woman professor.  What was the status of these women?

    Responses by the Delegation

    The delegation said traditional values in Belarus promoted families with children. Many educational programmes aimed to uphold traditional values and promote gender equality and the equal roles of men and women.  Around 52 per cent of higher education students were women.  Around 40 per cent of workers in the information technology sphere were women.  The Government was implementing incentives and other measures to attract girls to science, technology, engineering and maths careers.

    Students were detained on the grounds that they had broken a criminal law.  There was no persecution of students simply for exercising freedom of expression.

    Questions by a Committee Expert

    One Committee Expert said the employment rate of men was 72 per cent compared to 63 per cent for women. Although the list of closed professions for women had been reduced significantly, significant barriers for women accessing the labour market remained, and the list itself was a form of discrimination.  Women were underrepresented in higher-paid industries.  Workplace harassment remained common and legislation did not provide adequate remedies for victims and penalties for perpetrators.  Detained women were legally required to engage in labour; this was a form of modern slavery.  In July 2022, all independent trade unions were banned in Belarus. What protection mechanisms were available related to workplace sexual harassment?  Was there a national action plan for addressing the gender pay gap? When would the State party abolish forced labour for prisoners?

    In 2017, the State introduced pension reform, raising the retirement age.  Many citizens had lost their pensions due to the reforms.  Why did men and women have different pension ages?

    Responses by the Delegation

    The delegation said the rate of employment for women from 15 to 74 was 63 per cent, whereas the employment rate for women of working age was above 80 per cent. Belarus promoted equal pay for work of equal value.  Overall, women earned around 75 per cent of what men earned.  In the transport sector and the agricultural sector, wage gaps were much lower.  The State party was implementing measures to reduce the gender pay gap.  Women were now able to work in professions that were previously not accessible, such as truck drivers.  The State party was encouraging men to take parental leave. Women who experienced workplace harassment could report the incident to local authorities and receive remedies. 

    The Supreme Court had ruled that trade unions were to be closed when their activities were harmful to public interests or State values. The federation of trade unions covered almost all unions in the country.  It promoted general and collective agreements, which provided additional social and labour rights for workers.

    Women earned 92.5 per cent of the pension earned by men. Less than one per cent of the elderly were poor.  Women could continue working after they reached pension age; around 20 per cent of women did so.  The Presidential Decree on Employment did not punish individuals who were not working. Under the decree, women who were not working had the right to access State subsidies.

    The State party was exerting efforts to address the gender pay gap.  The national action plan on gender equality, which was based on the Committee’s previous recommendations, introduced measures to support female entrepreneurs and workers.

    Questions by a Committee Expert

    A Committee Expert said there had been significant advances in the field of public health in Belarus in recent years, but access to medicines was better in cities than in rural areas, and the quality of healthcare had declined nation-wide.  How was the State party supporting equal access to affordable healthcare for women from vulnerable groups?  What measures were in place to remove obstacles to accessing abortions?  Did both men and women need to undergo cancer screenings before they could obtain a driver’s licence?

    Women with disabilities faced barriers in accessing sexual and reproductive health services.  How was the State party meeting the needs of women with disabilities in this regard?  Some women with disabilities had been pressured to hand over their children to the State.  How would the State party address the discrimination faced by women with disabilities?  How did the delegation respond to reports of sterilisation of women with disabilities?

    Women with HIV reportedly faced systematic discrimination in health care.  The Penal Code sanctioned the transmission of HIV regardless of the circumstances. What measures were in place to support women with HIV?  What was the situation of sexual and reproductive health education?

    Responses by the Delegation

    The delegation said that in Belarus, medical assistance for persons with HIV was provided in line with health protocols from 2018 and 2022.  In 2018, Belarus had been certified as being free from mother-to-child transmission of HIV.  There were around 27,000 HIV positive people in the State.  The State party worked closely with non-governmental organizations to provide treatment for HIV positive people.  Around 95 per cent of HIV positive people were receiving retroviral treatment.  Women formerly had to present certificates from gynaecologists to receive a driver’s licence; as of last year, this was no longer necessary.  A draft law had been developed to decriminalise unintentional transmission of HIV.  Penalties for the deliberate transmission of HIV would remain.

    The protection of maternal and child health was a priority for the State.  Women who sought abortions could receive free counselling.  Over five years, these counselling sessions had prevented 23,000 abortions.  Pregnancies were interrupted only when the pregnant woman provided permission.

    All women, including women with disabilities, had access to medical assistance without discrimination.  Resources were set aside to allow for high quality medical care of the population.

    The World Health Organization had highly rated the medical care provided in Belarus.  The assessment that the quality of medical care had declined in recent years was not in line with reality.  Mobile health clinics provided in-home medical care in rural areas.  The State party was addressing shortages in healthcare staff.  It had difficulties in accessing certain types of medications due to sanctions from Western countries.

    Questions by Committee Experts

    A Committee Expert commended measures reforming regulations on universal social protection and access to support funds for entrepreneurs. Were there schemes guiding social protection for workers in the informal sector?  What steps had been taken to incorporate gender considerations into the tax regime?  What percentage of business grants were received by female entrepreneurs over the past five years?  How had technological training helped to bridge gender gaps in digital fields? How was the State party strengthening women’s role in sports and cultural activities and addressing stereotypes related to sports and culture?

    Another Committee Expert congratulated Belarus on co-sponsoring the United Nations Convention against Cybercrime and for implementing measures to protect elder women in digital spheres.  What social security and economic policies were in place for elderly women?  Belarus had a high number of criminal cases related to HIV.  Transmission of HIV was penalised with imprisonment of up to five years.  Was the State party rethinking this law?

    Women with disabilities’ right to work could only be realised after a medical examination.  How would the State party allow for the full realisation of these women’s right to work?

    Women in prisons were reportedly denied access to menstrual products.  How would the State party ensure that all detained women were treated in a dignified manner?  Belarus had in 2022 broadened its definition of pornography to include non-traditional relationships.  How would this affect the lesbian, bisexual, transgender and queer community?  Were the rights of indigenous women considered in plans to develop a second nuclear powerplant in the State? 

    Responses by the Delegation

    The delegation said there were around 400,000 people engaged in entrepreneurship in Belarus, 40 per cent of whom were women.  There was a framework for supporting women entrepreneurs, including in rural areas, and norms and laws aimed to support small businesses. Special taxation measures were provided to women entrepreneurs.  The share of women entrepreneurs had increased by around 10 per cent in recent years.  A State support programme for the unemployed had been established; almost half of all beneficiaries were women.

    In 2023, nine women had been penalised for transmitting HIV and 12 women were penalised in 2022.  The State party was continuing to reduce the stringency of HIV legislation.

    There was a Government mechanism which visited prisons regularly to examine living conditions.  The Attorney-General also monitored compliance with legislation on prisons.  Access to all forms of medical care was granted to detainees.  All detainees could file complaints to courts related to the lawfulness of their detention as well as other problems.  Prisoners who violated prison regimes were placed in solitary confinement.

    The State party had a plan for implementing the Convention on the Rights of Persons with Disabilities.  It supported employers who hired persons with disabilities and provided training to help persons with disabilities access work.  An act on quotas for persons with disabilities in the workplace had been implemented.

    Legislative changes addressed the circulation of products that harmed public morality.  They were not expected to have an impact on the lesbian, bisexual, transgender and intersex community.  People could choose the type of relationship they had.

    The impact on human health of the State’s nuclear power plants was negligible.  Belarus upheld the highest standards of safety.

    Women were being encouraged to participate in sports traditionally favoured by men.

    Questions by a Committee Expert

    ELGUN SAFAROV, Committee Expert and Rapporteur for Belarus, asked if the State party had statistics on the amount of property inherited by women.  How did courts protect women’s property rights in divorce proceedings? How were children’s rights protected in international adoption proceedings?  The dialogue and the Committee’s recommendations would help with protecting the rights of women in Belarus.

    Responses by the Delegation

    The delegation said Belarus’ legislation on divorce promoted the best interests of the child.  Mediation was increasingly used in custody cases.  The interests of the mother and father were duly protected.  Belarus worked with several States on regulating international adoptions.  The State party monitored families who had adopted Belarussian children to ensure that their rights were upheld.

    Concluding Remarks

    LARYSA BELSKAYA, Permanent Representative of Belarus to the United Nations Office at Geneva and head of the delegation, thanked the Committee for the dialogue. Belarus had achieved much in terms of gender equality and empowering women.  The discussion helped the State party to identify the remaining issues to be addressed.  The Belarussian population supported the State’s measures, but there was more to be done.  The Committee’s recommendations would be carefully considered by the National Council on Gender Equality and used to construct the next national action plan on gender equality

    NAHLA HAIDAR, Committee Chair, thanked the delegation for its engagement with the Committee.  The dialogue had provided insights into the achievements made in Belarus and the areas in which further progress was needed.  The Committee commended the State party for its efforts and encouraged it to implement the Committee’s recommendations for the benefit of all women and girls in Belarus.


    Produced by the United Nations Information Service in Geneva for use of the media; 
    not an official record. English and French versions of our releases are different as they are the product of two separate coverage teams that work independently.


    CEDAW25.004E

    MIL OSI United Nations News

  • MIL-Evening Report: Do investment tax breaks work? A new study finds the evidence is ‘mixed at best’

    Source: The Conversation (Au and NZ) – By Kerrie Sadiq, Professor of Taxation, QUT Business School, and ARC Future Fellow, Queensland University of Technology

    The Reserve Bank of Australia (RBA) released a discussion paper this week on investment tax breaks. The study looks at whether tax incentives, such as instant asset write-offs for utes, boost business investment.

    Business investment is an important contributor to overall economic growth, and has been sluggish in recent years.

    The authors conclude the evidence for these tax breaks is “mixed at best”. They say that income tax breaks used during the global financial crisis increased investment significantly, however:

    [there is] no substantial evidence that other policies, including those implemented during the pandemic, increased investment.

    In an election year, further promises of tax breaks for businesses are likely. The Coalition has already announced a tax break for meals and entertainment. But are they a good idea, and at what cost do these promises come?

    Small business in Australia

    Small businesses with fewer than 20 employees make up 97% of all Australian businesses. More than 92% of Australian businesses have an annual turnover of less than A$2 million. It is these businesses that are doing it tough.

    These businesses are offered tax breaks for spending on capital assets such as equipment or vehicles. For the 2023-24 tax year, they can immediately write off the cost of eligible assets up to $20,000. In the May 2024 Budget, the government announced that the tax break would be extended to the 2024-25 tax year.

    When a small business is operated as a company, the base tax rate is 25%. This effectively means that the business still contributes 75% of the cost of the asset. This requires businesses to have the cash flow to invest. Even if there is cash flow, businesses may not want to spend on large purchases.

    It’s a question of trade-offs

    Investment tax breaks are also costly in terms of government tax revenue. Each year, the Treasury estimates the cost of tax breaks. These tax breaks are known as tax expenditures.

    For the 2023-34 tax year, the instant write-off tax break for small businesses is estimated to cost more than $4 billion by reducing taxes collected.

    Tax expenditures are normally designed to offer incentives to one group of taxpayers. However, they come at the expense of broader groups of taxpayers and at a cost of lost revenue to the government. This is money that could be spent through direct spending programs.

    Tax expenditures can be thought of as government spending programs hidden in plain sight.

    The true cost of tax breaks

    Tax expenditures play a central role in Australia’s collection of taxes and redistribution. During the pandemic, the instant asset write-off was increased to $150,000.

    The current government introduced the latest instant asset write-off to improve cash flow and reduce compliance costs for small business. As the RBA discussion paper notes, these types of incentives are also designed to encourage additional business investment.

    However, that study indicates this is not being achieved. They suggest the reasons may be the tax policies themselves or differences in the economic environment. Put simply, businesses may not want to invest.

    If the stated benefits are not realised, the result is less tax collected. Take the $4 billion cost above. Without the incentive, the government would have an additional $4 billion to spend. The $4 billion in 2023-24 could have been directed to funding small businesses through a direct spending program.

    Targeted programs

    The RBA discussion paper highlights the need to determine whether investment tax breaks achieve their intended benefits. Many factors must be considered, and assessing the influence on the economy is vital.

    However, evaluating these measures within the tax system means that important questions are not asked. This includes whether the benefits are distributed fairly, whether the program targets the right group of taxpayers, and whether there are unintended distorting effects.

    The latest Treasury Tax Expenditures and Insights Statement provides data on 307 separate measures. This number continues to grow.

    The government’s “Future Made in Australia” contains two examples. Its economic plan to support Australia’s transition to a net zero economy contains two tax incentives, one for hydrogen production and another for critical minerals.

    The proposed hydrogen production tax incentive is estimated at a cost to the budget of $6.7 billion over ten years. The measure will provide a $2 incentive per kilogram of renewable hydrogen produced for up to ten years. Eligible companies will get a credit against their income tax liability.

    The proposed critical minerals production tax incentive is estimated to cost the budget $7 billion over ten years. Eligible companies will get a refundable tax offset of 10% of certain expenses relating to processing and refining 31 critical minerals listed in Australia.

    Support for tax breaks

    Tax breaks for businesses, such as the immediate write-off, disproportionately benefit those that spend. Often, this is by design. If this is a government objective, supported by the general population, then it is viewed as a good use of public money.

    The same principle applies to tax breaks in the Government’s Future Made in Australia plan. A government objective is to transition to a net zero economy. A stated priority is to attract “investment to make Australia a leader in renewable energy, adding value to our natural resources and strengthening economic activity”.

    The question remains as to whether tax breaks are the best way to achieve this. The answer often changes when viewed as a direct spending program.

    Kerrie Sadiq currently receives funding from the Australian Research Council. She has previously received research grants from CPA and CAANZ.

    Ashesha Weerasinghe does not work for, consult, own shares in or receive funding from any company or organisation that would benefit from this article, and has disclosed no relevant affiliations beyond their academic appointment.

    ref. Do investment tax breaks work? A new study finds the evidence is ‘mixed at best’ – https://theconversation.com/do-investment-tax-breaks-work-a-new-study-finds-the-evidence-is-mixed-at-best-249148

    MIL OSI AnalysisEveningReport.nz

  • MIL-OSI Global: Gaza: we analysed a year of satellite images to map the scale of agricultural destruction

    Source: The Conversation – UK – By Lina Eklund, Associate Senior Lecturer, Lund University

    Part of North Gaza in November 2023, and again in July 2024.

    SkySat imagery © 2025/Planet Labs PBC

    The ceasefire agreed between Israel and Hamas makes provisions for the passage of food and humanitarian aid into Gaza. This support is much needed given that Gaza’s agricultural system has been severely damaged over the course of the war.

    Over the past 17 months we have analysed satellite images across the Gaza Strip to quantify the scale of agricultural destruction across the region. Our newly published research reveals not only the widespread extent of this destruction but also the potentially unprecedented pace at which it occurred. Our work covers the period until September 2024 but further data through to January 2025 is also available.

    Before the war, tomatoes, peppers, cucumbers and strawberries were grown in open fields and greenhouses, and olive and citrus trees lined rows across the Gazan landscape. The trees in particular are an important cultural heritage in the region, and agriculture was a vital part of Gaza’s economy. About half of the food eaten there was produced in the territory itself, and food made up a similar portion of its exports.

    By December 2023, only two months into the war, there were official warnings that the entire population of Gaza, more than 2 million people, was facing high levels of acute food insecurity. While that assessment was based on interviews and survey data, the level of agricultural damage across the whole landscape remained out of view.

    Most olive and citrus trees are gone

    To address this problem, we mapped the damage to tree crops – mostly olive and citrus trees – in Gaza each month over the course of the war up until September 2024. Together with our colleagues Dimah Habash and Mazin Qumsiyeh, we did this using very high-resolution satellite imagery, detailed enough to focus on individual trees.

    We first visually identified tree crops with and without damage to “train” our computer program, or model, so it knew what to look for. We then ran the model on all the satellite data. We also looked over a sample of results ourselves to confirm it was accurate.

    Our results showed that between 64% and 70% of all tree crop fields in Gaza had been damaged. That can either mean a few trees being destroyed, the whole field of trees completely removed, or anything in between. Most damage took place during the first few months of the war in autumn 2023. Exactly who destroyed these trees and why is beyond the scope of our research or expertise.

    In some areas, every greenhouse is gone

    As greenhouses look very different in satellite images, we used a separate method to map damage to them. We found over 4,000 had been damaged by September 2024, which is more than half of the total we had identified before the start of the war.

    Greenhouses and the date of initial damage between October 2023 and September 2024.
    Yin et al (2025)

    In the south of the territory, where most greenhouses were found, the destruction was fairly steady from December 2023 onwards.

    But in north Gaza and Gaza City, the two most northerly of the territory’s five governorates, most of the damage had already taken place by November and December 2023. By the end of our study period, all 578 greenhouses there had been destroyed.

    North Gaza and Gaza City have also seen the most damage to tree crop fields. By September 2024, over 90% of all tree crops in Gaza City had been destroyed, and 73% had been lost in north Gaza. In the three southern governorates, Khan Younis, Deir al-Balah and Rafah, around 50% of all tree crops had been destroyed.

    Agricultural damage is common in armed conflict, and has been documented with satellite analysis in Ukraine since the 2022 Russian invasion, in Syria and Iraq during the ISIS occupation in 2015, and in the Caucasus during the Chechen wars in the 1990s and 2000s.

    The exact impact can differ from conflict to conflict. War may directly damage lands, as we have seen in Gaza, or it may lead to more fallow areas as infrastructure is damaged and farmers are forced to flee. A conflict also increases the need for local agricultural production, especially when food imports are restricted.

    Our assessment shows a very high rate of direct and extensive damage to Gaza’s agricultural system, both compared to previous conflict escalations there in 2014 and 2021, and in other conflict settings. For example, during the July-August war in 2014, around 1,200 greenhouses were damaged in Gaza. This time round at least three times as many have been damaged.

    Agricultural attacks are unlawful

    Attacks on agricultural lands are prohibited under international law. The Rome Statute of the International Criminal Court from 1998 defines the intentional use of starvation of civilians through “depriving them of objects indispensable to their survival” as a war crime. The Geneva conventions further define such indispensable objects as “foodstuffs, agricultural areas for the production offoodstuffs, crops, livestock, drinking water installations and supplies and irrigation works”.

    Our study provides transparent statistics on the extent and timing of damage to Gaza’s agricultural system. As well as documenting the impacts of the war, we hope it can help the massive rebuilding efforts that will be required.

    Restoring Gaza’s agricultural system goes beyond clearing debris and rubble, and rebuilding greenhouses. The soils need to be cleaned from possible contamination. Sewage and irrigation infrastructure need to be rebuilt.

    Such efforts may take a generation or more to complete. After all, olive and citrus trees can take five or more years to become productive, and 15 years to reach full maturity. After previous attacks on Gaza the trees were mostly replanted, and perhaps the same will happen again this time. But it’s for good reason they say that only people with hope for the future plant trees.

    Lina Eklund receives funding from the Swedish National Space Agency and the Strategic Research Area: The Middle East in the Contemporary World (MECW) at the Centre for Advanced Middle Eastern Studies, Lund University, Sweden.

    He Yin receives funding from NASA.

    Jamon Van Den Hoek receives funding from NASA.

    ref. Gaza: we analysed a year of satellite images to map the scale of agricultural destruction – https://theconversation.com/gaza-we-analysed-a-year-of-satellite-images-to-map-the-scale-of-agricultural-destruction-248796

    MIL OSI – Global Reports

  • MIL-OSI Global: Fines for term-time holidays are at record levels – this will further erode trust between parents and schools

    Source: The Conversation – UK – By Charlotte Haines Lyon, Associate Professor: Education, York St John University

    PeopleImages.com – Yuri A/Shutterstock

    Recently released government statistics show a record number of fines were given to parents for their children’s absence from school in 2023-24 in England. Of the 487,344 fines issued, 91% were for unauthorised family holidays.

    If these fines, known as fixed penalty notices, go unpaid or in some cases have been previously issued, parents are taken to court. In 2023-24, 28,296 parents were prosecuted over their children’s school attendance.

    Whether the fines have any effect on ensuring attendance is debatable. The figures show that thousands of parents are willing to book a term-time holiday anyway. But fines are certainly affecting the crucial relationship between schools and families.

    When I carried out my doctoral research between 2014 and 2016 on the relationships between schools and parents, these bonds were already quite fragile. People in my study argued that endless “dictats” from school built a “brick wall” rather than a partnership.

    Now, it’s likely that an increasingly strict application of attendance rules is further breaking down trust.

    Fines were first introduced by a Labour government in 2004 as a last resort to tackle truancy. In 2014, then education secretary Michael Gove widened the application of the fines. Local authorities were encouraged to use penalty notices for parents who took their children on holiday during school term time.

    Since Gove, education secretaries – including current education minister Bridget Phillipson – have insisted that every day matters in school, and that there are very few reasons to miss school. Holidays are seen as unacceptable.

    Since the pandemic, even more focus has been placed on attendance as persistent absence rates have increased.

    Trust between parents and school staff is very important.
    fizkes/Shutterstock

    Government statistics show a correlation between attendance and exam results. However, whether lower attendance causes lower results is difficult to prove, especially when factors such as poverty are taken into account.

    What’s more, when holiday absence has been analysed separately, this has not been found to have the same negative affect on achievement at school as other reasons for absence.

    The record number of fines issued last year came before new guidance was set in August 2024. Now, fixed penalty notices have risen from £60 to £80 for a first offence (if paid within 21 days) and to £160 for a second offence (if paid within 28 days). If parents receive two fixed penalty notices within three years, the next offence will result in prosecution. However, councils may choose prosecution earlier if they wish.

    Whereas previously there was more discretion and variance between authorities and schools, all headteachers must now consider the above approach if a child misses more than five days of school. It can only be assumed that the number of fines and prosecutions will increase.

    As a side-effect, we are seeing schools encouraged to clamp down on child illness for fear that parents are lying and are in fact on holiday. While government guidance says that in most cases a parent’s word should be enough evidence that their child is sick, it also states that evidence of illness should be requested in cases where there is “genuine and reasonable doubt about the authenticity of the illness”.

    This suggests that schools should be questioning their trust in their pupils’ parents. This is a fundamental break down of the school-parent relationship, not to mention a strain on NHS time.

    Why parents book term-time holidays

    Term-time holidays are often seen as a way for parents to book a cheaper break, as holidays are generally more expensive during school holidays. But, even leaving aside that many families may only be able to afford a holiday at all if it is taken in term time due to the cost of living crisis, the situation is more complicated.

    There are many reasons for taking holidays within school term time. Families might be visiting relatives overseas for a wedding, funeral or because of a family member’s terminal illness. Often, a school might grant one day of absence, but no more.

    Parents may be unable to take leave from work during school holidays as a result of the industry they work in. They may have family members who work away for long periods, and want to spend time together with the children when they return. They may have a child with particular needs who is unable to cope with busy holiday times, or children in different schools with different holiday periods.

    Relationship breakdown

    When a headteacher refuses to authorise such a holiday this leads to resentment from parents. Resentment like this may cause some to withdraw children from school and choose to home educate.

    There is some effort now for schools to offer support first before legal intervention for families who might have attendance issues for other reasons, such as emotionally based school avoidance. But there is little to no desire to work with families around their complex needs for holidays.

    Partnership with parents is often touted by schools as central to pupils’ wellbeing, progress and attainment. But the power in this partnership is often skewed towards the professionals.

    Parents and schools should work together for the good of children. This does not simply mean parents obeying schools; that is not a recipe for partnership. Instead, it means understanding the different contexts that families and teachers live and work in. If parent engagement is essential to wellbeing and school progress, it is not worth continuing down the road of alienation and punishment.

    Dr Charlotte Haines Lyon is affiliated with Labour Party and UNISON.

    ref. Fines for term-time holidays are at record levels – this will further erode trust between parents and schools – https://theconversation.com/fines-for-term-time-holidays-are-at-record-levels-this-will-further-erode-trust-between-parents-and-schools-249085

    MIL OSI – Global Reports

  • MIL-OSI Global: The hidden truth about migrant deaths at the Canada-U.S. border

    Source: The Conversation – Canada – By Julie Young, Canada Research Chair in Critical Border Studies and Associate Professor of Geography and Environment, University of Lethbridge, University of Lethbridge

    The return of Donald Trump as United States president has sparked new security measures along the Canada-U.S. border.

    After Trump threatened to slap tariffs on Canadian imports if irregular migration and illegal drugs were not curtailed, Canadian federal and provincial governments pledged new border enforcement resources. Trump may still go ahead with his tariff threats despite a reprieve.

    Research shows that tighter border policies don’t deter migration. Policing borders pushes migrants into more remote and dangerous crossing points, and difficult crossings lead migrants to rely more heavily on human smuggling operations. One outcome of heightened border security is clearly an increase in human suffering and death.

    Asylum-seekers from Congo cross the border at Roxham Road into Québec in February 2023 in Champlain, N.Y.
    THE CANADIAN PRESS/Ryan Remiorz

    Our work documenting deaths at the Canada-U.S. border shows that irregular crossings have taken the lives of at least 38 people. The actual number of migrant fatalities is likely much higher.

    We’re concerned that additional border security measures will lead to more danger and death for migrants attempting to cross between the two countries. Recent incidents lend weight to these concerns: one migrant died in a car chase with RCMP on Feb. 4, while another nine people were arrested as they tried to cross into Canada in dangerous winter conditions on Feb. 3.

    Crossing the Canada-U.S. border

    People from around the world cross the Canada-U.S. border daily. Most people enter Canada and the United States formally through official ports of entry. Still, some migrants also travel across the border, in both directions, without official permission.

    Because irregular border crossings are hidden by nature, we will never know how many people enter Canada or the U.S. unofficially. Agencies charged with border security track “encounters” and “apprehensions” in the U.S. and the “interception” of asylum-seekers in Canada. But there is no common measurement used to estimate irregular crossing in either country.

    Irregular border crossing cases are affected by policy changes in both countries. In recent years, they appear to have been affected by migrants’ perceptions of American immigration policy and changes to the Canada-U.S. Safe Third Country Agreement.


    Read more:
    Tragedies, not accidents: Tougher Canadian and U.S. border policies will cost more lives


    Death at the border

    Our research identified 15 deaths at the Canada-U.S. border between 2020 and 2023, and another 23 deaths going back to 1989. Given the lack of official records, the actual number is likely higher.

    We filed access-to-information requests on both sides of the border. The RCMP acknowledged just one death in Canada, and the U.S. Customs and Border Protection (CBP) produced no results. Instead, we systematically collected media reports on border deaths and analyzed that data.

    Roughly three-quarters of migrants whose deaths were covered in news reports were travelling towards the U.S. Their remains were mainly recovered on the Canadian side of the border.


    Read more:
    Roxham Road: Asylum seekers won’t just get turned back, they’ll get forced underground — Podcast


    Migrants face a range of dangers when crossing the Canada-U.S. border irregularly, but drowning represents the most significant threat, followed by hypothermia — 23 and six of the 38 recorded deaths, respectively.

    Three people died in encounters with border patrol agents, with two fatally shot on the American side and one dying in a car crash while being chased by Canadian agents.

    An RCMP officer stops people as they enter Canada via Roxham Road near Hemmingford, Que., hours after amendments to the Safe Third Country agreement enabled authorities to turn asylum-seekers away from unofficial border crossings.
    THE CANADIAN PRESS/Graham Hughes

    Invisible deaths

    Our requests for official data on border deaths in both the U.S. and Canada came up empty-handed. After more than a year and the conclusion of an independent complaint investigation into the RCMP’s lack of response to our Canadian request, we were provided with information on one single death. The request filed in the U.S. returned no information.

    Researchers in both countries regularly report frustration with slow processes and a lack of results from such requests.

    This experience led us to believe that border enforcement agencies do not track deaths along the Canada-U.S. border in either country. This is a problem. The public is left in the dark, while potential migrants are not provided with information about the dangers of irregular crossings.

    It is particularly odd that American authorities don’t provide information on deaths at this border, given that deaths along the U.S.-Mexico border are tracked and publicly reported.

    If there’s been a policy decision not to track deaths at the Canada-U.S. border, it reveals a lack of concern and a willingness to obscure the full picture from the public. Both the Canadian and American governments need to change their approach to documenting border deaths, detailing all known cases publicly.

    More death on the horizon

    Trump’s return to the American presidency might lead to an increase in irregular migration between Canada and the U.S. The Canadian government’s move to beef up border security enforcement, in turn, makes it more likely that migrants will perish after choosing dangerous crossing points.

    Even when migrants die amid human smuggling operations, a lot of the responsibility lies with government decisions.

    As Public Safety Canada warned in 2023, more difficult border crossings lead to increased criminality in human smuggling. Government decisions drive people away from safer crossing points and into the influence of criminal organizations.

    The governments of Canada and the United States have a moral obligation to inform the public about deaths — and do everything in their power to prevent further tragedies.

    Julie Young receives funding from the Canada Research Chairs Program.

    Daniel E. Martinez, Dylan Simburger, and Simon Granovsky-Larsen do not work for, consult, own shares in or receive funding from any company or organisation that would benefit from this article, and have disclosed no relevant affiliations beyond their academic appointment.

    ref. The hidden truth about migrant deaths at the Canada-U.S. border – https://theconversation.com/the-hidden-truth-about-migrant-deaths-at-the-canada-u-s-border-247782

    MIL OSI – Global Reports

  • MIL-OSI Global: Anti-LGBTQ+ policies harm the health of not only LGBTQ+ people, but all Americans

    Source: The Conversation – USA – By Nathaniel Tran, Assistant Professor of Health Policy and Administration, University of Illinois Chicago

    Courts across the nation are debating whether LGBTQ+ people should be protected from discrimination. Kevin Dietsch/Getty Images

    In 2024, state legislatures introduced an all-time record of 533 bills targeting LGBTQ+ populations. These policies create a patchwork of legal landscapes that vary widely between and within states, affecting aspects of everyday life ranging from how kids learn and play to where adults live and work.

    All of these policies have implications for the health of not only LGBTQ+ people but also the general public.

    I am a health policy researcher who studies how state and federal legislation affect public health. Research has shown that the social determinants of health – the opportunities and resources that affect how people live, learn, play, work and age – play a significant role in LGBTQ+ well-being. Newly published work from my colleagues and I show how anti-LGBTQ+ public policies can have lasting effects on everyone’s health.

    Existing policies and LGBTQ+ health

    Same-sex marriage provides a clear example of the direct and indirect ways public policies affect LGBTQ+ health.

    Most people in the U.S. have health insurance through their employer, which usually offers coverage for employees and their family, including a spouse and children. A landmark 2015 study found that health coverage significantly increased for adults in same-sex marriages after its legalization in New York state. After same-sex marriage was legalized nationwide, a follow-up study also showed an increase in health insurance coverage among gay and lesbian couples.

    Even among single LGBTQ+ people who did not get married, same-sex marriage may have also improved their health by improving social attitudes toward LGBTQ+ people overall. Researchers found that gay and bisexual men, regardless of whether they were single or married, spent less on medical visits, mental health visits and overall health care spending after Massachusetts legalized same-sex marriage in 2004.

    Massachusetts was the first state to legalize same-sex marriage.
    Victoria Arocho/AP Photo

    Access to gender-affirming care provides another example of how public policies affect the health of LGBTQ+ people.

    A 2020 national study of nearly 30,000 transgender and nonbinary people found that suicide attempts and mental health hospitalizations declined in states that passed policies requiring private insurers to equally cover services they already provide for cisgender people for transgender people. No other studies directly analyze how policies regulating access to care affect the health of trans and nonbinary people.

    However, a large body of clinical research supports the health benefits of gender-affirming care. A randomized clinical trial and prospective study found that starting gender-affirming hormone therapy reduced depression and suicidality in transgender and nonbinary people. Several recent systematic reviews analyzing 124 peer-reviewed studies conducted over the past 50 years also found that gender-affirming surgery and hormone therapy improved quality of life and mental health.

    Policies outside health affect LGBTQ+ well-being

    Policies outside of health care – such as nondiscrimination, education and workplace protections – also affect LGBTQ+ well-being.

    For example, transgender and nonbinary people living in states with policies that specifically include gender identity in hate crime and discrimination protections reported better mental health than those in states without protections. Similarly, LGBTQ+ students in schools with designated safe spaces reported lower rates of suicidal thoughts.

    However, the surge in anti-LGBTQ+ policies in the U.S., initially focusing on youth, has significantly increased polarization between and within states. For example, while 17 states have implemented guidances to make schools safer and more inclusive for transgender youth, 25 states have banned transgender youth from using bathrooms and playing on sports teams that align with their gender. Meanwhile, South Dakota and Missouri have enacted laws to preempt progressive schools and districts from adding LGBTQ+ student protections and supportive resources.

    The Trump administration is also actively targeting resources that support LGBTQ+ students by reducing funding to schools that offer these programs.

    Inclusive spaces can help support the health of LGBTQ+ students.
    Jessica Hill/AP Photo

    In 2020, the Supreme Court ruled 6-3 in Bostock v. Clayton County that federal sex-based nondiscrimination protections in the workplace included discrimination based on gender identity and sexual orientation. Researchers found that LGBTQ+ older adults with co-workers supportive of their gender and sexuality experienced less workplace conflict and cognitive health problems compared with those who did not.

    The Trump administration is working to restrict the scope of federal antidiscrimination protections to exclude LGBTQ+ people.

    Harms of emerging anti-LGBTQ policies

    Emerging anti-LGBTQ+ policies could also have consequences for large swaths of the population beyond LGBTQ+ people.

    In 2025, the Supreme Court will hear Braidwood v. Becerra, a case arguing that requiring employers to cover PrEP – a once-a-day pill that is highly effective at preventing HIV infection – as part of the insurance plan they offer employees violates their religious freedom. Texas District Judge Reed O’Connor agreed that mandating PrEP coverage requires the plaintiffs to “facilitate and encourage homosexual behavior.”

    O’Connor ruled in 2023 to overturn the Affordable Care Act’s requirement that insurers fully cover preventive care. He argues this can be done on the grounds that the U.S. Preventive Services Task Force – a group of physicians and researchers that evaluates the quality and efficacy of preventive services – is unconstitutional. This legal challenge puts free coverage of mammograms, vaccinations and other preventive services into limbo for millions of Americans.

    The Trump administration has taken down CDC pages providing information about HIV.

    The Trump administration has scrubbed federal web pages of resources, programs and documents that reference gender and LGBTQ+ people. This order includes removing datasets that have been continuously updated since the 1980s to track public health issues such as homelessness, bullying in schools, and smoking and drinking, likely because they include LGBTQ+ demographic information.

    The administration has also ordered federal health agencies to retract scientific research that may be inclusive of LGBTQ+ people by searching for specific keywords, such as “gender.” The National Science Foundation is also screening active scientific research projects that use words like “women,” “trauma” and “disability.” Removing this data not only hamstrings public health research and programming for LGBTQ+ populations, but also restricts it for all Americans.

    These decisions are in stark contrast to countries such as England, Wales, New Zealand and Australia, which have collected or are planning to collect LGBTQ+ demographic data as part of their national census. Including LGBTQ+ people in demographic data reflects best practices that were outlined in the Federal Evidence Agenda on LGBTQI+ Equity issued under the Biden administration. These guidelines have since been removed.

    Far-reaching consequences

    The rapid escalation of anti-LGBTQ+ policies in recent years is already taking its toll on youth, with negative news coverage of LGBTQ+ issues causing spikes in suicidal thoughts.

    These policies also have far-reaching consequences for the broader public. Rigorous and long-standing research demonstrates that LGBTQ+-inclusive policies support safer communities and stronger economies for everyone, while exclusionary laws worsen and limit access to essential services.

    Ongoing legal battles and policy shifts will shape the future of LGBTQ+ rights, with rippling effects on public health, workplace protections and health care access for all Americans.

    Nathaniel Tran does not work for, consult, own shares in or receive funding from any company or organization that would benefit from this article, and has disclosed no relevant affiliations beyond their academic appointment.

    ref. Anti-LGBTQ+ policies harm the health of not only LGBTQ+ people, but all Americans – https://theconversation.com/anti-lgbtq-policies-harm-the-health-of-not-only-lgbtq-people-but-all-americans-248992

    MIL OSI – Global Reports

  • MIL-OSI United Kingdom: Flu and COVID-19 surveillance reports bulletin 2025

    Source: United Kingdom – Executive Government & Departments

    This bulletin (formally Weekly Winter Briefing) brings together the latest surveillance data, along with the latest public health advice for flu, COVID-19, RSV and other viruses common in winter.

    Latest update

    Thursday 6 February 2025

    In week 5:

    • influenza (flu) activity overall decreased across most indicators and was at medium activity levels – there continues to be an increase in influenza B across some indicators
    • COVID-19 activity remained stable across most indicators and was at baseline activity levels
    • respiratory syncytial virus (RSV) activity decreased across most indicators and was circulating at low levels overall

    For more information see the flu, COVID-19 and RSV surveillance report and norovirus surveillance report.

    Flu surveillance data

    In week 5:

    • flu activity overall decreased across most indicators and was at medium activity levels – there continues to be an increase in influenza B across some indicators
    • flu positivity decreased with a weekly mean positivity rate of 14%, compared to 15.6% in the previous week, this is based on a percentage of people who test positive among those with symptoms tested
    • overall, flu hospitalisations decreased slightly to 6.40 per 100,000 population, compared with 7.00 per 100,000 in the previous week
    • in week 5, the weekly influenza-like illnesses (ILI) General Practice (GP) consultation rate decreased to 13.9 per 100,000 compared with 15.4 per 100,000 in the previous week
    • reporting of the weekly influenza vaccine uptake for the 2024 to 2025 season concluded last week
    • up to the end of week 4 (week ending 26 January 2025), vaccine uptake was 39.7% for those under 65 years in a clinical risk group, 34.8% in all pregnant women and 74.6% for all those aged 65 years and over
    • uptake was 41.4% for children aged 2 years of age and 43.2% for children aged 3 years of age

    COVID-19 surveillance data

    In week 5:

    • COVID-19 activity remained stable across most indicators and was at baseline activity levels
    • COVID-19 positivity in hospital settings remained stable with a weekly mean positivity rate of 2.5% compared with 2.4% in the previous week
    • COVID-19 hospitalisations remained stable at 1.15 per 100,000 compared to 1.12 per 100,000 in the previous week
    • COVID-19 ICU admissions remained stable at 0.03 per 100,000 compared with 0.03 per 100,000 in the previous week
    • there were 9 COVID-19 acute respiratory incidents reported in week 4
    • the highest hospital admission rate was in the North-West, which increased to 1.79 per 100,00 compared with 1.36 per 100,000 in the previous week
    • those aged 85 years and over had the highest hospital admission rate, which increased to 13.84 per 100,000 compared with 11.78 per 100,000 in the previous week  
    • up to the end of week 5 (week ending 2 February 2025), 23.6% of those under 65 years in a clinical risk group and 59.3% of all people aged over 65 years old, who are living and resident in England had been vaccinated

    Respiratory syncytial virus (RSV) surveillance data

    In week 5:

    • respiratory syncytial virus (RSV) activity decreased across most indicators and was circulating at low levels overall
    • emergency department attendances for acute bronchiolitis remained stable
    • RSV positivity decreased to 2.5% compared with 3.9% in the previous week
    • overall, hospital admissions decreased to 1.06 per 100,000 compared with 1.42 per 100,000 in the previous week

    UKHSA monitors Human metapneumovirus (hMPV) detections in patients seen in GP practices or tested by hospital laboratories and reports on this in the weekly surveillance report.

    hMPV is a common respiratory infection in winter and current levels are expected at this time of year. Infections are usually mild, causing symptoms of a common cold. Most people have had hMPV by the time they are five years old and catch it again throughout their lives. In week 5, hMPV laboratory test positivity increased slightly to 4.2% from 3.8% in the previous week.

    Dr Alexander Allen, Consultant Epidemiologist at UKHSA, said: 

    We’re pleased to see that the downward trend in flu activity has continued into this week.

    If you have already had your flu vaccine this season, you can be reassured that the vaccine offers the best defence and protects against multiple strains. The predominant circulating flu strain continues to be A H1N1 clade 5a.2a. and the flu vaccine is well matched.

    If you’re eligible and haven’t yet had your flu vaccine, it’s important that you take this offer up if available through local services. This includes anyone recently pregnant or newly diagnosed as in an eligible clinical risk group.

    If you have symptoms of flu or COVID-19 such as a high temperature, cough and feeling tired and achy, try to limit your contact with others, especially those who are vulnerable. If you have symptoms and need to leave the house, our advice remains that you should consider wearing a face covering. Washing hands regularly and using and disposing tissues in bins can reduce the spread of respiratory illnesses, as can ensuring that indoor areas are well ventilated.

    Norovirus surveillance data

    In week 4:

    • norovirus reports in the 2-week period between 13 January 2025 to 26 January 2025 were 15% higher than the previous 2-week period
    • the total number of reports was 114.5% higher than the 5-season average for the same 2-week period – reporting remained highest in adults aged 65 years and over
    • rotavirus reporting increased in recent weeks but was within expected levels during the 2-week period of weeks 3 and 4 of 2025
    • the number of norovirus outbreaks reported to the Hospital Norovirus Outbreak Reporting System (HNORS) since the start of the 2024/2025 season is 15.8% higher than the 5-season average
    • while some of the increased reporting may be attributable to the increased use of PCR multiplex technology (capable of detecting multiple gastrointestinal pathogens in one test), it is likely that the emergence of an unusual norovirus genotype, GII.17, as well as changes in the epidemiology following the COVID-19 pandemic and other factors are contributing to the observed rise
    • during the 2024/2025 season to date, the majority (90.7%) of samples characterised were norovirus genogroup 2 (GII), of which the most frequently identified genotype was GII.17 (55.4%), an increase of this genotype has also been observed in other counties during 2024 and is being closely monitored – at present there is no indication it leads to more severe illness (note: it isn’t accurate to refer to GII.17 as ‘Kawasaki’ and this term is causing confusion with Kawasaki Disease, which is an unrelated disease)
    • laboratory reports represent just a small proportion of total norovirus cases and it has been estimated that for every case of norovirus reported to national surveillance in the UK there are about 288 in the community that go unreported, representing an annual burden of around 3 million cases
    • norovirus symptoms include nausea, vomiting and diarrhoea but can also include a high temperature, abdominal pain and aching limbs
    • norovirus infections can cause dehydration, especially in vulnerable groups such as young children and older or immunocompromised people, so if you do get ill it is important to drink plenty of fluids during that time

    Amy Douglas, Epidemiologist at UKHSA said:

    Norovirus cases are way above what we would usually see at this time of year and outbreaks in hospitals continue to rise. Just because you’ve had norovirus doesn’t mean you won’t get it again.

    It’s really important that if you have diarrhoea and vomiting, you take steps to avoid passing the infection on, including not  visiting people in hospitals and care homes.

    Do not return to work, school or nursery until 48 hours after your symptoms have stopped and don’t prepare food for others in that time either. This is because you can still pass on the virus in the days after you stop being sick.

    Washing your hands with soap and warm water and using bleach-based products to clean surfaces will also help stop infections from spreading. Alcohol gels do not kill norovirus so don’t rely on these alone.

    Norovirus infections can cause dehydration, especially in vulnerable groups such as young children and older or immunocompromised people, so if you do get ill it is important to drink plenty of fluids during that time.

    Washing your hands with soap and warm water and using bleach-based products to clean surfaces will also help stop infections from spreading. Alcohol gels do not kill norovirus so don’t rely on these alone.

    Previous

    Thursday 30 January 2025

    This bulletin (formally Weekly Winter Briefing) brings together the latest surveillance data, along with the latest public health advice for flu, COVID-19, RSV and other viruses common in winter.

    In week 4:

    • influenza activity overall decreased across most indicators and was at medium activity levels – there continues to be an increase in influenza B across some indicators
    • COVID-19 activity remained stable across most indicators and was at baseline activity levels
    • respiratory syncytial virus (RSV) activity showed a mixed picture and was circulating at low levels overall

    For more information see the flu, COVID-19 and RSV surveillance report and norovirus surveillance report.

    Flu surveillance data for week 4

    • Flu activity overall decreased across most indicators and was at medium activity levels. There continues to be an increase in influenza B across some indicators.
    • Flu positivity decreased with a weekly mean positivity rate of 15.6%, compared to 27.4% in the previous week. This is based on a percentage of people who test positive among those with symptoms tested.
    • Overall, flu hospitalisations decreased to 7.13 per 100,000 population, compared with 8.51 per 100,000 in the previous week.
    • For primary care surveillance, due to a technical issue in processing the data, the influenza-like-illness (ILI) consultations indicator has not been updated this week. In week 3, the weekly ILI General Practice (GP) consultation rate decreased to 17 per 100,000 compared with 23.1 per 100,000 in the previous week.
    • Up to the end of week 4 (week ending 26 January 2025), vaccine uptake was 39.7% for those under 65 years in a clinical risk group, 34.8% in all pregnant women and 74.6% for all those aged 65 years and over. Uptake was 41.4% for children aged 2 years of age and 43.2% for children aged 3 years of age.

    COVID-19 surveillance data for week 4

    • COVID-19 activity remained stable across most indicators and was at baseline activity levels.
    • COVID-19 positivity in hospital settings remained stable with a weekly mean positivity rate of 2.4% compared with 2.4% in the previous week.
    • COVID-19 hospitalisations decreased to 1.13 per 100,000 compared to 1.33 per 100,000 in the previous week.
    • COVID-19 ICU admissions remained stable at 0.03 per 100,000 compared with 0.05 per 100,000 in the previous week.
    • There were 11 COVID-19 acute respiratory incidents reported in week 4.
    • The highest hospital admission rate was in the North-East, which decreased to 2.37 per 100,00 compared with 2.74 per 100,000 in the previous week. 
    • Those aged 85 years and over had the highest hospital admission rate, which decreased to 11.86 per 100,000 compared with 15.14 per 100,000 in the previous week.  
    • Up to the end of week 4 (week ending 26 January 2025), 23.6% of those under 65 years in a clinical risk group and 59.3% of all people aged over 65 years old, who are living and resident in England had been vaccinated.

    Respiratory syncytial virus (RSV) surveillance data for week 4

    • Respiratory syncytial virus (RSV) activity showed a mixed picture and was circulating at low levels overall.
    • Emergency department attendances for acute bronchiolitis remained stable.
    • RSV positivity decreased slightly to 3.8% compared with 4.2% in the previous week.
    • Overall, hospital admissions increased to 1.42 per 100,000 compared with 1.20 per 100,000 in the previous week.
    • UKHSA monitors Human metapneumovirus (hMPV) detections in patients seen in GP practices or tested by hospital laboratories and reports on this in the weekly surveillance report. hMPV is a common respiratory infection in winter and current levels are expected at this time of year. Infections are usually mild, causing symptoms of a common cold and most people have had hMPV by the time they are five years old and catch it again throughout their lives. In week 4, hMPV laboratory test positivity decreased to 3.9% from 4.5% in the previous week.

    Dr Alexander Allen, Consultant Epidemiologist at UKHSA, said: 

    We’re continuing to see flu activity decrease, which is really promising at this stage in the season. People are still reminded to take protective measures to ensure we keep cases down as we have seen a recent increase in cases of influenza B amongst children, although this is to be expected at this time of year.

    The vaccine offers the best defence against flu and protects against multiple flu strains, including B strains. The predominant circulating flu strain continues to be A H1N1 clade 5a.2a. Analysis by UKHSA laboratory scientists shows that the H1N1 component of the flu vaccine is well matched.

    If you’re eligible and have not yet had your flu vaccine, it’s important that you take this offer up if available through local services. This includes anyone recently pregnant or newly diagnosed as in an eligible clinical risk group.

    If you have symptoms of flu or COVID-19 such as a high temperature, cough and feeling tired and achy, try to limit your contact with others, especially those who are vulnerable. If you have symptoms and need to leave the house, our advice remains that you should consider wearing a face covering. Washing hands regularly and using and disposing tissues in bins can reduce the spread of respiratory illnesses, as can ensuring that indoor areas are well ventilated.

    Norovirus surveillance data for week 3

    • Norovirus reports in the 2-week period between 6 January 2025 to 19 January 2025 were 18.3% higher than the previous 2-week period. The total number of reports was 113.3% higher than the 5-season average for the same 2-week period. Reporting remained highest in adults aged 65 years and over.
    • Rotavirus reporting has started to increase again in recent weeks but was within expected levels during the 2-week period of weeks 2 and 3 of 2025.
    • The number of norovirus outbreaks reported to the Hospital Norovirus Outbreak Reporting System (HNORS) since the start of the 2024/2025 season is 14.3% higher than the 5-season average.
    • While some of the increased reporting may be attributable to the increased use of PCR multiplex technology (capable of detecting multiple gastrointestinal pathogens in one test), it is likely that the emergence of an unusual norovirus genotype, GII.17, as well as changes in the epidemiology following the COVID-19 pandemic and other factors are contributing to the observed rise.
    • During the 2024/2025 season to date, the majority (90.4%) of samples characterised were norovirus genogroup 2 (GII), of which the most frequently identified genotype was GII.17 (56.3%), an increase of this genotype has also been observed in other counties during 2024 and is being closely monitored — at present there is no indication it leads to more severe illness (note: it is not accurate to refer to GII.17 as ‘Kawasaki’ and this term is causing confusion with Kawasaki Disease, which is an unrelated disease)
    • Laboratory reports represent just a small proportion of total norovirus cases and it has been estimated that for every case of norovirus reported to national surveillance in the UK there are about 288 in the community that go unreported, representing an annual burden of around 3 million cases.
    • Norovirus symptoms include nausea, vomiting and diarrhoea but can also include a high temperature, abdominal pain and aching limbs. Norovirus infections can cause dehydration, especially in vulnerable groups such as young children and older or immunocompromised people, so if you do get ill it is important to drink plenty of fluids during that time.

    Amy Douglas, Epidemiologist at UKHSA said:

    Norovirus cases are over double what we would usually see at this time of year. This isn’t just unpleasant for those affected – it’s having a big impact on hospitals and care homes.

    It’s really important that if you have diarrhoea and vomiting, you take steps to avoid passing the infection on. Please avoid visiting people in hospitals and care homes to prevent passing on the infection in these settings.

    Do not return to work, school or nursery until 48 hours after your symptoms have stopped and don’t prepare food for others in that time either. This is because you can still pass on the virus in the days after you stop being sick.

    Washing your hands with soap and warm water and using bleach-based products to clean surfaces will also help stop infections from spreading. Alcohol gels do not kill norovirus so do not rely on these alone.

    Previous

    Thursday 23 January 2025

    This bulletin (formally Weekly Winter Briefing) brings together the latest surveillance data, along with the latest public health advice for flu, COVID-19, RSV and other viruses common in winter.

    In week 3:

    • influenza activity overall decreased across most indicators and was at medium activity levels; however, laboratory surveillance indicated an increase in influenza B
    • COVID-19 activity remained stable across most indicators and was at baseline activity levels
    • respiratory syncytial virus (RSV) activity decreased across most indicators and was circulating at low levels of activity

    For more information see the flu, COVID-19 and RSV surveillance report and norovirus surveillance report.

    Flu surveillance data for week 3

    • Flu activity overall decreased across most indicators and was at medium activity levels. However, laboratory surveillance indicated an increase in influenza B.
    • Flu positivity decreased with a weekly mean positivity rate of 17.5%, compared to 21.1% in the previous week. This is based on a percentage of people who test positive among those with symptoms tested.
    • Overall, flu hospitalisations decreased to 8.41 per 100,000 population, compared with 9.92 per 100,000 in the previous week.
    • The weekly influenza-like illnesses (ILI) general practice (GP) consultation rate decreased to 17 per 100,000 compared with 23.1 per 100,000 in the previous week.
    • Up to the end of week 3 (week ending 19 January 2025), vaccine uptake was 39.5% for those aged under 65 years in a clinical risk group, 34.5% in all pregnant women and 74.4% for all those aged 65 years and over. Uptake was 41.2% for children aged 2 years of age and 43% for children aged 3 years of age.
    • Some indicators suggested an increase in flu activity in children over the last week, this is in line with an expected increase in respiratory virus activity in children following the post Christmas return to school.

    COVID-19 surveillance data for week 3

    • COVID-19 activity remained stable across most indicators and was at baseline activity levels.
    • COVID-19 positivity in hospital settings increased slightly with a weekly mean positivity rate of 2.4%, compared to 2.2% in the previous week. 
    • COVID-19 hospitalisations remained stable at 1.32 per 100,000 compared to 1.35 per 100,000 in the previous week.
    • COVID-19 ICU admissions remained stable at 0.04 per 100,000 compared with 0.04 per 100,000 in the previous week.
    • There were 10 COVID-19 acute respiratory incidents reported in week 3.
    • The highest hospital admission rate was in the North-East, which remained stable at 2.74 per 100,000, compared with 2.78 per 100,000 in the previous week.
    • Those aged 85 years and over had the highest hospital admission rate, which decreased slightly to 14.65 per 100,000 compared with 15.45 per 100,000 in the previous week.  
    • Up to the end of week 3 (week ending 19 January 2025), 23.6% of those under 65 years in a clinical risk group and 59.3% of all people aged over 65 years old, who are living and resident in England had been vaccinated.

    Respiratory syncytial virus (RSV) surveillance data for week 3

    • Respiratory syncytial virus (RSV) activity decreased across most indicators and was circulating at low levels overall.
    • Emergency department attendances for acute bronchiolitis increased.
    • RSV positivity decreased slightly to 4.2% compared with 4.7% in the previous week.
    • Overall, hospital admissions decreased to 1.21 per 100,000 compared with 1.57 per 100,000 in the previous week.
    • UKHSA monitors Human metapneumovirus (hMPV) detections in patients seen in GP practices or tested by hospital laboratories and reports on this in the weekly surveillance report. Most people have had hMPV by the time they are 5 years old and catch it again throughout their lives. In week 3, Human metapneumovirus (hMPV) laboratory test positivity increased to 4.9% from 3.5% in the previous week.

    Dr Jamie Lopez Bernal, Consultant Epidemiologist at UKHSA, said: 

    It’s encouraging that flu activity is continuing to decrease this week and is currently circulating at medium levels. Flu positivity has decreased by 3.6% this week, but we should remember that flu season is not over yet and people should continue to take protective measures to keep us on this downward trend.

    We’re monitoring a slight increase in Influenza B positivity this week, which is to be expected towards the end of winter and the vaccine protects against multiple flu strains, including B. The predominant circulating flu strain continues to be A H1N1 clade 5a.2a. Analysis by UKHSA laboratory scientists shows that the H1N1 component of the flu vaccine is well matched.

    If you’re eligible and have not yet had your flu vaccine, it’s important that you take this offer up if available through local services. This includes anyone recently pregnant or newly diagnosed as in an eligible clinical risk group.

    If you have symptoms of flu or COVID-19 such as a high temperature, cough and feeling tired and achy, try to limit your contact with others, especially those who are vulnerable. If you have symptoms and need to leave the house, our advice remains that you should consider wearing a face covering. Washing hands regularly and using and disposing tissues in bins can reduce the spread of respiratory illnesses.

    Norovirus surveillance data for week 2

    • Norovirus reports in the 2-week period between 30 December 2024 to 12 January 2025 were 12% higher than the previous 2-week period. The total number of reports was 89.8% higher than the 5-season average for the same 2-week period.
    • Rotavirus reporting has started to increase again in recent weeks but was within expected levels during the 2-week period of weeks 1 and 2 of 2025.
    • The number of norovirus outbreaks reported to the Hospital Norovirus Outbreak Reporting System (HNORS) since the start of the 2024/2025 season is 7.2% higher than the 5-season average.
    • During weeks 1 and 2 of 2025, reporting remained highest in adults aged 65 years and over.
    • While some of the increased reporting may be attributable to the increased use of PCR multiplex technology (capable of detecting multiple gastrointestinal pathogens in one test), it is likely that the emergence of an unusual norovirus genotype, GII.17, as well as changes in the epidemiology following the COVID-19 pandemic and other factors are contributing to the observed rise.
    • During the 2024/2025 season to date, the majority (90.5%) of samples characterised were norovirus genogroup 2 (GII), of which the most frequently identified genotype was GII.17 (58%), an increase of this genotype has also been observed in other counties during 2024 and is being closely monitored — at present there is no indication it leads to more severe illness (note: it isn’t accurate to refer to GII.17 as ‘Kawasaki’ and this term is causing confusion with Kawasaki Disease, which is an unrelated disease).
    • Laboratory reports represent just a small proportion of total norovirus cases and it has been estimated that for every case of norovirus reported to national surveillance in the UK there are about 288 in the community that go unreported, representing an annual burden of around 3 million cases.
    • Norovirus symptoms include nausea, vomiting and diarrhoea but can also include a high temperature, abdominal pain and aching limbs. Norovirus infections can cause dehydration, especially in vulnerable groups such as young children and older or immunocompromised people, so if you do get ill it is important to drink plenty of fluids during that time.

    Amy Douglas, Epidemiologist at UKHSA said:

    Norovirus activity has remained high in recent weeks and has started to increase again, as we expected following the post-Christmas return to school and work.

    If you have diarrhoea and vomiting, you can take steps to avoid passing the infection on. Do not return to work, school or nursery until 48 hours after your symptoms have stopped and do not prepare food for others in that time either. If you are unwell, avoid visiting people in hospitals and care homes to prevent passing on the infection in these settings. Washing your hands with soap and warm water and using bleach-based products to clean surfaces will also help stop infections from spreading. Alcohol gels do not kill norovirus so do not rely on these alone.

    Previous

    Thursday 16 January 2025

    This bulletin (formally Weekly Winter Briefing) brings together the latest surveillance data, along with the latest public health advice for flu, COVID-19, RSV and other viruses common in winter.

    In week 2:

    • influenza (flu) activity showed a mixed picture with some recent decline, and was circulating at medium levels
    • COVID-19 activity remained stable across most indicators and was at baseline activity levels
    • Respiratory syncytial virus (RSV) activity decreased across most indicators and was circulating at low levels of activity

    For more information, see the flu, COVID-19 and RSV surveillance report and norovirus surveillance report.

    Flu surveillance data for week 2

    • Flu activity showed a mixed picture with some indicators suggesting that activity may have reached a peak, and declined in recent weeks to medium levels
    • Flu positivity decreased with a weekly mean positivity rate of 20.9%, compared to 28.4% in the previous week (this is based on a percentage of people who test positive among those with symptoms tested)
    • Overall, flu hospitalisations decreased to medium levels of 9.47 per 100,000 population, compared with 13.43 per 100,000 in the previous week.
    • The weekly influenza-like illnesses (ILI) General Practice (GP) consultation rate increased to 23.1 per 100,000 compared with 20.6 per 100,000 in the previous week. Note that this is not considered to indicate rising activity as it follows two weeks with bank holidays, in which the number of GP appointments available was reduced
    • Up to the end of week 2 (week ending 12 January 2025), vaccine uptake stood at 39.1% of those under 65 years in a clinical risk group, 34.2% in all pregnant women and 74.1% in all those aged 65 years and over, 41.1% of children aged 2 years of age and 42.7% of children aged 3 years of age have been vaccinated

    COVID-19 surveillance data for week 2

    • COVID-19 activity remained stable across most indicators and was circulating at baseline levels
    • COVID-19 positivity in hospital settings decreased slightly with a weekly mean positivity rate of 2.1%, compared to 2.3% in the previous week
    • COVID-19 hospitalisations remained stable at 1.34 per 100,000 compared to 1.39 per 100,000 in the previous week
    • COVID-19 ICU admissions remained stable at 0.04 per 100,000 compared with 0.06 per 100,000 in the previous week
    • There were 8 COVID-19 acute respiratory incidents reported in week 2
    • The highest hospital admission rate was in the North-East, which remained stable at 2.74 per 100,000, compared with 2.78 per 100,000 in the previous week
    • Those aged 85 years and over had the highest hospital admission rate, which remained stable at  15.47 per 100,000 compared with 15.13 per 100,000 in the previous week  
    • Up to the end of week 2 (week ending 12 January 2025), 23.6% of those under 65 years in a clinical risk group and 59.2% of all people aged over 65 years old, who are living and resident in England had been vaccinated

    Respiratory Syncytial Virus (RSV) surveillance data for week 2

    • Respiratory syncytial virus (RSV) activity decreased across most indicators and was circulating at low levels overall
    • Emergency department attendances for acute bronchiolitis decreased
    • RSV positivity decreased to 4.7% compared with 6.2% in the previous week
    • Overall, hospital admissions decreased to 1.52 per 100,000 compared with 2.10 per 100,000 in the previous week

    • UKHSA monitors Human metapneumovirus (hMPV) detections in patients seen in GP practices or tested by hospital laboratories and reports on this in the weekly surveillance report. Most people have had hMPV by the time they are five years old and catch it again throughout their lives. In week 2, Human metapneumovirus (hMPV) laboratory test positivity decreased to 3.5% from 4.6% in the previous week

    Dr Conall Watson, Consultant Epidemiologist at UKHSA, said: 

    Flu activity is currently heading in the right direction, falling from high to medium levels overall this week. One of our key indicators is the percentage of positive flu tests, and this has come down from 28% to 21%. This is promising but we are nowhere near out of flu season yet. Mixing increases in January as people return to workplaces and schools which increases the chances for flu viruses to spread. 

    We urge everyone to do their bit to keep us on this downward trend.  If you have symptoms of flu or COVID-19 such as a high temperature, cough and feeling tired and achy, try to limit your contact with others, especially those who are vulnerable. If you have symptoms and need to leave the house, our advice remains that you should consider wearing a face covering. Washing hands regularly and using and disposing tissues in bins can reduce the spread of respiratory illnesses.

    If you’re eligible and haven’t yet had your flu vaccine, it’s important that you take this offer up if available through local services. This includes anyone recently pregnant or newly diagnosed as in an eligible clinical risk group.

    The vaccine protects against multiple flu strains and we are monitoring influenza type B activity closely as this can rise towards the end of winter. The predominant circulating flu strain continues to be A H1N1 clade 5a.2a. Analysis by UKHSA laboratory scientists shows that the H1N1 component of the flu vaccine is well matched.

    Norovirus surveillance data for week 1

    • Norovirus reports in the 2-week period between 23 December to 05 January 2024 were 6.7% lower than the previous 2-week period, although have increased in week 1 of 2025.
    • The decrease over the festive period has also been seen in previous years should be interpreted with caution as likely reflects changes in patterns of healthcare use, social mixing and lagged reporting due to the Christmas holidays, as well as the impact of school holidays. However, the total number of reports was 70.1% higher than the 5-season average for the same 2-week period.
    • Rotavirus reporting has decreased in recent weeks and was within expected levels during the 2-week period of weeks 52 of 2024 and 1 of 2025.
    • The number of norovirus outbreaks reported to the Hospital Norovirus Outbreak Reporting System (HNORS) since the start of the 2024/2025 season is 8.7% higher than the 5-season average.
    • Norovirus reporting remained high across all regions of England and all age groups, with the highest number of reports in adults aged 65 years and over.
    • While some of the increased reporting may be attributable to the increased use of PCR multiplex technology (capable of detecting multiple gastrointestinal pathogens in one test), it is likely that the emergence of an unusual norovirus genotype, GII.17, as well as changes in the epidemiology following the COVID-19 pandemic and other factors are contributing to the observed rise.
    • During the 2024/2025 season to date, the majority (90.4%) of samples characterised were norovirus genogroup 2 (GII), of which the most frequently identified genotype was GII.17 (58.1%), an increase of this genotype has also been observed in other counties during 2024 and is being closely monitored — at present there is no indication it leads to more severe illness (note: it isn’t accurate to refer to GII.17 as ‘Kawasaki’ and this term is causing confusion with Kawasaki Disease, which is an unrelated disease)
    • Laboratory reports represent just a small proportion of total norovirus cases and it has been estimated that for every case of norovirus reported to national surveillance in the UK there are about 288 in the community that go unreported, representing an annual burden of around 3 million cases.
    • Norovirus symptoms include nausea, vomiting and diarrhoea but can also include a high temperature, abdominal pain and aching limbs. Norovirus infections can cause dehydration, especially in vulnerable groups such as young children and older or immunocompromised people, so if you do get ill it is important to drink plenty of fluids during that time.

    Amy Douglas, Epidemiologist at UKHSA said:

    Norovirus activity remains high.

    If you have diarrhoea and vomiting, you can take steps to avoid passing the infection on. Do not return to work, school or nursery until 48 hours after your symptoms have stopped and don’t prepare food for others in that time either. If you are unwell, avoid visiting people in hospitals and care homes to prevent passing on the infection in these settings.  > Washing your hands with soap and warm water and using bleach-based products to clean surfaces will also help stop infections from spreading. Alcohol gels do not kill norovirus so don’t rely on these alone.

    Previous

    Thursday 09 January 2025

    This bulletin (formally Weekly Winter Briefing) brings together the latest surveillance data, along with the latest public health advice for flu, COVID-19, RSV and other viruses common in winter.

    In week 1:

    • COVID-19 activity remained stable across most indicators and was at baseline activity levels
    • influenza (flu) activity showed a mixed picture with some indicators suggesting that activity may have reached a peak, though activity remains at high levels
    • Respiratory syncytial virus (RSV) activity decreased across most indicators and was circulating at low levels

    For more information, see the flu, COVID-19 and RSV surveillance report and norovirus surveillance report.

    Flu surveillance data for week 1

    • Flu activity showed a mixed picture with some indicators suggesting that activity may have reached a peak, though activity remains at high levels
    • flu positivity decreased slightly with a weekly mean positivity rate of 28.1%, compared to 29.7% in the previous week. This is based on a percentage of people who test positive among those with symptoms tested at sentinel “spotter” laboratories, reported through the Respiratory DataMart surveillance system
    • overall, flu hospitalisations remained stable at 13.41 per 100,000, compared with 13.90 per 100,000 in the previous week
    • the weekly influenza-like illnesses (ILI) General Practice (GP) consultation rate increased to 20.6 per 100,000 compared with 13.9 per 100,000 in the previous week
    • up to the end of week 1, vaccine uptake stood at 38.6% of those under 65 years in a clinical risk group, 33.8% in all pregnant women and 73.8% in all those aged 65 years and over. 40.9% of children aged 2 years of age and 42.5% of children aged 3 years of age have been vaccinated

    COVID-19 surveillance data for week 1

    • COVID-19 activity remained stable across most indicators and was circulating at baseline levels
    • COVID-19 positivity in hospital settings decreased with a weekly mean positivity rate of 2.2%, compared to 2.5% in the previous week
    • COVID-19 hospitalisations remained stable at 1.39 per 100,000 compared to 1.32 per 100,000 in the previous week
    • COVID-19 ICU admissions remained stable at 0.06 per 100,000 compared with 0.04 per 100,000 in the previous week
    • there were 12 COVID-19 acute respiratory incidents reported in week 1
    • the highest hospital admission rate was in the North-East at 2.78 per 100,000, increasing from 1.68 per 100,000 in the previous week
    • those aged 85 years and over had the highest hospital admission rate, which increased to 15.36 per 100,000 compared with 12.64 per 100,000 in the previous week
    • up to the end of week 1, 23.5% of those under 65 years in a clinical risk group and 59.1% of all people aged over 65 years old, who are living and resident in England had been vaccinated

    Respiratory syncytial virus (RSV) surveillance data for week 1

    • Respiratory syncytial virus (RSV) activity decreased across most indicators and was circulating at low levels overall
    • emergency department attendances for acute bronchiolitis decreased
    • RSV positivity decreased slightly to 6.2% compared with 7.2% in the previous week
    • overall, hospital admissions decreased to 2.14 per 100,000 compared with 2.48 per 100,000 in the previous week

    Dr Conall Watson, Consultant Epidemiologist at UKHSA, said: 

    We are continuing to see high levels of flu this week and ongoing admissions to hospitals and intensive care.  Although activity has remained stable coming into the new year, influenza activity can be unpredictable as people return to work and school and opportunities for the virus to spread can increase. 

    The predominant circulating flu strain continues to be A H1N1 clade 5a.2a, and the World Health Organization has so far concluded that the H1 component of the flu vaccine is well matched. If you’re still offered a vaccine through local services, it’s important that you take this up, including if you are pregnant or a health and social care worker.

    If you have symptoms of flu or COVID-19 such as a high temperature, cough and feeling tired and achy, try to limit your contact with others, especially those who are vulnerable. If you have symptoms and need to leave the house, our advice remains that you should consider wearing a face covering. Washing hands regularly and using and disposing tissues in bins can reduce the spread of respiratory illnesses.

    Norovirus surveillance data for week 52

    • Norovirus activity has decreased in recent weeks, with reports in the 2-week period between 16 to 29 December 2024 12.1% lower than the previous 2-week period. The decrease over the festive period has also been seen in previous years and should be interpreted with caution as it likely reflects changes in patterns of healthcare use, social mixing and lagged reporting due to the Christmas holidays, as well as the impact of school holidays. However, the total number of reports was 63.6% higher than the 5-season average for the same 2-week period.
    • Rotavirus reporting has decreased in recent weeks and was within expected levels during the 2-week period of weeks 51 and 52.
    • The number of norovirus outbreaks reported to the Hospital Norovirus Outbreak Reporting System (HNORS) since the start of the 2024/2025 season is 11.7% higher than the 5-season average.
    • Norovirus reporting remained high across all regions of England and all age groups, with the highest number of reports in adults aged 65 years and over.
    • While some of the increased reporting may be attributable to the increased use of PCR multiplex technology (capable of detecting multiple gastrointestinal pathogens in one test), it is likely that the emergence of an unusual norovirus genotype, GII.17, as well as changes in the epidemiology following the COVID-19 pandemic and other factors are contributing to the observed high levels.
    • During the 2024/2025 season to date, the majority (89.5%) of samples characterised were norovirus genogroup 2 (GII), of which the most frequently identified genotype was GII.17 (59.7%), an increase of this genotype has also been observed in other counties during 2024 and is being closely monitored — at present there is no indication it leads to more severe illness (note: it isn’t accurate to refer to GII.17 as ‘Kawasaki’ and this term is causing confusion with Kawasaki Disease, which is an unrelated disease)
    • Laboratory reports represent just a small proportion of total norovirus cases and it has been estimated that for every case of norovirus reported to national surveillance in the UK there are about 288 in the community that go unreported, representing an annual burden of around 3 million cases.
    • Norovirus symptoms include nausea, vomiting and diarrhoea but can also include a high temperature, abdominal pain and aching limbs. Norovirus infections can cause dehydration, especially in vulnerable groups such as young children and older or immunocompromised people, so if you do get ill it is important to drink plenty of fluids during that time.

    Amy Douglas, Epidemiologist at UKHSA, said:

    Although there was a decrease in reports of norovirus over the festive period, cases still remain high and we expect levels to rise further with the return to school.

    If you have diarrhoea and vomiting, you can take steps to avoid passing the infection on. Do not return to work, school or nursery until 48 hours after your symptoms have stopped and don’t prepare food for others in that time either. If you are unwell, avoid visiting people in hospitals and care homes to prevent passing on the infection in these settings.

    Washing your hands with soap and warm water and using bleach-based products to clean surfaces will also help stop infections from spreading. Alcohol gels do not kill norovirus so don’t rely on these alone.

    Updates to this page

    Published 6 February 2025

    MIL OSI United Kingdom

  • MIL-OSI Economics: ICC urges negotiation over retaliation on trade tariffs 

    Source: International Chamber of Commerce

    Headline: ICC urges negotiation over retaliation on trade tariffs 

    We use necessary cookies to make our site work. We’d also like to set optional cookies to optimize site functionality and to give you the most relevant experience. We won’t set optional cookies unless you enable them. Using this tool will set a cookie on your device to remember your preferences.

    The technical storage or access is strictly necessary for the legitimate purpose of enabling the use of a specific service explicitly requested by the subscriber or user, or for the sole purpose of carrying out the transmission of a communication over an electronic communications network.

    The technical storage or access is necessary for the legitimate purpose of storing preferences that are not requested by the subscriber or user.

    The technical storage or access that is used exclusively for statistical purposes. The technical storage or access that is used exclusively for anonymous statistical purposes. Without a subpoena, voluntary compliance on the part of your Internet Service Provider, or additional records from a third party, information stored or retrieved for this purpose alone cannot usually be used to identify you.

    The technical storage or access is required to create user profiles to send advertising, or to track the user on a website or across several websites for similar marketing purposes.

    MIL OSI Economics

  • MIL-OSI United Kingdom: Phenomenal figures released for York’s Park and Ride

    Source: City of York

    Figures released today show that 2024 was the busiest year for York’s Park and Ride since 2017, with the total number of journeys exceeding 4.5 million, almost one million higher than in 2023.

    December saw the most trips for a decade, recording nearly 500,000 journeys, a 3.5 per cent increase on the previous highest monthly total set in December 2016.

    City of York Council estimates that people boarding at the Park and Ride sites in December resulted in over 61,700 cars not travelling into central York – equivalent to a line of traffic that would be long enough to reach central London*.

    York’s Enhanced Bus Partnership, which oversees £17.2million of government funding for the Bus Service Improvement Plan, ran a marketing campaign to promote the Park and Ride as well as direct bus services for six weeks before Christmas. Working with Make It York and all bus operators, the social media posts and adverts reached over 2.2million people in a campaign targeting towns and cities where previous research has shown Christmas Market visitors come from.

    Councillor Kate Ravilious, Executive Member for Economy and Transport at City of York Council, said:

    Just shy of half a million journeys in one month is an incredible milestone to reach, so thank you to all the residents and visitors for using the Park and Ride, and thank you to First Bus for increasing the number of buses available during this incredibly busy period.
     

    First Bus invested in more services on the network in November and December, increasing frequency on several routes to support the York local and visitor economy in anticipation of customer demand. First Bus replicates this investment during other busy periods to keep York visitors and commuters moving sustainably throughout the year.

    Cllr Ravilious continued;

    The numbers are phenomenal but we do also need to recognise that York still experienced congested streets in the run up to Christmas, so while we are delighted, we continue our work throughout the year to support and promote the city’s bus services as well as other sustainable forms of transport. Our young people’s ticketing and marketing campaigns, which and are funded by central government, have over the last 12 months helped make bus use more attractive and given more people more options, and we will soon be consulting on improvements to the Park and Ride sites.”

    Kayleigh Ingham, Commercial Director of First Bus North & West Yorkshire, said:

    The superb performance throughout 2024 is a tribute to the commitment and high standards of service delivered by the First Bus team.

    We’ve demonstrated that bus is an easy and sustainable way to travel into York. We’re attracting more customers due to good value fares, zero-emission buses, and our service, which is delivered with a smile. The benefits this brings, with cleaner air and quieter city centre roads, contributes to York’s environmental targets.

    Sarah Loftus, Managing Director of Make It York, said:

    It is wonderful to see the great results for bus travel for the year and 500,000 journeys during the Christmas period is fantastic. We are very fortunate to have a bus service within the city that supports both demand and sustainability. Collaboration between all parties on communicating key messages was key and we look forward to working with and supporting the transport sector throughout 2025.
     

    *In December First Bus sold 148,310 tickets at the Park and Ride sites alone (the remaining journeys being people who joined the bus along the route or were returning from the city centre). Industry standard definition of occupancy per car for a leisure trip is 2.4 people. This gives us a total of 61,700 cars that didn’t come into the city centre over Christmas. Google Maps shows that the road route from York Minster to Westminster Abbey is 210 miles. If we say a car takes up 6m of space on the road, 61,700 x 6m = 230 miles. Therefore 61,700 cars would stretch all the way to central London.

    These Park and Ride figures follow the Department for Transport’s own statistics released late in 2024 which show that York’s bus services as a whole (ie all local services and the Park and Ride) are once again in the top ten of all local authorities for the number of bus trips per resident. An average of 70.6 journeys per head of population in 2023/2024 ranks York the best in Yorkshire and nationally sits 9th out of 90 English local authority areas.

    The data also showed that York’s bus trips are up 35% from 2021/22, almost quadrupled from 2020/21 and now back within 3% of the level they were in 2019/20 (ie the year before covid). This is one of the best post-pandemic recovery rates in the country.

    In addition to December’s figures, November 2024 was the busiest November ever recorded, with 10% more passengers than the previous record set in 2016. 

    MIL OSI United Kingdom

  • MIL-OSI Security: Saskatchewan — Saskatchewan RCMP SERT Year in Review: 230 firearms and more than 17,000 grams of illicit drugs seized in 2024

    Source: Royal Canadian Mounted Police

    In 2024, Saskatchewan RCMP’s Saskatchewan Enforcement Response Teams (SERT) continued to work diligently with frontline RCMP officers from detachments across the province to remove harms from communities and help keep Saskatchewan residents safe.

    Saskatchewan RCMP’s SERT – which includes Crime Reduction Teams (CRT), the Human Trafficking and Counter Exploitation Unit (HTCEU), Offender Management Unit (OMU), Saskatchewan Trafficking Response Teams (STRT) and Warrant Enforcement and Suppression Teams (WEST) – helps protect community well-being by tackling serious and gang-related crimes, and take dangerous drugs and weapons off the streets.

    Removing harms from Saskatchewan communities

    Illicit drugs continue to harm people across the province. In 2024, Saskatchewan RCMP’s SERT teams seized:
    – 6,572 grams of cocaine;
    – 4,732 grams of methamphetamine;
    – 130 grams fentanyl;
    – 6,349 grams of other illicit drugs; and
    – 86 tablets.

    From 2014 to 2023, violent firearms offences in Saskatchewan RCMP jurisdiction increased 271 per cent – rising from 126 in 2014 to 467 in 2023.

    Saskatchewan RCMP’s SERT removed 230 firearms from the hands of criminals across the province in 2024.

    Investigational highlights

    In July 2024, Yorkton STRT seized approximately 161 grams of methamphetamine and 14 firearms, along with other items, from a business, a rural property and a vehicle in the Yorkton area. During a subsequent search of the rural property, RCMP officers located a severely injured, forcibly confined adult male inside a barn. Investigation determined the man had been kidnapped. Two adult males faced kidnapping, drug and firearms charges, among others.

    • Swift Current STRT laid charges against two individuals after seizing 31 firearms from a residence in Lafleche, SK and a rural yard site south of the town in November 2024.
    • In October 2024, North Battleford Crime Reduction Team – Gang Task Force (CRT-GTF) executed search warrants at two residences in North Battleford. At the residences, officers located and seized a loaded handgun, a rifle, approximately 81 grams of methamphetamine, approximately 58 grams of crack cocaine, ammunition, a sum of cash and drug trafficking paraphernalia. As a result of investigation, two adult males and an adult female were arrested.
    • While executing a search warrant at an apartment building in La Ronge in February 2024, La Ronge CRT seized a loaded handgun, 60 grams of cocaine, 31 grams of methamphetamine, a sum of cash and other drug paraphernalia. Two adults were arrested and charged.
    • In August 2024, Swift Current STRT executed two search warrants in Swift Current as part of an ongoing investigation. Officers located and seized 503 grams of methamphetamine, 52 grams of fentanyl and 105 grams of cocaine, among other evidence. An adult male was arrested at the business and charged.

    What is SERT?

    Saskatchewan RCMP SERT is made up of 108 RCMP officers and 31 civilian support staff. With different teams located in 10 Saskatchewan communities, SERT is readily mobile and able to quickly deploy to surrounding areas. Teams are also assisted every single day by over 1,500 RCMP employees, including more than 1,000 sworn officers at 80 plus detachments across the province.

    MIL Security OSI

  • MIL-OSI United Kingdom: Minister Sir Chris Bryant speech at LEAD advertising conference

    Source: United Kingdom – Executive Government & Departments

    Creative Industries Minister Sir Chris Bryant gave the keynote speech at the LEAD advertising industry conference in London.

    My name is Chris Bryant. I’m the Minister for lots of things. And Peter Mandelson, when I was first elected back in 2001 as the Member of Parliament for the Rhondda, I asked him for some advice. And he said he had lots of pieces of advice, but one of them was: “Never go to the same event two years in a row.” Because it means if you don’t go to the third year, everybody will condemn you for being a complete lazy so and so. But this is my second year in a row at this event. So I’ve broken Peter Mandelson’s advice.

    And the second piece of advice he gave me was: “The one word you can never use in advertising and in politics is the word trust.” Because the moment you start talking about trust in politics, people start thinking: “Oh, can I trust you?” And they nearly always come to the conclusion that they can’t. 

    But in the end, advertising, I suppose, is fundamentally about trust. It’s about trying to persuade the public that you can trust a particular product or that you can trust a particular brand that is promoting a particular product, or that you can trust the person who is promoting the brand that is promoting the product, or that you can trust the space in which you’re watching or seeing this particular piece of advertising. 

    Of course, to enable trust in all and to create great advertising, that requires all sorts of different things. First of all, imagination. And I think sometimes when I speak to some other parts of the creative industries, they think of advertising as the kind of workhorses of the creative industries. But I actually think that in many regards, you’re more imaginative than nearly all the other parts of creative industries put together. And sometimes, of course, you have to bring them all together. 

    But the original idea for how to launch a product, or how to sell a product, how to promote it, how to keep it in the public mind, or how to completely change a view of a product or a brand, that’s a phenomenally imaginative process. 

    I always think to myself: “How do you come up with a television or a cinema advert for perfume?” How on earth can you give the impression that this is a perfume that somebody would want to wear when you cannot smell it? Which is fundamentally what perfume is all about. And of course, you do that in advertising with so many different products. Sometimes you’re trying to encourage people to try products that they would never have touched before, either because they’re brand new products, or because they’re something that has never come into their way of life before or because their life has changed. 

    That requires phenomenal imagination, but it also requires craft, serious craft, whether that’s using statistics and market analysis to be able to determine what is really going to work, how big a particular market is, or it’s that whole ecosystem of the whole of the creative industries, through from writers, actors and technicians, location scouts and everybody else that’s part of making a really good advert. 

    That combination of imagination, craft and that whole ecosystem is what I think is so special in the United Kingdom. We’re at the moment working with Shriti Vadera and Peter Bazalgette on putting together our Industrial Strategy for the creative industries. We decided as a government that the creative industries are one of the eight key sectors in the UK that are potential growth sectors we want to build on. 

    And putting that together, one of the key elements that we keep on arguing with the Treasury and the Department for Business and Trade and everybody else in government is that this is an ecosystem. You don’t get great British films without great British marketing of films. You don’t get great British films without actors who probably performed on the stage as well as in television and in movies. You don’t get great British actors without a commercial theatre that’s successful in the UK and also without a subsidised theatre in the UK. 

    All of these things hang together, and it’s really important that we promote the whole of that sector. And that’s, of course, why we are the second largest exporter of advertising in the world. I remember when I first came across this statistic, I thought: “That can’t be right. It must just be the second largest in Europe.” But we are the second largest in the world and I think we could do a great deal more boasting about that. 

    I don’t know whether there’s anybody in advertising who could promote the idea of advertising being a very significant part of our economy, worth £21 billion of GVA in 2023 and on track this year for £43 billion of spending. So in the words of Yazz: the only way is up.  

    We are very keen on this being a cooperation between industry and government. So first of all, the single most important thing we know that we can do to enable this industry to grow in the UK is to provide political, fiscal and economic stability in the country, so that people can make long-term investments and know where they’re going. 

    [political content redacted]

    And secondly, as I just said, we’re working on our Industrial Strategy for the creative industries. If there’s stuff that you still feel that you have you haven’t heard from us in this world, then please do get in touch. 

    Thirdly, obviously, there’s a really important issue around skills. For me, this is a matter of passionate belief that you don’t get a good education unless you also get a good creative education. I want to praise Eton and Winchester and everybody else, because they’ll have a pottery class, they’ll have an art room, they’ll have a well equipped theatre, they’ll have a dance studio, they’ll have musical instruments. I just want that for every single child in this country, and that’s why I think it’s so important that we turn the corner on the curriculum in the UK. 

    That’s what Bridget Phillipson as the Secretary of State for Education is very intent on doing. Trying to bring a creative education right back into the heart, so that it’s not just STEM, which is very important, but STEAM, including arts and creative education, is part of it. 

    Secondly, we need to reform the Apprenticeship Levy. I know lots of people in the industry have said to me: “It just doesn’t work for us at the moment.” And that’s what we’re very focused on doing. 

    The first thing we’ve already done is we’ve announced that from August this year, you won’t have to do a 12-month apprenticeship. You’ll be able to do six months and that’s so important for people who are working on a project base, and we need to provide a greater sense of portability between different employers as well, to be able to make that Apprenticeship Levy work across the creative sector. 

    Indeed, there’s a perfectly good argument for saying, because of the ecosystem that I’ve been talking about, that the Apprenticeship Levy should enable you to go from different parts of the ecosystem to be able to perfect your craft.

    Now just a few specific things on the Online Advertising Taskforce. Online has provided new challenges and new opportunities. I’m really glad that the influencer working group has come up with its fourth version of a code of conduct, the first in the world. If anybody knows any influencers who could persuade more influencers to take up the influencers’ code of conduct, I’ll be really grateful. 

    But that is a really important campaign, because it goes to this issue of trust. If it becomes a whole world when you simply can’t trust what you’re seeing in front of you as promoting a product, then that undermines the whole of the industry. So I think the more we can do in that field, the better. 

    I’m really grateful for the work that’s being done on an AI working group. At the moment we’re engaged in a consultation on this and precisely how it works out in relation to copyright. I am absolutely clear that we as a country sell IP. It’s one of the key things that we sell. So making sure that we have a strong copyright system in the UK, that we maintain that, and maintain the ability of people to be remunerated and to control their rights, is a vital part of anything we do in this field. 

    But of course, many of you will use AI in all sorts of different ways already, and my guess is in two or three years’ time, every single person will have an AI assistant of some kind on their laptop or on their phone. We need to make sure that we think that there’s a possibility for a win-win in this. If you haven’t looked at the consultation yet, please do. It closes on February 25. 

    On less healthy food, some of you might be interested in this subject. Obviously the previous government legislated in relation to less healthy foods and advertising, and we did too in the statutory instrument that was brought forward just before Christmas. I’ve already had several meetings with the ASA. We are very keen on coming to a sensible solution. I think a bit of common sense in this space would be really, really useful. We discussed the matter. I’m saying to you what I said to the ASA the other day. Our priority is proportionate regulation and clear guidance for businesses operating in the sector. And as you would expect from us, we want to reduce the NHS backlog, and we want to support people to lead healthier lives. We want there to be incentives for brands to offer more healthy products. That only happens if we have a clear set of guidance that is proportionate and sensible. I can’t go any further than that, because I’ve got another meeting with all the organisations concerned next week. 

    I want to end with my key point, which is that we are very serious about growing the creative industries in the UK. I heard somebody say: “Well, aren’t the arts and the creative industries a bit frou-frou?” I don’t know what that means, really, but I get the point, I suppose. 

    But actually, if the UK had no creative industries, we would be a poorer, weaker, less happy, less stable society than we are. And I think that the creative industries not only have an economic role to play – a vastly significant one, one in 14 people in the UK works in the creative industries today and I guess it will be one in 10 in a few years’ time – but if we’re going to build that, we need you to tell us what are the barriers to growth in your sector. 

    We need to make sure that there’s a steady stream of people through into these industries. I asked this question last year, and I’m going to ask it again, and I’m going to keep on asking every single year that I come here, which is: If you came to my constituency and asked a 13 year old: “What are you going to do when you grow up, or what careers are you thinking about?” They would probably know what it is to be a doctor and how they would start trying to be a doctor or a lawyer or a teacher, but they wouldn’t have the faintest idea how they would start the process of going into advertising or any of the other creative industries. 

    So in four years’ time, I would like us to be in a place where every single child in the country has the creative industries, including advertising, as one of the possible future careers for them, and that they know how to approach that, so that your seats are taken in 10, 15, 20 years’ time by young people who might just as well come from Wigan, Gateshead, Newcastle, London, the Rhondda, Shetland. People with completely varied backgrounds and different experiences, so that they can bring their imagination and their storytelling to the great industry that is yours.

    Updates to this page

    Published 6 February 2025

    MIL OSI United Kingdom

  • MIL-OSI Global: How populist leaders like Trump use ‘common sense’ as an ideological weapon to undermine facts

    Source: The Conversation – USA – By Dannagal G. Young, Professor of Communication and Political Science, University of Delaware

    Secretary of Defense Pete Hegseth, left, is part of a ‘revolution of common sense’ led by President Donald Trump. Chip Somodevilla/Getty Images

    It’s “the revolution of common sense,” President Donald Trump announced in his second inaugural address.

    And so it is. The latest installment of that assertion came in his Jan. 30, 2025, press conference about the Potomac plane crash. When asked how he had concluded that diversity policies were responsible for a crash that was still under investigation, Trump responded, “Because I have common sense, OK?”

    “Common sense” is what’s known to scholars as a “lay epistemology,” or how regular people make sense of the world. We don’t rely on statistical evidence or expert research while we’re buying lettuce or driving in traffic. Instead, we’re guided by direct experience, emotions and intuition.

    Because it comes from regular people and not institutions that some people deem to be “corrupt,” champions of common sense suggest it leads to a purer form of truth.

    President Donald Trump is asked how he could conclude that DEI policies caused the Potomac plane crash.

    Yet it is precisely because it comes from personal observations and intuition that research shows common sense is steeped in bias and often leads us astray.

    Populist leaders like Trump commonly celebrate common sense and attack expertise and evidence. Populism is less about being liberal or conservative than it is a way of appealing to the public. These appeals are based on a moral separation between the corrupt, bad people with cultural power and the good, pure people who hold the right values – like faith in common sense over expertise and evidence.

    And with the new Trump administration, the elevation of common sense as a virtue has been quick and broad.

    Dusty boots vs. elite credentials

    In his confirmation hearing for the position of secretary of defense, Pete Hegseth pointed to “dust on his boots” as evidence of his qualifications, in contrast to the elite credentials of past defense secretaries, who have often been Washington insiders.

    Hegseth couldn’t name members of the Association of Southeast Asian Nations, an alliance of countries playing a crucial role in global security. But he did show that he knew the diameter of the rounds that fit in the magazine of an M4 rifle.

    That was evidence that he was, in his words, “a change agent. Someone with no vested interest in certain companies or specific programs or approved narratives.”

    Even Meta’s announcement that it would roll back expert fact-checking on its U.S. social media platforms reflects a “lay epistemic” shift.

    Meta explained that fact-checkers, “like everyone else, have their own biases and perspectives” and that these biases had made fact-checking “a tool to censor.”

    Instead, the company would embrace a community notes model where users could provide additional information on posts, which Meta argued would be “less prone to bias.”

    We’ve seen this approach work on X,” wrote Meta’s Chief Global Affairs Officer Joel Kaplan, “where they empower their community to decide when posts are potentially misleading and need more context, and people across a diverse range of perspectives decide what sort of context is helpful for other users to see.”

    This policy change is probably less of a shift in Facebook founder and CEO Mark Zuckerberg’s principles than a change made out of necessity. Given Trump’s penchant for falsehoods, I imagine Meta’s previous policy would soon have proved financially and politically inconvenient.

    Regardless, the result is a populist’s dream: the demotion of formal expertise in favor of “common sense.”

    When asked whether he knew the members of a regional security alliance, defense secretary nominee Pete Hegseth was stumped.

    Common sense is ideological

    For the past two decades, the rise in social media, combined with declining trust in formal news organizations, has democratized knowledge: the sense that no one person or institution has special access to truth – not scholars with many degrees, not experts armed with scientific evidence or data, and definitely not journalists.

    In a 2020 study of public sentiment across 20 countries, Pew Research Center found that the overwhelming majority of those surveyed, 66%, reported trusting people with “practical experience” to solve problems over experts. Only 28% trusted the experts to solve problems.

    If institutions and experts are perceived as corrupt and ideological, the only truth that we can trust is what comes from our own eyes and our own minds.

    But does common sense bring us to truth? Sometimes, yes. It’s also appealing: Since our observations of the world are informed by our values and beliefs, we often see what we want – such as diversity-hiring initiatives known as “DEI” causing a plane crash, for example.

    And our intuition rarely tells us we’re wrong. This helps account for the existence of confirmation bias, which is our tendency to see and remember things that tell us we’re right. This is also why, even in those rare instances when facts change minds, they rarely change hearts. If we do update our knowledge with correct information, research has shown that our gut will still tell us our overall view of the world was right.

    Ironically, studies also show that the more a person trusts common sense, the more likely they are to be wrong.

    My research has shown that the people most likely to believe misinformation about COVID-19 and the 2020 election were those who placed more trust in intuition and emotion, and less trust in evidence and data. In addition, the more people liked Donald Trump, the more they valued intuition and emotion – and rejected evidence and data.

    So, common sense is ideological.

    When our pathway to knowledge is limited by our experiences and intuition, we’re not actually looking for truth. We’re happy with whatever answers are available, including conspiracy theories or explanations that make us feel good and right.

    We blame individuals – especially people we don’t like or identify with – for their own misfortune. We tend to think “those people should be better and try harder” instead of looking for public policy solutions to problems such as poverty or drug addiction. Without evidence and data summarizing large trends – such as cancer rates tracked through National Institutes of Health funding or ocean temperatures tracked by National Science Foundation funding – we are limited to what we can see through our own eyes and biases.

    And our limited observations merely reinforce our underlying beliefs: “My neighbor probably has breast cancer from taking that medicine I don’t like” or “Today is probably just a randomly hot day.” We’ll either overgeneralize from or downplay these limited examples depending on what our “common sense” says.

    So, when populists elevate common sense as a virtue, it’s not just to celebrate how regular people understand the world. It’s to promote a worldview that rejects verifiable facts, exaggerates our biases, and paves the way for even more propaganda to come.

    Dannagal G. Young was a co-investigator on an NIH grant that provided funding for one of the studies referenced in this piece.

    ref. How populist leaders like Trump use ‘common sense’ as an ideological weapon to undermine facts – https://theconversation.com/how-populist-leaders-like-trump-use-common-sense-as-an-ideological-weapon-to-undermine-facts-248608

    MIL OSI – Global Reports

  • MIL-OSI Asia-Pac: Provisional statistics of restaurant receipts and purchases for fourth quarter of 2024 and whole year of 2024

    Source: Hong Kong Government special administrative region

    Provisional statistics of restaurant receipts and purchases for fourth quarter of 2024 and whole year of 2024
    Provisional statistics of restaurant receipts and purchases for fourth quarter of 2024 and whole year of 2024
    ******************************************************************************************

         The Census and Statistics Department (C&SD) released the latest provisional figures on restaurant receipts and purchases today (February 6).           The value of total receipts of the restaurants sector in the fourth quarter of 2024, provisionally estimated at $27.6 billion, increased by 0.4% over a year earlier.  Over the same period, the provisional estimate of the value of total purchases by restaurants decreased by 2.5% to $8.9 billion.           After netting out the effect of price changes over the same period, the provisional estimate of the volume of total restaurant receipts decreased by 1.1% in the fourth quarter of 2024 compared with a year earlier.           Analysed by type of restaurant and comparing the fourth quarter of 2024 with the fourth quarter of 2023, total receipts of Chinese restaurants decreased by 3.6% in value and 5.3% in volume.  Total receipts of non-Chinese restaurants increased by 2.2% in value and 1.6% in volume.  Total receipts of fast food shops increased by 6.6% in value and 4.3% in volume.  Total receipts of bars decreased by 8.8% in value and 11.9% in volume.  As for miscellaneous eating and drinking places, total receipts decreased by 1.5% in value and 3.8% in volume.           Based on the seasonally adjusted series, the provisional estimate of total restaurant receipts increased by 3.0% in value and 2.5% in volume in the fourth quarter of 2024 compared with the preceding quarter.           For 2024 as a whole, the value of total receipts of the restaurants sector was provisionally estimated at $109.4 billion, decreased by 0.1% in value and 2.4% in volume compared with the whole year of 2023.  Over the same period, the provisional estimate of the value of total purchases of restaurants decreased by 1.9% to $35.1 billion.           Analysed by type of restaurant and comparing the whole year of 2024 with the whole year of 2023, total receipts of Chinese restaurants decreased by 4.3% in value and 6.7% in volume.  Total receipts of non-Chinese restaurants remained virtually unchanged in value, but decreased by 1.5% in volume.  Total receipts of fast food shops increased by 7.2% in value and 4.2% in volume.  Total receipts of bars decreased by 10.2% in value and 13.1% in volume.  As for miscellaneous eating and drinking places, total receipts increased by 1.4% in value, but decreased by 1.7% in volume.           To facilitate further understanding of the short-term business performance of the restaurants sector, statistics in respect of the restaurant receipts and purchases in individual months of the reference quarter are also compiled.           Analysed by month, it was provisionally estimated that the value of total receipts of the restaurants sector increased by 1.2%, increased by 0.7% and decreased by 0.5% respectively in October, November and December 2024, compared with the corresponding months in 2023.           After discounting the effect of price changes, it was provisionally estimated that the volume of total restaurant receipts decreased by 0.4%, 0.8% and 2.2% respectively in October, November and December 2024, compared with the corresponding months in 2023.      Commentary           A Government spokesman said that business of restaurants improved in the fourth quarter of 2024.  The value of total restaurant receipts resumed a year-on-year increase of 0.4%.  On a seasonally adjusted quarter-to-quarter comparison, it showed an accelerated increase of 3.0%.           Looking ahead, business of restaurants will continue to be supported by the various measures by the Central Government to boost the Mainland economy and benefit Hong Kong, the SAR Government’s proactive efforts to boost market sentiment and promote tourism, and increases in employment earnings, though the change in consumption patterns of residents and visitors should still affect business.      Further information           Table 1 presents the revised figures of restaurant receipts by type of restaurant and total purchases by the restaurants sector for the third quarter of 2024 as well as the provisional figures for the fourth quarter of 2024.           Table 2 and Table 3 present the revised value and volume indices respectively of restaurant receipts by type of restaurant for the third quarter of 2024 and the provisional indices for the fourth quarter of 2024.           Table 4 presents the year-on-year rate of change in total restaurant receipts in value and volume terms based on the original quarterly series, as well as the quarter-to-quarter rate of change based on the seasonally adjusted series.           The revised figures on restaurant receipts and purchases for the fourth quarter of 2024 (with breakdown by month) will be released through the website of C&SD (www.censtatd.gov.hk/en/scode540.html) and relevant publications of the Department from March 20, 2025.           The classification of restaurants follows the Hong Kong Standard Industrial Classification (HSIC) Version 2.0, which is used in various economic surveys for classifying economic units into different industry classes.           More detailed statistics are given in the “Report on Quarterly Survey of Restaurant Receipts and Purchases”.  Users can browse and download the publication at the website of the C&SD (www.censtatd.gov.hk/en/EIndexbySubject.html?pcode=B1080002&scode=540).           Users who have enquiries about the survey results may contact the Distribution Services Statistics Section of C&SD (Tel.: 3903 7401; e-mail: qsr@censtatd.gov.hk).

     
    Ends/Thursday, February 6, 2025Issued at HKT 16:30

    NNNN

    MIL OSI Asia Pacific News

  • MIL-OSI Asia-Pac: Import of poultry meat and products from Metropolitan City of Torino of Piemonte Region in Italy suspended

    Source: Hong Kong Government special administrative region

    Import of poultry meat and products from Metropolitan City of Torino of Piemonte Region in Italy suspended
    Import of poultry meat and products from Metropolitan City of Torino of Piemonte Region in Italy suspended
    ******************************************************************************************

         The Centre for Food Safety (CFS) of the Food and Environmental Hygiene Department announced today (February 6) that in view of a notification from the World Organisation for Animal Health (WOAH) about an outbreak of highly pathogenic H5N1 avian influenza in the Metropolitan City of Torino of the Piemonte Region in Italy, the CFS has instructed the trade to suspend the import of poultry meat and products (including poultry eggs) from the area with immediate effect to protect public health in Hong Kong.     A CFS spokesman said that according to the Census and Statistics Department, Hong Kong imported about 150 tonnes of frozen poultry meat and about 40 000 poultry eggs from Italy last year.     “The CFS has contacted the Italian authority over the issue and will closely monitor information issued by the WOAH and the relevant authorities on the avian influenza outbreak. Appropriate action will be taken in response to the development of the situation,” the spokesman said.

     
    Ends/Thursday, February 6, 2025Issued at HKT 16:20

    NNNN

    MIL OSI Asia Pacific News

  • MIL-OSI Economics: Derville Rowland: Innovation and technology in financial crime 

    Source: Bank for International Settlements

    Good afternoon, ladies and gentlemen. It is a pleasure to be with you today and to address a topic so crucial to the future of financial services: the utilisation of innovation and technology to conduct – and most importantly, combat – financial crime. 

    In the mid to late ’90s, when email truly took off as a global tool for commerce, I was a barrister working for the UK’s Crown Prosecution Service amongst others, dealing with various criminal cases including serious frauds. 

    Justified enthusiasm about the ability to connect the world more effectively and efficiently was subsequently dampened somewhat by use of the technology for all manner of deceptions, frauds and financial crimes. 

    Several decades later, we see the same pattern playing out in real-time with artificial intelligence, with criminals using AI tools to bypass customer due diligence controls and carry out fraud via social engineering. 

    These sophisticated methods, including the use of AI tools via text, images, and voice, present significant challenges for regulators and supervisors. 

    There’s a popular saying that the pessimist complains about the wind, the optimist expects it to change, but the realist adjusts the sails. 

    As a regulator with hard-won experience of developing frameworks, building the teams to implement them, and deploying technology to combat financial crime and address misconduct, I’m very much a realist – albeit one who remains stubbornly optimistic. I don’t believe it’s an either/or scenario.  

    Put simply, I believe in the potential benefits of innovation and technology for consumers, investors, businesses and society – and want to see them realised. But this also means the risks must be effectively managed – we must, as it were, adjust the sails. 

    The importance of collective responses

    The risks, of course, need no explanation to this audience. The anonymity of virtual assets can be used to transfer illicit funds quickly and across borders, with criminals increasingly leveraging new technologies to commit fraud, launder the proceeds of crime, and carry out financing of terrorism. The speed at which funds can be moved across borders makes it easier for criminals to exploit the financial system. And so on. 

    Last month, the Central Bank of Ireland published statistics showing the value of fraud in payments in Ireland increased by a quarter in 2023 compared to 2022 – from €100m to circa €126m.1 Fraud was highest in credit transfers and card payments, with the biggest growth seen in money remittance. 

    This echoes trends across Europe, with a joint EBA/ECB report in August 2024 revealing that fraud losses are highest in credit transfer and card payments across the European Economic Area (EEA).2

    Financial crime, of course, recognises no borders. And so, given the scale of the challenge which regulators and law enforcement agencies face, collective action – a harmonised response – is imperative. 

    Which is why the EU’s AML package is so important – it provides the framework and the agency (AMLA) through which we will collectively meet the challenge head on. 

    The AML package is by design technology neutral.  It applies to traditional banking/financial models equally as it applies to crypto-asset service providers (CASPs), crowd-funding platforms and intermediaries. It obliges all types of firms that come within its ambit to comply with a set of AML/CFT rules that have now been harmonised across Europe.  

    How these firms comply with the rules is up to them, via traditional AML/CFT compliance programmes or by using regtech tools. What’s essential is that the means used are effective, and that such effectiveness can be demonstrated to supervisors. 

    This will be the case both for the 40 obliged entities that will be directly supervised by AMLA and the firms supervised by national AML authorities.3  

    Not waiting for the wind to change, the EU has addressed a number of emerging risks in the package. 

    To give some examples, the use of AI is acknowledged under the package, with an obligation on firms to ensure that human oversight is applied to decisions proposed by AI tools that may impact customers in certain areas.

    Additionally, details of Virtual IBANs which are linked to other payment accounts will have to be recorded in member states’ Bank Account Registers. This will allow law enforcement to trace any funds being moved by such Virtual IBANs.  

    Finally, the package introduces the concept of Information Sharing Partnerships. Through these, credit and financial institutions will be enabled to share information relating to high risk customers, subject to important guardrails including data protection assessments.  

    The lack of an ability to share such information has long been pointed to as a real weak link in the system, which could allow someone who had an account closed by one bank on ML/TF grounds to seek to open an account in another.  

    It is hoped that these partnerships will be a real game-changer in the fight to keep bad actors from accessing the financial system in order to launder ill-gotten gains. Tech solutions, including tools which can allow information to be shared between financial institutions in a manner that complies with GDPR, will be essential here.

    The package is also forward-looking in respect of sanctions. 

    Russia’s illegal war against Ukraine exposed some fault lines in the EU’s Financial Sanctions Framework. The package seeks to remedy this by imposing obligations on obliged entities to put in place frameworks to prevent and detect attempted breaches of EU financial sanctions. 

    It also requires obliged entities to ensure that prospective customers, and any person who owns or controls such prospective customers, are screened against the financial sanctions list prior to onboarding. Here again, we see the importance of effective technological solutions – the use of screening tools will be imperative for firms seeking to protect themselves from the possibility of breaching sanctions.

    Developing a wider approach to preventing financial crime

    Money laundering pre-supposes a predicate crime which has generated assets for a criminal. Looking more widely across the landscape, more work is required to put in place a comprehensive financial crime preventative framework that includes fraud.   

    The EU and member states have started thinking about fraud and money laundering more holistically, rather than two silos to be tackled independently. This is very welcome. 

    For our part, the Central Bank of Ireland is approaching AML, fraud, and sanctions through the lens of financial integrity of the system. We are building out a more integrated supervisory framework to look at risk in a more holistic way. We want to take a whole-of-sector, rather than piecemeal, approach, and so very much support emerging EU thinking in this area. 

    As a single market and economic and political union, the EU can point to work already under way and leverage further opportunities to confront the challenges involved. 

    Already, there are a number of other important EU developments aimed at protecting the financial integrity of the system and the citizens who depend on it. 

    PSD3 and the Payment Services Regulation will strengthen customer authentication rules and extending refund rights of consumers who have fallen victim to fraud, among other measures. 

    The EU’s Markets in Crypto Assets Regulation (MiCAR) includes rules relating to the information to be made available to prospective investors in crypto assets, partly in response to the proliferation of scams involving crypto asset issuance. 

    The amended Fund Transfer Regulation ensures that transfers of crypto assets by CASPs must now be accompanied by information on the sender and recipient, in the same way that credit transfers between banks must be.  

    The Instant Payments Regulation (IPR) obliges providers of standard and instant credit transfers to verify the payee at no additional charge to the payer. It also obliges PSPs offering instant credit transfers to screen their customer base against targeted financial sanctions lists at least daily. 

    The various regulatory and policy developments to tackle financial crime cannot succeed in isolation. For this reason, supervisors have been on a steady march away from reliance on traditional supervisory tools and are increasingly exploring ways to transform technology from an enabler of financial crime to a tool in the detection, disruption and successful prosecution of financial crime. 

    In that context, I’d like to mention a significant milestone in the Central Bank of Ireland’s innovation journey – the launch of our Innovation Sandbox Programme last December on the specific theme of Combatting Financial Crime. 

    About the sandbox

    This initiative offers a structured environment for firms to develop innovative solutions in a collaborative environment, ensuring that new technologies are introduced safely and effectively into the financial sector.

    The seven participants in the programme are employing new technologies and innovative methods to develop solutions that tackle financial crime, for the benefit of both the financial system and consumers.

    Participants are representative of a diverse spectrum of innovators from Ireland, across Europe and the UK and feature start-ups, scaling firms, partnerships and established financial services firms.

    Although it is still at an early stage in the programme, several key areas of focus have been identified such as:

    • The use of AI, machine learning, and pattern recognition to detect and prevent fraud; and
    • The use of technology to enable data sharing without compromising sensitive information, allowing real-time verification of identities and other credentials while ensuring full compliance with data protection regulations and the development of digital identity verification tools.

    The Central Bank is organising workshops for participating firms on specific topics relevant to theme of combating financial crime, facilitating bespoke engagement with dedicated relationship managers, and providing access to a data platform offering data sets and tools relevant to the theme. This will allow participants to test and develop their innovation. 

    We are hugely excited about the programme and look forward to sharing the results of it in due course. 

    Conclusion

    In conclusion, I was greatly struck by something Elizabeth McCaul of the ECB Supervisory Board previously said: “Technology is fundamentally a human activity- technology is neither good nor bad, but humans make it so.” 4 

    The reality is that no piece of legislation can contemplate every financial crime risk or typology or close every loophole. We can’t wipe out financial crime – any more than we can wipe out car theft, shoplifting or burglary. But what we can do is to become as effective as possible at reducing its impact.

    Hence, as technology evolves, it behoves regulators and supervisors to evolve too – continually adapting to keep pace with these changes and ensure that, collectively and individually, we are the forefront of protecting the integrity of the financial system and those who use it. 

    Thank you.

    MIL OSI Economics

  • MIL-OSI Europe: Written question – Importance of a pro-birth policy in Europe and lack of statistics on the number of children born to non-EU parents – E-000310/2025

    Source: European Parliament

    Question for written answer  E-000310/2025
    to the Commission
    Rule 144
    Mathilde Androuët (PfE)

    In a written question[1], we highlighted the need for an ambitious family policy to enable Europe’s population to recover, as advocated by the European Economic and Social Council as far back as 2007. In his answer, former Commissioner Mr Schmit stated that ‘having children is a matter of individual choice’ and that ‘the Commission supports Member States in creating favourable social and economic conditions’, also referring to the use of ‘migration’[2]. These are all ‘tools’ in the demography toolbox mentioned by Ms von der Leyen in her State of the Union address[3] and political guidelines for 2024-2029. The Commission is expected to make a statement on this issue in the near future[4].

    • 1.Having children is indeed a personal choice, but why should it not be supported by an established European pro-birth policy? Why is the Commission refusing to use this term?
    • 2.Eurostat does not provide specific aggregated data on the proportion of children born in the EU to non-EU parents. Would the Commission consider it useful for us to have access to this benchmarking tool?

    Submitted: 23.1.2025

    • [1] E-001728/2024.
    • [2] E-001728/2024(ASW).
    • [3] 2023 State of the Union address by President Ursula von der Leyen, European Commission, 13 September 2023. Europe’s Choice – Political Guidelines for the next European Commission 2024-2029, 18 July 2024.
    • [4] Commission’s priorities, 18 July 2024, https://commission.europa.eu/priorities-2024-2029_en.
    Last updated: 6 February 2025

    MIL OSI Europe News

  • MIL-OSI Africa: Female genital mutilation is a leading cause of death for girls where it’s practised – new study

    Source: The Conversation – Africa – By Heather D. Flowe, Professor of Psychology, University of Birmingham

    Female genital mutilation or cutting (FGM/C) is a deeply entrenched cultural practice that affects around 200 million women and girls. It’s practised in at least 25 African countries, as well as parts of the Middle East and Asia and among immigrant populations globally.

    It is a harmful traditional practice that involves removing or damaging female genital tissue. Often it’s “justified” by cultural beliefs about controlling female sexuality and marriageability. FGM/C causes immediate and lifelong physical and psychological harm to girls and women, including severe pain, complications during childbirth, infections and trauma.

    We brought together our expertise in economics and gender based violence to examine excess mortality (avoidable deaths) due to FGM/C. Our new research now reveals a devastating reality: FGM/C is one of the leading causes of death for girls and young women in countries where it’s practised. FGM/C can result in death from severe bleeding, infection, shock, or obstructed labour.

    Our study estimates that it causes approximately 44,000 deaths each year across the 15 countries we examined. That is equivalent to a young woman or girl every 12 minutes.

    This makes it a more significant cause of death in the countries studied than any other excluding infection, malaria and respiratory infections or tuberculosis. Put differently, it is a bigger cause of death than HIV/Aids, measles, meningitis and many other well-known health threats for young women and girls in these countries.

    Prior research has shown that FGM/C leads to severe pain, bleeding and infection. But tracking deaths directly caused by the practice has been nearly impossible. This is partly because FGM/C is illegal in many countries where it occurs, and it typically takes place in non-clinical settings without medical supervision.

    Where the crisis is most severe

    The practice is particularly prevalent in several African nations. In Guinea, our data show 97% of women and girls have undergone FGM/C, while in Mali the figure stands at 83%, and in Sierra Leone, 90%. The high prevalence rates in Egypt, with 87% of women and girls affected, are a reminder that FGM/C is not confined to sub-Saharan Africa.

    For our study, we analysed data from the 15 African countries for which comprehensive “gold standard” FGM/C incidence information is available. Meaning, the data is comprehensive, reliable and widely accepted for research, policymaking and advocacy efforts to combat FGM/C.

    We developed a new approach to help overcome previous gaps in data. We matched data on the proportion of girls subjected to FGM/C at different ages with age-specific mortality rates across 15 countries between 1990 and 2020. The age at which FGM occurs varies significantly by country. In Nigeria, 93% of procedures are performed on girls younger than five years old. In contrast, in Sierra Leone, most girls undergo the procedure between the ages of 10 and 14.

    Since health conditions vary from place to place and over time, and vary in the same place from one year to the next, we made sure to consider these differences. This helped us figure out if more girls were dying at the ages when FGM/C usually happens in each country.

    For example, in Chad, 11.2% of girls undergo FGM/C aged 0-4, 57.2% at 5-9 and 30% at 10-14. We could see how mortality rates changed between these age groups compared to countries with different FGM patterns.

    This careful statistical approach helped us identify the excess deaths associated with the practice while accounting for other factors that might affect child mortality.

    Striking findings

    Our analysis revealed that when the proportion of girls subjected to FGM in a particular age group increases by 50 percentage points, their mortality rate rises by 0.1 percentage points. While this may sound small, when applied across the population of affected countries, it translates to tens of thousands of preventable deaths annually.

    The scale is staggering: while armed conflicts in Africa caused approximately 48,000 combat deaths per year between 1995 and 2015, our research suggests FGM/C leads to about 44,000 deaths annually. This places FGM among the most serious public health challenges facing these nations.

    Beyond the numbers

    These statistics represent real lives cut short. Most FGM/C procedures are performed without anaesthesia, proper medical supervision, or sterile equipment. The resulting complications can include severe bleeding, infection and shock. Even when not immediately fatal, the practice can lead to long-term health problems and increased risks during childbirth.

    The impact extends beyond physical health. Survivors often face psychological trauma and social challenges. In many communities, FGM/C is deeply embedded in cultural practices and tied to marriage prospects, making it difficult for families to resist the pressure to continue the tradition.

    Urgent crisis

    FGM/C is not just a human rights violation – it’s a public health crisis demanding urgent attention. While progress has been made in some areas, with some communities abandoning the practice, our research suggests that current efforts to combat FGM/C need to be dramatically scaled up.

    The COVID-19 pandemic has potentially worsened the situation, owing to broader impacts of the pandemic on societies, economies and healthcare systems. The UN estimates that the pandemic may have led to 2 million additional cases of FGM/C that could have been prevented. Based on our mortality estimates, this could result in approximately 4,000 additional deaths in the 15 countries we studied.

    The way forward

    Ending FGM/C requires a multi-faceted approach. Legal reforms are crucial – the practice remains legal in five of the 28 countries where it’s most commonly practised. However, laws alone aren’t enough. Community engagement, education, and support for grassroots organisations are essential for changing deeply held cultural beliefs and practices.

    Previous research has shown that information campaigns and community-led initiatives can be effective. For instance, studies have documented reductions in FGM/C rates following increased social media reach in Egypt and the use of educational films showing different views on FGM/C.

    Most importantly, any solution must involve the communities where FGM/C is practised. Our research underscores that this isn’t just about changing traditions – it’s about saving lives. Every year of delay means tens of thousands more preventable deaths.

    Our findings suggest that ending FGM/C should be considered as urgent a priority as combating major infectious diseases. The lives of millions of girls and young women depend on it.

    – Female genital mutilation is a leading cause of death for girls where it’s practised – new study
    – https://theconversation.com/female-genital-mutilation-is-a-leading-cause-of-death-for-girls-where-its-practised-new-study-249171

    MIL OSI Africa

  • MIL-OSI Global: Female genital mutilation is a leading cause of death for girls where it’s practised – new study

    Source: The Conversation – Africa – By Heather D. Flowe, Professor of Psychology, University of Birmingham

    Female genital mutilation or cutting (FGM/C) is a deeply entrenched cultural practice that affects around 200 million women and girls. It’s practised in at least 25 African countries, as well as parts of the Middle East and Asia and among immigrant populations globally.

    It is a harmful traditional practice that involves removing or damaging female genital tissue. Often it’s “justified” by cultural beliefs about controlling female sexuality and marriageability. FGM/C causes immediate and lifelong physical and psychological harm to girls and women, including severe pain, complications during childbirth, infections and trauma.

    We brought together our expertise in economics and gender based violence to examine excess mortality (avoidable deaths) due to FGM/C. Our new research now reveals a devastating reality: FGM/C is one of the leading causes of death for girls and young women in countries where it’s practised. FGM/C can result in death from severe bleeding, infection, shock, or obstructed labour.

    Our study estimates that it causes approximately 44,000 deaths each year across the 15 countries we examined. That is equivalent to a young woman or girl every 12 minutes.

    This makes it a more significant cause of death in the countries studied than any other excluding infection, malaria and respiratory infections or tuberculosis. Put differently, it is a bigger cause of death than HIV/Aids, measles, meningitis and many other well-known health threats for young women and girls in these countries.

    Prior research has shown that FGM/C leads to severe pain, bleeding and infection. But tracking deaths directly caused by the practice has been nearly impossible. This is partly because FGM/C is illegal in many countries where it occurs, and it typically takes place in non-clinical settings without medical supervision.

    Where the crisis is most severe

    The practice is particularly prevalent in several African nations.
    In Guinea, our data show 97% of women and girls have undergone FGM/C, while in Mali the figure stands at 83%, and in Sierra Leone, 90%. The high prevalence rates in Egypt, with 87% of women and girls affected, are a reminder that FGM/C is not confined to sub-Saharan Africa.

    For our study, we analysed data from the 15 African countries for which comprehensive “gold standard” FGM/C incidence information is available. Meaning, the data is comprehensive, reliable and widely accepted for research, policymaking and advocacy efforts to combat FGM/C.

    We developed a new approach to help overcome previous gaps in data. We matched data on the proportion of girls subjected to FGM/C at different ages with age-specific mortality rates across 15 countries between 1990 and 2020. The age at which FGM occurs varies significantly by country. In Nigeria, 93% of procedures are performed on girls younger than five years old. In contrast, in Sierra Leone, most girls undergo the procedure between the ages of 10 and 14.

    Since health conditions vary from place to place and over time, and vary in the same place from one year to the next, we made sure to consider these differences. This helped us figure out if more girls were dying at the ages when FGM/C usually happens in each country.

    For example, in Chad, 11.2% of girls undergo FGM/C aged 0-4, 57.2% at 5-9 and 30% at 10-14. We could see how mortality rates changed between these age groups compared to countries with different FGM patterns.

    This careful statistical approach helped us identify the excess deaths associated with the practice while accounting for other factors that might affect child mortality.

    Striking findings

    Our analysis revealed that when the proportion of girls subjected to FGM in a particular age group increases by 50 percentage points, their mortality rate rises by 0.1 percentage points. While this may sound small, when applied across the population of affected countries, it translates to tens of thousands of preventable deaths annually.

    The scale is staggering: while armed conflicts in Africa caused approximately 48,000 combat deaths per year between 1995 and 2015, our research suggests FGM/C leads to about 44,000 deaths annually. This places FGM among the most serious public health challenges facing these nations.

    Beyond the numbers

    These statistics represent real lives cut short. Most FGM/C procedures are performed without anaesthesia, proper medical supervision, or sterile equipment. The resulting complications can include severe bleeding, infection and shock. Even when not immediately fatal, the practice can lead to long-term health problems and increased risks during childbirth.

    The impact extends beyond physical health. Survivors often face psychological trauma and social challenges. In many communities, FGM/C is deeply embedded in cultural practices and tied to marriage prospects, making it difficult for families to resist the pressure to continue the tradition.

    Urgent crisis

    FGM/C is not just a human rights violation – it’s a public health crisis demanding urgent attention. While progress has been made in some areas, with some communities abandoning the practice, our research suggests that current efforts to combat FGM/C need to be dramatically scaled up.

    The COVID-19 pandemic has potentially worsened the situation, owing to broader impacts of the pandemic on societies, economies and healthcare systems. The UN estimates that the pandemic may have led to 2 million additional cases of FGM/C that could have been prevented. Based on our mortality estimates, this could result in approximately 4,000 additional deaths in the 15 countries we studied.

    The way forward

    Ending FGM/C requires a multi-faceted approach. Legal reforms are crucial – the practice remains legal in five of the 28 countries where it’s most commonly practised. However, laws alone aren’t enough. Community engagement, education, and support for grassroots organisations are essential for changing deeply held cultural beliefs and practices.

    Previous research has shown that information campaigns and community-led initiatives can be effective. For instance, studies have documented reductions in FGM/C rates following increased social media reach in Egypt and the use of educational films showing different views on FGM/C.

    Most importantly, any solution must involve the communities where FGM/C is practised. Our research underscores that this isn’t just about changing traditions – it’s about saving lives. Every year of delay means tens of thousands more preventable deaths.

    Our findings suggest that ending FGM/C should be considered as urgent a priority as combating major infectious diseases. The lives of millions of girls and young women depend on it.

    The authors do not work for, consult, own shares in or receive funding from any company or organisation that would benefit from this article, and have disclosed no relevant affiliations beyond their academic appointment.

    ref. Female genital mutilation is a leading cause of death for girls where it’s practised – new study – https://theconversation.com/female-genital-mutilation-is-a-leading-cause-of-death-for-girls-where-its-practised-new-study-249171

    MIL OSI – Global Reports

  • MIL-OSI Australia: Address to OECD International Workshop on Rigorous Impact Evaluation Approaches including Randomised Controlled Trials

    Source: Australian Treasurer

    As is customary in Australia, I acknowledge the Ngunnawal people, on whose lands I am recording these remarks, and all First Nations people joining this international workshop.

    Thank you to our OECD Public Management and budgeting colleagues, Jon Blondal, Andrew Blazey and the team for helping to coordinate this event and offering me the opportunity to provide this opening address. This event is being run by the OECD in collaboration with the Australian Centre for Evaluation in the Department of the Treasury. The Australian Government is delighted to be contributing to global efforts to advocate for better evidence. And we are keen to connect with international endeavours that promote its generation, synthesis and sharing in public policy.

    Today, I want to discuss how countries can collaborate to better create and use evidence. This is a substantial reform. Indeed, I argue that randomised trials and better use of evidence isn’t just another worthy public policy tweak. It’s bigger than that. Much bigger. Effectively using evidence to make policy decisions is a public administration reform on par with the biggest changes in good government that humanity has put into place. It is the seventh phase of good government.

    Let’s take a quick moment to run through the major milestones in the history of public administration.

    Six big reforms in the history of public administration

    Throughout history, there have been 6 big reforms in public administration.

    The first was the rise of bureaucracy and professionalised governance. It was during the 18th and 19th centuries that public administration shifted from patronage and informal systems to emphasising impartiality, specialisation, and accountability. Democratic institutions and a robust civil society provided the conditions for an independent and accountable civil service.

    The second big reform occurred in the early 20th century. The efficiency revolution – scientific management of public administration that focused on efficiency and rational organisation – was inspired by industrial principles.

    In response to economic crises and post‑WWII recovery, we saw the rise of the third big reform – the welfare state and the expansion of government responsibilities in social welfare, healthcare and economic planning.

    The fourth big reform in public administration in the late 20th century was market‑oriented governance. We saw governments adopt private‑sector practices like outsourcing, performance metrics, and competition.

    Concerns about accountability also carried through to the fifth big historic reform – the era of digital transformation and e‑governance. The early 21st century saw technology revolutionise public administration. It enabled data‑driven decision‑making and citizen engagement.

    Building on the lessons learnt during the digital transformation, the past decade has seen the move towards adaptive governance – the sixth big reform in public administration. Top‑down processes were swapped out for more flexible, collaborative and cross‑sector approaches that embrace ‘long‑term systems thinking’ to address interconnected crises such as climate change (Brunner and Lynch 2017).

    Each of these 6 big reforms from the past 3 centuries has helped to reshape government and improve citizens’ lives.

    The seventh big reform in public administration: randomised trials

    Today I want to argue that we are on the cusp of a seventh big reform in public administration.

    It will involve the widespread adoption of randomised trials as a means of testing policies by providing a counterfactual.

    This reform should include the synthesis of quality evidence about what works, and what doesn’t, to provide public administrators with irrefutable knowledge that can improve people’s lives.

    Let’s consider a couple of examples to see how this might work in practice.

    Eye care is often a neglected field of public health in developing economies.

    In rural Bangladesh, a randomised trial of providing free reading glasses involved more than 800 adults with jobs requiring close attention to detail, such as tea pickers, weavers, and seamstresses (Jacobs 2024). The study found that when workers were given free reading glasses, they earned 33 per cent more than those who were not given glasses (Sehrin et al. 2024).

    Speaking to The New York Times, Dr Nathan Congdon, one of the authors of the study findings, said that ‘…what makes the results especially exciting is the potential to convince governments that vision care interventions are as inexpensive, cost‑effective and life‑changing as anything else that we can offer in healthcare’ (Jacobs 2024).

    As well as garnering evidence on what does work, the widespread adoption of randomised trials must also include quality evidence about what doesn’t work.

    In 2014, the US state of Massachusetts launched a 4‑year intervention program called the Juvenile Justice Pay for Success Initiative (Patrick DL 2014). The program aimed to reduce recidivism and improve employment outcomes in young men who were at high risk of re‑offending (Third Sector 2024).

    The initiative involved an experimental financial contract called ‘Pay For Success’ – also known as a social impact bond. Funders assumed the US$27 million up‑front financial risk. And the government would only refund the cost of the program if a third‑party evaluator and validator determined that the initiative achieved a reduction in the number of days the young men spent in jail, and improvements in their employment and job readiness (Patrick DL 2014).

    At the end of the 4‑year program, a randomised trial found no discernible effects on reincarceration or employment (Coalition for Evidence‑Based Policy 2025). Neither the recidivism nor employment outcomes were sizable enough to trigger the repayment under the pay‑for‑success contract (Roca et al. 2025).

    Why randomised trials should be prioritised over other forms of evaluation

    When the evaluation of a social program does not produce the hoped‑for results, it’s difficult to avoid feelings of disappointment.

    But this has been the reality for some time.

    We know from the history of large, well‑conducted randomised trial evaluations that only a small percentage find that the intervention being evaluated produces a meaningful improvement over the status quo.

    As Peter Rossi attested in his 1987 Iron Law of Evaluation, ‘The expected value of any net impact assessment of any large‑scale social program is zero’ (Arnold Ventures 2018a).

    But here’s the light on the hill.

    The ‘iron law’ applies to most fields of research. That includes medicine, where 50–80 per cent of positive results from initial clinical studies are overturned by a subsequent randomised trial (Arnold Ventures 2018a).

    In medicine, the move towards randomised trials continues to save lives and stop unnecessary interventions.

    For every new treatment such as AIDS drugs, the HPV vaccine and genetic testing – medicine has discarded old ones, like bloodletting, gastric freezing and tonsillectomy (Leigh 2018).

    The willingness to test cures against placebos, or the best available alternative, is how we make progress. In public policy, we can do the same. If it works, we use it; if not, it’s back to the lab.

    The central goal of evaluation: finding interventions that work

    The key is having a big, ambitious goal to strive towards.

    I propose the primary goal of government evaluation should be to find interventions that work.

    More specifically – to build a body of programs backed by strong, replicated randomised trial evidence of important, lasting improvements in people’s lives.

    In other words, evidence that provides policymakers with confidence that if another jurisdiction were to implement the program faithfully in a similar population, it would improve people’s lives in a meaningful way.

    Imagine being able to confidently draw from a codified body of social programs and interventions that your jurisdiction could test, deploy and regulate.

    In the United States, the Coalition for Evidence‑Based Policy points towards Saga Education, a high‑dosage mathematics tutoring program for year 9 and 10 students in low‑income US schools that underwent 3 rigorous randomised trials. This program produced sizable, statistically significant effects on students’ maths scores on the district tests at the end of the tutoring year (Arnold Ventures 2024a). I’ll come back to this program a bit later.

    Similarly, the Coalition for Evidence‑Based Policy points to 2 job‑training programs for low‑income adults that were both shown to increase long‑term earnings by 20 to 40 per cent. These programs focused on the fast‑growing IT and financial services sectors, where jobs are well paid, and employees are in high demand (Arnold Ventures 2022a and 2022b).

    Finding interventions that work should be evaluators’ central goal. It is the only plausible path by which rigorous evaluations will improve the human condition. If we don’t allocate spending based on rigorous evidence, it is hard to see how governments can make progress on critical social problems.

    Here in Australia, a think tank study examined a sample of 20 Australian Government programs conducted between 2015 and 2022 (Winzar et al. 2023).

    Their report concluded that 95 per cent of the programs, which had a total expenditure of over A$200 billion, were not properly evaluated. And its analysis of Australian state and territory government evaluations reported similar results.

    The researchers noted that the problems with evaluation started from the outset of program and policy design. They also estimated that fewer than 1.5 per cent of government evaluations use a randomised design (Winzar et al. 2023).

    This finding echoes the Australian Productivity Commission’s 2020 report into the evaluation of Indigenous programs (Productivity Commission 2020).

    This report concluded that ‘both the quality and usefulness of evaluations of policies and programs affecting Aboriginal and Torres Strait Islander people are lacking’, and that ‘Evaluation is often an afterthought rather than built into policy design’ (Productivity Commission 2020).

    Finding what works: using strong signals from prior research

    If we accept that the central goal of evaluation is to find interventions that work, there are important implications for researchers and research funders.

    It means that it makes sense to evaluate an intervention, using a large randomised trial, only if there is a strong signal in prior research.

    Examples of prior research could include a pilot randomised trial, a high‑quality quasi‑experiment, or a randomised trial of a related program.

    This is the approach that Arnold Ventures is taking in the US via the Coalition for Evidence‑Based Policy, the US nonprofit relaunched under the leadership of Jon Baron (Coalition for Evidence‑Based Policy n.d.).

    Rigorous testing enabled Arnold Ventures to create a growing body of proven interventions in education and training (Coalition for Evidence‑Based Policy n.d.). It’s an approach also being used by the US Department of Education in its Investing in Innovation Fund, which was recently renamed the Education Innovation and Research Program. It has yielded a much higher success rate in identifying interventions with true effectiveness. In 2019, robust evidence standards used by the Fund (as it was at the time) resulted in positive impacts for 40 to 50 per cent of its larger grants.

    Compare this to the US Department of Health and Human Services’ Teen Pregnancy Prevention Program, which had a much lower hit rate of success – just 17 per cent – for its larger grants (Arnold Ventures 2019).

    Arnold Ventures (2018b) proposes a strategy for policy and researchers that involves 3 tiers of evidence – top, middle and low.

    Expand the implementation of programs backed by strong (‘top tier’) evidence of sizable, sustained effects on important life outcomes.

    Fund and/or conduct rigorous evaluations of programs backed by highly promising (‘middle tier’) evidence, to hopefully move them into the top tier.

    Build the pipeline of promising programs through modest investments in the development and initial testing of many diverse approaches (as part of a ‘lower tier’).

    This is about systematising our use of evidence: a familiar approach in medicine, but one that has not been standard practice for all policymakers.

    It is about producing tangible proof that randomised policy trials improve lives, in that way that we already have tangible proof that randomised medical trials save lives.

    As a specific example of this kind of approach, in the US state of Maryland, a partnership between Arnold Ventures and the state government is already scaling‑up proven programs.

    In August last year, the high‑dosage maths tutoring program for 9th and 10th graders I mentioned earlier (Saga Education) and ASSISTments – an educational tool for mathematics – received scale‑up funding under the US$20 million Maryland Partnership for Proven Programs with Arnold Ventures (Arnold Ventures 2024b).

    In the UK, the development of the What Works Network is a world‑leading achievement which owes credit to the network of evidence‑based policymakers. That includes the extraordinary David Halpern, who will be speaking on the panel shortly (for an excellent snapshot of his recommendations for the coming decade, see Halpern 2023).

    Across health and housing, education and employment, hundreds of UK randomised trials have been conducted. For a practitioner, policymaker or curious member of the British public, it is now easier than ever to see what we know, and what we do not (Leigh 2024a).

    For example, the Education Endowment Foundation has run literally hundreds of randomised trials in the education sector. It uses these findings, alongside rigorous evaluations conducted outside the UK, to advocate for evidence‑based education policies (Education Endowment Foundation n.d.).

    The Education Endowment Foundation has commissioned 316 research projects (208 of which are randomised trials). Sixty per cent of schools in England have taken part in a randomised trial funded by the Foundation. Seventy per cent of school leaders use the Education Endowment Foundation’s teaching and learning toolkit when making their funding decisions on spending for pupils from disadvantaged backgrounds.

    Here in Australia, we are committed to taking a stronger approach towards evidence‑based policymaking.

    In July 2023 we established the Australian Centre for Evaluation in the Department of the Treasury.

    The main role of the centre is to collaborate with other Australian Government departments to conduct rigorous evaluations, including randomised trials. Such agreements have already been forged with federal agencies responsible for employment, health, education and social services.

    Led by Eleanor Williams, armed with a modest budget of A$2 million per year and just over a dozen staff, the Centre operates on smarts and gentle persuasion, not mandates or orders (Leigh 2024b).

    No agency is forced to use the services of the Australian Centre for Evaluation, but all are encouraged to do so. This reflects the reality that evaluation, unlike audit, isn’t something that can be done as an afterthought. A high‑quality impact evaluation needs to be built into the design of a program from the outset (Leigh 2024b).

    The centre takes an active role in considering aspects that are relevant to all evaluations, such as rigorous ethical review and access to administrative microdata. The Australian Bureau of Statistics is playing a pivotal role in brokering access to administrative data for policy experiments.

    Collaboration with evaluation researchers outside of government is critical, too. Thanks to a joint initiative by the Centre and the Australian Education Research Organisation, we now have the Impact Evaluation Practitioners Network, which is bringing together government and external impact evaluators.

    The centre has several randomised trials currently underway, and I await the results with interest.

    In the next month, the centre will release a Randomised Controlled Trial Showcase Report, featuring examples of public policy‑related trials in Australia.

    Another organisation doing extraordinarily thorough research across the whole of social policy and the social sciences is the nonprofit Campbell Collaboration.

    For example, the Campbell Countering Violent Extremism evidence synthesis program is a global research initiative that is attracting attention here in Australia. The program originated from a 5‑country partnership of Australia, Canada, New Zealand, the UK and the US (Campbell Collaboration n.d.). Professor Lorraine Mazerolle from the University of Queensland is one of the principal investigators on the program (Campbell Collaboration n.d.).

    Creating an experimenting society

    Bringing a ‘what works’ philosophy to social policy is vital to helping the most vulnerable.

    And it is by no means a new idea. It follows the path forged by the prominent social scientist Donald Campbell.

    He is of course, the ‘Campbell’ in the Campbell Collaboration, which was named after him to honour his substantial contributions to social science and methodology.

    Over 50 years ago, Dr Campbell wrote Methods for the Experimenting Society, outlining his vision for helping governments to produce better‑informed policies and social interventions via research and evaluation (Campbell 1991).[1]

    In this paper, Campbell forewarns policymakers of the ‘over‑advocacy trap’, where advocates of a new social program or policy make exaggerated claims about its effectiveness in order to get it adopted (Campbell 1991). He effectively highlights the tension between the need for strong advocacy to get social programs funded and adopted, and the need for rigorous evaluation to determine their true effectiveness (Campbell 1991).

    Thirty years after Dr Campbell wrote Methods for the Experimenting Society, the US Department of Education was allocating over a billion US dollars each year to an after‑school program called the 21st Century Community Learning Center initiative.

    The program, which was initiated in 1998, saw children attending the centres for up to 4 hours of after‑school programs, where they partook in everything from tutoring to drama to sports. It attracted high‑profile advocates, including the former Californian governor and Mr Universe, Arnold Schwarzenegger.

    It’s no wonder then, that a randomised trial by Mathematica in 2003 startled everyone with its findings (Haskins 2009). Attending the after‑school program raised a child’s likelihood of being suspended from school (Leigh 2018). And there was no evidence that the after‑school program improved academic outcomes.

    The program’s prominent advocates had fallen head‑first into the over‑advocacy trap.

    Overcoming denial with collaboration and momentum

    American political scientist Ron Haskins commented on how easy it was for Schwarzenegger to flex his celebrity muscle to overcome a negative evaluation. ‘The lesson here, yet again, is that good evidence does not speak for itself in the policy process and is only one – sometimes a rather puny – element in a policy debate’ (Haskins 2009).

    Overcoming denial in the face of irrefutable evidence requires continuous collaboration and sustained momentum. In 2025 and beyond, we will need both to reach the tipping point on the widespread use of rigorous impact evaluation across public policy. It will be harder to run roughshod over good evidence if OECD nations continue to collaborate – both internally with non‑profit researchers outside of government, and externally with other nations.

    Philanthropic foundations in the UK, US and other OECD nations have a strong track record in supporting randomised policy trials. Initiatives such as the Maryland Partnership for Proven Programs and Arnold Ventures, which I mentioned earlier, demonstrate that the ‘what works’ philosophy in social policy is gaining traction.

    Here in Australia, the Paul Ramsay Foundation launched a A$2.1 million open grant round in 2024. Its structure is similar to a successful model that the Laura and John Arnold Foundation has deployed in the United States over the past decade (Leigh 2024c).

    The grants, which last for 3 years and are valued at up to A$300,000 each, will support up to 7 experimental evaluations conducted by non‑profits with a social impact mission. For example, improving education outcomes for young people with disabilities, reducing domestic and family violence, or helping jobless people find work (Paul Ramsay Foundation 2024).

    The Australian Centre for Evaluation supported the open grant round, and is helping to connect grantees with administrative data relevant to the evaluation, and I am excited to see what we learn from these studies (Leigh 2024b).

    One of the most appealing advantages of well‑conducted randomised trials is that they resonate well with 3 democratic principles: non‑arbitrariness, revisability and public justification (Tanasoca and Leigh 2023).

    This gives us good democratic reasons to seek out such evidence for policymaking. Indeed, the more democratic a regime is, the more likely it is to conduct randomised trials (Tanasoca and Leigh 2023).

    Recall the first big public administration reform – the growth of a professionalised civil service – rested on the development of democratic institutions. Nobel laureates Daron Acemoglu and James Robinson call this the ‘red queen effect’, in which societies offering more public goods also need to offer more democratic social power (Acemoglu and Robinson 2019).

    The seventh reform – randomised trials and evidence‑based policymaking – takes us further along the corridor. Things are not true simply because politicians assert them. Policies must be backed by evidence, and citizens must be able to test and trust that evidence.

    Democracies are on this journey together, and international collaboration is vital to reaching the tipping point.

    This is not about the performative use of words like ‘evaluation’ and ‘evidence’. It is about raising the quality and quantity of evidence, which is one reason that I keep referring to randomised trials. I acknowledge the work of the OECD towards achieving the goal of institutionalising rigorous evaluation across public policy areas, as per the OECD Recommendation of the Council on Public Policy Evaluation (OECD 2022).

    The second annual update of the Global Commission on Evidence also confirms the many signs of momentum towards the Commission’s 3 implementation priorities to formalise and strengthen domestic evidence‑support systems, enhance and leverage the global evidence architecture, and put evidence at the centre of everyday life (Global Commission on Evidence 2024).

    Conclusion

    We’re here because we care about good government. And because we understand that evaluation and evidence science are not fields in their infancy.

    Just as we don’t put homeopathy on the same level as science‑based medicine, it is a mistake to think that evidence‑free policy is on a par with evidence‑based policy.

    OECD governments have decades of experience about how to identify evidence gaps, put policies to the test, and implement the most effective programs (Leigh 2024a).

    Policymaking by focus groups and gut‑feel alone is the modern‑day equivalent of bloodletting and lobotomies in medicine (Leigh 2024a). Which is why the seventh big reform to public administration must focus on finding interventions that work. And on building a body of programs backed by strong, replicated randomised trial evidence of important, lasting improvements in people’s lives.

    This goal requires OECD nations to get behind the momentum of the Global Commission on Evidence.

    This will have massive benefits. It will save lives. It will save dollars. And it will make government work better.

    So let’s make it happen.


    My thanks to officials in the Australian Centre for Evaluation for valuable drafting assistance, and to Jon Baron, President and CEO of the Coalition for Evidence‑Based Policy, and David Halpern CBE, President Emeritus at the Behavioural Insights Team, for valuable discussions that helped shape this speech.

    References

    Acemoglu D and Robinson JA (2019) The Narrow Corridor: States, Societies, and the Fate of Liberty, Penguin, New York.

    Arnold Ventures (21 March 2018a) ‘How to solve U.S. social problems when most rigorous program evaluations find disappointing effects (part one in a series)’, Straight Talk on Evidence, accessed 15 January 2025.

    Arnold Ventures (13 April 2018b) ‘How to solve U.S. social problems when most rigorous program evaluations find disappointing effects (part 2 – a proposed solution)’, Straight Talk on Evidence, accessed 15 January 2025.

    Arnold Ventures (18 June 2019) ‘Evidence‑Based Policy ‘Lite’ Won’t Solve U.S. Social Problems: The Case of HHS’s Teen Pregnancy Prevention Program’, Straight Talk on Evidence, accessed 15 January 2025.

    Arnold Ventures (26 October 2022a) ‘Year Up’, Social Programs That Work, accessed 15 January 2025.

    Arnold Ventures (21 March 2022b) ‘Per Scholas Employment/Training Program for Low-Income Workers’, Social Programs That Work, accessed 15 January 2025.

    Arnold Ventures (11 July 2024a) ‘Saga Math Tutoring’, Social Programs That Work, accessed 15 January 2025.

    Arnold Ventures (28 August 2024b) Governor Moore Announces $20 Million in Grants for Education Programs, First Awards Under Maryland Partnership for Proven Programs with Arnold Ventures [media release], Arnold Ventures, accessed 16 January 2025.

    Australian Education Research Organisation (n.d.), About us, Australian Education Research Organisation website, accessed 22 January 2025.

    Brunner R and Lynch A (2017) ‘Adaptive Governance’, Oxford Research Encyclopedia of Climate Science, doi:10.1093/acrefore/9780190228620.013.601.

    Campbell Collaboration (n.d.) Our work, Campbell Collaboration website, accessed 16 January 2025.

    Campbell Collaboration (n.d.) About the CVE programme, Campbell Collaboration website, accessed 21 January 2025.

    Campbell DT (1991) ‘Methods for the Experimenting Society’, Evaluation Practice, 12(3):223–260.

    Education Endowment Foundation (n.d.) How we work, Education Endowment Foundation website, accessed 22 January 2025.

    Global Commission on Evidence to Address Societal Challenges (2024), ‘Global Evidence Commission update 2024: Building momentum in strengthening domestic evidence‑support systems, enhancing the global evidence architecture, and putting evidence at the centre of everyday life’ [PDF 5MB], McMaster Health Forum, Hamilton, accessed 17 January 2025.

    Halpern D (2023) ‘Foreword’, in Sanders M and Breckon J (eds) The What Works Centres: Lessons and Insights from an Evidence Movement, Bristol University Press, Bristol.

    Haskins R (17–18  August 2009) ‘Chapter 3 With a scope so wide: using evidence to innovate, improve, manage, budget’ [roundtablee presentation] Strengthening Evidence‑based Policy in the Australian Federation, Session 1 Evidence‑based policy: Its principles and development Canberra, accessed 16 January 2025.

    Jacobs A (4 April 2024) ‘Glasses Improve Income, Not Just Eyesight’, The New York Times, accessed 15 January 2025.

    Leigh A (2018) Randomistas: How Radical Researchers Changed Our World, Black Inc, Melbourne.

    Leigh A (3 October 2024a) ‘Address to the UK Evaluation Task Force, 9 Downing Street, London’ [presentation], London, accessed 15 January 2025.

    Leigh A (17 June 2024) ‘Address to the Australian Evaluation Showcase, Canberra’ [presentation], Australian Evaluation Showcase, Canberra, accessed 15 January 2025.

    Leigh A (28 November 2024c) ‘Address to 10th Annual Social Impact Measurement Network Australia Awards’ [presentation], 10th Annual Social Impact Measurement Network Australia Awards, Virtual, accessed 17 January 2025.

    OECD (Organisation for Economic Co‑operation and Development) (2022) Recommendation of the Council on Public Policy Evaluation, Adopted on 06/07/2022, OECD Legal Instruments, OECD/LEGAL/0478, accessed 17 January 2025.

    Patrick DL (29 January 2014) Massachusetts Launches Landmark Initiative to Reduce Recidivism Among At‑Risk Youth [media release], Commonwealth of Massachusetts, accessed 14 January 2025.

    Paul Ramsay Foundation (17 June 2024) ‘Experimental evaluation open grant round’, Paul Ramsay Foundation, accessed 17 January 2025.

    Productivity Commission (2020) Indigenous Evaluation Strategy: Background Paper, Australian Government.

    Roca Inc., Commonwealth of Massachusetts, and Third Sector Capital Partners (30 August 2024) Final Report: the Massachusetts Juvenile Justice Pay for Success project, accessed 14 January 2025.

    Sehrin F, Jin L, Naher K, Chandra Das N, Chan VF, Li DF, Bergson S, Gudwin E, Clarke M, Stephan T and Congdon N (2024) ‘The effect on income of providing near vision correction to workers in Bangladesh: The THRIVE (Tradespeople and Hand‑workers Rural Initiative for a Vision‑enhanced Economy) randomized controlled trial’, PLOS ONE, 19(4):e0296115, doi:10.1371/journal.pone.0296115.

    Tanasoca A and Leigh A (2024) ‘The Democratic Virtues of Randomized Trials’, Moral Philosophy and Politics, 22(1):113–140, doi:10.1515/mopp‑2022–0039.

    Winzar C, Tofts‑Len S, Corpu E (2023) Disrupting disadvantage 3: Finding what works, Committee for Economic Development of Australia, Melbourne, accessed 16 January 2025.

    Footnotes

    [1] Campbell’s paper was written around 1971 and used in presentations to the Eastern Psychological Association and the American Psychological Association. It was revised and first published in 1988 (see Campbell 1991).

    MIL OSI News

  • MIL-Evening Report: Mandatory minimum sentencing is proven to be bad policy. It won’t stop hate crimes

    Source: The Conversation (Au and NZ) – By Lorana Bartels, Professor of Criminology, Australian National University

    Shutterstock

    Weeks after Opposition Leader Peter Dutton announced his support for mandatory minimum jail terms for antisemitic offences, the government has legislated such laws. Minister for Home Affairs Tony Burke stated the federal parliament would now be “putting in place the toughest laws against hate speech that Australia has ever had”.

    It follows a concerning recent spate of antisemitic attacks in Australia, including on Jewish places of worship, schools, businesses and homes.

    Last week, a caravan was found on the outskirts of Sydney, filled with explosives and a list of Jewish targets.

    Understandably, there is fear in the Jewish community.

    The government’s decision to pursue mandatory minimum sentencing is contrary the 2023 ALP National Policy Platform stating:

    Labor opposes mandatory sentencing. This practice does not reduce crime but does undermine the independence of the judiciary, leads to unjust outcomes, and is often discriminatory in practice.

    The evidence shows that Labor’s official policy platform is correct. Mandatory minimum sentencing is unlikely to help solve this issue – or any other issue for that matter. It has a poor track record of reducing crime.

    What is mandatory sentencing?

    Australian criminal laws usually set a maximum penalty for an offence. It is then the role of the courts (a judge or magistrate) to set the sentence, up to the maximum penalty.

    This allows the judiciary to exercise discretion in sentencing. It means the courts can take into account a range of relevant factors when determining an appropriate sentence, guided by the sentencing laws in each jurisdiction.

    However, laws that demand a mandatory sentence set a minimum penalty for an offence, thereby significantly reducing the role of judicial discretion.

    Sentencing decisions are made by judges in Australian courts.
    Shutterstock

    Let’s imagine two people are appearing in court, to be sentenced for exactly the same offence.

    Defendant A (Kate) is 18 years old and has pleaded guilty. It is her first offence. She is Aboriginal, a victim of childhood domestic violence and lives on the streets. She has recently started to get help for her mental health problems.

    Defendant B (Jim) is 35. He has a long criminal history, including breaches of bail and parole. He has never been out of prison for more than six months at a time. He has pleaded not guilty and doesn’t think he has done anything wrong.

    The maximum penalty for this offence is five years. Under standard sentencing laws, a judge would usually give different sentences to Kate and Jim, based on their personal circumstances and future prospects. Jim would generally get a more severe sentence than Kate.

    Now, let’s imagine parliament decides to set a mandatory minimum sentence of two years in prison. This means the judge has to send both Kate and Jim to prison for at least two years, despite the differences between them, even if a community-based sentence might be more appropriate for Kate.

    So do mandatory minimum sentences work?

    The main arguments for mandatory sentences are that they:

    • reflect community standards

    • provide consistency

    • avoid judicial leniency, and

    • reduce crime.

    The evidence for each of these is weak.

    A study with members of the Victorian public who had served on juries found strong support for sentencing discretion.

    This is confirmed by recent research from the Queensland Law Reform Commission. It found general support from the public for individualised responses, not an inflexible approach to sentencing.

    Mandatory sentencing yields more consistent outcomes, but denies flexibility in cases where defendants should be treated differently.

    The argument that mandatory sentencing reduces crime is also contested.

    Study after study has shown that harsher penalties do not reduce crime.

    It is uncontested, however, that certainty of detection (whether you’ll get caught) is the primary deterrent factor, not the severity of the sentence (assuming that the perpetrator is aware of it).

    Mandatory sentencing also brings risks

    Let’s review the arguments against mandatory sentencing.

    Firstly, it undermines judicial independence, the separation of powers (between the courts and executive government) and the rule of law: a concept based on fairness in the judicial system.

    Mandatory sentencing also shifts discretion to other, less transparent, parts of the criminal justice system (for example, police and prosecution services), as they frame the charges that will bring defendants to court in the first place.

    Secondly, a guilty plea is a mitigating factor the court considers when sentencing. Mandatory sentencing means there is little incentive for defendants to plead guilty. This increases workloads, delays, costs, and has consequent negative effects for victims.

    In addition, juries may be reluctant to convict if they know the minimum sentence will insist upon a prison term. This can lead to inappropriate not guilty verdicts.

    Undermining the right to a fair trial

    Australia has previously come under fire from the United Nations for its mandatory sentencing laws.

    These requirements are found in the International Covenant on Civil and Political Rights, which entered into force for Australia in 1980.

    Indeed, the Law Council of Australia has suggested mandatory sentencing is inconsistent with the international prohibition against arbitrary detention, and undermines the right to a fair trial, given that such sentences have been somewhat predetermined.

    These laws can also lead to injustice. As the example above shows, mandatory sentencing can impact disproportionately on vulnerable people, such as Indigenous people, and women with disabilities.

    These cohorts are already far more vulnerable than non-Indigenous men (who account for most people who offend).

    Adverse effects on imprisonment rates

    The High Court recently stated that the mandatory minimum sentence will have the effect of lifting sentencing levels generally.

    But the research shows longer prison sentences are much more expensive and less effective than community-based sentencing options in reducing crime.

    Let’s leave the final word on this subject with the Law Council of Australia:

    achieving a just outcome in the particular circumstances of a case, while maintaining consistency across similar cases and with Australia’s human rights obligations, is […] paramount.

    We need effective responses to all forms of racial and religious hatred, including antisemitic hate crimes, but populist, knee-jerk reactions are highly unlikely to make the community safer. Clear-headed thinking will best stand the test of time, not policy developed in anger or fear.

    Lorana Bartels is a Director of the Justice Reform Initiative. She is a supporter of the Jewish Council of Australia. She has received research funding from the ACT, Commonwealth, Queensland, Tasmanian and Victorian governments. She recently undertook a project for the Queensland government, which examined the use of mandatory minimum sentences for murder. She is a member of the Tasmanian Sentencing Advisory Council, which recently completed a project on hate crimes.

    Rick Sarre does not work for, consult, own shares in or receive funding from any company or organisation that would benefit from this article, and has disclosed no relevant affiliations beyond their academic appointment.

    ref. Mandatory minimum sentencing is proven to be bad policy. It won’t stop hate crimes – https://theconversation.com/mandatory-minimum-sentencing-is-proven-to-be-bad-policy-it-wont-stop-hate-crimes-249266

    MIL OSI AnalysisEveningReport.nz