The composite cost-of-borrowing indicator, which combines interest rates on all loans to corporations, decreased in December 2024. The interest rate on new loans of over €1 million with a floating rate and an initial rate fixation period of up to three months decreased by 11 basis points to 4.31%. The rate on new loans of the same size with an initial rate fixation period of over three months and up to one year fell by 14 basis points to 4.06%. The interest rate on new loans of over €1 million with an initial rate fixation period of over ten years decreased by 6 basis points to 3.42%, mainly driven by the weight effect. In the case of new loans of up to €250,000 with a floating rate and an initial rate fixation period of up to three months, the average rate charged fell by 17 basis points to 4.63%. As regards new deposit agreements, the interest rate on deposits from corporations with an agreed maturity of up to one year fell by 13 basis points to 2.80% in December 2024. The interest rate on overnight deposits from corporations fell by 4 basis points to 0.77%. The interest rate on new loans to sole proprietors and unincorporated partnerships with a floating rate and an initial rate fixation period of up to one year decreased by 29 basis points to 4.63%.
Table 1
Bank interest rates for corporations
i.r.f. = initial rate fixation * For this instrument category, the concept of new business is extended to the whole outstanding amounts and therefore the business volumes are not comparable with those of the other categories. Outstanding amounts data are derived from the ECB’s monetary financial institutions balance sheet statistics.
The composite cost-of-borrowing indicator, which combines interest rates on all loans to households for house purchase, decreased in December 2024. The interest rate on loans for house purchase with a floating rate and an initial rate fixation period of up to one year decreased by 12 basis points to 4.15%. The rate on housing loans with an initial rate fixation period of over one and up to five years fell by 5 basis points to 3.57%. The interest rate on loans for house purchase with an initial rate fixation period of over five and up to ten years decreased by 7 basis points to 3.36%. The rate on housing loans with an initial rate fixation period of over ten years fell by 7 basis points to 3.09%. In the same period the interest rate on new loans to households for consumption decreased by 22 basis points to 7.36%. As regards new deposits from households, the interest rate on deposits with an agreed maturity of up to one year decreased by 16 basis points to 2.45%. The rate on deposits redeemable at three months’ notice stayed constant at 1.74%. The interest rate on overnight deposits from households showed no change at 0.35%.
Table 2
Bank interest rates for households
i.r.f. = initial rate fixation * For this instrument category, the concept of new business is extended to the whole outstanding amounts and therefore the business volumes are not comparable with those of the other categories; deposits placed by households and corporations are allocated to the household sector. Outstanding amounts data are derived from the ECB’s monetary financial institutions balance sheet statistics. ** For this instrument category, the concept of new business is extended to the whole outstanding amounts and therefore the business volumes are not comparable with those of the other categories. Outstanding amounts data are derived from the ECB’s monetary financial institutions balance sheet statistics.
The data in Tables 1 and 2 can be visualised for individual euro area countries on the bank interest rate statistics dashboard. Additionally, tables containing further breakdowns of bank interest rate statistics, including the composite cost-of-borrowing indicators for all euro area countries, are available from the ECB Data Portal. The full set of bank interest rate statistics for both the euro area and individual countries can be downloaded from ECB Data Portal. More information, including the release calendar, is available under “Bank interest rates” in the statistics section of the ECB’s website.
For media queries, please contactNicos Keranis, tel.: +49 69 1344 7806
Notes:
In this press release “corporations” refers to non-financial corporations (sector S.11 in the European System of Accounts 2010, or ESA 2010), “households” refers to households and non-profit institutions serving households (ESA 2010 sectors S.14 and S.15) and “banks” refers to monetary financial institutions except central banks and money market funds (ESA 2010 sector S.122).
The composite cost-of-borrowing indicators are described in the article entitled “Assessing the retail bank interest rate pass-through in the euro area at times of financial fragmentation” in the August 2013 issue of the ECB’s Monthly Bulletin (see Box 1). For these indicators, a weighting scheme based on the 24-month moving averages of new business volumes has been applied, in order to filter out excessive monthly volatility. For this reason the developments in the composite cost of borrowing indicators in both tables cannot be explained by the month-on-month changes in the displayed subcomponents. Furthermore, the table on bank interest rates for corporations presents a subset of the series used in the calculation of the cost of borrowing indicator.
Interest rates on new business are weighted by the size of the individual agreements. This is done both by the reporting agents and when the national and euro area averages are computed. Thus changes in average euro area interest rates for new business reflect, in addition to changes in interest rates, changes in the weights of individual countries’ new business for the instrument categories concerned. The “interest rate effect” and the “weight effect” presented in this press release are derived from the Bennet index, which allows month-on-month developments in euro area aggregate rates resulting from changes in individual country rates (the “interest rate effect”) to be disentangled from those caused by changes in the weights of individual countries’ contributions (the “weight effect”). Owing to rounding, the combined “interest rate effect” and the “weight effect” may not add up to the month-on-month developments in euro area aggregate rates.
In addition to monthly euro area bank interest rate statistics for December 2024, this press release incorporates revisions to data for previous periods. Hyperlinks in the main body of the press release lead to data that may change with subsequent releases as a result of revisions. Unless otherwise indicated, these euro area statistics cover the EU Member States that had adopted the euro at the time to which the data relate.
As of reference period December 2014, the sector classification applied to bank interest rates statistics is based on the European System of Accounts 2010 (ESA 2010). In accordance with the ESA 2010 classification and as opposed to ESA 95, the non-financial corporations sector (S.11) now excludes holding companies not engaged in management and similar captive financial institutions.
The Chief Statistician has released figures on local government finance in 2023-24. These figures provide a comprehensive overview of the financial activity of local government, including revenue expenditure and income; capital expenditure and financing; reserves; debt; and pensions.
Revenue expenditure is the cost of delivering services each year. Local authorities’ net revenue expenditure in 2023-24 was £14,296 million. Education and Social Work were the services with highest net revenue expenditure, accounting for £6,960 million and £4,604 million respectively.
Net revenue expenditure on Central Services increased by 103.2 per cent, or £352 million, between 2022-23 and 2023-24. Of this increase, £260 million was due to Equal Pay payments that were made by Glasgow City Council during 2023-24.
Capital expenditure is expenditure that creates the buildings and infrastructure necessary to provide services, such as schools and roads. Local authorities incurred £3,689 million of capital expenditure in 2023-24. This was predominantly financed by grants and contributions of £1,704 million and borrowing of £1,640 million.
Usable reserves are local authorities’ surplus income from previous years which can be used to finance future revenue or capital expenditure. At 31 March 2024, local authorities held £4,258 million of usable reserves.
When local authorities borrow money or use credit arrangements to finance capital expenditure, a debt is created which has to be repaid from future revenues. In 2023-24, as a result of the statutory flexibility granted by Ministers, local authorities made debt repayments of minus £67 million. That is, rather than repay debt, they received a windfall of £67 million as a result of the service concession flexibilities.
Strengthening China-European Union economic cooperation has become crucial for worldwide economic growth, as the United States’ tariff hikes against its key trading partners have cast a shadow over the global economy, said senior trade experts and EU business executives.
They emphasized that amid growing global trade protectionism, the Chinese and EU economies’ structural complementarity and the two sides’ upholding of free trade provide a solid basis for deeper bilateral economic and trade collaboration. They also said the US tariff increases are likely to backfire.
Zhang Yansheng, a researcher at the Chinese Academy of Macroeconomic Research, said the EU economy has advantages in high-end manufacturing, green technology and services trade, while China excels in digital infrastructure, smart manufacturing, application scenarios and a vast market.
“China and the EU could consider establishing an industrial chain security dialogue mechanism to form a ‘cooperation list’ in key areas such as semiconductors and pharmaceuticals,” Zhang said.
By creating platforms like industrial cooperation parks and joint innovation funds, the two sides’ strategic consensus can be transformed into concrete projects, in order to shape a practical and feasible road map for them to build a new, future-oriented type of economic and trade partnership, he said.
“With the transformation and upgrading of China’s manufacturing industry, the competition between China and the EU in economic and trade development has intensified a bit,” Zhang said.
“However, as they both face external challenges like rising protectionism and geopolitical uncertainties, the two economies are expected to forge closer economic ties based on complementary competition, thereby achieving a win-win situation,” Zhang added.
Zhou Mi, a senior researcher at the Chinese Academy of International Trade and Economic Cooperation, said the potential for collaboration between China and the EU is enhanced by their market complementarity and need for resource optimization.
He said he expects more cooperation mechanisms between the two sides to boost collaboration by enterprises, drive innovation and improve the allocation of market resources.
“By doing such things, China and the EU could generate significant economic and social benefits, boost employment and enhance supply chain security for both,” said Zhou, whose academy is affiliated with China’s Ministry of Commerce.
China remains the EU’s largest import source and third-largest export destination, according to European statistics. Moreover, China’s outbound direct investment inflows to the EU grew from 6.27 billion euros ($6.43 billion) in 2020 to 8.06 billion euros in 2023, with greenfield investment reaching 5.3 billion euros in 2023 — an increase of 48 percent compared with 2022.
Zhang, from the Chinese Academy of Macroeconomic Research, said that cooperation potential between China and the EU spans three key areas: green transformation, digital cooperation and third-party market development.
The two economies could build a joint carbon-neutral laboratory focusing on clean technology collaboration, recognize each other’s cross-border e-commerce standards, and build dialogue mechanisms for cooperation in frontier areas like data flow and artificial intelligence ethics, he said.
According to Zhou, from the Chinese Academy of International Trade and Economic Cooperation, China and the EU should focus in the short term on reviewing and strengthening existing supply chain cooperation, whether market-driven or government-promoted, by reducing trade barriers and increasing investment opportunities and the mobility of personnel.
Long-term strategies should aim for more effective market integration through reduced tariffs, increased consultation mechanisms and enhanced collaboration on innovation, he added.
Zhou also said that Sino-EU cooperation could extend beyond bilateral relations to include third-party market opportunities in Latin America, Africa and elsewhere.
“This expanded cooperation could help address global challenges while strengthening both parties’ economic independence and meeting consumer demand in emerging technological sectors,” he added.
Experts also said the US tariff hikes will not be good for anyone and will fail to achieve the so-called purpose of making America great again.
Ju Jiandong, chair professor at Tsinghua University’s PBC School of Finance, said that if the US truly wants to maximize its own interests, it should not damage ties with its manufacturing suppliers.
“Don’t go against the customers and don’t go against the suppliers – these are the ABCs of economics,” Ju said.
Business leaders also said they have an optimistic outlook on China-EU economic and trade cooperation.
Thomas Roemer, global head of the coatings and adhesives business entity of Covestro AG, a German polymer manufacturer, expressed strong support for fair, open and rule-based global trade.
“We will continue to invest in China to provide our customers with innovative and sustainable solutions and products,” Roemer said.
Denis Depoux, global managing director at German management consultancy Roland Berger, said the interdependence between the Chinese and EU economies remains significant.
Hong Kong’s economy expanded 2.5 percent in 2024 as exports of goods and services maintained growth, according to advance estimates released by the Hong Kong Special Administrative Region (HKSAR) government on Monday.
In the fourth quarter (Q4) of 2024, the region’s Gross Domestic Product (GDP) grew 2.4 percent year-on-year in real terms, faster than the 1.9-percent uptick in Q3, data from the Census and Statistics Department showed.
In 2024, total exports of goods resumed growth amid improved external demand, while exports of services posted an increase on the back of rising visitor arrivals and improvement in other cross-border economic activities, commented a spokesperson for the HKSAR government.
Overall investment expenditure expanded along with the economy at large, but private consumption expenditure recorded a slight decline owing to changes in residents’ consumption patterns, the spokesperson noted.
Looking ahead, the Hong Kong economy is expected to register further growth in 2025 despite heightened uncertainties in the external environment, the spokesperson said.
The central government’s various measures benefitting Hong Kong, coupled with the HKSAR government’s wide range of initiatives to promote economic growth, will support various economic activities, said the spokesperson.
ROB KIDD [HOST]: One of the big challenges that parents in regional and rural areas can face is what to do when kids start to look at tertiary studies. Traditionally, kids have had to leave home and head to the city, and that’s not always something that they really want to do or even have to do. But a new study hub will allow students to complete higher ed studies and stay in their hometowns. Funding has been announced for Regional University Study Hubs in Clermont and Moranbah, with hopes that they could actually be open by mid-year. Federal Assistant Minister for Education and Regional Development, Anthony Chisholm, here with the ABC’s Jenae Madden.
ANTHONY CHISHOLM [ASSISTANT MINISTER]: What these hubs do is create an environment for people to thrive and learn. The staff who are appointed to run these centres come with good experience, so they’ve often got a degree themselves. They might be from a teaching background, or they might be from a community background, and they provide great mentorship to those students who are coming in. You’ve got to remember that a lot of the people studying at these centres are often first in family, so they don’t have an experience of studying at a higher education institution. So, that can be quite daunting. So, to have that support and give people the confidence, but also someone to turn to when you need help, these centres provide a remarkable service to those communities and those people who are studying for the first time. They often have some meeting rooms where you can go and be by yourself and do your online tutorials, do that in private. Then they have some bigger areas where you can study by yourself, but in an environment where there’s other people who are dedicated and studying at the same time. And then you’ll often have people who are there as part of the workforce, who are there to answer questions or provide support and give people that encouragement they need or answer a question when they need it as well. So, they often operate outside of normal day hours. So, if you are working during the day or you’ve got caregiving responsibilities during the day and you need a quiet space at night, quite often they’re open later into the evening as well. They’re in the centre of town, so they’re easily accessible and they’re providing that service for people to go and study and have that opportunity to do that locally.
JENAE MADDEN [JOURNALIST]: The stats say that half of young people across the country have tertiary education. Meanwhile, those in Clermont and Moranbah, that’s only at 16 per cent. Can you talk to us a little bit about this gap?
CHISHOLM: There is no doubt there’s a gap between those living in rural and remote locations versus those in the cities when it comes to tertiary study. And it can be the remoteness, it can be the cost, it can be the thought of having to move away from home to study. All those things, I imagine, are factors. By having these centres, it means that you don’t have to move away. One of the other tasks that they do is they get out amongst the local high schools and communities and let people know that this service now exists, so that people who might be in Year 11 or 12 or maybe didn’t pursue study straight after school, they can go, alright, this is here in my local community, I can stay, live at home, enjoy that support, but study. And as I mentioned, the exciting thing from what I’ve seen is that a lot of the people who are studying at these centres are studying in the health field, are studying in the education field, and they’re exactly the type of workers that we need in these communities. These centres are making a significant contribution already across the country, and I’m confident that these two in Clermont and Moranbah will also do that.
MADDEN: I guess there’s a focus on these study hubs, but are there opportunities for jobs in the region later on?
CHISHOLM: Absolutely and the best examples of the centres that I’ve seen have a good link with local industry, and I’d expect that to be the case here, given the nature of Moranbah and Clermont and what the work is happening there, whether it be in mining or whether it be in renewable energy. There’s a wealth of opportunities, and I’d be very confident that these centres, once established, will have a really good industry linkage. We’ll also have that when it comes to local high schools, so that we can see those younger people identifying that, yes, I can stay and study locally, and there’s a range of jobs that I can go into as a result. That’s the perfect example of why these things will be significant contribution.
MADDEN: The Clermont and Moranbah study hubs, they were announced in May. I’m wondering if there’s something new, like, has there been additional money given to this? I think it was 2 million initially.
CHISHOLM: So, that was a State Government commitment to building the infrastructure and the State Government announcing they would help build new facilities out of their mining fund that they had. Our announcement today is that we’ll support them to establish themselves and give them some operational funds to employ those coordinators.
MADDEN: Okay and what are the figures there?
CHISHOLM: It’ll be negotiated between the Federal Government and the proponents. But for instance, it’s normally in the hundreds of thousands of dollars, and it can also include some money if they do need additional money for infrastructure. But that’s worked through with the proponents and the Federal Government.
MADDEN: So, is there a baseline that’s being committed to or something like that?
CHISHOLM: Well, it’s basically support to establish them, and then those negotiations will happen between the Education Department and the proponents.
KIDD: Assistant Minister for Education and Regional Development, Anthony Chisholm there speaking with Jenae Madden.
Source: United Kingdom – Executive Government & Departments
Government lays legislation confirming that the new National Living Wage and new National Minimum Wage will take effect from 1 April.
Millions of workers set for significant pay increase in April to improve living standards and drive growth
Pay boost worth £1,400 a year for an eligible full-time worker as Government takes significant step towards genuine living wage
Living wage boost set to put more money back into the pockets of working people and kickstart growth as part of the Plan for Change
Over 3 million workers in shops, restaurants and workplaces across the UK are set to receive a significant pay boost from April – putting thousands of pounds back in the pockets of working people every year. As a result of these changes, a further 4 million workers could benefit from the positive spill-over impacts of the rate increases.
The Government will lay legislation today that confirms a new National Living Wage of £12.21, and a new National Minimum Wage of £10.00 per hour from April.
Announced at last year’s Budget, the 6.7% increase to the National Living Wage which will be worth £1,400 a year for an eligible full-time worker is a significant step towards delivering the manifesto commitment to deliver a genuine living wage.
The National Minimum Wage for 18-20-year-olds is also set to increase by £1.40 to £10.00 per hour – a record increase which means full-time younger workers eligible for the rate will see their pay boosted by £2,500 a year.
An impact assessment also published today shows that these reforms will put around £1.8 billion into the pockets of workers over the next six years – delivering on the Government’s Plan for Change to improve living standards and make working people better off.
The increased income is set to boost financial stability for millions of families and improve spending power which will drive economic growth.
Employment Rights Minister Justin Madders said:
Economic growth only matters if working people are feeling the benefits.
This will be a welcome pay bump for millions of workers who in turn will spend more in the real economy boosting our high streets.
Our Plan for Change is putting money back into people’s pockets and delivering better living standards across the country.
Chancellor of the Exchequer Rachel Reeves said:
This Government promised a genuine living wage for working people that will support people with the cost of living, creating a workforce that is fit and ready to help us deliver number one mission to growth the economy.
This pay boost for millions of workers is a significant step towards delivering on that promise.
Deputy Prime Minister Angela Rayner said:
We’ve taken quick and sensible action to boost wages for millions of lower paid workers who are the backbone and future of our economy.
This is us fulfilling our promise to make work pay and improve living standards across the country, with record boosts to support young people and apprentices – our skilled workers of tomorrow.
The National Minimum Wage is the minimum amount an employer must pay per hour for most workers, while the National Living Wage is the higher rate that applies to workers aged 21 and over.
This is the first time the National Living Wage has taken into account the cost of living and inflation and marks the first step towards aligning the National Minimum Wage for 18–20-year-olds and National Living Wage to create a single adult wage rate.
This will put an end to age-based wage discrimination, meaning employers can no longer be justified in paying younger workers less for doing the same job as their older colleagues.
The minimum hourly wage for an apprentice is also set to be boosted this year, with an 18-year-old apprentice in an industry like construction seeing their minimum hourly pay increase by 18.0%, a pay bump from £6.40 to £7.55 an hour.
The April pay rise comes as the latest ONS stats showed average weekly earnings after inflation have risen at their fastest year-on-year rate in over three years.
This builds on the commitment to be a pro-business, pro-worker, pro-growth Government. It delivers a key plank of the Plan to Make Work Pay, which is already set to boost the pockets of some the lowest paid workers by up to £600 a year through the Employment Rights Bill.
The Employment Rights Bill will boost productivity by creating a secure workforce to help us deliver our first mission to kickstart economic growth.
Working across government, including with HMRC and Acas, we will continue to engage closely with businesses, unions and wider society to ensure that all employers are aware of the new rates and taking the steps needed to prepare for payroll changes on 1 April.
Low Pay Commission Chair Baroness Stroud said:
The increases we recommended are a big step towards making work pay and achieving a genuine living wage.
These rates secure a real-terms pay increase for the lowest-paid, and substantial increases for young workers make up some of the ground lost against the adult rate over time.
It’s important we continue to assess the effects of these changes on employers and workers; to that end, the Low Pay Commission will be consulting with both groups in the coming months.
TUC General Secretary Paul Nowak said:
This government is delivering on its promise to make work pay. The increase in the national minimum wage will make a real difference to the lowest paid at a time when one in six are skipping meals to get by. And moving to end the outdated and unfair youth rates will give young workers a boost up and down the country.
More money in working people’s pockets means more spend on our high streets – that’s good for workers and good for local economies. After workers in the UK have been through the biggest squeeze in living standards in 200 years, this boost to working people’s pay packets is badly needed.
Jason Davenport, CEO of The Chartered Institute of Payroll Professionals (CIPP), said:
With continued pressure on employers, it’s imperative that we ensure the new rates are understood, implemented and paid to workers correctly.
Compliance can be complex with issues for employers to be alert to around, for example, salary sacrifice arrangements.
The CIPP urges employers and agents to get their payroll processes ready for 1 April 2025 and the CIPP is on hand with support, advice and resources to help payroll professionals and employers ensure their workers are paid compliantly.
Notes to editors:
The changes from April will mean:
The National Living Wage for those aged 21 and over will rise from £11.44 per hour to £12.21 per hour.
The National Minimum Wage for 18- to 20-year-olds rises from £8.60 to £10.00 per hour.
The apprenticeship rate, and for 16- to 17-year-olds rises from £6.40 per hour to £7.55 per hour.
You wake up exhausted from yet another hot night of tossing and turning, with very little sleep.
So you might be tempted to buy a “cooling blanket” after reading rave reviews on social media. Or you might have read online articles with taglines such as:
Stop waking up in a puddle of sweat with our roundup of the best cooling blankets – including a top-rated option from Amazon that ‘actually works’.
But what are cooling blankets? And can they help you get a restful night?
We know a cooler bedroom is best
First, let’s look at why a cooler environment helps us sleep better at night.
Our body’s internal temperature has a circadian rhythm, meaning it fluctuates throughout the day. A couple of hours before bed, it drops about 0.31°C to help you fall asleep. It will drop about another 2°C across the night to help you stay asleep.
During sleep, your internal temperature and skin work together to achieve a balance between losing and producing heat. Your skin has sensors that pick-up changes in the environment around you. If it gets too warm, these sensors let your body know, which may cause you to kick-off blankets or bed clothes and wake more often leading to poorer sleep quality.
Sleep quality is an important component of sleep health ensuring you get the physical, mental and emotional benefits that come from a good night’s sleep.
The ideal temperature for sleep varies depending on the season and type of bedding you have but falls between 17°C and 28°C. Keeping your sleeping environment within this range will help you to get the best night’s rest.
So what are cooling blankets?
Cooling blankets are designed to help regulate your body temperature while you sleep.
Different technologies and materials are used in their design and construction.
We’re not talking about hospital-grade cooling blankets that are used to reduce fever and prevent injury to the nervous system. These use gel pads with circulating water, or air-cooling systems, connected to automatic thermostats to monitor someone’s temperature.
Instead, the type of consumer-grade cooling blankets you might see advertised use a blend of lightweight, breathable materials that draw moisture away from the skin to help you stay cool and dry through the night. They look like regular blankets.
Common materials include cotton, bamboo, silk or the fibre Lyocell, all of which absorb moisture.
Manufacturers typically use a thread count of 300-500, creating air pockets that enhance airflow and moisture evaporation.
Some blankets feature a Q-Max rating, which indicates how cool the fabric feels against your skin. The higher the value, the cooler the fabric feels.
Others feature phase change materials. These materials were developed by NASA for space suits to keep astronauts comfortable during a spacewalk where temperatures are from roughly -157°C to 121°C. Phase change materials in cooling blankets absorb and hold heat producing a cooling effect.
If you believe online reviews, yes, cooling blankets can cool you down and help you sleep better in warmer weather or if you get too hot using normal sheets and blankets.
However, there is little scientific research to see if these consumer-grade products work.
In a 2021 study exploring sleep quality, 20 participants slept for three nights under two different conditions.
First, they slept with regular bed sheets in an air-conditioned room with the temperature set to their preference. Then, they used cooling bed sheets in an air-conditioned room where the temperature was set 3°C higher than their preference.
Participants reported good sleep quality in both conditions but preferred the warmer room with its cooling sheets.
This may suggest the use of cooling bedding may help provide a more comfortable night’s sleep.
But everyone’s cooling needs varies depending on things like age, health, body temperature, the space you sleep in, and personal preferences.
So while these products may work for some people who may be motivated to leave a good review, they may not necessarily work for you.
Are they worth it?
There’s a wide variety of cooling blankets available at different prices to suit various budgets. Positive customer reviews might encourage a purchase, especially for individuals experiencing disrupted sleep at night due to heat.
Yet, these cooling blankets have limited scientific research to show they work and to say if they’re worth it. So it’s up to you.
If a cooling blanket isn’t for you, there are other things you can do to stay cool at night, such as:
using air conditioning or a fan
placing a damp towel under or over you
wearing lightweight or minimal sleepwear and avoiding thick or synthetic fabrics, such as nylon, that can trap heat
if you usually share a bed, on hot nights, consider sleeping by yourself to avoid excess body heat from your partner.
On a final note, if you often struggle with hot, disturbed sleep, you can check in with your health-care provider. They can see if there is a medical explanation for your disturbed sleep and advise what to try next.
Luana Main will receive funding from the NHMRC to investigate the effects of climate change on an unrelated topic starting later this year.
Linda Grosser does not work for, consult, own shares in or receive funding from any company or organisation that would benefit from this article, and has disclosed no relevant affiliations beyond their academic appointment.
Despite being confronted every day with people in genuine need being stopped from accessing emergency housing – National still won’t commit to building more public houses.
“Chris Bishop is full of it. It is completely heartless and out of touch of him to be comfortable with people sleeping in cars and tents, while he stands up and boasts about saving money,” Labour housing spokesperson Kieran McAnulty said.
“It’s simple, build more public houses so that people have somewhere to live. Housing is the bare minimum that a person needs to live, and to help turn their life around.
“Chris Bishop has already instructed Kāinga Ora to build fewer houses each year in his letter of expectation, leading to a net loss of houses in Auckland next year, and cut $1.5 billion from building and maintenance costs in last year’s budget.
“If the best that he can come up with is the number of overall homes won’t go backwards, then it shows their priority is cutting spending, not housing people.
“He says a lot of words about how the private sector will step in, yet figures out today from Statistics New Zealand shows overall building consents for new homes are down nearly 10% for 2024.
“Chris Bishop completely missed out the words that matter – a commitment to building more public houses,” Kieran McAnulty said.
Home consents up in Otago in 2024, down in all other regions–4 February 2025 –There were 33,600 new homes consented in Aotearoa New Zealand in the year ended December 2024, down 9.8 percent compared with the year ended December 2023, according to figures released by Stats NZ today.
“Otago was the only region with an increase in the number of new homes consented in 2024,” economic indicators spokesperson Michael Heslop said.
The five regions with the highest number of new homes consented in the year ended December 2024 were:
Auckland with 13,939 (down 10 percent compared with the year ended December 2023)
Home consents up in Otago in 2024, down in all other regions – 4 February 2025 – There were 33,600 new homes consented in Aotearoa New Zealand in the year ended December 2024, down 9.8 percent compared with the year ended December 2023, according to figures released by Stats NZ today.
“Otago was the only region with an increase in the number of new homes consented in 2024,” economic indicators spokesperson Michael Heslop said.
The five regions with the highest number of new homes consented in the year ended December 2024 were:
Auckland with 13,939 (down 10 percent compared with the year ended December 2023)
February 3, 2025Washington, DC, United StatesEnforcement and Removal
WASHINGTON, D.C. — U.S. Immigration and Customs Enforcement conducted enhanced enforcement operations in Chicago and New York this week with routine daily enforcement occurring around the country, including in Baltimore and Houston. This part of the agency’s effort to arrest criminal aliens with no legal basis to remain in the U.S. Immigration enforcement operations include federal law enforcement partners from FBI, DEA, ATF, CBP and the U.S. Marshals Service in a whole-of-government approach.
Track quarterly ICE arrest, detention and removal statistics
Call 866-DHS-2-ICE (866-347-2423) or fill out ICE’s online tip form to report crimes and suspicious activity.
Access B-roll and images of ICE’s most current arrests and removals on ICE’s DVIDS page and ICE’s Flickr Photostream. Get breaking news, public safety information and more by following ICE on X at @ICEgov. You can also follow ICE on Facebook and follow ICE on Instagram for updates and more.
The third quarter of 2024 saw services exports rise by 16 per cent in Asia, followed by 8 per cent in Europe, while North America, South and Central America and the Caribbean expanded by 7 per cent. Marked growth was also recorded on imports across regions, reflecting high demand for diverse services.
Services are the bright spot of trade, with growth of 9 per cent year-on-year in the first three quarters of 2024 (Chart 1). This is in sharp contrast with goods trade, which was up by only 2 per cent over the same period.
In the third quarter of 2024, transport saw a 14 per cent rise (Chart 1) as shipping rates climbed amid persistent disruptions on major trade routes. Global freight prices were nearly four times higher than in Q3 2023, at about US$ 4,500, according to data from Freightos.
Asia’s transport services exports increased by 32 per cent, with peaks of 47 per cent in China and 40 per cent in Singapore. Available monthly statistics of leading Asian transport traders point to sustained growth through the end of the year. For example, in the last quarter of 2024, China’s transport exports soared by 50 per cent, reflecting a surge in shipments.
International travellers’ expenditure in foreign economies increased by 10 per cent in Q3 2024, and in the first three quarters of 2024, global travel receipts were 15 per cent higher than pre-pandemic levels. Growth is stabilizing after the post-pandemic surge, and visa-free schemes adopted throughout 2024 by many economies have benefited international tourism worldwide. By the end of 2024, international tourist arrivals had almost reached their 2019 levels, suggesting complete recovery for the sector, according to UN Tourism.
Travel in 2024 was also boosted by the UEFA European Football Championship in Germany and the Olympics in France, and Europe’s travel exports grew by 7 per cent from an already high base in 2023. Many African economies recorded double-digit growth, including Namibia (+32 per cent), Morocco (+19 per cent) and Tanzania (+18 per cent).
Other commercial services, a heterogeneous group of services accounting for some 60 per cent of total services trade, expanded on average by 8 per cent in Q3. In the European Union and the United Kingdom, exports in this category increased by 9 per cent, and in the United States by 7 per cent. Double-digit growth was widespread in many economies in different regions. For example, South and Central America and the Caribbean economies saw very high growth rates, including Chile (+32 per cent), Argentina (+26 per cent) and Peru (+17 per cent).
Digitally deliverable services such as computer, financial, business and insurance services were the main drivers of growth. Computer services continued their impressive rise in January-September 2024, with cumulative exports surging globally by 13 per cent (Chart 2). Rapid growth in computer services exports was recorded both in developed and developing economies, including a sharp increase of 77 per cent in Indonesia and strong growth of 37 per cent in Mauritius and 18 per cent in the United States (Chart 3). According to WTO estimates, the European Union’s exports of computer services grew by 15 per cent year-on-year in the first nine months of 2024, or by 10 per cent if excluding the largest EU exporter, Ireland.
Companies are increasingly outsourcing information technology (IT) services and software development. The rapid expansion of e-commerce and digital platforms, including in developing economies, has accelerated this process. The growing adoption of AI, such as to develop chatbots, machine learning and predictive analytics, as well as for cybersecurity needs, has further accelerated the global demand for computer services. This trend is expected to persist as businesses adapt to new technologies and consumer preferences for digital solutions.
Quarterly statistics are estimates as of the time of publication, and subject to frequent revisions. They are available for download at WTO Stats, along with monthly and annual statistics. Annual services trade data and related visualizations can also be accessed at the Global Services Trade Data Hub and at WTO World Trade Statistics 2023.
Source: United States Senator Ben Ray Luján (D-New Mexico)
Washington, D.C. – This week, U.S. Senator Ben Ray Luján (D-N.M.) has been actively engaging in critical Senate hearings, holding nominees accountable to protect essential services and programs for New Mexicans and every American. Throughout these hearings, Senator Luján has emphasized the importance of nominees serving the public interest, rather than furthering political agendas.
As a member of the Senate Committee on Finance, the Senate Committee on Commerce, Science, Transportation, and the Senate Committee on the Budget, Senator Luján has been at the forefront of pressing key nominees on their positions on working for the American people and upholding the law.
RFK Jr. Confirmation Hearing
In the nomination hearing for Robert F. Kennedy Jr. to become Secretary of Health and Human Services, Senator Lujánquestioned Mr. Kennedy on his understanding of the importance of Medicaid and pressed Mr. Kennedy for his commitment to protect Medicaid from cuts. Mr. Kennedy did not commit to not cutting Medicaid if asked to by the President.
NBC News – It’s ‘clear’ that RFK Jr. would be a ‘rubber stamp’ on Trump’s policy decisions: Democratic senator.
Sen. Ben Ray Luján (D-N.M.) joins Meet the Press NOW after pressing Robert F. Kennedy Jr. during his Senate confirmation hearing to lead the Department of Health and Human Services.
US News & World Report – 5 Key Takeaways From RFK Jr.’s First Senate Confirmation Hearing
Kennedy Struggles on Medicare and Medicaid Questions: “President Trump has asked me to make it work better,” Kennedy said. “Most Americans are not happy with it. The premiums are too high, the deductibles are too high, and everybody’s getting sick or too much money is going to the insurance industry.” Democratic Sen. Ben Luján of New Mexico responded by citing statistics from state polling showing high levels of satisfaction with Medicaid.
Reuters – Kennedy says he will finalize rules that increase diversity in clinical trials
Robert F. Kennedy Jr., President Donald Trump’s pick to lead the top U.S. health agency, told U.S. senators during his confirmation hearing on Wednesday that he would finalize regulations aimed at increasing the participation of diverse patient populations in clinical trials. Asked by Democratic Senator Ben Ray Lujan whether he would commit to finalizing the guidance on clinical trial diversity mandated by Congress, Kennedy replied, “Yes.”
The Daily Beast – RFK Jr. Completely Fumbles Basic Facts in Confirmation Hearing
Kennedy also missed big when Sen. Ben Ray Lujánasked him to estimate how many babies are born in the U.S. each year on Medicaid. Kennedy, after conceding he had no clue, estimated 30 million. That is about eight times more than the overall number of births the U.S. had in total in 2023. About 1.4 million of those were on Medicaid, Luján informed Kennedy.
Howard Lutnick Confirmation Hearing
In the nomination hearing for Howard Lutnick to become Secretary of Commerce, Senator Luján questioned Mr. Lutnick on whether he would commit to not cutting funding that has been awarded to connect thousands of New Mexicans to the internet. Despite Mr. Lutnick’s acknowledgement of the importance of broadband buildout, he would not commit to maintaining crucial support for broadband.
NPR – Trump’s pick for Commerce Secretary is Howard Lutnick. Here’s what to know
Sen. Ben Ray Luján, D-N.M., asked: “If President Trump asks you to cut infrastructure funding as passed by this Congress in a bipartisan way … will you oppose that?” “I work for the president,” Lutnick said.
Roll Call – Commerce pick Lutnick defends tariffs, funding freeze
Sen. Ben Ray Luján, D-N.M., tried to pin Lutnick down on whether he would withdraw funding allocated by law if Trump asked him to. “I work for the President of the United States, and I’m here to execute his policies,” Lutnick said. “I think he agrees that broadband internet to America is important and that, efficiently, we deliver.” “I’ll slow down — if the President asked you to cut an infrastructure program, would you cut the program?” Luján asked. “We have a responsibility to communicate to each other for the people that we work for, it’s not just that you work for Donald Trump, sir. You work for the American people if you get this position.”
Sen. Ben Ray Luján (D-N.M.) asked him if he’d stop infrastructure money passed by Congress if he was ordered to. Sen. Tammy Duckworth (D-Ill.) pressed if he would heed an unconstitutional order from Trump.“We’re asking simple questions. We had an incredible conversation in the office … a very respectful one,” a visibly frustrated Luján said. “It’s not just that you work for Donald Trump. Sir, you work for the American people.”
Russel Vought’s Chaos and Confusion
Senator Luján was joined by Budget Committee Ranking Member Jeff Merkley (D-Ore.), Senate Democratic Leader Chuck Schumer (D-NY), along with Budget Committee Democrats, to call out the threat of Russell Vought’s nomination to be Director of the Office of Management and Budget (OMB). Russell Vought would add to the Trump administration’s unprecedented chaos and confusion. Reporting shows that he worked behind the scenes to orchestrate the halt to all federal funding including grants and loans, upending trillions of dollars and creating cruel and unnecessary chaos for childcare centers, firefighters, domestic violence shelters, law enforcement, health care providers, seniors and veterans, and American families.
Roll Call – Vought nomination advances despite Democrats’ boycott
Senate Budget Committee Republicans approved Russ Vought’s nomination to serve as President Donald Trump’s budget director on Thursday, overcoming the absence of Democrats on the panel who boycotted the markup.
Albuquerque Journal – Senate Democrats boycott Trump’s budget office director pick in wake of attempted funding freeze
After an attempt this week by President Donald Trump’s budget office to freeze federal funding to determine if it aligned ideologically with his priorities, Senate Democrats, including Sen. Ben Ray Luján of New Mexico, boycotted a budget committee vote for the president’s budget office pick, Russell Vought. Although the OMB memo has been rescinded, White House officials have said Trump’s executive order related to the Monday memo is still in effect, causing “more confusion, more chaos,” Luján said.
The third Amrit Snan on the occasion of Basant Panchami was successfully completed during the Mahakumbh 2025, at Prayagraj. Millions of devotees took a holy dip at the Triveni Sangam. The Kumbh Mela showcases not only faith, trust, and devotion but also unity, equality, and cultural diversity in its purest form.
According to statistics released by the State government, by 6 PM on Basant Panchami, a total of 2.33 crore devotees had taken a dip in the holy Triveni Sangam. Devotees from India and abroad, united by the spirit of ‘Vasudhaiva Kutumbakam’, participated in the sacred bathing ritual. Sadhu-sants, yogis, scholars, and devotees from various countries also took part in this divine event, making it a truly universal festival.
The significance of this auspicious day prompted devotees to begin arriving at the Sangam area from the previous night. The event was made successful with the contribution of the Kumbh Mela administration, local administration, police, sanitation workers, volunteers, boatmen, and all government departments, ensuring the safe and smooth conduct of this historical event.
Special cleanliness arrangements were made for the third Amrit Snan on Vasant Panchami, with the goal of maintaining a clean and safe environment. To achieve this, 15,000 sanitation workers and over 2,500 Ganga Seva Doots worked tirelessly. Special cleaning was also arranged for the paths leading to the akhadas to ensure the comfort of both saints and devotees. Quick Response Teams (QRT) were stationed throughout the area to ensure immediate cleanliness, swiftly removing waste from the mela grounds. Water sprinkling and cleaning of the Sangam were carried out with the help of boatmen and steamers.
The Kumbh Mela 2025 has succeeded in promoting India’s cultural heritage on an international level. The event’s popularity and cultural significance are being recognized globally, with foreign devotees deeply impressed by Indian culture and traditions, experiencing both the sacred Ganga Snan and India’s religious and cultural practices.
The Ministry of Tourism under the “Pilgrimage Rejuvenation and Spiritual, Heritage Augmentation Drive” (PRASHAD) scheme provides financial assistance to the State Governments and Union Territory Administrations for development of tourism infrastructure at important pilgrimage and heritage destinations. A total of 47 projects has been sanctioned in 27 States/UTs with estimated cost of Rs.1594.40 crore.
Details of the projects sanctioned under the PRASHAD Scheme is given in the annexure.
As per information received from the State Government of Uttar Pradesh, there is substantial increase in religious tourism to Ayodhya after construction of Ram Mandir. As per tourism statistics of Ayodhya, the total number of visitors to the district has risen from 6,022,618 in the year 2020 to 164,419,522 in the year 2024.
This information was given by Union Minister for Tourism and Culture Shri Gajendra Singh Shekhawat in a written reply in Lok Sabha today.
NATIONAL METADATA STRUCTURE (NMDS 2.0) is designed to uniformly represented data and information NATIONAL METADATA STRUCTURE (NMDS 2.0) is to provide clarity on data sources and collection methods
Posted On: 03 FEB 2025 3:31PM by PIB Delhi
The National Metadata Structure (NMDS 2.0) is designed with the objective that data and information are uniformly represented, provide clarity on the data sources, collection methods and enhance discoverability of data sets. It is to bring in improved understanding of various data sets in public domain such as census, surveys, administrative and those from other sources.
The NMDS 2.0 has been shared with Ministries/Departments for implementation. The Ministry of Statistics and Programme Implementation regularly interacts with the Statistical Advisors of Ministries/Departments on various issues, including this.
This information was given by the Minister of State (I/C) for the Ministry of Statistics and Programme Implementation, Ministry of Planning and Minister of State in the Ministry of Corporate Affairs, Rao Inderjit Singh in a written reply in the Rajya Sabha today.
Source: The Conversation – Canada – By Carmela Cucuzzella, Dean, Faculty of Environmental Design, Université de Montréal, Full Professor School of Design, Université de Montréal
Those designing university courses should ensure issues of universal accessibility are embedded throughout a student’s academic journey.(Shutterstock)
People living with disabilities, ranging in severity, regularly face barriers. Oftentimes, built environments are designed in ways that fail to consider the needs of those in situations of disability. That can include improperly sized ramps for wheelchair users or public spaces that are not sensory friendly.
If our public spaces are not accessible to all, then they cannot be truly public. The first step in changing our built environment is to bring awareness to the different forms of disabilities that people in Canada experience.
As a professor in a school of design and the dean of the Faculty of Environmental Design at the Université of Montréal, I believe it’s urgently important to explore how faculties of architecture, design, landscape architecture and urbanism can inform design practices through the way we teach and conduct research.
Our objective must be to teach students how to make our built environment more inclusive and universally accessible through creative means rather than basic technological add-ons.
In 2022, the Canadian Survey on Disability showed that 27 per cent of Canadians aged 15 years and older had one or more disabilities that impacted their daily activities. (Shutterstock)
Standards exist for accessibility and inclusivity in Canada, but they are not systematically applied. Furthermore, when designing for universal accessibility, the emphasis is on conformity rather than experience, on separation rather than integration, and on functionality rather than fulfillment.
Take, for example, a multi-storey office building that provides separate entrances and facilities for people with disabilities. The building complies with the minimum accessibility requirements set by local building codes, but does so in a way that isolates people with disabilities rather than integrating their needs into the overall design. This building does not provide the same experience to all people and therefore separates rather than includes diverse populations.
The universal accessibility of public spaces and buildings is a complex design problem. It is especially difficult for retrofits, since solutions can quickly become costly, particularly in heritage buildings.
But if changes are managed carefully, costs can become manageable. Universal accessible design is also challenging for new buildings and spaces, but if universal design is prioritized right from the outset of a project, architects and developers can create inclusive environments that accommodate diverse needs without incurring substantial additional expenses.
Universities that offer teaching and research programs in universal accessible design can make a real difference. (Shutterstock)
How universities can help
Universal accessible design is not just a question of following a set of codes, but rather a question of designing for an equitable, qualitative accessible experience. This means ensuring that all people, regardless of their physical or mental situations, are offered equivalent spatial experiences.
Universities that offer teaching and research programs in a universal accessible design can make a real difference. But it’s integral that teaching is developed alongside the research, as understanding of needs and best practices are in continual renewal.
Faculties with such programs and courses could achieve this by enabling students through creative engagement of this difficult subject. Furthermore, being in these design environments allows students to understand these societal issues as leverage for innovative solutions, rather than just satisfying building codes.
Those designing university courses should ensure issues of universal accessibility are embedded throughout a student’s academic journey, and included in a way that helps empower the graduating students.
Students graduating from these programs will become the young professionals in the fields of design, architecture, urbanism or landscape architecture.
Unfortunately, the exact likelihood of students specializing in universal accessibility — and applying their knowledge in their careers — is challenging due to limited specific data. But there is an increasing recognition of the importance of accessibility in various sectors, leading to more roles that require expertise in universal design and inclusive practices.
Incorporating more discussion on universal accessibility in the classroom and in university research environments can help students apply their expertise in the design of our built environment throughout their careers.
By fostering dialogue between research, education and practice, universities can ensure a future where accessibility is seamlessly integrated into the every day.
Carmela Cucuzzella receives funding from FRQSC and SSHRC.
European Commission Press release Brussels, 03 Feb 2025 The latest Eurobarometer survey on ‘European citizens’ knowledge and attitudes towards science and technology’ released today shows more than 8 in 10 citizens (83%) think that the overall influence of science and technology is positive.
Mastercard has announced plans to remove the 16-digit number from their credit and debit cards by 2030 in a move designed to stamp out identity theft and fraudulent use of cards.
In 2022, Mastercard added biometric options enabling payments to be made with a smile or wave of the hand.
Tokenisation converts the 16-digit card number into a different number – or token – stored on your device, so card information is never shared when you tap your card or phone or make payments online.
The first rollout of these numberless cards will be through a partnership with AMP Bank, but it is expected other banks will follow in the coming 12 months.
Why card security is important
There is nothing quite like the sinking feeling after receiving a call or text from your bank asking about the legitimacy of a card transaction.
In 2023-2024 the total value of card fraud in Australia was A$868 million, up from $677.5 million the previous financial year.
Credit card numbers and payment details are often exposed in major data breaches affecting large and small businesses.
The cost of credit card fraud in Australia rose by almost $200 million last financial year. CC7/Shutterstock
Late last year, the US Federal Trade Commission took action against the Marriott and Starwood Hotels for lax data security. More than 300 million customers worldwide were affected.
Event ticketing company Ticketmaster was also hacked last year. The details of several hundred million customers, including names, addresses, credit card numbers, phone numbers and payment details were illegally accessed.
So-called “card-not-present fraud”, where an offender processes an unauthorised transaction without having the card in their physical possession, accounts for 92% of all card fraud in Australia. This rose 29% in the last financial year.
The Card Verification Value (CVV) (or three-digit number on the back of a credit card) aimed to ensure the person making the transaction had the physical card in their hands. But it is clearly ineffective.
Benefits of removing credit card numbers
Removing the credit card number is the latest attempt to curb fraud. Removing numbers stops fraudsters processing unauthorised card-not-present transactions.
It also reduces the potential for financial damage of victims exposed in data breaches, if organisations are no longer able to store these payment details.
Companies will no longer be able to store card data, reducing the risk of data breaches. ESBProfessional/Shutterstock
The storage of personal information is a contested issue. For example, the 2022 Optus data breach exposed information from customers who had previously held accounts with the telco back in 2018.
Removing the ability of organisations to store payment details in the first place, removes the risk of this information being exposed in any future attack.
While any efforts to reduce fraud are welcome, this new approach raises some new issues to consider.
Potential problems with the new system
Mastercard has said customers will use tokens generated by the customer’s banking app or biometric authentication instead of card numbers.
This is likely to be an easy transition for customers who use mobile banking.
However, the use of digital banking is not universal. Many senior consumers and those with a disability don’t use digital banking services. They would be excluded from the new protections.
While strengthening the security attached to credit cards, removing numbers shifts the vulnerability to mobile phones and telecommunication providers.
Offenders already access victims’ phones through mobile porting and impersonation scams. These attacks are likely to escalate as new ways to exploit potential vulnerabilities are found.
There are also concerns about biometrics. Unlike credit card details, which can be replaced when exposed in a data breach, biometrics are fixed. Shifting a focus to biometrics will increase the attractiveness of this data, and potentially opens victims up to ongoing, irreversible damage.
While not as common, breaches of biometric data do occur.
For example, web-based security platform BioStar 2 in the UK exposed the fingerprints and facial recognition details of over one million people. Closer to home, IT provider to entertainment companies Outabox is alleged to have exposed facial recognition data of more than one million Australians.
Will we really need cards in the future?
While removing the numbers may reduce credit card fraud, emerging smart retail technologies may remove the need for cards all together.
Smartphone payments are already becoming the norm, removing the need for physical cards. GlobalData revealed a 58% growth in mobile wallet payments in Australia in 2023, to $146.9 billion. In October 2024, 44% of payments were “device-present” transactions.
Amazon’s innovative “Just-Walk-Out” technology has also removed the need for consumers to bring a physical credit or debit card all together.
Amazon Go and the world’s most advanced shopping technology.
This technology is available at more than 70 Amazon-owned stores, and at more than 85 third-party locations across the US, UK, and Australia. These include sports stadiums, airports, grocery stores, convenience stores and college campuses.
The technology uses cameras, weight sensors and a combination of advanced AI technologies to enable shoppers in physical stores make purchases without having to swipe or tap their cards at the checkout line.
Such technology is now being offered by a variety of other vendors including Trigo, Cognizant and Grabango. It is also being trialled across other international retailers, including supermarket chains Tesco and ALDI.
While Just-Walk-Out removes the need to carry a physical card, at some point consumers still need to enter their cards details into an app. So, to avoid cards and numbers completely, smart retail tech providers are moving to biometric alternatives, like facial recognition payments.
Considering the speed at which smart retail and payment technology is entering the marketplace, it is likely physical credit cards, numberless or not, will soon become redundant, replaced by biometric payment options.
Gary Mortimer receives funding from the Building Employer Confidence and Inclusion in Disability Grant, AusIndustry Entrepreneurs’ Program, National Clothing Textiles Stewardship Scheme, National Retail Association, Australian Retailers Association. .
Cassandra Cross has previously received funding from the Australian Institute of Criminology and the Cybersecurity Cooperative Research Centre.
As Nova Scotia’s Provincial Police, road safety is a top priority. In an effort to keep citizens informed about enforcement on our roadways, the RCMP is releasing statistics on stunting charges for the months of October to December 2024.
During this three-month period, Nova Scotia RCMP charged 55 drivers with stunting on a number of highways across the province. This includes 25 in October, 12 in November, and 18 in December. The following are examples of these offences:
182 Km/h in a 100 Km/h zone on Hwy. 105 in South Haven
197 Km/h while driving in Yarmouth (the newly licensed driver was drinking alcohol behind the wheel)
166 Km/h in a 100 Km/h zone on Hwy. 125 in Point Edward (newly licensed driver)
Anyone driving a motor vehicle 50 Km/hr or more over the speed limit may be charged with stunting.
The fine for stunting in Nova Scotia is $2,422.50 for a first offence, six points on your licence and an immediate seven-day roadside licence suspension.
Speed is one of the major causes of serious injury and fatal collisions on our roads. Road safety is a priority for the RCMP and drivers are reminded to make it their priority as well. If you see someone driving unsafely on our roads, please report it by calling the RCMP at 1-800-803-RCMP (7267). If you believe it’s an emergency, call 911.
It has taken decades for some to accept the devastating effects of climate change on our planet. Despite scientific evidence that was available years ago, many people were reluctant to make the connection between increasing use of fossil fuels, rising global temperatures and devastating weather events.
A key reason for this reluctance is the dislocation of cause and effect, both in time and geography. And here there are clear parallels with another deadly human activity that is causing increasing levels of suffering across the planet: the production, trafficking and consumption of illicit drugs. Here are some troubling “highlights” from the UN’s latest World Drugs Report:
Cocaine production is reaching record highs, with production climbing in Latin America coupled with drug use and markets expanding in Europe, Africa and Asia.
Synthetic drugs are also inflicting great harm on people and communities, caused by an increase in methamphetamine trafficking in south-west Asia, the near and Middle East and south-eastern Europe, and fentanyl overdoses in North America.
Meanwhile, the opium ban imposed by the de facto authorities in Afghanistan is having a significant impact on farmers’ livelihoods and incomes, necessitating a sustainable humanitarian response.
The report notes how organised criminal groups are “exploiting instability and gaps in the rule of law” to expand their trafficking operations, “while damaging fragile ecosystems and perpetuating other forms of organised crime such as human trafficking”.
Illicit drug use is damaging large parts of the world socially, politically and environmentally. Patterns of supply and demand are changing rapidly. In our new longform series Addicted, leading drug experts bring you the latest insights on drug use and production as we ask: is it time to declare a planetary emergency?
At every stage of the process of producing drugs such as cocaine, there are not only societal impacts but environmental ones too. An example of the interconnected relationship between climate change and drugs is demonstrated in the use of land.
Demand for cocaine has grown rapidly across many western countries, and meeting this can only be met by changing how land is used. Forests are cleared in South America to make way for growing coca plants. The refinement of coca into cocaine involves toxic chemicals that pollute the soil and nearby watercourses. This in turn compromises those living in these areas as access to clean water and fertile land is reduced.
Until this is reversed, these local communities will not be able to cultivate the land to earn an income or rely on water sources to live. And each year, some of their number will add to the hundreds of thousands of people around the world who die, directly or indirectly, as a result of illicit drug use.
People in the world with drug use disorders (1990-2021)
Having spent most of my career researching the human toll of drug use at almost every stage of the supply and consumption chain, I believe a complete shift in the way we think about the world’s drug problem is required.
We already have many years of evidence of the ways that drugs – both natural and (increasingly) synthetic – are destabilising countries’ legal and political institutions, devastating entire communities, and destroying millions of lives. My question is, as with climate change, why are we so slow to recognise the existential threat that drug use poses to humanity?
The disconnect between users and producers
For decades, problems with drugs have been viewed as a mainly western issue, affecting Europe, North America and Australasia in terms of drug taking. This perception was fostered in part by US president Richard Nixon’s “war on drugs” announcement in June 1971, when he declared drug abuse to be “public enemy number one”.
This western-centric focus has come at a cost – we still have little data and information about drug use and problems in Africa, for example. But we are beginning to see how far drugs and their associated devastation has reached beyond traditional western borders.
Illicit drug use has increased by 20% over the past decade, only partly due to population growth. Almost 300 million people are estimated to consume illicit drugs regularly, with the three most popular being cannabis (228 million users), opioids (60 million) and cocaine (23 million). According to the UN report:
The range of drugs available to consumers has expanded, making patterns of use increasingly complex and polydrug use a common feature in most drug markets. One in 81 people (64 million) worldwide were suffering from a drug use disorder in 2022, an increase of 3% compared with 2018.
There are multiple harmful consequences of drug use. The largest global burden of disease continues to be attributed to opioids, use of which appears to have remained stable at the global level since 2019, in contrast to other drugs.
In the same way that climate change has threatened whole populations, so too have drugs. Yet many of us remain disconnected from how they are produced and distributed – and the misery they cause throughout the supply chain, all over the world.
The production of cocaine, for example, is associated with violence and exploitation at every stage of the manufacturing process. Death threats to farmers and unwilling traffickers have all increased in parallel with the growing demand for cocaine in the US and Europe.
Global drug use disorder deaths by substance (2000-21):
Organised crime groups not only supply and distribute drugs but also trade in people, whether for the commercial sex trade or other forms of modern slavery. This makes sense as the infrastructure and contacts to move drugs are similar to those used to move humans across borders and even continents. Yet many cocaine users are oblivious – wilfully or otherwise – of the violence associated with how this drug is supplied to them. As the UK National Crime Agency points out:
Reducing demand is another critical factor in reducing the supply of illegal drugs. Many people see recreational drug use as a victimless crime. The reality is that the production of illegal drugs for western markets has a devastating impact in source countries in terms of violence, exploitation of vulnerable and indigenous people and environmental destruction.
While some of the suffering associated with the production of drugs like cocaine makes the headlines, it’s often overshadowed by the glamorisation of criminal drug gangs in films and on TV. To the extent that people worry about the impact of drugs, it’s usually focused on those in our immediate communities, such as people dependent on heroin who are sleeping rough and vulnerable to exploitation. But there have already been other victims before the drug reaches our streets.
Shifts in the global supply chain
Tracking heroin routes demonstrates the way that drug supply is an international effort which affects every community on its journey, from the Afghan farmer to officials who are bribed so the drug can cross borders or be let through ports without being seized, to the person injecting or smoking the finished product.
Much of Europe’s heroin is produced in Afghanistan by small farming operations growing opium, which is then transformed into the drug. Most Afghan farmers are simply surviving growing the crop, and don’t reap significant wealth from their harvest. It is those supplying and distributing the opium as heroin who can make serious money from it.
Meanwhile, following the return of the Taliban to power in Afghanistan in August 2021, those farmers’ livelihoods have faced a new threat.
The Taliban is ideologically opposed to the production of opium. Soon after assuming control, its leaders issued a decree banning farmers from growing opium. They have enforced this by destroying crops when farmers have ignored the ban – although there is still believed to be a significant stockpile of heroin in the country, meaning that as yet, there has not been a big impact on supply to Europe and the UK. But this could change amid the emergence of more deadly synthetic alternatives, including nitazenes and other new synthetic opioids.
Heroin trafficking flows based on reported seizures (2019-22):
Either way, the drug gangs who traffic heroin won’t worry about the opium farmers’ wellbeing. As so often happens with changes in the availability of illicit drugs, when there is a shortage, these groups prove adaptable and nimble at providing alternatives quickly.
While gathering intelligence about organised crime gangs is difficult and potentially dangerous, the European Union Drugs Agency (EUDA) has provided some insights about who these groups are and how they operate. The Netherlands remains an important hub for the distribution of heroin, with several Dutch criminal groups involved in importing and distributing heroin from Afghanistan.
But others are involved too: the EUDA’s intelligence shows that criminal networks with members from Kurdish background are central to the wholesale supply and have control over many parts of the supply chain. These professional, well-organised groups have established legal businesses throughout the route of supply that facilitate their illicit activities – largely along the Balkan route with hubs in Europe.
Intermediate & final recipients of heroin shipments (2019-22):
Unlike these organised crime gangs, governments and law enforcement appear to respond to emerging threats slowly and lack the flexibility and ingenuity that the gangs repeatedly demonstrate.
As drug detection techniques have improved, organised crime has shown how inventive it can be. Taking advantage of the COVID-19 pandemic, dealers used consignments of surgical masks to conceal large quantities of cocaine being trafficked to China and Hong Kong from South America.
And as western markets for cocaine become saturated, organised crime gangs have exploited new markets in Asia, where cocaine seizures, a proxy for use of cocaine, have increased. But the shifting landscape is also reflected in changes in consumption, with use of the synthetic stimulant methamphetamine growing rapidly in Asia – reflected in record levels of seizures in the region in 2023.
For the organised crime gangs, production and supply of synthetic drugs is in many ways easier, as it is not reliant on an agricultural crop in the way that heroin and cocaine are and can be manufactured locally. This reduces the distribution logistics and distance needed for an effective supply chain. According to the UN Office on Drugs and Crime, organised crime gangs are exploiting gaps in law enforcement and state governance to both traffic large volumes of drugs and expand their production in the region.
Where there is destabilisation, there is opportunity for those who seek to profit from drug addiction. In Syria, Russia and Ukraine, war has made some people very rich.
Syria and Russia: the new drug hotspots
The wars in Syria and Ukraine bear testament to the way drugs provide solutions to people who are experiencing the worst of times – and to governments that are ready to exploit evolving situations.
As the war in Syria progressed, the Bashar Al-Assad regime actively developed a strategy to dominate the captagon market in the Middle East and North Africa. First produced in the 1960s in Germany to treat conditions such as attention deficit disorders and narcolepsy and other conditions, captagon is a stimulant that staves off hunger and sleep, making it ideal for military use – particularly in countries where food supplies are inconsistent. It has been referred to as the “drug of jihad” used by Islamic fighters in the region.
As the war progressed in Syria, the country and its leader became increasingly isolated, its economy crashed creating the perfect conditions to develop the trade in captagon. Rather than drug production leading to the collapse of law and order, it was the other way round.
Isolated by the west and with a historically strained relationship with its neighbours including Saudi Arabia, the Assad regime – under the guidance, reportedly, of Assad’s brother Maher al-Assad– ruthlessly positioned itself as the world’s main producer and distributor of this drug, then used this position to leverage its influence and try to reintegrate into the Arab world.
Video by TRT World.
Captagon also provided much-needed revenue for the Assad regime. The drug was estimated to be worth US$5.7 billion annually to the Syrian economy – at a time when western governments have placed severe sanctions on the country, restricting its ability to raise revenue. Saudi Arabia was one of the main countries being supplied captagon by Syria. Until the fall of Assad, it was the senior leadership in Syria that controlled the supply and distribution of the drug – giving rise to the label “the world’s largest narco state”.
The Assad government achieved this position by making captagon good value – a viable alternative to alcohol in terms of price and for those who don’t drink. Exploiting many of its own citizens, the regime encouraged individuals and businesses to participate in manufacturing and distributing the drug.
The fall of Assad and his hurried escape to Russia left the rebel fighters to pick up vast hauls of captagon and other drug ingredients. “We found a large number of devices that were stuffed with packages of captagon pills meant to be smuggled out of the country. It’s a huge quantity,” one fighter belonging to the Hayat Tahrir al-Sham (HTS) group told the Guardian. What this will do to drug production and supply in the region is unclear.
While the latest UN World Drug Report highlights “a rapid increase in both the scale and sophistication of drug trafficking operations in the region over the past decade”, it goes on to highlight that “one of the most striking changes worldwide in drug trafficking and drug use over the past decade has taken place in Central Asia, Transcaucasia [Armenia, Azerbaijan and Georgia] and eastern Europe”, where there has been a shift “away from opiates, mostly originating in Afghanistan – towards the use of synthetic stimulants, notably cathinones … There is hardly any other region where cathinones play such a significant role.”
This is part of “a groundbreaking shift in the global drug trade, pioneered in Russia and now spreading globally,” according to the Global Initiative Against Transnational Organized Crime. This shift is changing the nature of drug sales, using “darknet markets and cryptocurrency for anonymous transactions, allowing buyers to retrieve drugs from hidden physical locations or ‘dead drops’, rather than direct exchanges.”
The rise of Russia’s dead drop drug trade stems from several unique national factors: restrictive anti-drug policies, strained western trade relations, and a strong technological foundation. Enabled by these conditions, the dead drop model has reshaped how drugs are distributed in Russia.
Drug transactions now involve no face-to-face interactions; instead, orders are placed online, paid for with cryptocurrency, and retrieved from secret locations across cities within hours. This system, offering convenience and anonymity, has seen synthetic drugs – especially synthetic cathinones like mephedrone – overtake traditional imported substances like cocaine and heroin in Russia … These potent synthetic drugs are cheap, easy to manufacture, and readily distributed through Russia’s vast delivery networks.
The report notes that this shift in drug distribution has been accompanied by rising levels of violence including punishment beatings, and a public health crisis.
Podcast by the Global Initiative Against Transnational Organized Crime.
Yet officially, there is very little reliable data about drug use in Russia. Under the premiership of Vladimir Putin, Russia has no sympathy with those who are dependent, viewing them as weak and without value. And its invasion of Ukraine three years ago has had ramifications for Ukraine’s users too.
Prior to the war, Ukraine had demonstrated an increasingly progressive policy towards those who had problems with drugs, establishing treatment centers and encouraging access to treatment. Since Russia invaded Ukraine in February 2022, this strategy has been severely set back, with many people who need access to substitute treatments such as methadone unable to secure consistent supply of these drugs.
Another global blind spot is China, where, like Russia, little is known about the extent or type of problems that drugs are causing. Both regimes are ideologically opposed to recreational or problem drug use and, as far as we know, there is no state-funded rehabilitation provided in either country; the approach is to criminalise people rather than offer health-based interventions.
We shouldn’t be too critical as many western countries, including the UK, also need to pivot from a criminal approach to drug problems towards a health-focused one. Portugal made such a policy change several years ago, recognising that people who develop problems with drugs such as dependency need help rather than punishment.
This radical shift in thinking has made a significant change to the way those using drugs are treated, in the main offered help and specialist support rather than being arrested and sent to jail, only to be released and then repeat the same cycle of drug use, arrest and prison.
The evidence of this policy change is impressive: not only have drug-related deaths fallen, but population-level drug use is among the lowest in Europe. Nowhere is this policy shift more urgent than the US.
North America: epicentre of the opioid crisis
In the US, the synthetic opioids fentanyl and oxycodone have contributed to more than 100,000 fatal overdoses each year since 2021. While there are signs this deaths toll is at last beginning to fall, the harm and pain of addiction and overdose affects every strata of American society – as shown in moving portrayals of America’s opioid crisis such as Painkiller and Dopesick. Most fatalities are caused by respiratory depression where breathing is significantly slowed or stops altogether.
Official trailer for Painkiller (Netflix)
Fentanyl is an analgesic drug that is 50-100 times more potent than heroin or morphine. Where China used to be the principal manufacturer and supplier of fentanyl to the US, Mexico is now the primary source. In December 2024, Mexican authorities announced “the largest mass seizure of fentanyl pills ever made” – amounting to more than 20 million doses of fentanyl pills worth nearly US$400 million. The pills were found in Mexico’s Sinaloa state, home of the Sinaloa drug cartel and a hub of fentanyl production,
“This is what makes us rich,” one fentanyl cook recently told the New York Times. He was scathing about the idea that Donald Trump would be able to stamp out the supply of fentanyl from Mexico to the US by threatening Mexico’s government with tariffs. “Drug trafficking is the main economy here.”
However, the introduction of synthetic opioids to the US came not via organised crime but through a deliberate strategy of the pharmaceutical industry. Upon launching its prescription opioid painkiller OxyContin (a brand name for oxycodone) in 1996, Perdue Pharma, owned by the Sackler family, devised a plan to increase prescriptions of the drug by incentivizing and rewarding doctors to give these drugs to their patients. On a business level, this was a success; on a human level, it has been a disaster.
As patients quickly developed tolerance to drugs such as OxyContin, they had to take higher doses to avoid withdrawal symptoms or the positive feelings it gave them. Taking more of these opiates increases the risk of accidental overdose, many of which proved to be fatal. It has also driven those dependent on drugs to the black market, and into the hands of organised drug gangs, as they seek the drugs in greater quantities.
Dependency on fentanyl and other opioids is all-consuming. When not using these drugs, people are entirely focused on ensuring sufficient supply of the next dose. This includes funding supply which can take people to places they thought they would never be, for example breaking the law, shoplifting or getting involved in commercial sex to make enough money to buy drugs.
Synthetic opiates like OxyContin and fentanyl have proved to be classless, ageless and sex blind. The first-hand experience of addiction and fatalities have radically altered the way many Americans think about drugs and the problems they cause. Canada, too, is suffering a major crisis.
Compounding this tragedy is the failure of the state to provide interventions and treatment that could have reduced fatal and non-fatal overdoses. It is only now that evidence-based interventions are beginning to be made widely available, such as access to Naloxone – a drug that can reverse the effects of opiates and potentially save a life.
Of course, it isn’t just hospitals and health professionals that are challenged by the results of widespread use of opioids, but public services like the police and fire service. In some areas of the US, there have been so many daily overdoses that every service was called on to try and deal with it. Local mayors have made it a priority to train police and fire personnel to be trained as first responders, such is the scale of the problem.
But it is not just in North America that we see the failure of politicians and the state to act when faced with growing problems with drugs. In the UK, where record numbers are dying because of using drugs such as heroin, the government has not invested in overdose prevention strategies. At a time when fatal overdoses increase year on year, budgets for specialist treatment have been reduced. It remains to be seen what the recently elected Labour government will do, if anything, to tackle the tragic rise in drug related fatalities.
What connects both examples from the US and UK is the attitude and perception of drug use many of us have. Drug use and the heavy use of prescription painkillers is still heavily stigmatised. Many of us still view this as something individuals bring on themselves or have a choice about.
So, if we don’t care about what happens to people who develop problems with drugs, why should our elected representatives? In part, it is our bigotry that is enabling the lack of timely intervention, despite us possessing the knowledge and evidence of how drug harms can be minimised.
Latin America: breakdown of the rule of law
Under the last Conservative government, the UK Home Office asserted that people who used cocaine recreationally are supporting violence not only in the UK but in the countries that produce its raw ingredients. It’s not clear if this has made any difference to those using cocaine in the UK – personally, I doubt many people consider or are aware of how cocaine is produced or its provenance.
Perhaps if those using cocaine, mainly in western countries, realised the extent of violence and suffering that cocaine manufacture causes they might think again. Latin America has suffered enormously, with few countries there not touched in some way by the violence and breakdown of law associated with drug production and supply. According to the latest UN World Drugs Report:
Global cocaine supply reached a record high in 2022, with more than 2,700 tons of cocaine produced that year, 20% more than in the previous year … The impact of increased cocaine trafficking has been felt in Ecuador in particular, which has seen a wave of lethal violence in recent years linked to both local and transnational crime groups, most notably from Mexico and the Balkan countries.
Cocaine seizures and homicide rates increased five-fold between 2019 and 2022 in Ecuador, with the highest such rates reported in the coastal areas used for trafficking the drug to major destination markets in North America and Europe.
Cocaine trafficking flows based on reported seizures (2019-22):
As with opium production in Afghanistan, it is small-scale farmers in Colombia, Peru and Bolivia that grow the coca plant that will be turned into cocaine. Like their Afghan counterparts, they grow coca as it is more profitable than alternatives such as coffee. While it may be profitable in the short term, there are greater costs to them and their society.
Cocaine production brings with it violence as those further up the drug production chain try to control its trade. Few parts of these societies are unscathed, from bribing local politicians through to whole regions that are controlled by organised crime. Keeping control means that the use of firearms and violence increases. Against this backdrop, it is unsurprising that basic health and social services suffer.
So, while a coca grower may have more money, every other aspect of their life is negatively impacted. Whether it is regional or state institutions, both are compromised by the drug trade and those that control it. While this may not lead to the total collapse of law and order, it does create injustice and distorts the rule of law in many areas of Latin America and the Caribbean, where competition between gangs has also resulted in an increase in homicides.
The impact is on all sectors of society, now and into the future. For example, while historically the role of women has been largely underrepresented in research and drug policy, the UN report recognises that this is changing:
As women increasingly participate in economic activities, the role that women play in the drug phenomenon may become increasingly important. For example, a shift away from plant-based drug production may affect many women in rural households involved in opium poppy and coca bush cultivation.
The UN also identifies the specific risk to young people and the drugs trade, highlighting:
Long-term efforts to dismantle drug economies must provide socioeconomic opportunities and alternatives, which go beyond merely replacing illicit crops or incomes and instead address the root structural causes behind illicit crop cultivation, such as poverty, underdevelopment, and insecurity. They must also target the factors driving the recruitment of young people into the drug trade, who are at particular risk of synthetic drug use.
Meanwhile, demand for treatment in Europe due to problems with cocaine has risen significantly in recent years, since 2011 there has been an 80% increase in treatment presentations. This reflects the growing number of people using cocaine and the rise in purity of the drug.
Amid what may seem to be a story of unrelenting despair and hopelessness, there are local initiatives and even a few state-wide policies that provide optimism that change is possible.
In my roles both as clinician and scientist, I’ve often been amazed by how ingenious people can be when faced with the apparently impossible. For example, the way some people use heroin to dampen their psychotic symptoms, such as auditory and visual hallucinations – or the development of Naloxone, a drug that can temporarily reverse the effects of opioids, providing a short window for emergency services to treat people who have overdosed.
Early in my career, I witnessed the emergence of HIV in the UK in the 1980s. The speed at which this disease spread was not matched by our ability to treat it. Our response to HIV was undoubtedly hampered by prejudice and stigma towards marginalised groups in society, namely gay men and those using drugs (particularly injecting them).
However, unexpectedly and courageously, the Conservative government recognised those who were most at risk of contracting HIV, and organised a package of measures to contain the spread of infection. One part of this was a media campaign based on public health messaging designed to reduce the risk of contracting the disease. But the government also invested in treatment for those who had been infected and engaged with people at high risk, such as those intravenously injecting drugs.
I worked in specialist HIV clinics for those using drugs. At the time, methadone and diamorphine were provided as an alternative to heroin. Regulations and protocols that restricted the prescribing of these medical opioids were eased, so we could ensure patients attending these clinics were given sufficient oral and injectable opioids that they didn’t need to source street heroin.
This meant they had access to medical grade opioids and, crucially, were given regular supplies of sterile injecting equipment. It was this that reduced the risk of contracting HIV, as some people would share injecting equipment when using heroin.
This impressive policy ran counter to the Conservative party’s ideology at the time, which was to punish rather than help those using drugs like heroin. It showed me how, even with traditional mindsets, it is possible to shift policy thinking in the face of a health crisis. And make no mistake, the global drug problem is an ongoing health crisis. Today, the UN points to the risks that intravenous users of drugs still face:
An estimated 13.9 million people injected drugs in 2022, with the largest number living in North America and East and South-East Asia … The relative risk of acquiring HIV is 14 times higher for those who inject drugs than in the wider population globally.
There are, though, signs of positive change in the way some countries and regions are changing their drug policies. Scotland recently opened a drug consumption facility in Glasgow – a safe place for people to use their drugs, usually injecting drugs like heroin. Such spaces provide access to sterile injecting equipment, reducing the risk of blood-borne infections such as HIV or Hepatitis. At the same time, they offer the opportunity to engage with people who have not accessed traditional health services.
Portugal, as mentioned earlier, has made substantial changes to the way it approaches drug use and the problems associated with it. This policy shift since 2000 has saved lives and brought a more humane way of treating people who develop problems with drugs.
Contrast this with the wasted effort and resources ploughed into the war on drugs – initiated by Nixon and followed by so many western governments ever since. My plea to policymakers is simple: employ the same evidence-based science you use for health issues towards drugs and problem drug use.
Science and research can help in many ways, if given the chance. Some of it might seem radical, like providing safe drug consumption spaces. Some of it is more mundane, but vital – like tackling inequality, a clear driver of problem drug use across the world.
But while we often look to politicians to take the lead on change, it is people – us – that really hold the solution. By far the greatest threat to people and society from drugs is ignorance and bigotry. So many lives have been lost to drugs because of shame, either as a driver of drug use or a barrier to seeking help.
Beliefs are notoriously difficult to shift. As with climate change, the most powerful driver of change is personal experience. We know that when a family or community is affected by a drug overdose, their beliefs and perceptions change. But this is not the way any of us should want to see change happen.
To hear about new Insights articles, join the hundreds of thousands of people who value The Conversation’s evidence-based news. Subscribe to our newsletter.
Ian Hamilton does not work for, consult, own shares in or receive funding from any company or organisation that would benefit from this article, and has disclosed no relevant affiliations beyond their academic appointment.
Visit a supermarket in 2025 and you’ll see that a tub of Lurpak butter can cost £5.70. It may strike you that this represents a staggering increase from £3.65 just three years ago, so instead of paying the premium, you reach for the supermarket’s own brand at £3.80.
This kind of switch, multiplied across millions of shopping baskets, represents a massive shift in consumer behaviour that has been largely invisible to official statistics. But that’s changing, as the UK embarks on its biggest revolution in measuring living costs since the second world war.
The Office for National Statistics (ONS) is transforming the way it tracks inflation, moving from painstakingly checking prices to analysing millions of real purchases through supermarket scanners. Consider olive oil, the price of which surged by 47% in a year, or milk, which jumped by more than 25%. While official statistics captured these price rises, they couldn’t track how households adapted – whether by switching to cheaper alternatives, buying less, or cutting back elsewhere. This was a blind spot in our understanding of consumer behaviour.
Currently, price collectors visit stores across the country each month, checking the prices of about 25,000 products. It’s like taking a snapshot of what’s on the shelves at a particular moment. But this system, designed decades ago, often misses the real impact of inflation on different household types in things like choosing different products or switching stores.
This is crucial for understanding the real impact of inflation on lower-income households. These families often have less flexibility in their budgets and must make more dramatic changes to their shopping habits when prices rise. During recent periods of high inflation, many on low incomes found that official figures didn’t match their experience, which was of even higher inflation than the headline rates. And there’s a good reason why.
Inflation statistics aren’t just academic exercises. They drive decisions that affect every aspect of our financial lives. The Bank of England uses them to set interest rates, which in turn influence mortgage payments and savings returns. Employers use them in wage negotiations. Government uses them to adjust benefits, state pensions and tax thresholds. Even commercial contracts, including mobile phone bills and rail fares, are often linked to inflation rates.
When these numbers don’t accurately reflect price pressures, it can have serious consequences. If official figures underestimate the inflation experienced by lower-income households, benefit increases might not keep pace with their actual cost increases. Similarly, if wages don’t rise in line with real living costs, workers effectively experience a pay cut.
The scanner data revolution
The ONS’s new approach, to be introduced next year, will analyse around 300 million price points from supermarket scanners, covering about half of all grocery transactions in the UK. Instead of just seeing what’s on the shelf, they’ll know exactly what prices people are paying at checkouts across the country.
This massive increase in data points – from 25,000 to 300 million – will allow for a more nuanced understanding of consumer behaviour.
The change will also enable quicker identification of emerging price trends. After the start of the COVID pandemic and the Ukraine war, prices of certain goods changed rapidly. Scanner data could help spot these changes faster, allowing for more timely policy responses. It might also reveal regional variations in price pressures.
Take the 2023 surge in food prices – while overall food inflation hit 19%, the impact varied dramatically across households. Current statistics would not capture lower-income families switching from fresh to frozen vegetables, or from branded to value ranges.
In times of cost pressures, shoppers may switch from fresh produce to frozen. sirtravelalot/Shutterstock
With scanner data, policymakers could spot these trends quickly and respond more precisely – perhaps by adjusting benefit payments or targeting support to specific households when essential food costs spike. Instead of waiting for quarterly surveys to reveal hardship, they will be able to see in real time how different groups are coping with price pressures.
The ONS recently said full implementation will come in 2026, a year later than planned. While it will have the technical capability ready by March 2025, it is opting for a year of parallel running to ensure accuracy. This approach reflects how crucial these statistics are for the economy.
It has already modernised other areas of price collection, including incorporating 40 million train fare data points and 300,000 used car prices. But grocery prices, being central to household budgets and varying significantly across different income groups, require extra attention.
The change is coming at a crucial time. Recent years have shown how rapidly economic conditions can change and how differently these changes can affect various segments of society. The pandemic, Brexit adjustments, and global supply chain disruptions have all contributed to price pressures.
For consumers, while the changes won’t directly lower prices, they could lead to more appropriate responses from the Bank of England, government and employers. Most importantly, it could ensure that official inflation figures better reflect the reality of the weekly shop, particularly during times of economic stress.
The transformation of inflation statistics might seem like a technical detail, but its implications reach far beyond government offices and economic reports. It’s about ensuring that the official measures of living costs better reflect the reality experienced by millions of households across the UK. In this challenging economic environment, that’s something worth getting right.
Marcel Lukas receives funding from the British Academy. He is the Director of Executive Education at the University of St Andrews and Fellow of the ONS. The presented views are his own and do not represent the ONS.
GAITHERSBURG, Md., Feb. 03, 2025 (GLOBE NEWSWIRE) — GL Communications Inc., a global leader in telecom testing solutions, addressed the press regarding their latest release of the PacketExpert™ 10GX, used for testing Ethernet and IP networks and individual network infrastructure.
A single PacketExpert™ 10GX device features two 10/2.5/1 Gbps ports and two 10/100/1000 Mbps ports, all of which support both electrical and optical connections. The device is fully compatible with all SFP and SFP+ modules available on the market.
Controlled via a Windows® PC through a USB connection, the PacketExpert™ offers an intuitive Graphical User Interface (GUI) for configuring test parameters, starting and stopping tests, viewing real-time graphs and statistics, and exporting results.
For larger testing environments, rack-mount variants of the PacketExpert™ 10GX are available. These enclosures can house up to six devices, delivering a total of 24 GigE ports. Additionally, the solution includes optional licensing for Python and C# Scripting, enabling automation and repetitive testing workflows.
Smart loopback (auto layer detection) and layer-wise loopback testing
TCP Throughput Testing – according to the RFC 6349 standard
Multi stream traffic generation and analysis – send and receive multiple UDP streams and measure throughput, packet loss, delay, jitter, and packet reordering at full wirespeed
Generate frame sizes from 64 bytes to 16000 bytes
Emulate impairments such as congestion, latency, loss, jitter, and packet reordering
Playback previously recorded traffic with precise time stamping to emulate real world traffic
About GL Communications Inc.,
GL Communications is a global provider of telecom test and measurement solutions. GL’s solutions are used to verify the quality and reliability of Wireless, Fiber Optic, TDM and Analog networks.
Source: United Kingdom – Executive Government & Departments
The Government has announced the appointment of three non-executive directors to the Board of the UK Statistics Authority.
The Authority’s statutory objective is to promote and safeguard the production and publication of official statistics that serve the public good.
The three appointees are:
Peter Barron, who is a Northern-Irish communications expert with senior experience in consumer technology and public affairs. He spent more than 20 years working in television news and current affairs at the BBC, ITV, and Channel 4, before working in external relations at Google from 2008 to 2018, and then at Stripe from 2021 to 2023. Peter holds a BSc in European Studies and Modern Languages from the University of Manchester (UMIST) and is a trustee of the Disasters Emergency Committee and the Quentin Blake Centre for Illustration.
Professor Mairi Spowage, who is Director of the Fraser of Allander Institute, Scotland’s leading economic research institute at the University of Strathclyde. Mairi leads research on modelling economic impact, economic measurement, regional economic and trade performance and public sector finances. Mairi has previously held roles as the Deputy Chief Executive of the Scottish Fiscal Commission and Head of National Accounts at the Scottish Government, with almost 20 years of experience of working in statistics and analysis, including transport, household surveys and performance measurement.
Dr Sarah Walsh, a risk and governance specialist who is currently advising clients in different sectors. Sarah has 20 years’ generalist experience, including Risk Director roles at Telegraph Media Group, Guardian Media Group, Save the Children and Imperial College London. Presently, she serves as a non-executive director at the Royal College of Nursing Publishing, including membership of the Royal College of Nursing’s Audit Committee and Equity, Diversity and Inclusion Committee. She also serves as independent non-executive member of the Audit and Risk Committees for Science Museum Group, St John’s Ambulance and the Royal Institute of Chartered Surveyors. Sarah holds a Master’s degree in Astronautics and Space Engineering from Cranfield University, and a PhD in Aerodynamics from the University of Manchester.
Appointments to the Board of the UK Statistics Authority are regulated. These appointments were made by Rt Hon Nick Thomas–Symonds MP, Minister for Cabinet Office. The advisory assessment panel was: Sir Robert Chote, Chair, UKSA (Chair of the panel); Steffan Jones, Director, Joint Data and Analysis Centre, Cabinet Office and Zarin Patel, Non Executive Director, HM Treasury.
Appointees began their roles at the end of January 2025.
Source: United Kingdom – Executive Government & Departments
A study published in Nature Aging looks at the effects of of omega-3, vitamin D and exercise on biological ageing.
Prof Dame Linda Partridge FRS FMedSci, Weldon Professor of Biometry at the Institute of Healthy Ageing, UCL; Biological Secretary of the Royal Society; and Founding Director Emeritus of the Max Planck Institute for the Biology of Ageing, said:
“The press release describes a study that is part of a clinical trial and is hence experimental rather than observational in nature, greatly reducing the likely involvement of confounders. The team previously found that intake of omega-3 alone reduced the rate of infections by 13% and the rate of falls by 10%, and that all three interventions (omega-3, vitamin D, exercise at home) combined had a significant additive benefit on reducing prefrailty by 39% and incident invasive cancer by 61% over a 3-year follow-up. The press release inadvertently gives the misleading impression that these findings came from the current study.
“The new study aimed to understand the molecular basis of the beneficial effects, and to develop biomarkers. Clinical trials that investigate the effects of interventions to improve health during ageing have two big challenges. First, there are multiple possible outcome measures because many aspects of health could be affected, and this can bring statistical problems. Second, it may take a long time for any benefits to become apparent. For both reasons, biomarkers are needed that report on the pathways to health improvements and that can predict clinical outcomes before they happen.
“The biomarkers investigated were derived from several well authenticated DNA methylation clocks. These clocks are trained to predict biological, as opposed to chronological age. Individuals differ in the speed of change in their DNA methylation clocks and can thus be characterised as slow or fast agers. These clock age deviations can be better predictors of time to death than chronological age.
“Omega-3 intake alone had slowed 3 of the 4 clocks used at the end of the 3-year trial period, and those individuals that started with lower omega-3 levels showed the largest response. All 3 treatments together slowed one of the 4 clocks. Omega-3 treatment thus had the greatest effect on the clocks. However, whether there is any direct link between the molecular events mediating the responses of the methylation clocks and the improvements in health awaits further study.
“The limitations of the work are well discussed. The study population was relatively healthy and homogeneous and longer term effects of the interventions are unknown. The study was well conducted, and consistent with other studies showing slowing of molecular biomarkers of ageing by interventions that improve health at later ages.”
Dr Julian Mutz, King’s Prize Research Fellow, King’s College London, said:
“Evaluating the effectiveness of preventative strategies and interventions in improving health span (i.e., how long individuals live in good health) is challenging due to the long human lifespan. Epigenetic aging clocks provide a proxy measure of biological aging and have the potential to play a crucial role in studies assessing such interventions. While most research on biological aging and health-promoting interventions has been cross-sectional (examining correlations between epigenetic age and factors such as diet at a single time point), this study provides important preliminary evidence that epigenetic aging may slow over three years in response to intervention.
“The authors identified a beneficial effect of daily omega-3 supplementation, particularly in individuals with lower baseline omega-3 levels. However, no such effect was observed for vitamin D or a three-day-per-week home exercise program. These findings contribute valuable new data but given the relatively small sample size (98 participants receiving omega-3 and 95 receiving a placebo) and the sample’s composition, which is healthier than the general population, the results should be considered preliminary. Future trials should aim to assess the generalisability of these findings, including in younger populations.”
Dr Mary Ni Lochlann, NIHR Research Fellow in Geriatric Medicine, Centre for Ageing Resilience in a Changing Environment, King’s College London, said:
“It’s exciting to see these results showing the benefits of omega-3, vitamin D and exercise on ageing. While the study was focused on healthy and active older adults, and led to a relatively small improvement in their ageing-biological-clocks, it adds to the growing evidence that these simple and fairly low-cost interventions are beneficial and, based on this and previous existing research, worth engaging in for adults as they get older.”
Prof Kevin McConway, Emeritus Professor of Applied Statistics, Open University, said:
“This is an interesting study. It has some important limitations, as the researchers themselves make clear. I think these put important boundaries around the evidence it can provide on the effects on aging of the treatments used in the clinical trial. There’s just too much that we don’t know yet.
“The press release mentions a key limitation, that there is no agreed gold-standard measure of biological aging. Because of that, the researchers concentrated on four different biological clocks, but they also presented results on another two older biological clock measures in the main research paper, and indeed present a few findings on another two in the supplementary data tables.
“These biological aging clocks were all developed by taking measurements of certain types of biomarker in large samples of people, and comparing them with the people’s chronological ages and death rates. But the details of how the developers of the clocks analysed these data and produced their biological aging measures were different from one another, and there isn’t (yet) agreement on the best way to do that. So the researchers on this new study analysed their data using several clocks, and reported the results from all of them.
“I think it makes good sense to look at several clocks, but we have to take into account that they give different information about the effect of the treatments in the trial, and it’s not possible to say that the findings from one biological clock are better than those from another clock.
“There is a certain amount of consistency on the findings, in that trial participants who took the omega-3 supplement had biological aging clocks that aged (on average) less over the three years of the study than was the case in people who didn’t take that supplement, at least for the main ‘clocks’ that the researchers considered. But there was a lot of statistical variability between people in how big this change in biological aging actually was, and there were also quite substantial differences in the estimates of the changes based on different biological clocks.
“One of the biological clocks produced the very neat finding that the three interventions in the trial (vitamin D supplements, omega-3 supplements, and a home exercise programme) seemed to add up in their effects, so that participants who had two of three interventions had more slowing of their biological clocks than those who had only one, and the clocks of those who had all three interventions had yet more slowing of their biological clocks.
“But that doesn’t mean that this particular clock is getting at an underlying truth more reliably than the other clocks, that don’t show this additive pattern. We just can’t say yet – because the study hasn’t yet produced relevant results beyond its three-year duration. The authors write, “Whether the DO-HEALTH treatments resulted in a persistent slowing of biological aging, leading to the prevention or delay of frailty and chronic disease beyond the 3-year follow-up, is currently unknown.” (DO-HEALTH is the name of this clinical trial.)
“Likewise, they mention that they don’t have data on long-term survival rates of the people in the study. Maybe one of the other clocks will eventually turn out to relate more closely to survival rates and future health. Maybe the pattern of how the effects of the three interventions combine will be different. We just can’t say yet.
“Also we can’t say whether the effect on biological aging clocks will continue after three years, because that wasn’t studied. Maybe taking omega-3 supplements for longer will have a greater impact on biological aging, or maybe it won’t. And the study doesn’t indicate what the effect on these biological clocks would be if people, who had been taking a supplement, stop taking it.
“This study is an interesting start, but there’s so much that it can’t tell us.
Further information
“Other findings from the same clinical trial have already been published, and some is mentioned in the new paper near the beginning. (There’s more at https://do-health.eu/.) For example, taking the omega-3 supplement reduced the rate of infections, and of falls. People who took both supplements and also participated in the home exercise programme, all together, had a substantial reduction in cancer diagnoses (61% over three years) compared to people who had none of these interventions, and also did better on measure called pre-frailty, based on weakness, fatigue, weight loss, low walking speed and low activity level.
“Whether people were classed as ‘robust’, pre-frail or frail depended on how many of these five measures were below par. (None below par meant they were robust, just one or two meant they were classified as pre-frail, more than that would classify them as frail.) The trial looked at people who started out as robust (that is, satisfactory on all these measures) and saw how many moved to being pre-frail or frail, and having all three interventions (the two supplements and the exercise) reduced pre-frailty by 39%. It didn’t have a clear effect on frailty, measured in this way, but that was probably just because very few participants moved from being robust all the way to frail in the three-year period.
“The press release seems (to me) to imply that these findings were part of the new research. They aren’t, though they do come from the same clinical trial and involved some of the same researchers. (Also, to nit-pick, the press release refers to ‘frailty’ whereas the findings are actually about pre-frailty, a somewhat different concept.).”
‘Individual and additive effects of vitamin D, omega-3 and exercise on DNA methylation clocks of biological aging in older adults from the DO-HEALTH trial’ by Heike A. Bischoff-Ferrari et al. was published in Nature Aging at 16:00 UK time on Monday 3 February 2025.
DOI: 10.1038/s43587-024-00793-y
Declared interests
Prof Dame Linda Partridge: “None.”
Dr Julian Mutz: “No COIs.”
Prof Kevin McConway: “Previously a Trustee of the SMC and a member of its Advisory Committee.”
For all other experts, no reply to our request for DOIs was received.
Source: State University Higher School of Economics – State University Higher School of Economics –
For the eighth year, the intellectual competition has been inviting talents from all over the country to become part of the universe of opportunities to receive bonuses upon admission to the HSE Master’s program, a chance to do an internship at partner companies (Yandex, VTB, Sber, Russian Railways and others) and cash prizes of up to 300,000 rubles. The results of the selection round are already known, and the final round is just around the corner. We share statistics and talk about important dates in February.
Of the 71 areas of this Olympiad season, six are implemented by the Higher School of Economics: Economics, Sociology, Urban Studies, Business Informatics, Journalism, and Design.
The qualifying stage has been completed
Based on the results of the selection round, 3,619 participants were admitted to participate in the following areas of the Higher School of Economics: Business Informatics – 558, Design – 429, Journalism – 348, Sociology – 983, Urban Studies – 419, and Economics – 882.
Participants who have scored the required number of points and presented a document confirming their student status are admitted to the final stage of the Olympiad. Passing scores may vary depending on the territorial affiliation of the university. More details are available at page.
Alexander Chepovsky, Director of Strategic Work with Applicants, shares statistics: “The Higher School of Economics has been the university organizing the Olympiad for the eighth year now.”I am a professional“Our areas traditionally enjoy great interest among students from all over Russia. For example, this year, almost 80% of students who passed to the next stage in our areas are studying at other universities in the country. Students of the Higher School of Economics showed decent results in the selection stage of the Olympiad “I am a professional” and were admitted to participate in the final stage in 70 areas. The range of interests is impressive and makes you wonder how versatile and talented the people at the HSE are.”
The final stage
The final stage in all areas will begin in February. It may be held in several rounds (semi-final and final) or in one (final) depending on each specific area.
“Business Informatics”
The final stage is held in two rounds in a remote format. The semi-final will take place on February 23 in two time slots: from 03:00 to 09:00 and from 10:00 to 16:00 Moscow time. Participants have the right to choose one most convenient slot. The completion time is fixed: participants who start completing tasks not from the beginning of the allocated interval will have less time.
“Design”
There is no semi-final in this area — only the final. Participants must upload completed projects to their personal account from 00:00 on February 17 to 23:59 on March 16 Moscow time. The defense of completed assignments will take place in April.
“Journalism”
Participants will have an online semi-final and final. In the first round, they must complete and upload their work from 00:00 on February 26 to 23:59 on March 3 Moscow time. The final will also be held in April.
“Sociology”
There is no semi-final in this category. Participants must complete the final round in person.
The competition will take place on February 15. The participants will gather and undergo the identification procedure from 09:30 to 09:50 Moscow time. The final will begin at 10:00 (Moscow time). You will have 240 minutes to complete the tasks.
The final will be held in the following cities: Barnaul, Vladivostok, Yekaterinburg, Kaliningrad, Krasnoyarsk, Moscow, Nizhny Novgorod, Novosibirsk, Perm, Rostov-on-Don, Samara, St. Petersburg, Stavropol, Tomsk, Tyumen and Yakutsk.
“Urban Studies”
The final stage will be held within one round (final) in person on February 16. The start is at 10:00 (Moscow time). You will have 240 minutes to complete the tasks.
The final of the direction will take place at venues in Vladivostok, Yekaterinburg, Kaliningrad, Moscow, Nizhny Novgorod, Perm, Rostov-on-Don, St. Petersburg and Tomsk.
“Economy”
The final stage of this direction is also held in person at sites in Barnaul, Vladivostok, Yekaterinburg, Kaliningrad, Krasnoyarsk, Moscow, Nizhny Novgorod, Novosibirsk, Perm, Rostov-on-Don, Samara, St. Petersburg, Stavropol, Tomsk, Tyumen and Yakutsk.
The final will take place on February 15. The competition starts at 10:00 Moscow time. Participants will have 180 minutes to complete the tasks.
You can find the materials of the final stage and a detailed schedule for each direction at website.
Alexander Chepovsky gives advice to the participants of the final competition: “When going through the final stage, I advise you to be attentive and focused. Stay calm to easily cope with any tasks. Remember that the best will receive not only cash prizes, but also advantages when entering the HSE Master’s program, as well as valuable experience that will help in finding a job and building a career.”
Please note: This information is raw content directly from the source of the information. It is exactly what the source states and does not reflect the position of MIL-OSI or its clients.
Headline: Apple Music kicks off Kendrick Lamar’s Road to Halftime ahead of Super Bowl LIX
February 3, 2025
PRESS RELEASE
Apple Music kicks off Kendrick Lamar’s Road to Halftime ahead of Super Bowl LIX
Tune in to the Apple Music Super Bowl LIX Halftime Show press conference for The Official Kendrick Lamar Interview on February 6 at 10 a.m. CT on Apple Music
CUPERTINO, CALIFORNIA Apple today announced Apple Music is celebrating Kendrick Lamar’s Road to Halftime with a spotlight on the era-defining artist who has made a seismic impact on hip-hop and culture.
Coming off of a remarkable year, Kendrick was among the top 10 artists of 2024 globally, with his latest album, GNX, soaring to No. 1 in 129 countries upon release, while “Not Like Us” was the top-streamed song on Apple Music worldwide. Throughout his career, Kendrick has seen nine albums top Apple Music’s top albums chart in more than 160 countries.
“Throughout his career, Kendrick Lamar hasn’t met the cultural moment so much as he’s defined it,” said Rachel Newman, Apple Music’s global head of content and editorial. “He is an artist’s artist — authentic to his core. We couldn’t be more thrilled to watch him headline the third Apple Music Super Bowl Halftime Show this year, in what’s sure to be another moment we’ll all be talking about for decades.”
Fans can get ready for the big event with a wide selection of music and exclusive content, from the first-look trailer Kendrick shared last month; to exclusive playlists curated by New Orleans musicians, NFL players, and teams; to over 100 hours of dedicated Apple Music Radio programming. It all leads up to the highly anticipated Apple Music Super Bowl LIX Halftime Show on Sunday, February 9, at the Caesars Superdome in New Orleans.
On Thursday, February 6, at 10 a.m. CT, Apple Music Radio hosts Ebro Darden and Nadeska Alexis will sit down with Kendrick at the Apple Music Super Bowl LIX Halftime Show press conference for the headliner’s official interview. Viewers can tune in live or watch on demand on Apple Music at apple.co/applemusichalftime or Apple Podcasts; on YouTube, Facebook, and X; or on the NFL Network.
Before the interview, fans can also tune in to the Apple Music Radio pre-show at 9:30 a.m. CT featuring Apple Music Radio hosts Zane Lowe and Eddie Francis, alongside Ebro and Nadeska. The live show will highlight Apple Music’s biggest moments of the past year and feature special guests during a look back at iconic halftime performances.
100 Hours of Programming on Apple Music Radio
The award-winning Apple Music Radio will be on the ground and in the stands for a full four-day takeover starting February 6 across New Orleans and Los Angeles. Exclusive programming will include daily “Live from Super Bowl LIX NOLA” broadcasts with Zane, Ebro, Nadeska, and Eddie as they shine a light on the city’s music culture while connecting with artists, athletes, and other notable voices. “Super Bowl LIX LA” broadcasts with Apple Music Radio hosts Hanuman, Brooke Reese, Estelle, Jayde Donovan, and newly added Evelyn Sicairos and Lechero will reflect on the New Orleans fanfare, as well as celebrate Kendrick’s music and hometown back in L.A.
“Kendrick Lamar: Hip-Hop’s MVP” hosted by Ebro will celebrate Kendrick’s catalog and take listeners on a chronological journey through the milestones in Kendrick’s career and discography.
And on Saturday before the game, Apple Music will bring the New Orleans club scene to listeners with mixes from NOLA DJs Legatron Prime, DJ Poppa, Mannie Fresh, and KLC the Drum Major. Mustard will spin a special Kendrick Lamar Megamix.
Available on Apple Music and Apple News, “The Story of Kendrick Lamar in 20 Songs” offers a captivating glimpse into Kendrick’s remarkable ability to continually redefine the tropes and forms of classic hip-hop.
Bonus Content from Shazam
Fans who use the Shazam app to identify Kendrick Lamar songs throughout the week leading up to the performance can access the Apple Music Super Bowl Halftime Show event page, where they’ll find bonus content like a custom Apple Watch face and iPhone wallpaper. They can also save the concert to receive timely reminders for the Set List playlist and photos from the show.
Apple Music’s Biggest Offer Ever
Those who are not yet subscribed can check out Apple Music’s biggest offer ever. For a limited time, new and eligible subscribers can get six months of Apple Music for $2.99.
More to Explore Across Apple Services
Across Apple services, fans can explore with Apple Maps Guides to New Orleans, catch up on the latest with Apple News, and get moving with a new Artist Spotlight series on Apple Fitness+.
New Ways to Navigate New Orleans with Apple Maps Last week, Apple Maps unveiled new ways visitors and locals alike can explore New Orleans, including a Detailed City Experience and 3D landmarks that bring to life some of the city’s most iconic locations — including Cafe Du Monde, the Steamboat NATCHEZ, and Caesars Superdome — in a visually stunning view. The Detailed City Experience delivers amazing details to help users navigate the city, including road markings, land cover, and public transit routes.
Apple Maps has also added a new Guide to its Hyperlocal series, this time curated by Lisa Jackson, Apple’s vice president of Environment, Policy, and Social Initiatives. Lisa shares some of her favorite spots for food, music, and more in her hometown of New Orleans.
All the Latest Updates on Apple News Starting today, Apple News will offer a dedicated hub that delivers special coverage of Super Bowl LIX. From media day to kickoff, fans will find the latest news on the game from local and national sports publishers like The Athletic, Sports Illustrated, The Kansas City Star, and The Philadelphia Inquirer.
NFL fans can also sign up for personalized news notifications to all of the week’s top football stories curated by the Apple News editors, and during the Super Bowl, the Apple News app will feature the latest highlights, as well as the buzziest commercials and halftime show.
With the free Apple Sports app for iPhone,1 fans can follow the big game in real time right on their Lock Screen with Live Activities,2 and go deeper in-app with full play-by-play information, team stats, box scores, and live betting odds.
A Special Fitness+ Artist Spotlight The Artist Spotlight series on Fitness+ dedicates entire workout playlists to a single artist, and the latest installment — available starting today — celebrates the music of Kendrick Lamar. This special series features Cycling, HIIT, Strength, Yoga, Pilates, and Kickboxing workouts, all set exclusively to his music.
Supporting Education and Creativity in New Orleans
Apple has long-standing community partnerships in New Orleans, with a focus on supporting education and creativity in the community. This includes working with the Ellis Marsalis Center for Music (EMCM) to expand access to youth music and technology education, helping Arts New Orleans provide opportunities for aspiring artists through their Young Artist Movement (YAM) program, and equipping students at Delgado Community College with the tools and resources to produce their own podcast about local culture and history. On Saturday, February 8, audiences around the world can tune in to the Super Bowl Host Committee Parade to see the Apple Music-sponsored float, designed on iPad by YAM artists and featuring the EMCM youth jazz ensemble.
About Apple Apple revolutionized personal technology with the introduction of the Macintosh in 1984. Today, Apple leads the world in innovation with iPhone, iPad, Mac, AirPods, Apple Watch, and Apple Vision Pro. Apple’s six software platforms — iOS, iPadOS, macOS, watchOS, visionOS, and tvOS — provide seamless experiences across all Apple devices and empower people with breakthrough services including the App Store, Apple Music, Apple Pay, iCloud, and Apple TV+. Apple’s more than 150,000 employees are dedicated to making the best products on earth and to leaving the world better than we found it.
Available in the U.S., the U.K., and Canada.
Live Activities require iOS 18 and watchOS 11 or later.
Save this page to your favourites to make sure you use the correct rate for each product in every excise return you lodge.
The tables on this page are a simplified version of the Schedule to the Excise Tariff Act 1921. For terms, refer to Alcohol excise and key terms.
We express excise duty rates per litre of alcohol (LAL) for alcoholic products.
When rates change
The law indexes the excise duty rates for alcohol twice a year, based on the upward movement of the consumer price index (CPI). The Australian Bureau of Statistics (ABS) is responsible for determining and publishing the CPI on or before the last Wednesday of the month following the relevant quarter. The current schedule of release dates can be found on the ABS websiteExternal Link.
Usually, indexation occurs on 1 February and 1 August. However, when the ABS doesn’t publish the CPI figure at least 5 days before indexation day, under the law, indexation day is effectively pushed back to the fifth day after publication.
As the CPI for this quarter was published on 29 January 2025, indexation day is 3 February. Table 1 below reflects the release dates and the relevant indexation days.
Table 1: CPI publication dates for 2025
Date of CPI publication
Date of CPI publication + 5 days
Indexation day
29 Jan 2025
3 Feb 2025
3 Feb 2025
30 July 2025
4 Aug 2025
4 Aug 2025
The CPI indexation factor for rates from 3 February 2025 is 1.004. Find out how rates are determined.
The excise duty rates may also change due to other law changes. The items in the following tables don’t apply to beverages you make for personal use, using non-commercial facilities and equipment, except for distilled spirits and beverages containing distilled spirits.
There are different excise duty rates for your alcoholic products depending on the alcohol content.
For beer, it also depends on the size and design of the container you package it in and if you produce it in commercial premises or a brew on premises shop.
Remember to apply the right rate to product that is delivered before and from the effective date (that is, the date the excise duty rate changes) when you lodge your return.
Excise duty on beer is payable on the alcohol content above 1.15% by volume in your finished product.
Table 2: Alcohol rates – beer
Tariff subitem
Unit: $ per litre of alcohol
Description
From 5 Aug 2024 to 2 Feb 2025
From 3 Feb 2025 to 3 Aug 2025
1.1
Alcohol volume not exceeding 3%, individual container:
less than 8 litres
8–48 litres (inclusive), and not designed to connect to a pressurised gas delivery system or pump delivery system.
52.66
52.87
1.2
Alcohol volume not exceeding 3%, individual container over 48 litres.
10.53
10.57
1.2
Alcohol volume not exceeding 3%, individual container of 8–48 litres (inclusive) and designed to connect to a pressurised gas delivery system or pump delivery system.
10.53
10.57
1.5
Alcohol volume exceeding 3% but not exceeding 3.5%, individual container:
less than 8 litres
8–48 litres (inclusive) and not designed to connect to a pressurised gas delivery system or pump delivery system.
61.32
61.57
1.6
Alcohol volume exceeding 3% but not exceeding 3.5%, individual container over 48 litres.
32.98
33.11
1.6
Alcohol volume exceeding 3% but not exceeding 3.5%, individual container of 8–48 litres (inclusive) and designed to connect to a pressurised gas delivery system or pump delivery system.
8–48 litres (inclusive) and not designed to connect to a pressurised gas delivery system or pump delivery system.
61.32
61.57
1.11
Alcohol volume exceeding 3.5%, individual container over 48 litres.
43.22
43.39
1.11
Alcohol volume exceeding 3.5%, individual container of 8–48 litres (inclusive) and designed to connect to a pressurised gas delivery system or pump delivery system.
43.22
43.39
1.15
Produced for non-commercial purposes using commercial facilities or equipment, alcohol volume not exceeding 3%.
3.70
3.71
1.16
Produced for non-commercial purposes using commercial facilities or equipment, alcohol volume over 3%.
4.26
4.28
Alcohol rates for spirits and other excisable beverages
Table 3: Alcohol rates – Other excisable beverages not exceeding 10% by volume of alcohol
Tariff item
Unit: $ per litre of alcohol
Description
From 5 Aug 2024 to 2 Feb 2025
From 3 Feb 2025 to 3 Aug 2025
2
Other excisable beverages not exceeding 10% by volume of alcohol.
103.89
104.31
Table 4: Alcohol rates – Spirits and other excisable beverages exceeding 10% by volume of alcohol
Tariff subitem
Unit: $ per litre of alcohol
Description
From 5 Aug 2024 to 2 Feb 2025
From 3 Feb 2025 to 3 Aug 2025
3.1
Brandy (a spirit distilled from grape wine in such a manner that the spirit possesses the taste, aroma and other characteristics generally attributed to brandy).
97.02
97.41
3.2
Other excisable beverages exceeding 10% by volume of alcohol.
103.89
104.31
3.5
Spirit that you have approval from us to use for fortifying Australian wine or grape must under section 77FD of the Excise Act 1901.
Free
Free
3.6
Spirit purchased in quantities by particular groups or professions we specified (such as pharmacists and universities) for an industrial, manufacturing, scientific, medical, veterinary or educational purpose under section 77FE of the Excise Act 1901.
Free
Free
3.7
Spirit that you have approval from us to use for an industrial, manufacturing, scientific, medical, veterinary or educational purpose under section 77FF of the Excise Act 1901.
Free
Free
3.8
Spirit denatured according to the formula we determined (except spirit used as fuel in an internal combustion engine).
Free
Free
3.10
Spirit not elsewhere included.
103.89
104.31
How rates are determined
We determine the new rates by applying the indexation factor to the most recently published rates.
The indexation factor is calculated by dividing the most recent June or December quarter CPI number (determined and published by the ABSExternal Link) by the previous highest June or December quarter CPI number occurring after the June 1983 quarter.
For example, the indexation factor for February 2025 was determined by dividing the December quarter 2024 (most recent to February 2025; 139.4) by the June quarter 2024 (June or December quarter with the highest value prior to December 2024; 138.8) to get 1.004.
Table 5: Calculating indexation factor for February 2025
Most recent CPI number
Highest previous June or Dec quarter
Indexation factor
December 2024 quarter
June 2024 quarter
February 2025
139.4
138.8
1.004
This indexation factor is applied to the current duty rate to determine the new duty rate.
For example, the duty rate for tariff item 2 ‘other excisable beverages not exceeding 10% by volume of alcohol’ was $103.89 for the period 5 August 2024 to 2 February 2025. This rate of $103.89 is multiplied by the indexation factor of 1.004 to determine the rate of $104.31 applicable from 3 February 2025.
Table 6: Calculating the new duty rate for February 2025 for tariff item 2
Source: The Conversation – UK – By Adam Hanieh, Professor of Political Economy and Global Development, Institute of Arab and Islamic Studies, University of Exeter
In early December 2024, hopes for a landmark global treaty to curb plastic pollution were dashed as negotiations in South Korea stalled. Leading the campaign against the deal were major oil-producing nations, especially Saudi Arabia and Russia, who argued for a more flexible approach to any legally binding limits on plastic manufacturing.
The collapse of any agreement came despite scientific research delivering ever more alarming warnings about the dangers of plastic pollution. Over the last two years, an avalanche of studies have revealed the pervasive presence of tiny plastic particles in human blood, brains, and even placental tissue.
These particles, which stem from the breakdown of larger plastic waste, have been linked to everything from inflammation to hormonal disruption, and potential long-term health risks such as cancer. Aside from their effects on human health, plastics are wreaking havoc on marine ecosystems, with microplastics now found in Arctic ice and in the bodies of fish and birds.
Behind these alarming studies stands a seemingly unstoppable juggernaut of plastic production. The annual global production of plastics reportedly grew nearly two hundredfold between 1950 (two million tonnes) and 2015 (381 million tonnes), and the pace of growth is accelerating.
Over half of all plastics ever made were produced in the past 25 years, and production levels are estimated to double or triple again by 2050. And more production brings more waste.
Less than 10% of all plastics ever produced have been recycled. And the volume of “mismanaged plastics” – those which are not recycled, incinerated, or sealed in landfills – is also estimated to double by 2050.
It seems as if humans have become the organic detritus within a plastic world of our own creation.
Plastic elephants
But despite growing awareness around the problems associated with plastic, there is a fundamental flaw in how we tend to think about it as a product.
For there is a tendency to frame plastic as a problem of pollution and recycling, rather than as an integral part of our fossil fuel-driven world. This narrative is also promoted by major oil companies, such as the American giant, ExxonMobil, which stated in the lead up to the South Korean summit: “The issue is pollution. The issue is not plastic.”
The problem with this perspective is that it obscures the fact that plastics are petrochemical products: substances which are ultimately derived from oil and gas.
Indeed, the future of fossil fuels is increasingly tied to the future of plastics. It has been estimated that by 2040, plastics will account for as much as 95% of net growth in oil demand.
This is perhaps why 220 fossil fuel lobbyists attended those recent treaty discussions, outnumbering all other delegations. It could also explain why Saudi Arabia, home to one of the world’s largest petrochemical companies, led the opposition to any global limits on plastic production.
At the core of capitalism
The problem we confront is not simply the presence of an oil lobby, it is the systemic role that plastics play within capitalism.
Plastics, and the wider petrochemical industry, played a crucial part in the transformation of global capitalism from the mid-20th century onwards.
As I explore in my book, Crude Capitalism, the things we used to need to build and make things previously relied on sourcing naturally occurring, labour-intensive goods like timber, cotton or metals. But the invention of plastics and other synthetic materials separated commodity production from nature.
Oil became more than a fuel – it was the substance that came to dominate our lives. A petrochemical shift to the rise of an oil-dominated world. With capitalism untethered from natural cycles, there was a radical reduction in the time taken to produce commodities and an end to any limits on the quantity and diversity of goods produced.
Along with this, consumption habits became centred around notions of disposability and obsolescence. Plastics made the essential features of contemporary capitalism possible: a drive to limitless growth, continual acceleration of production and consumption, and the frenzied expansion of markets.
The emergence of fast fashion is just one example. Alongside poorly paid garment workers in countries such as Bangladesh, really cheap clothing was only made possible through the massive expansion of polyester production (a kind of plastic), which freed the industry from its dependence on supplies of wool and cotton.
The consumption of plastics looms large in today’s ecological crisis. And having become so accustomed to thinking about oil and gas as primarily an issue of energy and fuel choice, perhaps we have lost sight of how much of our lives depend upon the products of petroleum.
These synthetic materials drove a post-war revolution in productivity, bringing labour-saving technology and mass consumption. It is now almost impossible to identify an area of life that has not been radically transformed by the presence of plastics and other petrochemicals.
Plastic products have become normalised as natural parts of our daily existence. And it is this paradox which must be fully confronted if we are to move beyond fossil fuels.
Adam Hanieh’s research into petrochemicals has been supported by a Political Economy Fellowship from the Independent Social Research Foundation (ISRF).
Source: United Kingdom – Executive Government & Departments
Millions of taxpayers filed their Self Assessment tax return for the 2023 to 2024 tax year by the deadline.
More than 11.5 million taxpayers filed their Self Assessment tax return by midnight on 31 January.
97.36% of tax returns were filed online.
90.53% of expected filers filed their Self Assessment.
More than 11.5 million taxpayers beat the Self Assessment deadline to file their tax return for the 2023 to 2024 tax year by 31 January and avoid a £100 late filing penalty, HM Revenue and Customs (HMRC) can reveal.
The number of people who filed their return on deadline day was 732,498, with the most common time being 16:00 to 16:59 when 58,517 people filed. Thousands left submitting their return until the very last minute when 31,442 filed between 23:00 and 23:59.
HMRC is urging anyone who has missed the deadline to file their tax return now and pay any tax owed. One of the quickest ways to pay is via the free and secure HMRC app. Time to Pay arrangements are available for those who cannot pay their tax bill in full. Late filing and late payment penalties are charged for failure to meet the deadline.
Myrtle Lloyd, HMRC’s Director General for Customer Services, said:
Thank you to the millions of people and agents who filed their Self Assessment tax return and paid any tax owed by 31 January. I’m urging anyone who missed the deadline, to submit their return as soon as possible to avoid any further penalties. Search ‘Self Assessment’ on GOV.UK to find out more.
The penalties for filing a tax return late are:
an initial £100 fixed penalty, which applies even if there is no tax to pay, or if the tax due is paid on time
after 3 months, additional daily penalties of £10 per day, up to a maximum of £900
after 6 months, a further penalty of 5% of the tax due or £300, whichever is greater
after 12 months, another 5% or £300 charge, whichever is greater
There are also additional penalties for paying late – 5% of the tax unpaid at 30 days, 6 months and 12 months. Interest will also be charged on any tax paid late.
If someone regularly sells goods or provides services through an online platform, they may need to pay tax on their income. Customers can find out more about selling online and paying taxes on GOV.UK by searching ‘online platform income’ or by downloading the HMRC app. The guidance will help them decide if their activity should be treated as a trade and if they need to complete a Self Assessment tax return.
Further information
Self Assessment 2025 facts summary:
12,026,540 Self Assessment returns expected
11,509,810 returns received by 31 January. This includes expected returns, voluntary returns and late registrations
10,887,810 expected returns received by 31 January
An estimated 1.1 million customers missed the deadline
11,205,810 returns were filed online (97.36% of returns, following adjustments)
304,000 paper tax returns were filed (2.64% of returns, following adjustments)
Voluntary returns/late registrations are an estimate based on returns received by early January and previous filing behaviour.
These figures are indicative and may be subject to further adjustments once all figures have been ratified.
Previous Self Assessment statistics:
11,581,962 returns received for the 2022 to 2023 tax year by 31 January 2024
11,351,289 returns received for the 2021 to 2022 tax year by 31 January 2023
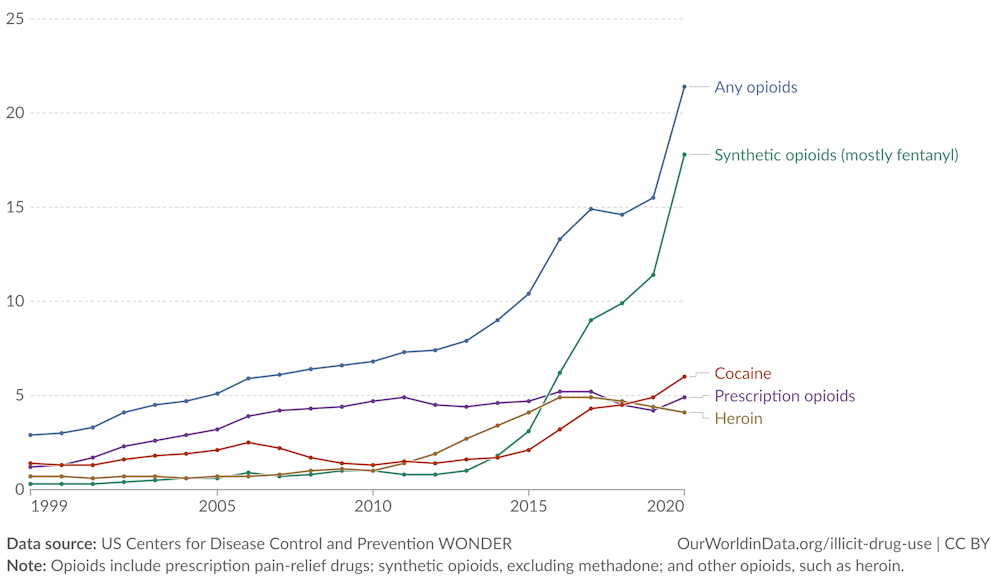