A new study has found a link between hormonal intrauterine devices (IUDs) and breast cancer.
The research is important, but media reports of a large increase in risk may be causing unnecessary worry.
Let’s put the findings in perspective for people who use IUDs.
What are IUDs?
IUDs are commonly used contraceptive devices. They sit inside the uterus (womb) to prevent pregnancy.
Older versions contain copper as their active ingredient. Newer “hormonal” IUDs slowly release a synthetic progesterone called levonorgestrel. This mimics the body’s natural progesterone hormone.
But the hormonal IUDs have the extra advantage of making periods lighter and less painful. Some people have one inserted for these reasons, even if they don’t need contraception.
Many women experience pain on insertion or spotting in the first few months of use. But compared to other contraceptives, women generally find IUDs very acceptable and continue to use them.
What did the new study find?
The new study, by researchers from Denmark, used data from national health registries to look for links between hormonal IUD use and breast cancer.
They tracked nearly 80,000 people who started hormonal IUDs across two decades. They compared these people to an equal number of people born at the same time who did not use hormonal IUDs.
On their raw numbers, you might think hormonal IUDs prevented breast cancer, because there were 720 cases of breast cancer in the hormonal IUD group, and nearly 900 in the other group. But that’s not the full story.
Ideally, when researchers study the effects of medicines, they do a “randomised controlled trial”, where researchers use chance to decide whether people get one treatment or another. This ensures the two groups are very similar apart from the treatment being studied. That’s not what happened here.
Instead, they simply studied people who had decided to have a hormonal IUD, and compared them to people who didn’t. This means the groups were different in many other ways.
So, the hormonal IUD group and the other group might appear to have a different risk of breast cancer – not because of the IUDs, but because of their other differences. For example, more highly educated women might be more likely to choose IUDs, and also more likely to attend breast cancer screening, where their breast cancer would be discovered.
The researchers “adjusted” their results to account for many differences between the two groups (including education, age, number of children, and some other medicines and medical conditions). After this “adjustment”, the numbers pointed in a different direction: towards a higher risk of breast cancer among people who used a hormonal IUD.
However, there are many other important risk factors for breast cancer the authors seem not to have adjusted for, such as body weight, alcohol use, smoking and physical activity. If there were differences between the two groups in these things, then the study’s results may still be biased. This makes me quite uncertain about the results.
Ultimately, we can’t say the IUDs caused the breast cancer – just that there’s an “association” or “link”.
There are two different ways researchers express risk: “relative” and “absolute” risks. Here, the “relative” risk increase was about 30% for women using the IUDs for up to five years, 40% after 5–10 years, and 80% after 10–15 years of use.
These sound like massive risks. But though these statistics compare the risk of breast cancer in IUD users to the risk in non-users, they do not tell us the proportion of women who will get breast cancer. For that, we need to look at “absolute” risk increases.
These are much smaller. For every 10,000 women, this study suggests we might see an extra 14 cases of breast cancer after up to five years of use, 29 cases after 5–10 years use, and 71 cases after 10–15 years use. In “absolute” terms – as a proportion of all the IUD users – all of these risk increases are comfortably under 1%.
Reporting the dramatic relative risks, and not the much smaller absolute risks, is a common flaw in stories about health risk, and goes against science reportingrecommendations.
What does other research say?
There are other studies on this topic, including a much larger recent study from Sweden based on data from more than half a million users of hormonal IUDs.
This suggested only a 13% relative risk increase in breast cancer – much smaller than the risk increases in the Danish study. This would mean an additional 1.46 cases of breast cancer for every 10,000 women per year.
This is in keeping with a recent large review of studies on this topic, which also found a much smaller risk than the new Danish paper.
The Swedish study also looked at other cancers. The results suggested a decreased risk of cancers of the cervix, ovaries and endometrium (womb lining). This mixed picture of some cancer risk and some cancer protection is also seen for traditional contraceptive pills.
And of course, all contraception protects women from the risks of pregnancy.
What does it mean for me?
The link between hormonal IUDs and breast cancer is probably very small, and might be a statistical illusion rather than a real thing.
Even if it’s a real risk, it may be offset by protection against other cancers.
And it may be dwarfed by other risks for breast cancer, such as high body weight, physical inactivity, alcohol use, and smoking. Online resources can help you visualise these risks.
Hormonal IUDs aren’t the right contraceptive choice for every woman. However, they deserve to stay high up on the menu of options.
Brett Montgomery is a GP who works academically and clinically. In his clinical work he sometimes discusses contraception with patients, including IUDs, but he does not insert IUDs himself. He has no commercial relationship with any IUD manufacturer.
MURRAY JONES [HOST]: Well, having lived in the regions for quite a few years, thankfully I had the opportunity to go to university, studied law actually, many, many years ago. But I remember hearing a statistic in recent times; of the people you may walk past, if you’re walking down Circular Quay in Sydney, one in two of the people that you pass, at least one in two, have a university degree or at least some form of tertiary education. You go further out, further out to the regions, the numbers get down to just one in five with a university degree or some form of tertiary education. It may even be even lower in some areas. So, particularly in the regional areas, getting further education facilities and opportunities, life changing for Australians. My special guest this morning, Assistant Minister for Education, also Assistant Minister for Regional Development, Agriculture, Fisheries and Forestry. He’s got quite the portfolio. Senator Anthony Chisholm joins me from Innisfail. Good morning, Anthony. How are you today?
ANTHONY CHISHOLM [ASSISTANT MINISTER]: Good, Murray, good to be with you again. And, yeah, a really telling introduction there as well about the challenges that many people in regional Australia face.
JONES: Yes, certainly when it comes to education. Look, you know, when we talk about, you know, obviously with the Queensland election, a lot of issues of crime, a lot of issues with respect to dysfunction that have come up, the better education, the better you are involved in society and doing things regardless of your age, you’re more likely to be staying off the street, not committing crime, and of course, negotiating this world when it comes to misinformation, disinformation, you know, a good education makes such a difference. So, the reason why you’re here and the reason why we’re talking to you, pretty exciting stuff, actually. Cassowary Coast Innisfail, the Cassowary Coast University Centre, has just been opened. The Innisfail facility, part of twelve new regional university study hubs that have been rolled out, Anthony.
CHISHOLM: Yeah, really exciting and real pleasure for me to be here today to help open the hub. It’s already got 30 students who are studying here and for me that’s 30 people who might not have taken on a higher education degree if they didn’t have access to the support that these regional university study hubs provide. So, full credit to the Cassowary Coast Council for having the vision. They’ve got a partner in Vocational Partnerships Group who are working with them to make this hub a reality and I’m expecting that it will achieve outstanding results. And those young people growing up in Innisfail who aspire to a higher education degree, what this hub means is that they don’t have to leave town to achieve it. They can stay in their local community, they can have their support network around them of family and friends. And the exciting thing is that the next nurse or teacher that we desperately need in this part of the world can stay and study locally, which is fantastic.
JONES: Now, it’s not a satellite university as such, I believe it’s not necessarily aligned with any particular university, but at the same time, it’s kind of aligned with all of them I understand.
CHISHOLM: Yeah, that’s correct. So, this is led by council and obviously they’ve got the partnership with the Vocational Partnerships Group as well. But the beauty of these hubs is they’ve been established around the country and there’s more than 40 operating around regional Australia at the moment, is you can walk into them, you can meet students and they’ll be studying at universities all across the country. And what they get from the hub is that support, that mentoring, that help in navigating, and a high percentage of these people studying are first in family. As you know, Murray, universities can quite often be daunting places when you first turn up or you first engage.
JONES: Sure.
CHISHOLM: So, having those people there to support, provide that network to ensure they can navigate and achieve their best results is really important. And that’s what these regional university study hubs are providing around the country. And it’s exciting that that’ll now be an opportunity for students from around the Innisfail area.
JONES: And look, I understand the statistics, more than 20 per cent of the Innisfail population identifying as First Nations people. So, I guess a great opportunity also for First Nations people to get involved in this particular hub.
CHISHOLM: That’s right. And one of the things that these hubs have been really successful at is getting out and attending the local high schools and talking to those younger students to give them that hope and ambition that they can actually study at university. It doesn’t mean you’ve got to move away from home. And I think it just opens those eyes and gives people a real incentive to know that they can do – they can study, they can achieve, but they can do it locally. And that, I think particularly with the cost of living at the moment and the challenge that it would be for someone moving away from home, I think having that opportunity to do that locally is tremendous.
JONES: Yeah, it certainly is. And look, you know, we’ve heard it many times over the years, some of the biggest issues certainly for Australians when it comes to elections, the things that they consider – education opportunities and obviously health, climate change, but particularly education, so important there. And look, you know, from a personal perspective, when it comes to identifying misinformation, disinformation and having an objective view on the world, I think education is just so important. And I’m sure I’ve mentioned to you before, my other half, she’s actually a schoolteacher as well. Can we touch on something? Even though you’re the Federal Assistant Minister for Education, there’s been a lot of talk about school lunches as part of the packages that have been put forward by various political parties. So, there’s been a bit of discussion there. Just in general terms, what do you think, particularly for primary school, for schools to actually be providing school lunches for students?
CHISHOLM: Yeah, it’s interesting, Murray, and I – as you’re aware, I’m Assistant Minister for Education, so I get to regularly engage with the schooling system around the country. My brother is actually a groundsman at a state school closer to Brisbane as well –
JONES: Okay.
CHISHOLM: – so I regularly get updates from him about what he’s up to. But the thing that I’ve noticed is that so many schools around the country are already doing this type of thing, whether it be breakfast programs, whether it be lunch for children. And I think it’s just reflective of the times that we’re in around people doing it tough. Parents are really busy, and there often are schools that are fitting the bridge. So, I can understand why the state thinks that this is a good program to implement across the country and make it more universal and accessible so that all schools have the opportunity to do it. But I think it would be fair to say, and I’m sure you’d get this if you talk to other primary schools, that there’s already something similar being offered across breakfast and lunch for most schools. So, extending that and operating it universally and making sure it’s accessible to everyone, I think is a good announcement by the state government.
JONES: And, you know, I often do hear it from my partner, you know, just basic things of having food for lunch, even having food the night before, having a clean uniform, all the textbooks, all the facilities and bits and pieces. Maybe not textbook these days, but I guess having those education facilities, you know, having them sorted out for kids is just so important so they can take that step and actually be very much involved in education. So, I’m sure when it comes to those lunches, that’s something we’ll be hearing about a lot more. Great to talk to you about this particular one. It’s the Cassowary Coast University Centre in Innisfail. Nice for you to be spending some time in the region and thank you so much for your time this morning, Anthony Chisholm. Cheers.
CHISHOLM: Thanks, Murray. Good to be with you again.
Here I look at decennial increases in total deaths by ‘generation’, where each generation is a ten-year birth cohort centred on a zero year. Featured generations are the ‘lucky generation’ (b. circa. 1940), post-war baby-boomers (b. circa. 1950), generation Jones (b. circa. 1960), generation X (b. circa. 1970) and generation Y (b. circa. 1980).
Table provided by Keith Rankin.
In Table 1 above we see that in 2020, 109% more people born around 1970 died than in 2010. The main reason for the increase is that these ‘Gen-X’ people were ten years older in 2020 than in 2010. Secondary reasons could relate to the net-immigration between those years for that age cohort, or could relate to the underlying health attributes of generation-X.
(Note that the ‘+’ in the labels arises because, due to data limitations, the definition of the generations used varies slightly for each year. Thus, for 2021, Gen-X is 1966-1976.)
We see that all of the followed generations show marked increases in the increases of deaths as we progress from 2020 to 2022, with the younger age cohorts showing increased increases in 2023 as well. Generation-X is highlighted as having the biggest increases in each of these four years: 2020, 2021, 2023, 2024. This suggests underlying health issues in this generation, or greater increases in net immigration for Gen-X (compared to say Gen-J or Gen-Y), or both.
On the matter of Gen-X net immigration, we note that immigrants must undergo health checks, so it’s likely that the death rates of Gen-X immigrants since 2010 are lower than the death rates of Gen-X non-immigrants. So it’s looking like there are significantly problematic health issues being experienced by Gen-X Aotearoans.
Table provided by Keith Rankin.
Table 2 focusses on just February to May data. These are the months in which death numbers are generally lowest. Older people tend to die more in winter, and younger people in summer. These are mainly autumn data. We also note that Table 2 allows us to access 2024 mortality data.
This is more worrying for Gen-X, because the data show higher rates of death increase from 2022, with an especially problematic number – a 170% increase in deaths – for 2024. These data definitely suggest there’s an underlying health problem, especially for that generation. The problem may be in two parts: underlying health status (eg incidence of chronic illnesses), and increased inadequacy of healthcare (including inability to access life-saving drugs).
Table provided by Keith Rankin.
Table 3 focusses on July and August only, the two main months for deaths attributable to respiratory infectious diseases. As we would expect, the older generations come out ‘tops’ in 2020 and 2021. But in 2022, the year the pandemic hit in New Zealand, it’s Gen-X again which has copped the biggest increases in deaths from infectious causes. Further, in 2023, it’s the younger generations – Gen-Y as well as Gen-X – that are showing the greatest increases in winter deaths. (Lack of access to Covid19 boosters might be part of the problem here.)
So, while yesterday’s charts might have showed that life-expectancy improvements have bottomed out after 2010, these table suggest that very recent mortality data is showing definite signs that life expectancies are starting to fall, with Gen-X – born around 1970 – taking the lead in this new development.
From the point of view of funding the healthcare system, not only is the aging of the population not being properly accounted for, but also substantial swathes of the bulging generations (generations J and X) are seemingly less healthy. We remember that deaths are only the ‘tip’ of the disease ‘iceberg’; mortality increases indicate underlying morbidity increases, and it is morbidity that places the greatest demands on healthcare.
(Is there a ‘sound’ fiscal argument for expanded access to euthanasia in the coming decades?!)
Keith Rankin (keith at rankin dot nz), trained as an economic historian, is a retired lecturer in Economics and Statistics. He lives in Auckland, New Zealand.
Source: Hong Kong Government special administrative region
The Centre for Food Safety (CFS) of the Food and Environmental Hygiene Department announced today (October 18) that in view of a notification from the Ministry of Agriculture, Forestry and Fisheries of Japan about an outbreak of highly pathogenic H5 avian influenza in Hokkaido Prefecture in Japan, the CFS has instructed the trade to suspend the import of poultry meat and products (including poultry eggs) from the area with immediate effect to protect public health in Hong Kong.
A CFS spokesman said that according to the Census and Statistics Department, Hong Kong imported about 1170 tonnes of frozen poultry meat and about 150.45 million poultry eggs from Japan in the first six months of this year.
“The CFS has contacted the Japanese authority over the issue and will closely monitor information issued by the World Organisation for Animal Health and the relevant authorities on the avian influenza outbreak. Appropriate action will be taken in response to the development of the situation,” the spokesman said.
Source: Hong Kong Government special administrative region
Statistics on Code on Access to Information for first quarter of 2024 Statistics on Code on Access to Information for first quarter of 2024 *********************************************************************
The Government received a total of 2 648 requests for information under the Code on Access to Information in the first quarter of 2024, a spokesman for the Constitutional and Mainland Affairs Bureau said today (October 18). The total number of requests received since the introduction of the Code in March 1995 and up to the end of March 2024 amounted to 124 876. Of these, 7 544 requests were subsequently withdrawn by the requestors and 6 235 requests covered cases in which the bureaux/departments concerned did not hold the requested information or cannot confirm or deny the existence of information. As at March 31, 2024, 613 requests were still being processed by bureaux/departments. Among the 110 484 requests which covered information held by bureaux/departments and which the bureaux/departments had responded to, 107 247 requests (97.1 per cent) were met, either in full (104 313 requests) or in part (2 934 requests), and 3 237 requests (2.9 per cent) were refused. Any member of the public who is dissatisfied with the response of a bureau/department under the Code may request that the matter be reviewed. He or she may also lodge a complaint with the Ombudsman. In the first quarter of 2024, the Ombudsman received 14 complaints relating to requests for information. In this quarter, the Ombudsman concluded 23 complaints, among which two were unsubstantiated, one was partially substantiated and 20 were concluded by inquiries (including seven cases with inadequacies found). As at March 31, 2024, the Ombudsman’s investigations on 11 complaints were ongoing. “The Code has provided an effective framework for the public to seek access to information held by the Government,” the spokesman said.
Source: United Kingdom – Executive Government & Departments
Ambassador to work with employers to help women experiencing menopause symptoms to stay in work and progress in their careers.
Leading campaigner and broadcaster Mariella Frostrup appointed as Government’s new Menopause Employment Ambassador.
Appointment comes alongside measures in the Employment Rights Bill requiring large employers to produce plans on how they will support employees through the menopause.
Journalist and women’s equality campaigner, Mariella Frostrup, has been appointed as the government’s new Menopause Employment Ambassador.
The voluntary role will see Mariella working closely with employers across the country to improve workplace support for women experiencing the menopause, raise awareness of the symptoms and champion the economic contributions of women. A key focus will be helping women going through the menopause stay in work and progress in their careers.
Almost 70% of women aged 40 to 60 in employment experiencing menopausal symptoms report this has a negative effect on them at work, and just over 50% are unable to go into work at some point due to menopause symptoms.
With decades of experience championing women’s rights and gender equality across the world, with passionate advocacy for increased awareness of the symptoms of menopause, Mariella brings a powerful and unique voice to the Department for Work and Pensions.
Work and Pensions Secretary Liz Kendall said:
If we are going to get our country growing again, we have to make sure that everyone feels they can thrive at work. I know from personal experience how hard it can be for women going through menopause.
I’m so thrilled that Mariella will be working with us to bring her years of knowledge and experience on this issue, so we can make sure that all women experiencing menopause symptoms get the support they need at work.
I’m honoured and delighted to be appointed as the Government’s Menopause Employment Ambassador and to start working towards this government’s stated goal of creating fair and equitable workplaces for all.
The loss of one in ten women from the workplace, often at the height of their professional careers, is damaging our economy and causing unnecessary suffering due to lack of information and support during this perfectly natural and manageable phase of life.
I’m excited to get started and continue the important work done by my predecessor Helen Tomlinson to engage with businesses small and large and find solutions to what continues to be a gender specific inequity.
Baroness Merron, Minister for Patient Safety, Women’s Health and Mental Health, said:
I am delighted that Mariella Frostrup has been appointed into this important role. I look forward to working with her to champion women’s health and improve menopause support, alongside the Women’s Health Ambassador for England, Professor Dame Lesley Regan.
We know there is a long way to go in improving support for women experiencing menopause, particularly in the workplace, and this government is committed to providing the care and support for all women to thrive.
Janet Lindsay, Chief Executive of Wellbeing of Women:
We are delighted that Mariella has been appointed as the new Menopause Employment Ambassador. As Wellbeing of Women’s ambassador and in her wider work, Mariella has been a tireless campaigner working to raise awareness of the need to support women going through the menopause in all areas of life.
We look forward to working with her to help all employers become more menopause friendly, especially those who often struggle to do so, such as small to medium businesses and those employing women who cannot work remotely.
This appointment comes as the government has proposed a wide-ranging set of generational reforms to boost protections for workers, including women experiencing menopause symptoms at work. The policy proposals in the Employment Rights Bill would require large employers to produce Menopause Action Plans on how they will support employees through the menopause.
Further Information
The position of Menopause Employment Ambassador has been appointed by and will work with the Secretary of State for Work and Pensions, reporting at regular intervals.
Current account recorded €31 billion surplus in August 2024, down from €41 billion in previous month
Current account surplus amounted to €408 billion (2.8% of euro area GDP) in the 12 months to August 2024, up from €138 billion (1.0%) one year earlier
In financial account, euro area residents’ net acquisitions of non-euro area portfolio investment securities totalled €510 billion and non-residents’ net acquisitions of euro area portfolio investment securities totalled €718 billion in the 12 months to August 2024
Chart 1
Euro area current account balance
(EUR billions unless otherwise indicated; working day and seasonally adjusted data)
Source: ECB.
The current account of the euro area recorded a surplus of €31 billion in August 2024, a decrease of €10 billion from the previous month (Chart 1 and Table 1). Surpluses were recorded for goods (€32 billion) and services (€19 billion). Deficits were recorded for secondary income (€15 billion) and primary income (€ 4 billion).
Table 1
Current account of the euro area
(EUR billions unless otherwise indicated; transactions; working day and seasonally adjusted data)
Source: ECB.
Note: Discrepancies between totals and their components may be due to rounding.
In the 12 months to August 2024, the current account surplus widened to €408 billion (2.8% of euro area GDP), up from €138 billion (1.0% of euro area GDP) one year earlier. This increase was mainly driven by a larger surplus for goods (up from €147 billion to €379 billion), and, to a lesser extent, by larger surpluses for services (up from €129 billion to €162 billion) and primary income (up from €29 billion to €33 billion). The secondary income deficit remained broadly stable (slightly down from €166 billion to €165 billion).
Chart 2
Selected items of the euro area financial account
(EUR billions; 12-month cumulated data)
Source: ECB.
Notes: For assets, a positive (negative) number indicates net purchases (sales) of non-euro area instruments by euro area investors. For liabilities, a positive (negative) number indicates net sales (purchases) of euro area instruments by non-euro area investors.
In direct investment, euro area residents made net disinvestments of €196 billion in non-euro area assets in the 12 months to August 2024, declining from net disinvestments of €324 billion one year earlier (Chart 2 and Table 2). Non-residents disinvested €358 billion in net terms from euro area assets in the 12 months to August 2024, decreasing from net disinvestments of €471 billion one year earlier.
In portfolio investment, euro area residents’ net purchases of non-euro area equity increased to €105 billion in the 12 months to August 2024, up from €56 billion one year earlier. Over the same period, net purchases of non-euro area debt securities by euro-area residents rose to €406 billion, up from €361 billion one year earlier. Non-residents’ net purchases of euro area equity increased to €324 billion in the 12 months to August 2024, up from €208 billion one year earlier. Over the same period, non-residents’ net purchases of euro area debt securities widened to €395 billion, up from €370 billion one year earlier.
Table 2
Financial account of the euro area
(EUR billions unless otherwise indicated; transactions; non-working day and non-seasonally adjusted data)
Source: ECB.
Notes: Decreases in assets and liabilities are shown with a minus sign. Net financial derivatives are reported under assets. “MFIs” stands for monetary financial institutions. Discrepancies between totals and their components may be due to rounding.
In other investment, euro area residents recorded net acquisitions of non-euro area assets amounting to €204 billion in the 12 months to August 2024 (following net disposals of €73 billion one year earlier), while they recorded net disposals of liabilities of €248 billion (down from €280 billion one year earlier).
Chart 3
Monetary presentation of the balance of payments
(EUR billions; 12-month cumulated data)
Source: ECB.
Notes: “MFI net external assets (enhanced)” incorporates an adjustment to the MFI net external assets (as reported in the consolidated MFI balance sheet items statistics) based on information on MFI long-term liabilities held by non-residents, available in b.o.p. statistics. B.o.p. transactions refer only to transactions of non-MFI residents of the euro area. Financial transactions are shown as liabilities net of assets. “Other” includes financial derivatives and statistical discrepancies.
The monetary presentation of the balance of payments (Chart 3) shows that the net external assets (enhanced) of euro area MFIs increased by €541 billion in the 12 months to August 2024. This increase was mainly driven by the current and capital accounts surplus and, to a lesser extent, by euro area non-MFIs’ net inflows in portfolio investment debt, portfolio investment equity and other investment. These developments were partly offset by euro area non-MFIs’ net outflows in direct investment and other flows.
In August 2024 the Eurosystem’s stock of reserve assets increased to €1,288.4 billion up from €1,282.8 billion in the previous month (Table 3). This increase was mainly driven by positive price changes (€15.4 billion), mostly due to an increase in the price of gold. This development was partly offset by negative exchange rate changes (€6.8 billion) and net sales of assets (€3.0 billion).
Table 3
Reserve assets of the euro area
(EUR billions; amounts outstanding at the end of the period, flows during the period; non-working day and non-seasonally adjusted data)
Source: ECB.
Notes: “Other reserve assets” comprises currency and deposits, securities, financial derivatives (net) and other claims. Discrepancies between totals and their components may be due to rounding.
MILES AXLE Translation. Region: Russian Federation –
Source: State University Higher School of Economics – State University Higher School of Economics –
A first-year student of the ICEF International Bachelor’s Program in Economics and Finance, Georgy Khvatkin, won gold at the World Youth Championship in Combat Sambo. The competition was held in Larnaca, Republic of Cyprus, and was attended by 575 athletes from 33 countries. Georgy won in the 98 kg weight category. In an express interview with the champion, Master of Sports Georgy Khvatkin, we talk about how the important decision to enter ICEF was made, how long and how many days a week Georgy has been training, what Jackie Chan has to do with it, and how great it is to have a beloved twin sister.
From the personal archive of Georgy Khvatkin
– Georgy, congratulations on your gold, we are proud of such a student! How and why did you decide to enter ICEF? What were your guidelines?
– Entering ICEF was a conscious decision. My parents found out about ICEF first. They both graduated from the Philology Department of Moscow State University, and then my dad got a law degree, and my mom got an economics degree. My mom is very knowledgeable about economics and helped us choose a profession. We studied the information together and considered all the possibilities. An important factor was studying in English and getting a second diploma. We decided that this opened up great prospects. We did not consider other universities. My sister Katya and I (we are twins) prepared for the Unified State Exam and admission over the course of four school years.
My sister and I graduated from the Moscow Russian-British school “Algorithm”, where we transferred in the seventh grade, with gold medals. And now we both study in the same bachelor’s degree group at the International Institute of Economics and Finance. Katya is my best friend. By the way, she is also successful in sports, she is a candidate for master of sports in synchronized swimming.
– The school year has started intensively. Which subjects are coming to the forefront in terms of interest?
– All subjects are interesting to me, all of them “caught” my attention. Largely thanks to the teaching staff. It feels like the teachers are professionals in their field, I value them all very much. I would like to separately mention Yaroslav Aleksandrovich Lyulko, who teaches “Probability Theory and Statistics”. It seems to me that this subject opens up the greatest opportunities for me as a student.
The first few days were, of course, a bit difficult, considering how much sport there is in my life. It was also difficult because I was faced with topics that were completely new to me, but with the help of teachers and friends I figured it out and found solutions.
I have the best group (I guess everyone says so?!): cool guys with whom I have many common interests. I already felt that ICEF is one big family, where teachers, classmates, senior students help each other.
Studying in English turned out to be easier than I thought. I have been studying the language intensively since early childhood, and the introductory intensive course in English at the beginning of September also helped me a lot.
– Now about your sports career. Why did you start doing sambo and how do your trainings go?
Initially, I was involved in swimming. My dad played water polo all his life, my sister did synchronized swimming, a pool was always present in our life. And when I got interested in action movies with Jackie Chan at the age of 6-7, I became interested in martial arts. But for some reason I formulated that I wanted to do wrestling, and my dad sent me to the sambo section.
In everyday life, when there are no competitions, I train 4-5 times a week on weekdays. During the preparation period for competitions, I start to increase the pace two months in advance. Specifically, before the Youth World Combat Sambo Championship in Larnaca, I trained two to three times a day for a month, including independent training in the form of jogging.
– You train at the famous Sambo-70 club, and where else?
I train in different clubs. This allows me to quickly acquire different techniques, improve in different directions. My main coach is Honored Coach of Russia Nikolay Anatolyevich Elesin, an absolute authority in the world of MMA and combat sambo. I also train at the “Boxing Progress Center” with Ali Piduriyev, and sometimes I go to wrestling days at the “Club of Professor E.L. Gloriozov”, where I work with coach Denis Igorevich Davydov.
– Were there moments when you wanted to quit sambo?
Yes, it happened several times. At some point, a lot of studying piled up, and in sports there were offensive and annoying defeats. I want to note the enormous support of the whole family, which did not let me do this, for which I am incredibly grateful to them all.
– Do you have any idols in sports?
I don’t really like the word “idol”. As I understand it, this word means to elevate someone to the level of a deity. There are people I look up to and who I like in sports. First of all, this is the legend of Russian sports Fedor Emelianenko, a four-time world champion in combat sambo. I really like the style of work on the mat of the famous sambo wrestler Denis Goltsov. I follow all his performances, try to adopt some of his techniques.
– Out of the one and a half months of your student life, you trained two or three times a day, five days a week. How much time was left for studying? How do you manage to combine such different intensive loads?
Of course, it is very difficult to combine sports and studies. I have to integrate training into my study schedule, so my schedule is always flexible – sometimes I will work out in the morning, sometimes more in the evening. Before tests and quizzes I reduce the number of trainings, and when it comes to studying I sometimes resort to the help of my parents, sister and friends.
The life of a student and an athlete are similar in many ways, because it is a huge amount of independent work that you have to do. To do this, you simply need to master time management: you need to distribute your time literally by the hour in advance, so that you can do everything, and save energy somewhere, and have time to recover.
Every week I create a schedule for the entire week to help me productively combine both studying and training.
Now the loads in sports will decrease. But periods of high intensive load in my life are inevitable. I have to sacrifice my personal life – I manage to meet with friends once a month. This year, due to preparation for the World Championship, I unfortunately missed all the selections for student organizations that I would like to join. I hope I will have time next year.
And for the sake of sporting honor, the IIEF is always ready to participate in competitions.
– Have you ever found yourself in situations where circumstances pushed you to use your athletic skills in life?
There are situations in life when you are provoked or you see that other people are provoked. I am sure that a truly strong person is not the one who knows how to fight and use physical force, but the one who knows how to resolve any issue in a conversation, in a dialogue. I believe that an athlete at such a level has no right to use his professional skills in life.
– The student champion will hardly be able to rest on his laurels. What are your immediate plans?
In sports, it is the Moscow Championship, selection for the Russian Championship, if we manage to win, we will go to the World Championship again. I still have 2 years to compete in juniors. It is very serious preparation before competitions in the senior age group, where I will have to compete with seasoned athletes. In terms of studies, it is midterms, exams. I would like to pass everything well and continue studying.
– Georgy, thank you and further victories in everything!
Please note: This information is raw content directly from the source of the information. It is exactly what the source states and does not reflect the position of MIL-OSI or its clients.
Please note; This information is raw content directly from the information source. It is accurate to what the source is stating and does not reflect the position of MIL-OSI or its clients.
Source: Hong Kong Government special administrative region
CSSA caseload for September 2024 CSSA caseload for September 2024 ********************************
The overall Comprehensive Social Security Assistance (CSSA) caseload in September showed a drop of 758 cases, representing a decrease of 0.4 per cent compared with that of August, according to the latest CSSA caseload statistics released by the Social Welfare Department today (October 18). The total CSSA caseload at the end of September stood at 197 013 (see attached table), with a total of 264 829 recipients. Analysed by case nature, low-earnings cases registered a month-to-month decrease of 2.9 per cent to 1 425 cases. Single parent cases decreased by 1.4 per cent to 19 549 cases. Unemployment cases declined by 0.7 per cent to 16 459 cases. Permanent disability cases dropped by 0.4 per cent to 16 936 cases. Ill-health cases dropped by 0.3 per cent to 27 974 cases. Old age cases slightly decreased by 0.1 per cent to 110 777 cases.
Source: The Conversation – UK – By Austin Kay, Researcher in Sustainable Advanced Materials, Centre for Integrative Semiconductor Materials, Swansea University
As the world races to meet net-zero targets, emissions from all industrial sectors must be reduced more urgently than ever. Agriculture is an important area of focus as it contributes up to 22% of global greenhouse gas emissions – almost as much as the energy sector.
One approach to decarbonising the agricultural sector is agrivoltaics. It involves integrating solar panels – or photovoltaics (PVs) – into fields of crops, greenhouses and livestock areas, which can help farmers reduce their carbon footprint while continuing to produce food.
Agrivoltaics can also mitigate one of the main criticisms often made of solar power – that solar farms “waste” vast tracts of agricultural land that could otherwise be used for food production. In reality, solar farms currently occupy only 0.15% of the UK’s total land – not much compared to its 70% agricultural land.
The simplest example of an agrivoltaic system would be conventional, crystalline silicon PVs (the market-leading type of solar panels), installed in fields alongside livestock. This method of farm diversification has become increasingly popular in recent years for three main reasons.
First, it enhances biodiversity as the fields are not seeing a regular crop rotation, being monocultured, or being harvested for silage. Second, it increases production as livestock benefit from the shade and the healthier pasture growth.
Finally, the solar farm has reduced maintenance costs because livestock can keep the grass short. All this is achieved while the solar panels provide locally-generated, clean energy.
But if they’re not set up properly, agrivoltaics may cause problems. One of the most important challenges is balancing the need for sunlight between crops and solar panels. Crops need light to grow, and if solar panels block too much sunlight, they can negatively impact crop yields.
This issue varies from place to place. In countries with fewer sunny days like the UK, the panels need to let more sunlight through. But in places like Spain or Italy, some shade can actually help crops by reducing the stress of intense heat during summer months. Finding the right balance is tricky, as it depends on local conditions, the type of crop, and even the needs of pollinators like bees.
The complexity deepens when we consider the type of PV material used. Traditional solar panels aren’t always suitable because they often block the wavelengths (colours) of light needed by plants.
This is where newer materials, like organic semiconductors and perovskites, are ideal as they can be customised to let crops get the light they need while still generating energy. Unlike traditional inorganic semiconductors, which are essentially crystals of metal and metalloid atoms, organic semiconductors are molecules mainly made of carbon and hydrogen. Perovskites, meanwhile, are like a hybrid of the two.
But there are thousands of combinations of these materials to choose from, with scientific literature containing a plethora of options. Figuring out which one works best can be a daunting task.
This is where computational tools can make a big difference. Instead of testing each material in real-world conditions – which would take years and be incredibly expensive – researchers can use simulations to predict their performance. These models can help identify the best materials for specific crops and climates, saving both time and resources.
The tool
We have developed an open-source tool that helps compare various PV materials, making it easier to identify the best options for agrivoltaics. Our tool uses geographical data and realistic simulations of how different PV materials perform.
It considers how light travels through these materials and reflects off them, as well as other important performance measures like voltage and power output. The tool can also take lab-based measurements of PV materials and apply them to real-world scenarios.
Using this tool, we simulated how much power different PV materials could generate per square metre over the course of a year, across various regions. And we calculated how much light passed through these materials to ensure it was enough for crops to thrive.
By running these simulations for multiple materials, we could identify the most suitable options for specific crops and climates.
Tools like ours could play a critical role in decarbonising the agricultural sector by guiding the design of agrivoltaic systems. Future research could combine these simulations with economic and environmental impact analyses. This would help us understand how much energy we can expect from a solar panel over its lifetime compared to the resources and costs involved in producing it.
Ultimately, our tool could help researchers and policymakers in selecting the most efficient, cost-effective and eco-friendly ways to decarbonise agriculture and move us closer to achieving global net-zero emissions.
Don’t have time to read about climate change as much as you’d like?
Austin Kay is a Postgraduate Student at Swansea University and receives funding from the Engineering and Physical Sciences Research Council (EPSRC) through program grant EP/T028513/1 Application Targeted and Integrated Photovoltaics.
A drone photo shows machinery at a port in Lianyungang City, east China’s Jiangsu Province, May 27, 2024. [Photo/Xinhua]
China’s gross domestic product (GDP) grew 4.8 percent year on year in the first three quarters of 2024, data from the National Bureau of Statistics (NBS) showed Friday.
The GDP reached around 94.97 trillion yuan (about 13.33 trillion U.S. dollars) in the January-September period, NBS data showed.
In the third quarter, the economy expanded 4.6 percent year on year and went up 0.9 percent on a quarterly basis, according to the NBS.
Despite a complicated external environment and emerging challenges at home, the Chinese economy has posted generally stable performance, Sheng Laiyun, deputy head of the NBS, told a press conference Friday.
“Positive factors driving a steady economic recovery accumulated and increased in September,” Sheng said, stressing that most indicators on production and demand improved and market expectations also became better.
In a breakdown, industrial output climbed 5.8 percent compared with a year earlier in the first nine months, as robust increases were seen in equipment and high-tech manufacturing industries. The service sector reported continued recovery with a 4.7-percent increase in added value.
Consumption maintained an upward trend during the period with retail sales of consumer goods up 3.3 percent from a year ago. Fixed-asset investment rose 3.4 percent, spurred by vibrant capital influx into high-tech industries.
The job market was stable as the surveyed urban unemployment rate on average stood at 5.1 percent in the first three quarters, down from 5.3 percent a year ago. The nominal growth of urban and rural residents’ incomes came in at 5.2 percent.
While there have been positive changes in major economic indicators, Sheng noted that the external environment has become more complex, and that economic recovery needs to be further consolidated.
More efforts will be made to strengthen the coordination of existing and incremental policies and push for the swift and effective policy implementation in a bid to achieve the full-year economic and social development targets, Sheng added.
China’s retail sales of consumer goods went up 3.3 percent year on year in the first three quarters of this year, the National Bureau of Statistics (NBS) said Friday.
The country’s retail sales of consumer goods totaled 35.3564 trillion yuan (about 4.96 trillion U.S. dollars) during the period, data from the NBS showed.
During the first three quarters of the year, rural consumption gained 4.4 percent year on year, and the catering sector saw its revenue rise by 6.2 percent.
Online sales remained a bright spot, rising by 8.6 percent year on year in the January-September period. In particular, sales of physical goods increased by 7.9 percent and accounted for a quarter of total retail sales during the period.
Pro-consumption policies, including the consumer goods trade-in program, have played a significant role in unleashing the domestic demand, Sheng Laiyun, deputy director of the NBS, told a press conference.
China introduced a large-scale equipment upgrade and consumer goods trade-in program in March this year to expand domestic demand and shore up the economy, and stepped up policy support in July with an extra funds injection of 300 billion yuan via ultra-long special treasury bonds.
Boosted by the policies, retail sales rose 3.2 percent year on year in September alone, with sales of automobiles reversing months of decline and edging up 0.4 percent year on year, Sheng said.
Home appliance sales saw a notable 20.5-percent jump in September, up 17.1 percentage points from the previous month.
Sheng noted that while some policies need time to fully take effect, he called for local authorities to expedite their implementation to further consolidate the economy’s recovery momentum.
Major Chinese cities saw a stabilization in the price decline of commercial residential homes in September, along with improved expectations for the property sector, official data showed on Friday.
The decline in the prices of commercial residential homes in China’s 70 large and medium-sized cities stabilized on a month-on-month basis last month, according to the National Bureau of Statistics (NBS).
In the country’s first-tier cities, namely Beijing, Shanghai, Guangzhou and Shenzhen, new home prices edged down by 0.5 percent, compared with a 0.3-percent drop in the previous month. Second- and third-tier cities both registered declines of 0.7 percent month on month.
In September, prices of second-hand homes fell by 1.2 percent in first-tier cities month on month, and 0.9 percent in second-tier and third-tier cities, the NBS said.
“Since late September, confidence in the property market has strengthened and expectations have improved,” said Wang Zhonghua, chief statistician of the Department of Urban Surveys of the NBS, citing a monthly questionnaire survey conducted in 70 large and medium-sized cities.
The survey showed that 58.3 percent of respondents expect new commercial residential housing prices to remain stable or rise in the next six months, while 45.4 percent expect the same for second-hand residential housing.
Compared to the results of the previous month’s survey, these figures have increased by 10 and 6.5 percentage points, respectively.
“China’s real estate market has started bottoming out after three years of adjustment,” Minister of Housing and Urban-Rural Development Ni Hong said at a press conference on Thursday.
“Particularly, since the end of September, there has been a significant increase in the number of visits to new property projects and in the number of sale contracts. Transactions on pre-owned homes have also gone up. There have been positive changes in the market,” Ni said.
China has rolled out a slew of policies to bolster the real estate sector, including cutting minimum down payment ratios, abolishing the commercial mortgage rate floors for first and second homes, and establishing a re-lending facility that supports local state-owned enterprises in using such funds to purchase commercial homes for affordable housing.
China’s job market remained generally stable in the first three quarters of 2024 as the surveyed urban unemployment rate dropped on a year-on-year basis, official data showed on Friday.
The surveyed urban unemployment rate on average stood at 5.1 percent in the first three quarters, down 0.2 percentage points from the same period last year, the National Bureau of Statistics (NBS) said in a statement.
In September, the surveyed urban unemployment rate in the country came in at 5.1 percent, down 0.2 percentage points from the previous month.
This year, Chinese authorities have stepped up efforts to stabilize employment, particularly the employment of college graduates, Sheng Laiyun, deputy head of the NBS, told a press conference.
While overall employment faces some pressure, the job market remains stable, Sheng noted, citing continued economic growth, the expanding service sector, and demographic changes as contributing factors.
Sheng also acknowledged that structural problems remained, urging further efforts in driving stable economic growth and creating more jobs to promote high-quality full employment.
Current account recorded €31 billion surplus in August 2024, down from €41 billion in previous month
Current account surplus amounted to €408 billion (2.8% of euro area GDP) in the 12 months to August 2024, up from €138 billion (1.0%) one year earlier
In financial account, euro area residents’ net acquisitions of non-euro area portfolio investment securities totalled €510 billion and non-residents’ net acquisitions of euro area portfolio investment securities totalled €718 billion in the 12 months to August 2024
Chart 1
Euro area current account balance
(EUR billions unless otherwise indicated; working day and seasonally adjusted data)
Source: ECB.
The current account of the euro area recorded a surplus of €31 billion in August 2024, a decrease of €10 billion from the previous month (Chart 1 and Table 1). Surpluses were recorded for goods (€32 billion) and services (€19 billion). Deficits were recorded for secondary income (€15 billion) and primary income (€ 4 billion).
Table 1
Current account of the euro area
(EUR billions unless otherwise indicated; transactions; working day and seasonally adjusted data)
Source: ECB.
Note: Discrepancies between totals and their components may be due to rounding.
Data for the current account of the euro area
In the 12 months to August 2024, the current account surplus widened to €408 billion (2.8% of euro area GDP), up from €138 billion (1.0% of euro area GDP) one year earlier. This increase was mainly driven by a larger surplus for goods (up from €147 billion to €379 billion), and, to a lesser extent, by larger surpluses for services (up from €129 billion to €162 billion) and primary income (up from €29 billion to €33 billion). The secondary income deficit remained broadly stable (slightly down from €166 billion to €165 billion).
Chart 2
Selected items of the euro area financial account
(EUR billions; 12-month cumulated data)
Source: ECB.
Notes: For assets, a positive (negative) number indicates net purchases (sales) of non-euro area instruments by euro area investors. For liabilities, a positive (negative) number indicates net sales (purchases) of euro area instruments by non-euro area investors.
In direct investment, euro area residents made net disinvestments of €196 billion in non-euro area assets in the 12 months to August 2024, declining from net disinvestments of €324 billion one year earlier (Chart 2 and Table 2). Non-residents disinvested €358 billion in net terms from euro area assets in the 12 months to August 2024, decreasing from net disinvestments of €471 billion one year earlier.
In portfolio investment, euro area residents’ net purchases of non-euro area equity increased to €105 billion in the 12 months to August 2024, up from €56 billion one year earlier. Over the same period, net purchases of non-euro area debt securities by euro-area residents rose to €406 billion, up from €361 billion one year earlier. Non-residents’ net purchases of euro area equity increased to €324 billion in the 12 months to August 2024, up from €208 billion one year earlier. Over the same period, non-residents’ net purchases of euro area debt securities widened to €395 billion, up from €370 billion one year earlier.
Table 2
Financial account of the euro area
(EUR billions unless otherwise indicated; transactions; non-working day and non-seasonally adjusted data)
Source: ECB.
Notes: Decreases in assets and liabilities are shown with a minus sign. Net financial derivatives are reported under assets. “MFIs” stands for monetary financial institutions. Discrepancies between totals and their components may be due to rounding.
Data for the financial account of the euro area
In other investment, euro area residents recorded net acquisitions of non-euro area assets amounting to €204 billion in the 12 months to August 2024 (following net disposals of €73 billion one year earlier), while they recorded net disposals of liabilities of €248 billion (down from €280 billion one year earlier).
Chart 3
Monetary presentation of the balance of payments
(EUR billions; 12-month cumulated data)
Source: ECB.
Notes: “MFI net external assets (enhanced)” incorporates an adjustment to the MFI net external assets (as reported in the consolidated MFI balance sheet items statistics) based on information on MFI long-term liabilities held by non-residents, available in b.o.p. statistics. B.o.p. transactions refer only to transactions of non-MFI residents of the euro area. Financial transactions are shown as liabilities net of assets. “Other” includes financial derivatives and statistical discrepancies.
The monetary presentation of the balance of payments (Chart 3) shows that the net external assets (enhanced) of euro area MFIs increased by €541 billion in the 12 months to August 2024. This increase was mainly driven by the current and capital accounts surplus and, to a lesser extent, by euro area non-MFIs’ net inflows in portfolio investment debt, portfolio investment equity and other investment. These developments were partly offset by euro area non-MFIs’ net outflows in direct investment and other flows.
In August 2024 the Eurosystem’s stock of reserve assets increased to €1,288.4 billion up from €1,282.8 billion in the previous month (Table 3). This increase was mainly driven by positive price changes (€15.4 billion), mostly due to an increase in the price of gold. This development was partly offset by negative exchange rate changes (€6.8 billion) and net sales of assets (€3.0 billion).
Table 3
Reserve assets of the euro area
(EUR billions; amounts outstanding at the end of the period, flows during the period; non-working day and non-seasonally adjusted data)
Source: ECB.
Notes: “Other reserve assets” comprises currency and deposits, securities, financial derivatives (net) and other claims. Discrepancies between totals and their components may be due to rounding.
Data for the reserve assets of the euro area
Data revisions
This press release incorporates revisions to the data for July 2024. These revisions did not significantly alter the figures previously published.
Next releases:
Monthly balance of payments: 19 November 2024 (reference data up to September 2024)
Quarterly balance of payments: 13 January 2025 (reference data up to the third quarter of 2024)[1]
For media queries, please contact Nicos Keranis, tel.: +49 69 1344 5482.
Notes
Current account data are always seasonally and working day-adjusted, unless otherwise indicated, whereas capital and financial account data are neither seasonally nor working day-adjusted.
Hyperlinks in this press release lead to data that may change with subsequent releases as a result of revisions.
The seasonally adjusted unemployment rate stood at 3% for the period between July and September, unchanged from the June-to-August figure, the Census & Statistics Department announced today.
The underemployment rate also remained unchanged, at 1.2%.
Total employment increased by around 1,700 to 3,710,200, while the labour force remained about the same at 3,830,100.
The number of unemployed people decreased by around 2,400 to 119,900. Meanwhile, the number of underemployed people also dropped by around 1,500 to 46,000.
Apart from noting that the overall labour market should remain tight in the near term amid the sustained economic growth, Secretary for Labour & Welfare Chris Sun explained that the employment situation may vary across sectors depending on their business performances.
Govt to provide full support to the private sector in taking lead in the field of defence & making India an innovation & technology hub: Raksha Mantri Shri Rajnath Singh launches ‘Dare to Dream 5.0’ for innovators to come forward with transformative ideas for defence applications
Deep-Tech challenges unveiled to drive major advancements in areas critical to defence infrastructure
“Need to achieve advancements in both incremental and disruptive tech through out-of-the-box thinking & latest innovations”
Cutting-edge indigenous technologies developed under TDF scheme handed over to users
Posted On: 18 OCT 2024 3:00PM by PIB Delhi
Raksha Mantri Shri Rajnath Singh has called upon the private sector to move forward from ‘participation’ to ‘taking lead’ in the defence sector, assuring the Government’s full support to make India an innovation & technology hub and one of the strongest countries in the world. He was addressing scientists, industry leaders, academia, start-ups, MSMEs and young entrepreneurs during Twaral, a DRDO-Industry Workshop on Defence Technology Acceleration organised at DRDO Bhawan in New Delhi on October 18, 2024.
Sharing insights on the transformation of the defence sector in the recent past, Raksha Mantri stated that, today, technology has transformed conventional warfare into unconventional warfare. “New dimensions have been added to modern-day warfare such as drones, cyber warfare, bio-weapons and space defence. In this transformative phase, R&D in defence will definitely make the defence sector stronger. It is heartening to witness our scientists, industrialists, academia, start-ups, MSMEs and young entrepreneurs working together in this endeavour. It is time for the private sector to take lead as it has the ability to absorb rapid changes and create new innovations,” he said.
Shri Rajnath Singh termed the adoption of unconventional ideas, not yet known to the world, as the only way to progress in unconventional warfare. Acknowledging it as a tough task, he stated that the Government, led by Prime Minister Shri Narendra Modi, will continue providing all necessary support to the youth, scientists, industrialists and MSMEs in this endeavour.
Raksha Mantri reiterated the Government’s commitment to make the defence sector more innovative and technology-oriented. Highlighting the consistent efforts being made by DRDO to strengthen the R&D environment and promote scientific temperament, he said: “Technology Development Fund (TDF) scheme is providing up to 90% of the total project cost as grant support to eligible industries. The total support is up to Rs 50 crore, a good amount for any MSME and start-up to invest in defence R&D. Since its launch six years ago, 79 projects have been sanctioned, of which, technology has successfully been developed in 18 projects.”
As part of the event, Shri Rajnath Singh launched ‘Dare to Dream 5.0’ to encourage next generation of innovators & start-ups to come forward with transformative ideas for defence applications. The fifth edition of DRDO’s innovation contest aims to generate cutting-edge solutions for India to progress further in its pursuit to achieve ‘Aatmanirbharta’ in defence technologies.
Raksha Mantri also felicitated the winners of ‘Dare to Dream 4.0’, recognising individual innovators, start-ups and MSMEs for disruptive solutions and innovations in the fields of countermeasures for drones and swarm of drones; advanced acoustic system to locate gunfire, directed energy technologies, cognitive listening device, target seeking & proximity sensing, free-space laser communication system, multi-terrain multi-utility robot among others.
Shri Rajnath Singh described the challenges as a testament to the commitment of the industrial ecosystem of the country to protect the future of the defence sector. “Like our brave soldiers, scientists, industry leaders, academia, start-ups, MSMEs and entrepreneurs too are the warriors of the country, prepared to complete every assigned task,” he said.
Raksha Mantri laid emphasis on the need to achieve advancements in both incremental and disruptive technologies within the defence sector. The solutions to challenges obtained through initiatives such as ‘Dare to Dream’ bridge the critical gap between the two types of technologies, he said. He called upon the scientists, start-ups & young entrepreneurs to think out-of-the-box and come out with latest innovations as if it were their habit to accept & overcome challenges.
Shri Rajnath Singh exhorted the private sector to move in line with the unprecedented speed with which the technological changes are taking place across the globe. He urged them to ensure, through timely assessment, that a technology does not become outdated when it is rolled out. He also called for development of projects, under TDF, based on cutting edge tech, and devising a system of comprehensive scan within the scheme to avoid duplication of technologies.
Deep-Tech Challenges
Several challenges on Disruptive, Emerging, Enabling and Pioneering Technologies (Deep-Tech) were also launched to drive major advancements in areas critical to the country’s defence infrastructure. The focus on Deep-Tech emphasises the need for India to develop and harness breakthrough technologies to stay at the forefront of defence innovation. The challenges are:
Compact Electromechanical Actuators;
Development of indigenous thrusters for Yard Craft (Indian Navy);
Development of High Purity Silicon Carbide source powder for the bulk growth of SiC single crystal;
Deep-Tech for HPM Counter Measures and Protection;
Development of a Digital Twin Framework for Aero Gas Turbine Engine Health & Usage Monitoring.
Tech handed over to end-users
Several cutting-edge indigenous technologies developed under the TDF scheme were also handed over to the users, including DRDO and Armed Forces, in the presence of Shri Rajnath Singh. These innovations, created by startups and MSMEs with DRDO, mark a significant step in the country’s journey towards self-reliance, enhancing national security. The technologies are:
Autonomous Drone as first responder for search and report mission in enclosed/indoor environment by NewSpace Research and Technology Pvt Ltd. to CAIR, DRDO.
Simulator for Unmanned Ground, Marine (Sea Surface and Underwater) and Aerial Vehicles by Combat Robotics India Pvt Ltd to CAIR, DRDO.
Data Assessment Active Learning and Believability for Visual Data to CAIR, DRDO & Aero Gas Turbine Engine Health Monitoring System by Chistats Labs Pvt Ltd to GTRE, DRDO.
Design and Development of Water Tight/Gas Tight and Fire Class EMI/EMC compliant doors and hatches for Naval Ships by Valdel Advanced Technologies Pvt Ltd. to Indian Navy.
Fuel System Temperature Transducer for Aircraft Application by Tejase Aeroscience Private Ltd Mumbai to ADA.
Twaral
The DRDO-Industry Workshop on Defence Technology Acceleration brought together all the stakeholders of the innovation ecosystem to explore strategies for expediting the development of critical defence technologies. The discussions were centered on bridging the gap between research efforts and real-world application, with a strong focus on collaboration across sectors. Setting the foundation for future innovations, the workshop underscored the critical role of DeepTech (R&D) in advancing national security capabilities.
The Amended Standard Operating Procedures for TDF, aimed at simplifying the process for start-ups and MSMEs to collaborate with DRDO, was also released. These updated procedures are designed to foster a more transparent and streamlined approach for innovators, enabling easier access to opportunities for contributing to national defense projects.
Two in-depth panel discussions were also held. The first, on Critical and Emerging Tech Collaboration, explored the potential for international R&D partnerships and the sharing of Intellectual Property in military technology. The second discussion addressed the theme of self-reliance in defence technology and manufacturing, focusing on the need for innovation and strong R&D to build a sustainable and robust domestic ecosystem.
Secretary, Department of Defence R&D and Chairman DRDO Dr Samir V Kamat praised the winners of ‘Dare to Dream 4.0’, emphasising the importance of fostering homegrown talent in building a stronger and self-reliant defence sector. The winners’ contributions serve as a testament to India’s burgeoning innovation ecosystem, he said.
Secretary (Defence Production) Shri Sanjeev Kumar, Chief of Integrated Defence Staff Lt Gen JP Mathew and other senior civil & military officials of Ministry of Defence were present on the occasion.
Source: United States Senator for Iowa Chuck Grassley
BUTLER COUNTY, IOWA – U.S. Sen. Chuck Grassley (R-Iowa), a senior member and former chairman of the Senate Judiciary Committee, is pressing the Biden-Harris administration to provide overdue reports to Congress regarding its Unaccompanied Children program and other refugee resettlement programs. The current administration’s Department of Health and Human Services (HHS)’s Office of Refugee Resettlement (ORR) hasn’t completed a single annual report on its immigration-related expenditures, policies or statistics since taking office.
“President Biden and Vice President Harris have left Congress in the dark for the entirety of their administration and lost track of tens of thousands of vulnerable migrant children in the process,” Grassley said. “How can President Biden or Border Czar Harris claim to be addressing this crisis when they can’t, or won’t, provide Congress statutorily required information on their efforts to do so? I’ve proposed reforms to address the glaring errors in this administration’s Unaccompanied Children program. It’s high time the Biden-Harris HHS let the sunshine in and show its work so that Congress can continue hammering out solutions based on the facts at hand.”
Read Grassley’s full letter HERE.
Background:
The Biden-Harris administration is failing to comply with Title 8, Section 1523 of the United States Code, which directs ORR to provide Congress annual reports on its refugee resettlement programs, including the location and status of unaccompanied migrant children in ORR’s Unaccompanied Children program. Section 1523 additionally requires ORR report to Congress on:
Refugee employment and labor force statistics;
The geographic location of refugees;
The activities, expenditures and policies of ORR;
Descriptions of taxpayer-funded refugee assistance.
Grassley has exposed the administration for losing and endangering thousands of unaccompanied migrant children and is seeking to address the dangerous policies in its Unaccompanied Children program that allow kids to be exploited.
BRUNSWICK, Ga., Oct. 16, 2024 (GLOBE NEWSWIRE) — PlayVS, the leading esports platform in North America, today announced a strategic partnership with Omnic.AI, a self-service platform that helps players game smarter with AI. The collaboration is set to transform how gamers refine their skills and achieve greater success in competitive play.
As a global leader in esports player performance data and analytics, Omnic.AI uses AI and machine learning to gather insights and perform a detailed analysis of gameplay for users. Their flagship platform, Omnic Forge, analyzes gaming footage and provides players with feedback and statistics to improve their performance in titles including Valorant, Fortnite, Rocket League, Overwatch2 and soon Madden. The new partnership will bring this cutting-edge technology to PlayVS’ vast community of gamers at no cost to high school students, helping them gain a competitive edge in their scholastic leagues.
Through Omnic, Forge players can upload five matches at a time and receive two basic insights per match in a free account. They can also match with pro players who share their gaming style and receive detailed match analysis data. Fore Plus players can upload unlimited matches and receive deeper analysis and insights into their gameplay. PlayVS will also assist in the initial training of Omnic Forge AI through esports coaches that will consult on the platform’s insights.
“We’re excited to collaborate with PlayVS to bring our gaming analysis capabilities to a broader audience,” said Shaun Meredith, Omnic.AI Co-founder and CEO. “This partnership aligns perfectly with our mission to help gamers improve their skills, win more games, and have fun.”
PlayVS is committed to making esports more accessible to youth, while also providing students with valuable skill building opportunities in STEM and leadership. Through its partnership with Omnic.AI, PlayVS aims to enhance the player experience by helping them better understand their in-game performance and integrate real-time feedback. This approach not only improves their gameplay, but also equips them with transferable skills such as critical thinking, adaptability, and effective communication—skills that are essential both in and out of the game.
“Teaming up with Omnic.AI represents a significant leap forward in how we support and develop young gamers,” said Jon Chapman, PlayVS CEO. “Their innovative technology will help our community refine their skills and stand out among other gamers, empowering them to continue to refine their craft and reach new heights in and out of the world of esports.”
This collaboration between PlayVS and Omnic.AI is set to redefine the future of competitive gaming for youth players. By offering advanced AI analytical tools and skill development resources, PlayVS ensures that students are equipped to excel in esports and gain valuable life skills that will serve them beyond the game. Together, PlayVS and Omnic.AI aim to empower the next generation of players to achieve their full potential.
Students 13 years and older who are interested in using Omnic Forge can sign up here.
About PlayVS
PlayVS (pronounced Play Versus) is North America’s leading scholastic esports platform, on a mission to unlock the many benefits of esports for players everywhere. PlayVS offers a single community in which players, coaches, educators and parents come together to compete, connect and grow through the power of esports. PlayVS is the official high school esports partner to the NFHS Network, the Special Olympics and state and regional organizations in the U.S. and Canada that offer officially sanctioned scholastic esports leagues. To learn more about PlayVS, users can visit https://playvs.com/.
About Omnic.AI
Omnic.AI is an AI platform for gaming designed to help users game smarter. The self-service platform uses computer vision and deep learning techniques to help every-day gamers, pros and content creators replace hours of manual work, anecdotal theory, and intuition with automation and personalized data driven insights. Omnic.AI was founded in 2021 by MIT alumnus and former nuclear engineer Shaun Meredith.
Source: Africa Press Organisation – English (2) – Report:
ABIDJAN, Ivory Coast, October 16, 2024/APO Group/ —
The African Development Bank Group (www.AfDB.org) has appointed Dr Kennedy K. Mbekeani as Director General for the East Africa Regional Development, Integration and Business Delivery Office, and Country Manager for Kenya, effective from 16 October 2024.
Mbekeani, a citizen of Malawi has over 25 years of senior experience in development finance, project management, policy advisory services, and knowledge generation at national and regional levels.
Prior to this appointment, he served as deputy director general for the Bank’s Southern Africa Regional Development, Integration and Business Delivery Office. In this role he led the Bank’s business development and delivery for sovereign and non-sovereign investments, and provided advisory services to South Africa, Lesotho, Botswana, Eswatini, Namibia and Mauritius. His efforts contributed to the Bank’s reputation as a trusted partner for high impact development projects in the region. He also managed relationships with governments and the private sector.
Mbekeani joined the Bank in 2009 as Chief Trade and Regional Integration Officer. Subsequently he has held various roles including lead regional economist, officer in charge and acting regional director respectively of the Bank’s South African Resource Centre. While serving as country manager for Uganda, he successfully expanded the Bank’s portfolio to over $2 billion.
Before joining the Bank, Mbekeani worked for the United Nations Development Programme as a trade, debt and globalisation advisor for East and Southern Africa. He also served as senior research fellow at the Botswana Institute for Development Policy Analysis, and senior economist at the National Institute for Economic Policy in South Africa.
He holds a Bachelor of Social Science (Economics and Statistics) degree from the University of Malawi, an MPhil in Monetary Economics from the University of Glasgow, and both an MA and PhD in International Economics from the University of California. He has authored numerous publications focusing on trade, regional integration, and infrastructure development in Africa.
Commenting on his appointment, Mbekeani said: “I am grateful and feel honoured by the confidence President Adesina placed in me through this appointment, as Director General for the East Africa Regional Development, Integration and Business Delivery Office and country manager for Kenya. I look forward to working with the president, the Board of Directors, senior management, our teams and stakeholders to enhance the Bank’s operational efficiency, effectiveness and drive impactful developmental outcomes across the region.”
President of the African Development Bank Group and Chairman of the Board of Directors Dr Akinwumi Adesina said: “I am delighted to appoint Dr. Kennedy Mbekeani as Director General for the East Africa Regional Development, Integration and Business Delivery Office, and Country manager for Kenya. Kennedy brings extensive experience in managing operations, policy dialogue, coupled with astute diplomacy and well-tested ability to work effectively with countries and development partners. His knowledge of the Eastern Africa region and well-proven experience in delivering robust operations for the public and private sectors will strongly benefit the work and operations of the African Development Bank Group in East Africa and all countries in the region.”
Source: The Conversation – USA – By Liza Bondurant, Associate Professor of Secondary Math Education, Mississippi State University
The complex voting system in the U.S. requires a sophisticated understanding of math.bamlou/DigitalVision Vectors
To American voters, the process of electing a president and other officials may be difficult to explain and understand. For America’s math teachers, the system represents a gold mine for real-life lessons on ratios, statistics and data.
And by basing the lessons on elections, teachers can help put students on the path to becoming informed and engaged voters later in life, according to a 2020 survey of 2,232 young adults ages 18-21.
Americans don’t vote directly for the president. Instead, a group of electors vote for the candidate who wins the popular vote in that state. In most states, whoever wins the most votes wins all the state’s electors, or “electoral votes.”
Not all states have the same number of electors. Each state starts with two electoral votes, based on the two U.S. senators in each state. States receive additional electors based on the number of representatives they have in the House of Representatives, which depends on a state’s population. The number of representatives in the House, however, has been set at 435 since 1929, despite a huge and varied increase in the population. This means the number of people represented by each member of the U.S. House – the ratio of people to representative – varies considerably, as shown in a table from the U.S. Census Bureau.
Armed with this background, math teachers can use the census data on population and ratios to teach students the following math – and voting – topics.
Topic 1: Ratio
To calculate a state’s representative ratio, the number of people for every one representative, divide the population by the number of the state’s representatives in the U.S. House. In 2020, for example, Montana had two congressional representatives and a population of 1,085,407. The representative ratio was 542,704:1 – 1,085,407 divided by 2 – or 542,704 residents for each representative.
Topic 2: Minimum and maximum
In any set of numbers, the minimum is the smallest number in the set and the maximum is the largest number. For example, using the representative ratios from the 2020 census data, Montana’s ratio of 542,704:1 is the smallest – the minimum – and Delaware’s ratio of 990,837:1 is the largest, or the maximum.
Topic 3: The shape, center and spread of data
Shape means how data, such as the ratios of residents to representatives, looks on a chart or graph. Teachers can use a histogram, a kind of graph used to illustrate how data is distributed: evenly, skewed to one side, or with some numbers as outliers, at a distance from the other numbers.
The ratios can also be used to explain how to find the “center” of data, its mean or median. The mean is the average, found by adding all the numbers in the set and dividing by how many there are. For example, adding the ratios for all the states and dividing by 50. The median is the middle number when all numbers are placed in order from minimum to maximum. Simple spreadsheet formulas are available online to help students find both.
Students can examine ratios of residents to representatives for all 50 states. iofoto via Getty Images
The “spread” of a set of numbers tells how much the numbers are different from the center. One measure of spread is called the range, which is the difference between the maximum and the minimum. For example, the range in representative ratios among the states is 448,133: the maximum, Delaware’s 990,837, minus the minimum, Montana’s 542,704.
When students understand how ratios – and elections – work, teachers can ask questions such as, “Montana has fewer people per representative than Delaware. Where would your vote count more?” Answer: Montana, because fewer people per representative means each vote counts more.
Topic 4: Gerrymandering
Each state is divided into districts; residents of each district vote for their state and federal representatives. Gerrymandering occurs when the borders of voting districts are drawn to favor one party at the expense of another. The political party in power often draws these district lines to make it easier for that party to win in the future.
Imagine a state has 10 representatives, and Party X gets 60% of the votes. With 60% of the votes, it seems fair that Party X should get 6 of the state’s 10 seats for representatives.
There is no rule that says the percentage of votes cast for a party in a state has to line up with the number of seats the party wins. And Party X wants more. To keep control of as many seats as possible, the politicians in Party X would like to manipulate – or gerrymander – each of 10 districts to make sure it would win 60% of the vote in each. With a majority in each district, Party X would win all 10 seats. Gerrymandering to this extreme is not always possible because districts must consist of adjoining areas, and voters who favor one party might not live in areas that can be easily connected.
Lessons on gerrymandering can vary by grade level. For example, elementary students can get hands-on experience manipulating borders with the Julia Robinson Mathematics Festival “puzzles” tool. The puzzle, which can be tied to lessons about shapes, percents and area, allows children to change boundaries on a graph to increase or decrease the number of yellow or green squares – representing voters – in each “district.” There are fewer green squares than yellow squares in each puzzle. Students win when they successfully gerrymander, changing the borders so the green voters are in the majority in most, or all, of the districts.
High school students, who already understand the basics of gerrymandering, can use a tool called Districtr to draw real voting districts. The site uses actual data about where voters live and which political party won in which area. Using this tool, students cannot only try to gerrymander districts, they can also try to create districts that are more fairly balanced. After trying to draw their own “fair” districts, students might be interested in some states’ use of independent groups to draw fairer district lines.
By using elections as a learning tool, students can gain a better understanding of ratios, means and range, and they might also start thinking about what they can do to improve the process.
The authors do not work for, consult, own shares in or receive funding from any company or organization that would benefit from this article, and have disclosed no relevant affiliations beyond their academic appointment.
Heads of Governments and Non-Government Organizations,
Members of the National Mental Health Committee
Congregation,
Ladies and gentlemen,
I am humbled to stand before you today to address a topic that touches the very core of our society – mental health in Samoa. As we gather here today, we are united by a shared commitment to addressing one of the most pressing issues facing our people.
In Samoa, our culture and sense of community – our ‘Fa’asamoa’ – are our greatest strengths. Our traditions of togetherness, family, and spirituality have sustained us through many challenges. Yet, mental health is a challenge that requires us to confront uncomfortable truths and break the silence that surrounds it.
Starting today until the 10th of October is the Commemoration of the Mental Health Week in Samoa, with the main objective of raising awareness on mental health issues and to mobilize efforts in support of mental health. This week’s celebration is parallel with the World Mental Health Day that is commemorated every year globally.
The theme for this year’s Mental Health Week is– ‘Healthy Minds, Healthy Workplaces’. It is an issue that is often overlooked but is increasingly essential in today’s world. We all know that our work plays a significant role in our lives. It is not only a source of income, but also a place where we spend much of our time, contribute to society, and build our identities. However, while we talk a lot about productivity, performance, and success in our workspaces, we don’t talk enough about something just as important, our mental health.
In Samoa, mental health is often misunderstood or hidden. Many of our people suffer in silence, believing that mental illness is a sign of weakness or a curse. But mental health issues, like depression, anxiety, and stress, are not signs of personal failure – they are illnesses that require care and compassion. These mental health issues have become increasingly common in the workplace, yet many still go unaddressed. In fact, globally it is estimated that one in five employees will experience a mental health challenge in any given year. And yet, many people are hesitant to talk about their mental health at work for fear of being judged, overlooked, or even discriminated against.
When workplaces neglect mental health, the consequences can be costly, not just in human terms, but financially as well. When an employee is struggling with mental health, their performance may suffer, leading to missed deadlines, errors, or conflicts with colleagues.
Beyond the economic cost, the personal toll is immense. Employees who face mental health challenges in silence can feel isolated, stressed, and burnt out.
Our country has seen rising rates of mental health issues, particularly among our youth. The pressures of modern life, unemployment, academic stress, and family conflicts contribute to feelings of hopelessness and isolation. Suicide has tragically become a reality for too many of our young people. The fact that Samoa has one of the highest youth suicide rates in the Pacific should give us all pause. The recent reports stated that majority of people at risk of developing mental disorders are middle aged men living in urban areas and working. Other recent studies indicate that males of less that 30years who were unemployed and living in Apia urban area, were more likely to experience psychological distress due to contributing factors such as alcohol use. Young adults aged 18-29 years living in Apia urban area were more likely to report symptoms of psychological distress than those in other areas. Women were more likely to report symptoms of psychological distress compared to men. Therefore, most of us working and employed are at risk of developing mental disorders and psychological stress.
Behind these statistics are real stories of our sons and daughters, brothers and sisters, whose lives could have been saved with better mental health support.
We cannot talk about mental health in Samoa without addressing the stigma. Mental illness is often perceived through a lens of shame, leading many to avoid seeking help. In many cases, mental health conditions are seen as a spiritual or supernatural issue, which delays access to proper care. This stigma prevents open conversations, leaving people feeling alone in their suffering.
Samoa has made significant strides in addressing mental health, recognizing it as a crucial component of public health. Mental health has been integrated into its national health strategy, reflecting a commitment to addressing mental health as a public health priority. One of the key efforts is the integration of mental health services into primary health care in ensuring that mental health is treated alongside physical health, allowing people to seek help within their local health facilities. The Samoa government and various NGOs launched public awareness campaigns to combat stigma and encourage open discussions about mental health.
Samoa works closely with international organizations such as the World Health Organization to enhance its mental health services. Some of the local organizations have launched suicide prevention programs, particularly focused on vulnerable groups such as youth. Treatment and care are provided through the Mental Unit at the main hospital in Apia which offers inpatient and outpatient care for those with severe mental health conditions. With extensive care of these patients, service is supported and provided by the GOSHEN Trust. Churches and other organizations such as the Salvation Army have played a pivotal role in promoting mental health particularly programs that focus on building resilience, emotional intelligence, and coping mechanisms. These programs aim to empower our people especially the youth to manage stress, anxiety and reducing the risk of more severe outcomes such as suicide.
Despite these combined efforts, Samoa still faces several challenges in addressing mental health. These include the resource limitations including shortage of trained mental health professionals in Samoa. Mental Health services are often concentrated in urban areas. There are also geographical barriers and cultural stigma, making it hard for individuals to seek help openly.
There is still much work to be done, particularly in expanding access to services and reducing stigma. Continued collaboration, investment, and community engagement will be essential to ensure that every Samoan can receive the mental health care they need.
I would like to reiterate that there is no health without mental health. Therefore, I would like to invite everyone who is present here today, to show your support by joining the National Mental Health Committee and the Health Sector, to the Mental Health Parade. This will be held on Thursday 10th October, which starts from the Fire and Emergency Station and ends in-front of the government building, to end the activities of this important event.
I acknowledge the support of all our development partners, churches, NGOs, civil society and the wider community towards the work of mental health in Samoa.
SOIFUA MA IA MANUIA.
SAUNOAGA AUTU ALE AFIOGA TUALA TEVAGA IOSEFO PONIFASIO
AFIOGA ILE SUI PALEMIA / SUI MINISITA OLE SOIFUA MALOLOINA
O LE POLOKALAME O LE “FA’ATAUAINA O LE SOIFUA MALOLOINA O LE MAFAUFAU”
(EFKS, AAI-O-NIUE I LE 3:30 ILE AOAULI)
Lau Susuga le Ta’ita’i o le Sauniga,
Lau Susuga i le Faifeau Toeaina, Susuga i le Fa’afeagaiga
o le EFKS i Aai-o-Niue nei, Rev. Efu Efu,
Sui Mamalu o le Kapeneta,
Le paia o Sui o Malo Aufaatasi,
Ta’ita’i o Matagaluega ma Faalapotopotoga Eseese,
Paaga uma a le Soifua Maloloina,
Le mamalu o le Ekalesia nei i Aai-o-Niue, i ona tupu ma e’e faapea ma le potopotoga,
O paia ma mamalu, o lā le Atua ia, aua o Samoa ua uma ona fa’ataotooto ana tofiga. Nu’unu’u atu ia fa’atini o tausala.
Ua tala mai le lagi le mamalu o le Atua, o lē e ou vi’iga na sa’afi ma talatala i ai le susuga i le fa’afeagaiga toeaina. Mua ia le fa’apolo i le taliuta, aua o le Atua o Samoa ma lona vi’iga.
E fia momoli le agaga fa’afetai i lau susuga i le toeaina, mo le taulaga osi o lenei aso, ma fa’anōnōmanū ai aua lenei fa’amoemoe taua. O le Atua pulepule tetele na te fa’afo’i le mau e tele i lau Susuga aua faiva o tapuaiga mo si o tatou atunu’u.
O tausaga ta’itasi i le aso 10 Oketopa e fa’amanatuina ai e le lalolagi e aofia ai ma Samoa, le Aso Faapitoa o le “Fa’atauaina o le Soifua Maloloina o le Mafaufau”.
Ua tolu ai nei o tausaga, ua fa’amanatuina ai e Samoa lenei aso fa’apitoa i le vaiaso atoa. E amata atu nei e tau le Aso Tofi, 10 Oketopa, ua fa’ailogaina ai e Samoa lenei vaiaso taua. O le sini autu o lenei fa’amoemoe, ina ia fa’aauau ona tapisa ma talanoaina le taua o le soifua maloloina o le mafaufau.
O le anavatau po’o le sini autū o lenei tausaga, ua ave le fa’amamafa i le ‘Soifua Maloloina o le Mafaufau i Totonu o Fale-faigaluega’. O le fale-faigaluega, o se nofoaga po’o se vaipanoa lea o lo’o tele ina mafuta ai tagata faigaluega i aso uma. E ave ai lana fa’amuamua ona o lo’o maua mai ai le alagātupe mo le tausiga o lona aiga. O lo’o mafai ona fa’aauauina ai le maua o tomai ma agava’a, ma toe si’itia ai le malamalama. E mafuta ma feiloa’i ai le tele o tagata eseese. O le nofoaga e tausi ina ia mamā lona si’osi’omaga, ma ia mautinoa o lo’o fa’atino galuega a le aufaigaluega ina ia si’itia tupe maua a le fale faigaluega.
Ae pe’ita’i e tele ina galo ona talatala ma tali le fesili – “O a mai oe?” O tua atu o lenei fesili o lo’o afīfī ai i totonu le ‘anofale o le fale-faigaluega, o le mafaufau manuia o le tagata faigaluega. Po’o le a le lelei o le totogi, mautū ta’iala ma faigafa’avae, lelei le tino-i-fale o le fale-faigaluega, ae a a’afia le mafaufau o le tagata faigaluega, e faia fua le galuega. A la’ititi fo’i le totogi e le tusa ai ma le galuega fa’atino, e ono o’o ai ina a’afia le mafaufau, ona ua tele mea fai ae le lava le fa’asoa. Ona fa’asolo ai lava lea i le li’o lea, ma ono o’o ai ina le faigaluega le isi tagata, ona o a’afiaga o le mafaufau. O se fa’afitauli fa’amata e le o iloa atu, ae se’iloga ua talanoa ma fa’asoa ai, ona fa’atoa lagona lea e le tagata o le mea moni o lo’o tupu.
Ua to’atele tagata ua a’afia le mafaufau ona o le tele o mafua’aga. O se mataupu e tele ina lē amana’ia ma leai se fa’amamafa. O le to’atele o tagata ua a’afia le mafaufau, fa’atoa iloa lava ona ua i ai foliga va’aia, ma ua o’o i o’oo’oga. Ae o le to’atele o lo’o a’afia, e le o mafai ona iloa ona o mafua’aga e pei o le; leai o se malamalama i āuga o le a’afia o le mafaufau, o le māasiasi ona o le tusitusilima ua le mafai ona alu e saili ai se fesoasoani, ua fai ma vaisū tu ma aga o lo’o mafua ai e pei o le tagofia o le ava malosi ma laau faasaina, ua leai se lagolago a aiga, matua, nu’u ma le ekalesia. I totonu o le fale-faigaluega ua leai se lagolago a le pule, o tagata faigaluega, faapea isi tagata.
O le to’atele o lo’o noanoatia ma tutupu ai fa’afitauli e pei o le sauāina i totonu o aiga, nu’u po’o le fale-faigaluega. Ona tupu ai lea o le musuā e talanoa ma fa’asoa e saili fesoasoani. Ua sili atu le mā ma fefe e talanoa atu ona o le popole i le tusitusi lima, ma ua leai se fa’atuatuaga o nisi tagata e ono maua ai le fesoasoani. O nisi o āuga o le mafaufau ua a’afia, a tele galuega ona saili lea o le mea e mapu i ai e pei o le tagofia o le ava po’o laau fa’asaina e tua iai. Ae peita’i, o ī tonu o lo’o amata ai lava le vaisu ma le masani lea ma ono o’o ai i se tulaga ua le mafai ona tu’u, ma i’u ina a’afia ai le mafaufau.
O fa’amaumauga lata mai i totonu o Samoa, o le toatele lava ua a’afia mafaufau e mafuli aga’i i tupulaga talavou. Ona o le tele o fesuiaiga o tu ma aga, o fa’alavelave i totonu o ā’oga, o āiga, fa’apea ma fale-faigaluega, o lo’o mafua ai le tele o a’afiaga o le mafaufau. O le to’atele o i latou ua maualuga le tulaga o le ono a’afia ai o le soifua maloloina o le mafaufau e mafuli i le itupa o ali’i mai le vai-tausaga 30 aga’i luga le matutua. O le to’atele foi, e nonofo i nofoaga tu taulaga.
O nisi o tupulaga talavou e i lalo ifo o le 30 tausaga le matutua o lo’o faamauina le a’afia o le mafaufau ona o le tagofia o le ava malosi, ma e le faigaluega. E tusa ai ma fa’amaumauga, o le to’atele o tinā ma tama’ita’i ua o’o le tulaga o le a’afia o le mafaufau pe a fa’atusa i ali’i. O le popolega, ona o nisi ua a’afia le mafaufau ua o’o ina a’afia ai le soifua, aemaise lava i le tulaga o le pule i le soifua.
O nei fa’amaumauga, e fa’amausalīina ai le tatau ona una’ia ma ave le fa’amuamua i le soifua maloloina o le mafaufau. E le gata i ona a’afiaga, ae o mafua’aga fa’avae e ala ai ona fa’atino e tagata soifua tu ma aga ma o’o ai ina a’afia.
Ua tele taumafaiga a le Malo o Samoa e tauala atu i le tatou Matagaluega o le Soifua Maloloina ma ana pa’aga galulue, ina ia una’ia le soifua maloloina o le mafaufau. E ui ua i ai ta’iala ma faigafa’avae e ta’ita’itama ai le galuega, o auaunaga e pei ona iai togafitiga ma fa’atalatalanoga, o fa’alauiloa ma polokalame i nu’u ma afio’aga. Ae peita’i, e le o mafai ona fa’aitiitia ai le tele o fa’afitauli.
O le agaga maualuga, e manuia a tatou taumafaiga, pe afai e lalago fa’atasi tagata uma. O se mafaufau manuia e afua mai totonu o aiga, ekalesia, nu’u, fale-faigaluega ma le Malo. Ia tatou opogi fa’atasi ma fa’asoa, ia taofi le tusitusilima ma le fa’alumaluma, ia saili avanoa e lagolago ai so’o se tagata soifua. Ae aua le sili musa ia tatou ona toso i lalo le isi uso a tagata ma ana taumafaiga. Po’o totonu o le fale-faigaluega, o ekalesia, totonu o le aiga, e taua le galuega a ta’ita’i, o matua, o matai, fa’apea ma le lagolago a tagata ta’ito’atasi, ina ia manuia tagata uma, ma ia sapaia mea uma i le alofa. O le alofa lea o le Atua e lē fa’atuāoia.
E momoli le fa’amālō i le lagolago a tatou pa’aga galulue, o ekalesia, o so’o se fa’alapotopotoga fa’apea nu’u ma alalafaga aua lenei fa’amoemoe taua.
E tatalo atu ai i le paia ma le mamalu o le auvala’aulia, ina ia fa’ailoa lau lagolago e ala i lou auai i le “Savali mo le Mafaufau Manuia”, Aso Tofi, 10 Oketopa 2024, e amata atu luma o le Ofisa o Tinei Mu fa’asolo atu luma o le Maota o le Malo i Matagialalua i le 7.30 i le taeao.
Manuia tele toe taimi o le Aso Sapati Paia o le Atua soifua. Faafetai
Source: Hong Kong Government special administrative region
The Inland Revenue (Amendment) (Tax Deductions for Leased Premises Reinstatement and Allowances for Buildings and Structures) Bill 2024 will be gazetted on October 18. The Bill seeks to implement two profits tax enhancement measures in the 2024-25 Budget, which include introducing a tax deduction for expenses incurred for reinstating the condition of premises under a lease to their original condition, and removing the time limit for claiming annual allowances in respect of industrial/commercial buildings or structures.
Under the Bill, if a lessee is obligated to reinstate or pay for the reinstatement of his/her premises to their original condition at the end of the lease term or on early termination of the lease, and the relevant costs have been incurred and are reasonable, the lessee can claim tax deduction for the relevant costs.
Furthermore, currently a qualifying taxpayer may claim an annual allowance in respect of the expenditure incurred on the construction of an industrial/commercial building or structure during a specified period (usage period). If the building or structure is sold before the expiry of the usage period, the buyer may claim annual allowances over the remaining years of assessment within the usage period. However, if the building or structure is sold after the expiry of the usage period, the buyer will not be entitled to claim any annual allowance even if there is residue of expenditure. The Bill proposes removing the time limit for the relevant claims in order not to discourage the purchase of old or second-hand buildings or structures. If a building or structure is sold in the basis period for a year of assessment beginning on or after April 1 this year, the buyer will be entitled to claim annual allowances until the residue of expenditure has been fully claimed, regardless of whether the usage period of the building or structure concerned has expired.
A Government spokesman said, “The two enhancement measures will alleviate the tax burden of taxpayers and promote the business environment. As reinstatement costs generally represent a small part of a taxpayer’s turnover, it is envisaged that the proposed tax deduction would not impact on government revenue. Regarding the removal of the time limit for claiming annual allowances for buildings or structures, based on the statistics for the year of assessment 2022/23, it is expected that it will reduce the annual government revenue by about $164 million.”
The Bill will be introduced into the Legislative Council for first reading on October 30 with a view to implementing the above measures in the year of assessment 2024/25.
The quality of education in young offender institutions (YOIs) in England has seriously declined, according to a recent report from Ofsted and the prisons inspectorate.
The report into these institutions, whose offenders are aged 15 to 18, referred to “steadily declining educational opportunities”. Among the failings listed were a lack of time allocated to education, lack of proper staff training, staff shortages and poor behaviour of learners.
It claimed that the curriculum is narrow, fragmented, and poorly resourced due to lack of investment in technology. Prison leaders do not accurately pinpoint what students need to learn, while learners with special educational needs and disabilities do not always get the support that they need. According to data from 2022, only 8.6% of young people who received custodial sentences passed five GCSEs, compared to 58.3% of those without convictions.
Indeed, there are similar issues across the prison system. The quality of education in too many prisons is not good enough. Research suggests prisoners are often disengaged in classes and education lacks challenge and purpose.
This is especially disheartening when research also shows that participation in education within prisons can improve learners’ self-esteem and reduce prison violence, as well as increasing the chances of getting a job once offenders are released.
Teaching reading
Many adults in prison, as well as children in YOIs, struggle to read. English education inspectorate Ofsted and its prisons counterpart have published two reviews on the teaching of reading in prisons. The first report, published in 2022, highlighted that many teaching staff did not know how to teach reading.
Inspectors found that reading teachers did not have suitable resources. There was not enough time for learners to practise reading, and weak assessment resulted in teachers not fully understanding why some learners were struggling to learn to read. Some prisons were over-relying on reading skills being taught by peer mentors, who are only supposed to support learners individually or in small groups.
The second report, from 2023, highlighted that although some progress had been made a year later, it was too slow. Inspectors found that teachers still did not know how to improve reading skills. They also found that teachers did not monitor students’ progress, and interventions to support reading, particularly for non-English speakers, were not adequate.
Special educational needs
Too many pupils with special educational needs are excluded from schools and data shows that exclusion rates are higher for this group compared to those who do not have special educational needs. Many young people who are excluded from schools end up in prison, resulting in a high proportion of prisoners who have some form of learning difficulty or disability.
According to a House of Commons report from 2022, over 30% of prisoners have a learning difficulty or experience learning challenges.
In 2016 the Coates review of prison education made several recommendations to improve the quality of education in prisons. These included a focus on special educational needs – improving the assessment of educational needs on entry and more rigorous screening for prisoners with learning difficulties or disabilities.
The review recommended that all prisoners should have a personal learning plan. Also, better quality teachers were needed and prisons needed to find ways of improving attendance in education classes
Coates recommended that learners with special educational needs and disabilities needed better quality support and that prisoners needed to be able to continue their courses when they moved prisons. Unfortunately, evidence shows that in many prisons these recommendations have not been addressed.
Making changes
Another problem is that the growing prison population has led to overcrowding, resulting in poor conditions which make studying difficult.
Work with prisoners by charities such as the Prison Reform Trust and the Prisoners’ Education Trust highlights some important recommendations which will improve the quality of education in prisons. These include widening the curriculum in prisons so that prisoners can select options from a wider range of courses.
One recommendation is to provide better incentives to prisoners to encourage them to study. This could be done by paying them the same weekly “wage” as prisoners who choose work-related activities. Increasing the number of learning mentors will help ensure that prisoners get the support they need.
Finally, introducing flexible education timetables would mean that education classes can also run in the evenings as well as during the day. This will mean that more prisoners can take part in education classes, because more classes can be timetabled across the day. Prisoners who work during the day will be able to take part in education in the evenings.
According to the Prison Education Trust digital technology “remains the essential ingredient that would revolutionise prison education”. And prisoners need to be supported and encouraged if they are going to achieve their full educational potential.
Jonathan Glazzard does not work for, consult, own shares in or receive funding from any company or organisation that would benefit from this article, and has disclosed no relevant affiliations beyond their academic appointment.
China’s Hainan Province posted imports and exports of goods totalling 205.95 billion yuan (about 28.93 billion U.S. dollars) in the first three quarters of this year, a record high in the same period and up 20.2 percent year on year, customs statistics showed Wednesday.
It is the first time that the province’s trade in goods has exceeded the 200 billion yuan mark in the same period, according to information revealed at a press conference held by the Haikou Customs.
The province’s trade in goods with Belt and Road partner countries reached 117.25 billion yuan in the first three quarters, up 43.9 percent year on year and accounting for 56.9 percent of the province’s total. Meanwhile, Hainan’s goods trade with ASEAN countries surged 70 percent year on year.
The export of the province’s industrial finished products grew rapidly during the period, accounting for over 70 percent of the total export value, becoming a strong factor in driving the overall growth of its foreign trade, said Haikou Customs.
Notably, with the construction of the Hainan Free Trade Port, the number of newly registered foreign trade companies in Hainan has exceeded 70,000 since June 2020, bringing significant increment to the development of the province’s foreign trade.
During the first three quarters of this year, the general trade with longer industrial chains and higher added value accounted for more than 70 percent of Hainan’s total foreign trade, according to the customs.
Source: The Conversation – Africa – By Abebayehu Aticho, PhD student, researcher and conservationist, Jimma University
The Nuer are a large pastoralist community living in western Ethiopia and South Sudan in east Africa. They rely on livestock keeping and have special beliefs and customs about how to live with nature. These are passed down from parents to children through the telling of stories.
Uncommonly for east African pastoralists, the Nuer live in an expansive, low-lying floodplain. This Gambella region is shaped by the convergence of several rivers originating in the Ethiopian highlands. Its wetlands and lush greenery offer a unique habitat that supports both the Nuer and a wide variety of birds and other wildlife. The people have a centuries-old cultural connection with the local biodiversity.
The Nuer are cattle herders who live in a region with many rivers.Peter Martell/AFP/Getty Images
Our collaborative study involved Ethiopian and European scientists from diverse fields (such as ornithology, ethno-ornithology, biodiversity and nature conservation). We conducted interviews and 15 group discussions with Nuer people to understand their interaction with and knowledge of birds. The study included two districts and 400 households. We found a significant and seldom studied relationship with birds, which serve a range of purposes in Nuer life.
Our study not only highlights the deep spiritual and cultural ties between the Nuer people and the avian world. It also underscores the importance of incorporating traditional ecological knowledge into contemporary conservation efforts.
The Nuer’s relationship to birds can be a valuable model for sustainable human-wildlife interactions. It can contribute to the conservation of bird diversity and promote a more harmonious coexistence between humans and nature.
The role of birds in Nuer life
Ethiopia, known for its rich biodiversity, is home to 821 bird species and over 80 indigenous ethnic groups. Among these, the Nuer community stands out for its unique admiration of birds, viewing them as sacred beings.
The Nuer use three interchangeable names for birds: gaatkuoth (sacred children of God), kuoth (bearers of spirit), and diit (symbols of human twins). These terms reflect spiritual beliefs and also influence cultural practices, such as naming twins after birds. This Nuer tradition connects the prolific nature of birds to human fertility.
In our study, participants recognised 71 bird species as having unique cultural roles. The birds that live near Nuer villages have seven distinct uses. Ten species are used as bushmeat. Five are for traditional medicine. Eight are fish indicators – by meticulously observing species like the African fish eagle, African pygmy kingfisher, pied kingfisher or malachite kingfisher, people can identify areas with high fish populations.
A flock of birds fly from the branches of trees in South Sudan.Ashraf Shazly/AFP/Getty Images
Seven birds serve as omens – they signal potential dangers like the presence of wild animals. Three are used to create protective amulets. Three are used to indicate the change of seasons – for instance the return of migratory western yellow wagtails is a reliable sign that the sunny, dry season will be replacing the rainy, wet season. And 45 are hailed for their aesthetic beauty, often linked with a sense of place. The vibrant plumage, melodious songs and elegant flight patterns of birds like the black-crowned crane, blue-naped mousebird and purple heron create a spectacle that significantly enhances Nuer life.
This intricate knowledge of birds is communal: over 90% of participants agreed on the uses of these bird species.
Indigenous knowledge and sustainability
One of the most striking things about the Nuer community is the sustainable practice embedded within their traditional systems. When birds are used as amulets, for example, only small, non-invasive parts of the bird, like feathers, are utilised. These are fashioned into necklaces or bracelets believed to offer protection from dangers like diseases. The birds are not killed or significantly harmed, which preserves their populations.
A Nuer village.fabio lamanna/Getty
There are strict limits on when and how birds can be used in Nuer society. The use of birds as bushmeat or for making traditional medicine is carefully controlled by elders and within family structures. Hunting is typically allowed only during severe food shortages. It’s often restricted to those in dire need, such as impoverished households. Families with a history of twins, who hold birds in special reverence, are not allowed to hunt them.
These cultural practices help prevent overexploitation of bird species, conserving them for future generations. They ensure that the use of natural resources remains sustainable.
It’s important to raise awareness about the conservation of birds, which are used for various purposes across Africa. Traditional medicine, bushmeat and the making of amulets has a direct impact on bird populations.
Nuer traditions balance human needs with the preservation of bird life. Our study therefore offers a compelling case and model for the conservation of avian and indigenous cultural diversity in Africa.
Why this matters
It is, however, essential to acknowledge that the Nuer’s cultural practices are not immune to the pressures of modern society. As globalisation and development continue to encroach on traditional lands, the Nuer people will face increasing challenges in maintaining their sustainable practices.
Threats such as habitat loss, climate change and illegal wildlife trading could jeopardise bird populations. In recent decades, the expansion of large-scale agriculture in the Gambella region has emerged as a driver of habitat loss and wildlife decline.
A Nuer boy watches a flock of migrating birds.Peter Martell/AFP/Getty Images
This makes the Nuer people’s traditional conservation practices even more relevant to future generations. By recognising and valuing their knowledge and practices, we can learn valuable lessons for broader conservation efforts.
Indigenous territories, despite their relatively small size, often harbour extraordinary biodiversity. Recognising this, the United Nations’ Post-2020 Global Biodiversity Framework places indigenous-occupied areas among conservation priority areas at the forefront of biodiversity preservation strategies.
It is crucial to help the Nuer community adapt to changing circumstances while preserving their cultural heritage and ensuring the sustainability of bird biodiversity.
Changkuoth Puok Diet, a lecturer at Gambella University in Ethiopia, contributed to this article.
Source: The Conversation – Africa – By Jacob Lewis, Assistant Professor, School of Politics, Philosophy and Public Affairs, Washington State University
Nigerians took to the streets in August 2024 to voice their frustration at a series of government policies. These policies had been ostensibly designed to make Nigeria more attractive for outside investment.
Many Nigerians rely on government subsidies to make ends meet. The economic policy changes have resulted in a big rise in inflation, adding to the challenges for ordinary Nigerians.
As economic conditions have worsened, the prominence of government corruption has risen. Protests and riots have exploded in the streets across the country in the form of #EndBadGovernance protests that call out government graft and poor governance.
Does government corruption drive protests and social movements? While some scholars have argued that it does, others have argued that corruption is often a catch-all term for frustration over broad economic and democratic grievances. Others have noted that in some cases, increased perceptions of corruption correlate with less protest.
These contradictory results reveal an important puzzle: why does corruption only sometimes seem to generate mass uprisings? If, for example, corruption is enough to generate citizen uprisings, then why do we only rarely see unified anti-police protests in countries like Nigeria, where police corruption is rampant?
I argue that one key to this puzzle is the way different types of corruption are associated with increased or decreased protest mobilisation.
I am a political scientist whose work focuses in part on African social movements and issues of corruption. I approach this by merging large statistical models with political psychological approaches.
I conducted research in 2021 on different types of corruption shaping protests. I found that elite corruption had the power to mobilise protest. But that other forms of corruption – such as corruption in the police force – were less likely to lead people to take protest action.
The implication of my findings is that anti-corruption protests are an imperfect signal for understanding everyday corruption experiences. The fact that people aren’t protesting doesn’t mean there’s nothing to complain about.
Why elite corruption sparks protest
To explain why corruption sometimes corresponds with protest movements and other times does not, I think it is useful to consider two types of corruption. Elite corruption refers to forms of graft and venality performed by political elites who seek to either enrich themselves or reshape the political system to their advantage.
Police corruption refers to acts of self-enrichment or abuse perpetrated by police officers, often during traffic stops or in the process of police procedure.
My findings show that citizens are generally more likely to mobilise in response to elite corruption than police corruption. Why?
First, elite corruption tends to be intertwined with macro-level economic crises and scandals.
Second, elite corruption provides a universal point of focus for protesters across an entire nation, rather than the highly localised experiences of police and bureaucratic graft.
Finally, anger over police corruption may be suppressed by the safety concerns associated with demonstrating against armed security forces.
I tested this argument using two methods. First, drawing from a 2017 household survey experiment that I conducted in five Nigerian states, I examined whether exposure to vignettes describing either elite corruption or police corruption shaped a respondent’s self-reported willingness to participate in a protest.
The elite corruption vignettes included self-dealing and system-changing forms of corruption perpetrated by political elites. The police corruption vignette focused on the solicitation of bribes and unfair detention of citizens by the police. I then asked respondents:
Many Nigerians join groups that engage in protests, strikes, or demonstrations. Now I would like to ask you about how willing you would be to join a protest or demonstration.
Respondents were able to select a response between 1 (“not at all willing”) to 5 (“very willing / I already do”).
I found that individuals who received the elite corruption vignette were statistically more likely to state that they would join a protest or demonstration.
I then expanded this analysis via a statistical regression that measured whether perceptions of elite and police corruption (sourced from the Afrobarometer dataset) correlated with different levels of observed conflict (sourced from the Social Conflict Analysis Database).
I thought it was best to test whether the results of my survey experiment, which capture a moment in time, reflected a broader reality, or whether it was just a fluke.
Using the Afrobarometer data, I identified regions where citizens expressed particularly high or low perceptions of elite and police corruption. Then, using the social conflict analysis data, I measured the number of protest events in those regions.
I found that while elite corruption perceptions were positively correlated with an increased number of observed protest events, police corruption perceptions were not.
Together, these methods suggest that it is not enough to argue that citizens will rise up against corrupt governments. Rather, the ways in which a government is corrupt matter.
Turning back to the August 2024 protests, one might ask: why now? Why did Nigerians spend ten days protesting against corruption when there had been rampant corruption for so long?
My research suggests that the nature of the corruption claims – specifically, anger over large-scale government graft – is what counts.
Recent developments seem to support this.
What’s changed
First, corruption perceptions have spiked. In 2021, Afrobarometer polled 1,600 Nigerians, asking them whether levels of corruption had risen, stayed the same, or decreased in the past year. At the time, just over 35% stated that corruption had “increased a lot”. One year later, that number had nearly doubled, jumping to just under 65%.
This drastic increase in perceived corruption reveals a broader lack of faith in the government and concern over the future of the country.
Second, tipping points help with mobilisation. The protests in early August arose as the financial crisis crystallised and as a series of economic policies brought into sharp relief the economic disparities between the rich and the poor.
The removal of fuel subsidies is a particularly touchy subject in Nigerian politics. In 2012, Nigerians took to the streets over the same issue, leading to a week-long “occupation” of major Nigerian cities by protesters.
Implications
Protests are a highly visible signal that citizens are frustrated; however, it is easy to overlook the possibility that citizens may be widely upset about a broad array of issues, but only willing to speak out in response to some of those issues.
There is a knock-on consequence to this; namely, that police corruption has a more direct effect on the lives of Nigerians than elite corruption, but often goes unaddressed.
Jacob Lewis receives funding from the Department of Defense, the U.S. Agency for International Development, the Anti-Defamation League, and the Carnegie Corporation of New York. He consults with the Anti-Defamation League on survey-based research.
Source: The Conversation – Africa – By Jacob Lewis, Assistant Professor, School of Politics, Philosophy and Public Affairs, Washington State University
Nigerians took to the streets in August 2024 to voice their frustration at a series of government policies. These policies had been ostensibly designed to make Nigeria more attractive for outside investment.
Many Nigerians rely on government subsidies to make ends meet. The economic policy changes have resulted in a big rise in inflation, adding to the challenges for ordinary Nigerians.
As economic conditions have worsened, the prominence of government corruption has risen. Protests and riots have exploded in the streets across the country in the form of #EndBadGovernance protests that call out government graft and poor governance.
Does government corruption drive protests and social movements? While some scholars have argued that it does, others have argued that corruption is often a catch-all term for frustration over broad economic and democratic grievances. Others have noted that in some cases, increased perceptions of corruption correlate with less protest.
These contradictory results reveal an important puzzle: why does corruption only sometimes seem to generate mass uprisings? If, for example, corruption is enough to generate citizen uprisings, then why do we only rarely see unified anti-police protests in countries like Nigeria, where police corruption is rampant?
I argue that one key to this puzzle is the way different types of corruption are associated with increased or decreased protest mobilisation.
I am a political scientist whose work focuses in part on African social movements and issues of corruption. I approach this by merging large statistical models with political psychological approaches.
I conducted research in 2021 on different types of corruption shaping protests. I found that elite corruption had the power to mobilise protest. But that other forms of corruption – such as corruption in the police force – were less likely to lead people to take protest action.
The implication of my findings is that anti-corruption protests are an imperfect signal for understanding everyday corruption experiences. The fact that people aren’t protesting doesn’t mean there’s nothing to complain about.
Why elite corruption sparks protest
To explain why corruption sometimes corresponds with protest movements and other times does not, I think it is useful to consider two types of corruption. Elite corruption refers to forms of graft and venality performed by political elites who seek to either enrich themselves or reshape the political system to their advantage.
Police corruption refers to acts of self-enrichment or abuse perpetrated by police officers, often during traffic stops or in the process of police procedure.
My findings show that citizens are generally more likely to mobilise in response to elite corruption than police corruption. Why?
First, elite corruption tends to be intertwined with macro-level economic crises and scandals.
Second, elite corruption provides a universal point of focus for protesters across an entire nation, rather than the highly localised experiences of police and bureaucratic graft.
Finally, anger over police corruption may be suppressed by the safety concerns associated with demonstrating against armed security forces.
I tested this argument using two methods. First, drawing from a 2017 household survey experiment that I conducted in five Nigerian states, I examined whether exposure to vignettes describing either elite corruption or police corruption shaped a respondent’s self-reported willingness to participate in a protest.
The elite corruption vignettes included self-dealing and system-changing forms of corruption perpetrated by political elites. The police corruption vignette focused on the solicitation of bribes and unfair detention of citizens by the police. I then asked respondents:
Many Nigerians join groups that engage in protests, strikes, or demonstrations. Now I would like to ask you about how willing you would be to join a protest or demonstration.
Respondents were able to select a response between 1 (“not at all willing”) to 5 (“very willing / I already do”).
I found that individuals who received the elite corruption vignette were statistically more likely to state that they would join a protest or demonstration.
I then expanded this analysis via a statistical regression that measured whether perceptions of elite and police corruption (sourced from the Afrobarometer dataset) correlated with different levels of observed conflict (sourced from the Social Conflict Analysis Database).
I thought it was best to test whether the results of my survey experiment, which capture a moment in time, reflected a broader reality, or whether it was just a fluke.
Using the Afrobarometer data, I identified regions where citizens expressed particularly high or low perceptions of elite and police corruption. Then, using the social conflict analysis data, I measured the number of protest events in those regions.
I found that while elite corruption perceptions were positively correlated with an increased number of observed protest events, police corruption perceptions were not.
Together, these methods suggest that it is not enough to argue that citizens will rise up against corrupt governments. Rather, the ways in which a government is corrupt matter.
Turning back to the August 2024 protests, one might ask: why now? Why did Nigerians spend ten days protesting against corruption when there had been rampant corruption for so long?
My research suggests that the nature of the corruption claims – specifically, anger over large-scale government graft – is what counts.
Recent developments seem to support this.
What’s changed
First, corruption perceptions have spiked. In 2021, Afrobarometer polled 1,600 Nigerians, asking them whether levels of corruption had risen, stayed the same, or decreased in the past year. At the time, just over 35% stated that corruption had “increased a lot”. One year later, that number had nearly doubled, jumping to just under 65%.
This drastic increase in perceived corruption reveals a broader lack of faith in the government and concern over the future of the country.
Second, tipping points help with mobilisation. The protests in early August arose as the financial crisis crystallised and as a series of economic policies brought into sharp relief the economic disparities between the rich and the poor.
The removal of fuel subsidies is a particularly touchy subject in Nigerian politics. In 2012, Nigerians took to the streets over the same issue, leading to a week-long “occupation” of major Nigerian cities by protesters.
Implications
Protests are a highly visible signal that citizens are frustrated; however, it is easy to overlook the possibility that citizens may be widely upset about a broad array of issues, but only willing to speak out in response to some of those issues.
There is a knock-on consequence to this; namely, that police corruption has a more direct effect on the lives of Nigerians than elite corruption, but often goes unaddressed.
New data suggests the ‘forever home’ may be a thing of the past, with the ‘seven-year itch’ now closer to five.
Auckland, where properties were sold the fastest saw a modest 12.2% increase in average asking prices.
Conversely, West Coast, where properties were held for longer, saw an impressive 97.9% rise over the average selling period.
Taranaki tops the list for staying power, holding onto their homes the longest— six years and five months on average.
17 October 2024 – The concept of the ‘forever home’ appears to be fading in New Zealand, with new data from realestate.co.nz revealing that Kiwis now hold onto their homes for an average of just five and a half years before selling.
The data, which looks at the amount of time that property is held onto until it is re-sold, shows, on average, people hold properties for the least time in Auckland.
The time between sales for properties in Auckland was approximately five years and three months. At the other end of the scale, Kiwis held onto their properties for the longest in Taranaki (six years and five months) and Manawatu/Whanganui (six years and four months).
“People move for many reasons—employment opportunities, the desire for more space, the need to accommodate aging parents, or even downsizing after the kids have left. This frequent movement is likely a reflection of changing lifestyle needs and opportunities across New Zealand,” says Vanessa Williams, realestate.co.nz spokesperson.
The movers: Auckland, Waikato, Nelson & Bays, and Bay of Plenty
Whether it’s the pace of the city, the pull of keeping up with the Joneses, or the appeal of various lifestyle changes, Auckland has seen its properties change hands the most often.
Williams says as our most populated region, Auckland’s size is likely a factor:
“Auckland offers good employment opportunities while catering for lifestyle changes of all kinds, including for those looking for their second home or wanting to downsize into retirement. This could explain why properties are sold more often in this region.”
Other regions where property moved more quickly than the national average were Waikato, Nelson and Bays, and Bay of Plenty, where the average time between sales was five years and four months.
The districts where properties were sold the most often were Selwyn in Canterbury (four years and nine months), Franklin in Auckland (four years and 10 months), the Waikato district (five years), and Papakura in Auckland (five years).
Williams notes that it’s no surprise the districts with the fastest sales are in Canterbury, Auckland, and Waikato.
“Buying a property is so often an emotional decision. And in these larger regions, where there is more to choose from, the chances of wandering into an open home and falling in love or spotting a for sale sign on a house in the perfect location are probably higher.”
Region
District
Average time between sales
Canterbury
Selwyn
4 years, 9 months
Auckland
Franklin
4 years, 10 months
Waikato
Waikato
5 years, 0 months
Auckland
Papakura
5 years, 0 months
Auckland
Rodney
5 years, 1 months
Waikato
Waipa
5 years, 1 months
Canterbury
Waimakariri
5 years, 1 months
Wairarapa
Carterton
5 years, 2 months
Bay of Plenty
Tauranga
5 years, 2 months
Auckland
North Shore City
5 years, 3 months
The districts where people are re-selling their properties faster
The stayers: Taranaki, Manawatu/Whanganui, Gisborne, West Coast, and Hawke’s Bay
Kiwis held onto their homes longest in Taranaki (six years and five months), Manawatu/Whanganui (six years and four months), Gisborne (six years and three months), West Coast (six years and two months), and Hawke’s Bay (six years).
At a district level, properties in South Taranaki were held the longest (six years and eight months), followed by Tararua in Manawatu/Whanganui (six years and six months) and Ruapehu in Central North Island (six years and six months).
Williams says smaller towns tend to have fewer properties available for sale:
“In smaller regions, limited housing options often lead people to stay in their homes longer while waiting for the ideal property to hit the market,” says Williams. “In addition, close-knit communities and businesses like farms can create a deeper connection to the area, making people less inclined to move frequently.”
The districts where people are holding onto their properties for longer
Region
District
Average time between sales
Southland
Gore
6 years, 4 months
Wellington
Wellington City
6 years, 4 months
Manawatu / Whanganui
Horowhenua
6 years, 4 months
Wellington
Lower Hutt City
6 years, 4 months
West Coast
Buller
6 years, 4 months
Manawatu / Whanganui
Palmerston North City
6 years, 4 months
Manawatu / Whanganui
Whanganui
6 years, 5 months
Central North Island
Ruapehu
6 years, 6 months
Manawatu / Whanganui
Tararua
6 years, 6 months
Taranaki
South Taranaki
6 years, 8 months
But what about the financial gains? Does it pay to stay, or should you go?
All regions saw a lift in their average asking prices, regardless of how long properties were held between sales. However, there were some regional differences.
Five years and three months ago, in June 2019, the average asking price in Auckland was $929,742; in September 2024 it was 12.2% higher at $1,042,883. In Waikato, the increase was more substantial, with average asking prices rising 32.6%, from $609,272 in May 2019 to $808,153 in September 2024.
“Aucklanders have been the fastest to move on, but of all regions, they have seen the smallest financial gain over the last five and a half years.”
“Holding for longer can sometimes mean bigger gains, but many factors can impact this, including market conditions, economic factors, legislative changes, your region, and demand in your area,” says Williams.
The biggest increases in average asking prices over the average selling period were seen on the West Coast, where prices rose by 97.9% over six years and two months. In Gisborne, where homes were sold on average every six years and three months, prices increased by 79.1%. In Manawatu/Whanganui, where properties changed hands every six years and four months, prices rose by 76.7%.
Ultimately, Williams urges people to buy based on their personal circumstances, rather than trying to predict what the market might do.
More than a million New Zealand homes have never been sold
We may be a nation of property fanatics, but well over a million homes have never gone up for sale on realestate.co.nz, despite the site listing 935,048 individual properties since records began 17 years ago.
“Statistics New Zealand data from September 2024 estimates there are just over 2 million private dwellings in New Zealand, meaning there are more than a million homes that have been in the same hands since realestate.co.nz records began 17 years ago,” says Williams.
She notes that Kiwis tend to have a strong connection to property and place.
“It will be interesting to look back again in another decade or two and see, as lifestyles change if we see a similar percentage of homes staying with the same owners,” adds Williams.
We’ve been helping people buy, sell, or rent property since 1996.
Established before Google, realestate.co.nz is New Zealand’s longest-standing property website and the official website of the real estate industry.
Dedicated only to property, our mission is to empower people with a property search tool they can use to find the life they want to live. With residential, lifestyle, rural and commercial property listings, realestate.co.nz is the place to start for those looking to buy or sell property.
Whatever life you’re searching for, it all starts here.
Want more property insights?
Market insights: Search by suburb to see median sale prices, popular property types and trends over time. Sold properties: Switch your search to sold to see the last 12 months of sales and prices. Valuations: Get a gauge on property prices by browsing sold residential properties, with the latest sale prices and an estimated value in the current market.
Glossary of terms:
Average asking price (AAP) is neither a valuation nor the sale price. It is an indication of current market sentiment. Statistically, asking prices tend to correlate closely with the sales prices recorded in future months when those properties are sold. As it looks at different data, average asking prices may differ from recorded sales data released simultaneously.
Sales data is provided by the Real Estate Institute of New Zealand (REINZ)
New listings are a record of all the new residential dwellings listed for sale on realestate.co.nz for the relevant calendar month. The site reflects 97% of all properties listed through licensed real estate agents and major developers in New Zealand. This description gives a representative view of the New Zealand property market.
Stock is the total number of residential dwellings that are for sale on realestate.co.nz on the penultimate day of the month.
Rate of sale is a measure of how long it would take, theoretically, to sell the current stock at current average rates of sale if no new properties were to be listed for sale. It provides a measure of the rate of turnover in the market.
Seasonal adjustment is a method realestate.co.nz uses to represent better the core underlying trend of the property market in New Zealand. This is done using methodology from the New Zealand Institute of Economic Research.
Truncated mean is the method realestate.co.nz uses to supply statistically relevant asking prices. The top and bottom 10% of listings in each area are removed before the average is calculated to prevent exceptional listings from providing false impressions.
The pied kingfisher helps the Nuer to find parts of the river where there’s an abundance of fish.Henrik Karlsson/Getty Images
The Nuer are a large pastoralist community living in western Ethiopia and South Sudan in east Africa. They rely on livestock keeping and have special beliefs and customs about how to live with nature. These are passed down from parents to children through the telling of stories.
Uncommonly for east African pastoralists, the Nuer live in an expansive, low-lying floodplain. This Gambella region is shaped by the convergence of several rivers originating in the Ethiopian highlands. Its wetlands and lush greenery offer a unique habitat that supports both the Nuer and a wide variety of birds and other wildlife. The people have a centuries-old cultural connection with the local biodiversity.
Our collaborative study involved Ethiopian and European scientists from diverse fields (such as ornithology, ethno-ornithology, biodiversity and nature conservation). We conducted interviews and 15 group discussions with Nuer people to understand their interaction with and knowledge of birds. The study included two districts and 400 households. We found a significant and seldom studied relationship with birds, which serve a range of purposes in Nuer life.
Our study not only highlights the deep spiritual and cultural ties between the Nuer people and the avian world. It also underscores the importance of incorporating traditional ecological knowledge into contemporary conservation efforts.
The Nuer’s relationship to birds can be a valuable model for sustainable human-wildlife interactions. It can contribute to the conservation of bird diversity and promote a more harmonious coexistence between humans and nature.
The role of birds in Nuer life
Ethiopia, known for its rich biodiversity, is home to 821 bird species and over 80 indigenous ethnic groups. Among these, the Nuer community stands out for its unique admiration of birds, viewing them as sacred beings.
The Nuer use three interchangeable names for birds: gaatkuoth (sacred children of God), kuoth (bearers of spirit), and diit (symbols of human twins). These terms reflect spiritual beliefs and also influence cultural practices, such as naming twins after birds. This Nuer tradition connects the prolific nature of birds to human fertility.
In our study, participants recognised 71 bird species as having unique cultural roles. The birds that live near Nuer villages have seven distinct uses. Ten species are used as bushmeat. Five are for traditional medicine. Eight are fish indicators – by meticulously observing species like the African fish eagle, African pygmy kingfisher, pied kingfisher or malachite kingfisher, people can identify areas with high fish populations.
Seven birds serve as omens – they signal potential dangers like the presence of wild animals. Three are used to create protective amulets. Three are used to indicate the change of seasons – for instance the return of migratory western yellow wagtails is a reliable sign that the sunny, dry season will be replacing the rainy, wet season. And 45 are hailed for their aesthetic beauty, often linked with a sense of place. The vibrant plumage, melodious songs and elegant flight patterns of birds like the black-crowned crane, blue-naped mousebird and purple heron create a spectacle that significantly enhances Nuer life.
This intricate knowledge of birds is communal: over 90% of participants agreed on the uses of these bird species.
Indigenous knowledge and sustainability
One of the most striking things about the Nuer community is the sustainable practice embedded within their traditional systems. When birds are used as amulets, for example, only small, non-invasive parts of the bird, like feathers, are utilised. These are fashioned into necklaces or bracelets believed to offer protection from dangers like diseases. The birds are not killed or significantly harmed, which preserves their populations.
A Nuer village. fabio lamanna/Getty
There are strict limits on when and how birds can be used in Nuer society. The use of birds as bushmeat or for making traditional medicine is carefully controlled by elders and within family structures. Hunting is typically allowed only during severe food shortages. It’s often restricted to those in dire need, such as impoverished households. Families with a history of twins, who hold birds in special reverence, are not allowed to hunt them.
These cultural practices help prevent overexploitation of bird species, conserving them for future generations. They ensure that the use of natural resources remains sustainable.
It’s important to raise awareness about the conservation of birds, which are used for various purposes across Africa. Traditional medicine, bushmeat and the making of amulets has a direct impact on bird populations.
Nuer traditions balance human needs with the preservation of bird life. Our study therefore offers a compelling case and model for the conservation of avian and indigenous cultural diversity in Africa.
Why this matters
It is, however, essential to acknowledge that the Nuer’s cultural practices are not immune to the pressures of modern society. As globalisation and development continue to encroach on traditional lands, the Nuer people will face increasing challenges in maintaining their sustainable practices.
Threats such as habitat loss, climate change and illegal wildlife trading could jeopardise bird populations. In recent decades, the expansion of large-scale agriculture in the Gambella region has emerged as a driver of habitat loss and wildlife decline.
This makes the Nuer people’s traditional conservation practices even more relevant to future generations. By recognising and valuing their knowledge and practices, we can learn valuable lessons for broader conservation efforts.
Indigenous territories, despite their relatively small size, often harbour extraordinary biodiversity. Recognising this, the United Nations’ Post-2020 Global Biodiversity Framework places indigenous-occupied areas among conservation priority areas at the forefront of biodiversity preservation strategies.
It is crucial to help the Nuer community adapt to changing circumstances while preserving their cultural heritage and ensuring the sustainability of bird biodiversity.
Changkuoth Puok Diet, a lecturer at Gambella University in Ethiopia, contributed to this article.
Abebayehu Aticho works for both Jimma University and the Threatened Species Conservation Organisation (a small local NGO). He got funding for this study from the International Crane Foundation and Jimma University.
Andrew Gosler has received grant funding in the past from the Arts and Humanities Research Council for the Ethno-ornithology World Atlas.
Abebe Beyene, Desalegn Chala, Nils Christian Stenseth, and Shimelis Aynalem Zelelew do not work for, consult, own shares in or receive funding from any company or organisation that would benefit from this article, and have disclosed no relevant affiliations beyond their academic appointment.
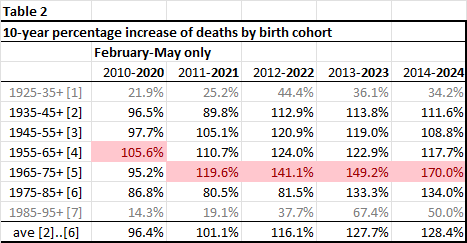
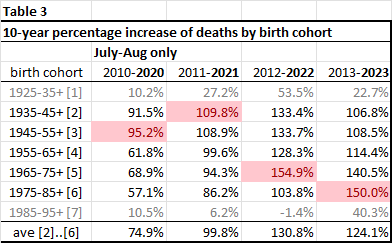