There is growing awareness of the problems caused by the use of a fast-acting drug called ketamine. Often referred to as K or ket, it was made a class B drug in the UK in 2014 and is illegal to buy or sell. Possessing the drug can lead to a maximum five-year prison sentence and supplying the drug up to 14 years in prison.
Ketamine is an effective anaesthetic and plays an important part in battlefield and emergency medicine. It is used to treat pain in end-of-life care and could treat some forms of depression. However, it is its non-medical use that is causing concern among some doctors and specialist drug-treatment providers.
On the illicit market, ketamine is cheaper than cocaine and MDMA (ecstasy), costing about £20 a gram. Police forces report large seizures of the drug, but global rates of production are high, and the wholesale price of a kilogram of ketamine is believed to have fallen from £8,000 to £5,000. This makes it an attractive drug for young people and those with a limited income.
Ketamine typically takes about 15 minutes to work and induces euphoria, relaxation and a slight sense of detachment. However, with higher doses it can also cause dissociation. This can be confusing and can cause panic attacks and memory loss. It can increase blood pressure and affect breathing and heart function.
Effects can also be fatal. The Friends actor Matthew Perry died in 2023 as a result of using the drug.
Some urologists have also expressed concern about an increase in bladder problems (so-called “ketamine bladder”) as a result of prolonged and heavy use of the drug. Although national data about the number of people with ketamine bladder is not available, there are other sources about the use of ketamine.
Ketamine first became popular as a recreational drug in the early 1990s. Use among people aged 16-24 in England and Wales rose from 0.9% in 2006-07 to 3.8% in 2022-23 – which is about 220,000 people.
There has been an increase in young people attending specialist treatment services with problems related to ketamine use: 512 during 2021-22 rising to 719 in 2022-23.
The increase is concerning as few services and interventions are available that specifically address ketamine use. An increase in people seeking treatment has not been helped by historic cuts to drug-treatment funding, which is only beginning to be addressed, and a lack of meaningful drug education and early intervention responses.
This increase in young people seeking treatment is also seen in adults. Rising from 1,551 in 2021-22 to 2,211 during 2022-23. There has been a fivefold increase in adult treatment since 2014.
Self-medicating
There is a suggestion from experts that part of the increase in the use of ketamine is due to some people who have mental health problems that are unable to access treatment because of long waiting lists.
Rather than wait for specialist treatment some people turn to drugs like ketamine that offer some reprieve from their symptoms. Ketamine can create a sense of detachment in users, this will be a desirable state for those who are seeking to escape invasive mental health symptoms of troubling thoughts and feelings.
In effect, they are finding their own solutions by self-medicating with the drug. Given that ketamine is easily available, relatively cheap and fast-acting it is easy to see why this drug is appealing, particularly as there are no long waiting lists or invasive assessments to undergo.
Ketamine doesn’t induce the same type of hangover that alcohol and other drugs do. This makes it appealing to those who need to be at work the day after using it. Likewise, it is appealing to those on zero-hour contracts who are asked to work at short notice.
However, many people will use other substances alongside ketamine – typically alcohol. Mixing alcohol and ketamine can cause significant harm, ranging from slowed breathing to coma and even fatal overdose.
Paradoxically ketamine is being investigated as a treatment for those who are dependent on alcohol, including those who haven’t responded to more traditional forms of therapy.
As with the promise that other drugs, such as psychedelics, might help treat mental health problems, current evidence suggests that these drugs are only effective when given alongside therapy.
It’s not clear whether the UK has reached peak ketamine use. Most drugs fall in and out of fashion. It is clear that originally banning the drug in 2005, and increasing punishments in 2014 has failed to halt its rising popularity. What could have helped was investment into prevention, education and harm reduction services, but this didn’t happen and we are seeing some of the consequences now.
Preventing the use of ketamine is the only way to be sure that it won’t cause harm. But if we accept that young people and adults will continue to use it then we should be aiming to reduce the potential for harm. There are useful resources already available, but reducing drug-related harm requires a more active response – one that doesn’t rely on people visiting websites or reading a leaflet.
We should put effort and resources into providing public health messaging that reaches those who are at the most risk from harm due to ketamine. At the same time, investing in and providing timely mental health support would reduce the need for those who are self-medicating with the drug.
With a new government in the UK, commanding a sizeable majority in parliament, could this Labour government adopt a policy shift that could reduce suffering and save lives?
Harry Sumnall receives funding from public grant awarding bodies for alcohol and other drugs research, and fees from (international) not-for-profit organisations and government departments for consultation work. He is an unpaid steering group member of the Anti-Stigma Network, an unpaid member of the Scientific Advisory Group of the International Society of Substance Use Professionals (ISSUP), an unpaid member of the Scientific Advisory Board of the Mind Foundation, an unpaid advisor to the UK Drug Education Forum, and an unpaid co-opted member of UK Government Advisory Council on the Misuse of Drugs (ACMD) Working Groups on cocaine, and prevention.
Ian Hamilton does not work for, consult, own shares in or receive funding from any company or organisation that would benefit from this article, and has disclosed no relevant affiliations beyond their academic appointment.
Source: The Conversation – UK – By Jolanta Burke, Senior Lecturer, Centre for Positive Health Sciences, RCSI University of Medicine and Health Sciences
The World Health Organization (WHO) has just published alarming statistics showing that employee mental health issues result in a US$1 trillion (£747 billion) loss in productivity each year. The WHO has called on employers to take urgent action by introducing comprehensive wellbeing programmes to tackle the escalating mental health crisis in the workplace.
But the problem is that many workplace wellbeing programmes don’t work. A UK study which looked at 46,336 employees from 233 organisations found there was no evidence that a range of common workplace wellbeing initiatives – including mindfulness and stress management classes, one-to-one mental health coaching, wellbeing apps or volunteering work – improved employee wellbeing.
So despite companies investing over US$60 billion annually worldwide in wellbeing programmes, they appear to make little impact.
There are a number of reasons why these programmes don’t work – and understanding them is the only way companies will be able to make these programmes effective.
Motivation
Organisations often opt for easy-to-implement initiatives, such as hosting wellbeing talks or offering mindfulness or yoga classes. They then complain that employees don’t attend or don’t appreciate them.
Many employees say they don’t attend these activities because they find them irrelevant, unhelpful or they don’t value them enough to attend – meaning their workplace has failed in identifying their needs.
Understanding what motivates people to participate in wellbeing programmes is crucial in improving its effectiveness. For example, one survey found employees were more interested in learning about healthy lifestyles than having a discussion about stress management. Although not directly related to mental wellbeing, prioritising these kinds of talks would have a greater effect on improving wellbeing in the end.
Content matters
Wellbeing programmes tend to be more effective for people whose wellbeing is average or below average. So when people with high levels of wellbeing participate in such programmes, they often see little benefit. This can make it appear the programme isn’t effective – when in reality, it still is for those who need it most.
This is why it’s so important to determine what type of help employees need most when designing wellbeing programmes.
For employees who aren’t experiencing poor mental health, a programme that primarily addresses depression or anxiety may be less effective as they’re probably already practising many of the strategies such programmes would discuss. But if the wellbeing programme goes beyond reducing symptoms and focuses on promoting flourishing, meaning and purpose in life, it could provide value to a broader audience.
This is where a programme designed by an expert in positive psychology would be beneficial in workplaces. Positive psychology is the science of wellbeing. It focuses on building on the positive aspects of life that make life worth living – rather than solely addressing symptoms of mental ill health which only affect 10-20% of the population.But positive psychology measures still have a positive impact on those who experience mental health issues at the same time. They include such activities as identifying and using your character strengths at work, re-thinking your past events positively, learning optimism or practising gratitude.
The content of workplace wellbeing programmes is crucial. Avoiding generic self-help approaches will enhance their overall impact.
Even a person’s genetics can significantly affect whether such programmes have any impact. Research shows that people who have a higher genetic predisposition towards change are more likely to benefit disproportionately from these programmes – and their positive effect tends to last longer.
All of these factors should be carefully considered when designing a workplace wellbeing programme. And given how difficult this will make it to design one that’s effective, it’s important employee wellbeing programmes are actually developed by experts in the field – not consultants who lack in-depth knowledge of psychology.
Implementation
The way a wellbeing programme is implemented is just as important as its content – though this aspect is often overlooked by wellbeing consultants.
For instance, overusing gratitude exercises can lead to disengagement from a programme. Similarly, offering too many wellbeing activity options can overwhelm participants and result in them discontinuing the programme.
To maximise the impact a wellbeing programme has in the workplace requires careful attention not only to the content but also how it’s implemented.
There are many nuances involved in designing a workplace wellbeing programme. Employers must ensure the programmes they offer not only promote wellbeing but also avoid causing unintended harm to others in the process. Consulting experts who know the nuances of psychology and of wellbeing programmes is key, as they will ensure programmes will be effective and helpful. Programmes that combine positive psychology and lifestyle medicine (which focus on helping people improve their health and fitness) may be particularly beneficial in workplaces.
Jolanta Burke does not work for, consult, own shares in or receive funding from any company or organisation that would benefit from this article, and has disclosed no relevant affiliations beyond their academic appointment.
Source: United Kingdom – Executive Government & Departments
Projects from 4 UK organisations will share £2m in the inaugural AUKUS Pillar 2 Electronic Warfare (EW) Innovation Challenge.
Through AUKUS Pillar 2, Australia, the UK and the US are pooling the talents of their defence sectors to develop at pace the delivery of advanced capabilities. Four UK companies have been selected by the UK’s Defence and Security Accelerator (DASA) to receive a share of the funding to develop solutions in electromagnetic targeting and protection.
The competition was run to find low cost, disposable, high volume and highly autonomous electromagnetic technology that can detect enemy actions or protect against them.
The four successful UK organisations to receive research funding are:
Amiosec Ltd
Autonomous Devices Ltd
Roke Manor Research Ltd
University of Liverpool
The trilateral AUKUS EW Challenge was run as 3 individual competitions by DASA in the UK; the Advanced Strategic Capabilities Accelerator (ASCA), in Australia; and the Defense Innovation Unit (DIU) in the US. The EW competition was the first in what will be a series of AUKUS Innovation Challenges, setting the template for future advanced defence technology competitions run by the 3 partners.
National winners of the 3 EW Challenge competitions were announced at the AUKUS Defence Ministers’ Meeting on 26 September in London by UK Secretary of State for Defence, the Right Honourable John Healey MP; Australia’s Deputy Prime Minister and Minister for Defence, the Honourable Richard Marles MP; and US Secretary of Defense Lloyd J. Austin III. The three Defence Ministers together emphasised the value of the collaboration to a free and open Indo-Pacific, with the potential to enhance joint defence capabilities, ensuring national, regional and global stability.
The 3 innovation competitions called for proposals to identify electromagnetic spectrum (EMS) technology solutions to help give the AUKUS nations a strategic edge in targeting and to provide protection against adversarial electromagnetic-targeting capabilities. EMS is a heavily congested, contested, complex and competitive environment and there is an increasing need for low cost, disposable, high volume and highly autonomous capabilities to achieve advantage.
In total, across all 3 national innovation challenges, 173 qualified suppliers applied, in a show of strength of the AUKUS nations’ defence innovation capabilities.
The winning UK supplier organisations:
Amiosec Ltd: This project is seeking to create fake radio activity, masking the true location of friendly military forces to support missions. The research will focus on extending previous work on AI-generated traffic to boost realism to defeat adversary EW systems. It will be delivered by Amiosec in conjunction with its Australian defence technology partner, Penten.
Autonomous Devices Ltd: Is developing and flight-demonstrating the novel combination of a radar Electronic Counter Measure and a small Uncrewed Air System platform.
Roke Manor Research Ltd: The ability to transmit and receive on identical frequencies simultaneously has been an operational and technical challenge for decades. The Smart STAR Jammer project sets out to combine a Simultaneous Transmit and Receive (STAR) Transceiver jointly developed by Roke and the University of Bristol.
University of Liverpool: This project aims to improve the ability to detect multiple individual faint signals in close geometric proximity to one another. This will be achieved using a combination of machine learning and statistics.
AUKUS is a landmark security and defence partnership to support a free and open Indo-Pacific by strengthening regional global security. A major part of the partnership, named Pillar 1, is helping Australia to acquire its first conventionally armed, nuclear-powered submarine fleet.
Through AUKUS Pillar 2 which includes advanced capabilities such as Artificial Intelligence, autonomy, quantum technologies and electronic warfare – the 3 national partners seek to strengthen trilateral capabilities in cutting-edge military technologies, increase interoperability, and drive knowledge-sharing and innovation. One of the aims of Pillar 2 is to “foster deeper integration of security and defence-related science, technology, industrial bases, and supply chains”.
Source: Hong Kong Government special administrative region
Keynote address by SJ at seminar titled Hong Kong: The Common Law Gateway for Malaysian Businesses to China and Beyond in Kuala Lumpur, Malaysia (English only) (with photos) Keynote address by SJ at seminar titled Hong Kong: The Common Law Gateway for Malaysian Businesses to China and Beyond in Kuala Lumpur, Malaysia (English only) (with photos) ******************************************************************************************
Following is the keynote address by the Secretary for Justice, Mr Paul Lam, SC, at the seminar titled Hong Kong: The Common Law Gateway for Malaysian Businesses to China and Beyond in in Kuala Lumpur, Malaysia, today (September 26): Her Excellency Dato’ Sri Azalina (Minister in the Prime Minister’s Department (Law and Institutional Reform), Malaysia, Dato’ Sri Azalina Othman Said), 鄭學方代辦 (Chargé d’Affaires of the Chinese Embassy in Malaysia, Mr Zheng Xuefang), Dato’ Seri Gobalakrishnan (President, National Chamber of Commerce and Industry of Malaysia), ladies and gentlemen, distinguished guests, I am very pleased to be here today. Firstly, I must thank all of you for joining our seminar. I was told that there are all together around 150 friends from Malaysia attending this event. It is a daunting task to speak right after such an eminent panel of speakers sharing their experiences and expertise. I would like to begin by a very important fact. That is the relationship between China and Malaysia. The year of 2024 is extremely important because it marked the 50th anniversary of the establishment of the diplomatic ties between the two countries. I think the exact date was May 31, 1974. Fast forward, in June this year, the Premier of the People’s Republic of China, Mr Li Qiang, visited Kuala Lumpur. On that occasion, he renewed a co-operation agreement between the two countries for another five years. And fast forward, not too long ago, I think less than two weeks ago on September 20, the King of Malaysia Sultan Ibrahim Iskandar went to Beijing and met President Xi Jinping. He described the trip as a great success. ASEAN is now the number one trading partner of China, and I understand that Malaysia is going to be the chairman of ASEAN in 2025. So I have no question whatsoever that the relationship between China and Malaysia and ASEAN will be taken to a new height in the very near future. Now, returning to Hong Kong. Many speakers have already mentioned the historical ties of people-to-people connection. Our Chief Executive actually came to Kuala Lumpur, Malaysia, in July 2023. On that occasion, 11 co-operation agreements and memorandum of understanding were signed. Your Minister of Investment, Trade and Industry actually came to Hong Kong a couple of weeks ago to attend the Hong Kong – ASEAN Summit. And right after that, the governments of Hong Kong and Malaysia announced that we are finalising the negotiation of establishing an Economic and Trade Office (ETO) in Kuala Lumpur and we are very hopeful that the ETO will be established very soon. Once again, that will signify another important development between Hong Kong and Malaysia. So the certainty is that we are going to see a much closer relationship or economic co-operation between the jurisdictions. And against this background, there must be a huge demand and need for legal co-operation between the two jurisdictions. That is exactly the purpose of my trip, joined by a group of very eminent lawyers from Hong Kong. The message that we wish to convey is reflected by the theme of this seminar – Hong Kong: The Common Law Gateway for Malaysian Businesses to China and Beyond. In answer to one of the questions posed by the participants, we are not saying that Hong Kong is the only gateway. It is not an exclusive gateway, but it is a very unique gateway. It is unique because, as Janice (panel speaker Ms Janice Chew) has mentioned, I used six factors to describe why Hong Kong legal service is unique in the sense that it cannot be found elsewhere. Now I have to repeat the six factors, but I would like to put that in a different way so that my friends who have attended the Ho Chi Minh City event would not feel bored. The first point is very important, which is also mentioned by some of the speakers — the stability of our common law system which is guaranteed to be continuing beyond 2047. Jern-fei (panel speaker Mr Ng Jern-fei, KC) mentioned that one of the linkage between Malaysia and Hong Kong is that we share the common law heritage. We are common law jurisdictions. In the past, there were questions as to whether the “one country, two systems” principle including our common law system can go beyond 2047. I think Elaine (panel speaker Ms Elaine Lo) gave a very good answer, she referred to government leases. But I can be even more specific. Firstly, I think that is one piece of freehold land in Hong Kong, the St John’s Cathedral. But subject to that, all land in Hong Kong is leasehold land. On July 5 this year, actually a very important legislation came into existence, that is known as the Extension of Government Leases Ordinance. The effect is that most leases in Hong Kong have been automatically renewed for 50 years in the sense that they will go beyond 2047. So it is not just a direction given by the central authorities. That has been given statutory force. I think that serves as a very good piece of evidence proving that the “one country, two systems” principle and the common law system will survive after 2047. The second factor goes to the reliability of our judicial system. When it comes to reliability of judicial system, I think I have to mention two facts, the quality of our judges and the integrity of our system. I think one of the speakers referred to the fact that the judgments of our Court of Final Appeal (CFA) have been cited in many other common law jurisdictions. I do have the statistics between 2018 and 2024, there are 46 occasions on which CFA judgments have been cited in many common law jurisdictions. This figure is provided by the Judiciary, so I think it is quite reliable. When it comes to integrity, our Judiciary put a lot of emphasis to ensure that our judicial proceedings will remain to be of very high standard and there is no compromise. One example, nowadays we are very fond of using artificial intelligence (AI) in our work. Our Judiciary issued a guideline in July this year regulating the use of artificial intelligence in judicial proceedings, in short, telling the judges in what circumstances and for what purposes they can resort to AI. I think the purpose is to ensure that our judicial proceedings will not be compromised by the use of modern technology. So that’s the second point. The third point is we have a very business-friendly legal environment. I can again give you some objective evidence. According to the World Competitiveness Yearbook 2024 compiled by the International Institute for Management Development in Switzerland, Hong Kong overall ranked the fifth, and when it comes to business legislation, the business law, Hong Kong ranked the first in the world. So that tells a lot about the quality of our business law. But we recognise that there is no room for complacency. And Elaine also mentioned one point about how we ensure that our business environment will be as attractive as possible to investors. She referred to a new listing rule. In March last year, the Hong Kong Stock Exchange introduced a Chapter 18C under the Listing Rules to allow specialist technology company to get listed in Hong Kong. And the first successful case actually took place on June 13 this year. A company named QuantumPharm Inc, stationed in Shenzhen and specialised in artificial intelligence and robotics, became a public listed company pursuant to Chapter 18C. Again, that is a very good piece of evidence showing the efforts that we have made to ensure that our laws and regulations will remain to be very business-friendly and attractive. The fourth point is that we provide a very safe and secure environment – no exchange control, freedom of movement of funds and property. One of the participants asked a question about the ICAC (Independent Commission Against Corruption), that is a very important matter. In fact, in my very brief conversation with Her Excellency Minister right before we enter this room, this is a matter that we touched upon. Hong Kong is a very safe place because we have very clean law enforcement agencies to ensure that all the laws and regulations will be strictly enforced. There is a Corruption Perceptions Index compiled by an NGO (non-governmental organisation) called Transparency International. I think for the latest survey, Hong Kong ranked 14th out of 180 countries and territories. So that’s why you are so interested about ICAC, because it is the institution responsible for ensuring there is no corruption. So for all practical purpose, there is absence of corruption in Hong Kong. The fifth point is the feature that distinguishes Hong Kong from any other common law jurisdictions. That is our connection, the connection with the Mainland legal system via a number of very important mutual legal assistance arrangements. Now Joanne (panel speaker Ms Joanne Lau) has mentioned one of them, the interim arrangement, but I would like to give another example, which is also very telling. In January this year, a mutual legal arrangement concerning the mutual recognition and enforcement of judgments in civil and commercial matters by the courts of the Mainland and of the Hong Kong Special Administrative Region came into effect in Hong Kong. It means that a Hong Kong judgment, provided that certain criteria and conditions have been fulfilled, can be enforced and recognised in Mainland China, and vice versa. And I would like to compare the arrangement with the Hague Judgments Convention, because we have adopted the same principle. We are more liberal in the sense that while we are striking a balance between the interest of judgment creditor and the judgment debtor, the scope or the type of cases covered by this arrangement is even wider than the Hague Judgments Convention. It is because some types of intellectual property (IP) cases have been included in the arrangement, whereas IP cases have been completely excluded from the Hague Judgments Convention. So this is my fifth factor. The last factor is also something very important. It is about the abundant supply of truly international legal practitioners. We have very good examples here. For example, Janice, she is dually qualified in Malaysia and Hong Kong. But she is just one of the numerous examples. There are around 13 000 solicitors, 1 600 barristers and more than 920 law firms in Hong Kong. Some of these firms have altogether 315 oversea offices and 85 offices in Mainland China. And we have 77 registered foreign law firms and more than 1 450 registered foreign lawyers. And I think three of them are qualified in Malaysia. So when you instruct a Hong Kong lawyer, you are not instructing a mere Hong Kong lawyer but you are instructing a global lawyer who is able to provide legal service not confining to matters concerning Hong Kong law. Another important factor is that we are not just familiar with the common law, we are not just familiar with international law practice, we are also familiar with the Chinese culture – how things are done in our culture, why things are done in a certain way, why documents are drafted in a certain manner. And when it comes to legal service, what is important? It is not simply your knowledge about the law, it is how much you know your client, how much you know how the business community actually works. It is about knowing the people instead of knowing the law on paper. So combining these six factors, I would venture to say that not only the gateway is a very scenic route, as mentioned by Jern-fei, but it is also a very unique route that you cannot find elsewhere. But to enable the very unique legal services to serve the interests of Malaysia, I think the pre-condition is that we have to know each other better and we have to have more platforms for regular exchanges and to explore opportunities for collaboration. That’s why I am very delighted that in a moment, the Asian International Arbitration Centre in Malaysia is going to sign MOU (Memorandum of Understanding) with the SCIA (South China International Arbitration Center (HK)) and also with eBRAM (eBRAM International Online Dispute Resolution Centre). I am aware that you have many questions, but because of the time constraint, the panel speakers were not able to answer all the questions as pointed out about Alex (panel moderator Mr Alexander Tang). But right after this seminar we have a reception which I believe will last until 8pm. So I would encourage all of you to take the opportunity to have more exchanges and to make friends. I’m sure that all the members from the Hong Kong delegation will be more than happy to answer whatever questions that you have in mind. I always like to use analogy to end my submission. I always describe the legal service offered by Hong Kong is something like you are entering a food plaza or food hall which consists of many different types of restaurants serving different cuisines. And the important point is that no matter what you want, no matter what you need, you name it and you will get it. So that is what Hong Kong undertakes to serve. And I do hope that today marked a new beginning of the collaboration between Malaysia and Hong Kong when it comes to legal co-operation. I look forward to meeting all of you very soon, perhaps right after the seminar or on other occasion. Thank you very much.
Ends/Thursday, September 26, 2024Issued at HKT 23:55
In a surprise finding, astronomers using NASA’s Hubble Space Telescope have discovered that the blowtorch-like jet from a supermassive black hole at the core of a huge galaxy seems to cause stars to erupt along its trajectory. The stars, called novae, are not caught inside the jet, but apparently in a dangerous neighborhood nearby.
The finding is confounding researchers searching for an explanation. “We don’t know what’s going on, but it’s just a very exciting finding,” said lead author Alec Lessing of Stanford University. “This means there’s something missing from our understanding of how black hole jets interact with their surroundings.”
A nova erupts in a double-star system where an aging, swelled-up, normal star spills hydrogen onto a burned-out white dwarf companion star. When the dwarf has tanked up a mile-deep surface layer of hydrogen that layer explodes like a giant nuclear bomb. The white dwarf isn’t destroyed by the nova eruption, which ejects its surface layer and then goes back to siphoning fuel from its companion, and the nova-outburst cycle starts over again.
Hubble found twice as many novae going off near the jet as elsewhere in the giant galaxy during the surveyed time period. The jet is launched by a 6.5-billion-solar-mass central black hole surrounded by a disk of swirling matter. The black hole, engorged with infalling matter, launches a 3,000-light-year-long jet of plasma blazing through space at nearly the speed of light. Anything caught in the energetic beam would be sizzled. But being near its blistering outflow is apparently also risky, according to the new Hubble findings. Download this image
The finding of twice as many novae near the jet implies that there are twice as many nova-forming double-star systems near the jet or that these systems erupt twice as often as similar systems elsewhere in the galaxy.
“There’s something that the jet is doing to the star systems that wander into the surrounding neighborhood. Maybe the jet somehow snowplows hydrogen fuel onto the white dwarfs, causing them to erupt more frequently,” said Lessing. “But it’s not clear that it’s a physical pushing. It could be the effect of the pressure of the light emanating from the jet. When you deliver hydrogen faster, you get eruptions faster. Something might be doubling the mass transfer rate onto the white dwarfs near the jet.” Another idea the researchers considered is that the jet is heating the dwarf’s companion star, causing it to overflow further and dump more hydrogen onto the dwarf. However, the researchers calculated that this heating is not nearly large enough to have this effect.
“We’re not the first people who’ve said that it looks like there’s more activity going on around the M87 jet,” said co-investigator Michael Shara of the American Museum of Natural History in New York City. “But Hubble has shown this enhanced activity with far more examples and statistical significance than we ever had before.”
Shortly after Hubble’s launch in 1990, astronomers used its first-generation Faint Object Camera (FOC) to peer into the center of M87 where the monster black hole lurks. They noted that unusual things were happening around the black hole. Almost every time Hubble looked, astronomers saw bluish “transient events” that could be evidence for novae popping off like camera flashes from nearby paparazzi. But the FOC’s view was so narrow that Hubble astronomers couldn’t look away from the jet to compare with the near-jet region. For over two decades, the results remained mysteriously tantalizing.
Compelling evidence for the jet’s influence on the stars of the host galaxy was collected over a nine-month interval of Hubble observing with newer, wider-view cameras to count the erupting novae. This was a challenge for the telescope’s observing schedule because it required revisiting M87 precisely every five days for another snapshot. Adding up all of the M87 images led to the deepest images of M87 that have ever been taken.
[embedded content]
In a surprise finding, astronomers, using NASA’s Hubble Space Telescope have discovered that the jet from a supermassive black hole at the core of M87, a huge galaxy 54 million light years away, seems to cause stars to erupt along its trajectory.NASA’s Goddard Space Flight Center; Lead Producer: Paul Morris
Hubble found 94 novae in the one-third of M87 that its camera can encompass. “The jet was not the only thing that we were looking at — we were looking at the entire inner galaxy. Once you plotted all known novae on top of M87 you didn’t need statistics to convince yourself that there is an excess of novae along the jet. This is not rocket science. We made the discovery simply by looking at the images. And while we were really surprised, our statistical analyses of the data confirmed what we clearly saw,” said Shara.
This accomplishment is entirely due to Hubble’s unique capabilities. Ground-based telescope images do not have the clarity to see novae deep inside M87. They cannot resolve stars or stellar eruptions close to the galaxy’s core because the black hole’s surroundings are far too bright. Only Hubble can detect novae against the bright M87 background.
Novae are remarkably common in the universe. One nova erupts somewhere in M87 every day. But since there are at least 100 billion galaxies throughout the visible universe, around 1 million novae erupt every second somewhere out there.
The Hubble Space Telescope has been operating for over three decades and continues to make ground-breaking discoveries that shape our fundamental understanding of the universe. Hubble is a project of international cooperation between NASA and ESA (European Space Agency). NASA’s Goddard Space Flight Center in Greenbelt, Maryland, manages the telescope and mission operations. Lockheed Martin Space, based in Denver, Colorado, also supports mission operations at Goddard. The Space Telescope Science Institute in Baltimore, Maryland, which is operated by the Association of Universities for Research in Astronomy, conducts Hubble science operations for NASA.
Real gross domestic product (GDP) increased at an annual rate of 3.0 percent in the second quarter of 2024 (table 1), according to the “third” estimate released by the U.S. Bureau of Economic Analysis. In the first quarter, real GDP increased 1.6 percent (revised).
The GDP estimate released today is based on more complete source data than were available for the “second” estimate issued last month. In the second estimate, the increase in real GDP was also 3.0 percent. The update primarily reflected upward revisions to private inventory investment and federal government spending that were offset by downward revisions to nonresidential fixed investment and exports (refer to “Updates to GDP”). Imports, which are a subtraction in the calculation of GDP, were revised up.
The increase in real GDP primarily reflected increases in consumer spending, private inventory investment, and nonresidential fixed investment. Imports increased (table 2).
Compared to the first quarter, the acceleration in real GDP in the second quarterly primarily reflected an upturn in private inventory investment and an acceleration in consumer spending. These movements were partly offset by a downturn in residential fixed investment.
Current‑dollar GDP increased 5.6 percent at an annual rate, or $392.6 billion, in the second quarter to a level of $29.02 trillion, a $9.5 billion larger increase than the previous estimate (tables 1 and 3). More information on the source data that underlie the estimates is available in the “Key Source Data and Assumptions” file on BEA’s website.
The price index for gross domestic purchases increased 2.4 percent in the second quarter, the same as the previous estimate (table 4). The personal consumption expenditures (PCE) price index increased 2.5 percent, the same as the previous estimate. Excluding food and energy prices, the PCE price index increased 2.8 percent, also the same as the previous estimate.
Personal Income
Current-dollar personal income increased $315.7 billion in the second quarter, an upward revision of $82.1 billion from the previous estimate. The increase primarily reflected increases in compensation and personal current transfer receipts (table 8).
Disposable personal income increased $260.4 billion, or 5.0 percent, in the second quarter, an upward revision of $77.3 billion from the previous estimate. Real disposable personal income increased 2.4 percent, an upward revision of 1.4 percentage points.
Personal saving was $1.13 trillion in the second quarter, an upward revision of $74.3 billion from the previous estimate. The personal saving rate—personal saving as a percentage of disposable personal income—was 5.2 percent in the second quarter, compared with 5.4 percent (revised) in the first quarter.
Gross Domestic Income and Corporate Profits
Real gross domestic income (GDI) increased 3.4 percent in the second quarter, an upward revision of 2.1 percentage points from the previous estimate. The average of real GDP and real GDI, a supplemental measure of U.S. economic activity that equally weights GDP and GDI, increased 3.2 percent in the second quarter, an upward revision of 1.1 percentage points from the previous estimate (table 1).
Profits from current production (corporate profits with inventory valuation and capital consumption adjustments) increased $132.5 billion in the second quarter, an upward revision of $74.9 billion from the previous estimate (table 10).
Profits of domestic financial corporations increased $42.5 billion in the second quarter, a downward revision of $4.0 billion from the previous estimate. Profits of domestic nonfinancial corporations increased $108.8 billion, an upward revision of $79.6 billion. Rest-of-the-world profits decreased $18.8 billion, a downward revision of $0.7 billion. In the second quarter, receipts increased $4.4 billion, and payments increased $23.1 billion.
Updates to GDP
With the third estimate, upward revisions to private inventory investment and federal government spending were offset by downward revisions to nonresidential fixed investment, exports, consumer spending, and residential fixed investment. Imports were revised up. For more information, refer to the Technical Note. For information on updates to GDP, refer to the “Additional Information” section that follows.
Advance Estimate
Second Estimate
Third Estimate
(Percent change from preceding quarter)
Real GDP
2.8
3.0
3.0
Current-dollar GDP
5.2
5.5
5.6
Real GDI
…
1.3
3.4
Average of Real GDP and Real GDI
…
2.1
3.2
Gross domestic purchases price index
2.3
2.4
2.4
PCE price index
2.6
2.5
2.5
PCE price index excluding food and energy
2.9
2.8
2.8
Real GDP by Industry
Today’s release includes estimates of GDP by industry, or value added—a measure of an industry’s contribution to GDP. Private goods-producing industries increased 6.9 percent, private services-producing industries increased 2.4 percent, and government increased 0.8 percent (table 12). Overall, 16 of 22 industry groups contributed to the second-quarter increase in real GDP.
Within private goods-producing industries, the leading contributors to the increase were nondurable goods manufacturing (led by petroleum and coal products) and durable goods manufacturing (led by motor vehicles, bodies and trailers, and parts) (table 13).
Within private services-producing industries, the leading contributors to the increase were finance and insurance (led by Federal Reserve banks, credit intermediation, and related activities); health care and social assistance (led by ambulatory health care services); as well as real estate and rental and leasing (led by real estate).
The increase in government reflected increases in state and local government as well as federal government.
Gross Output by Industry
Real gross output—principally a measure of an industry’s sales or receipts, which includes sales to final users in the economy (GDP) and sales to other industries (intermediate inputs)—increased 1.8 percent in the second quarter. This reflected an increase of 2.1 percent for private goods-producing industries, an increase of 1.7 percent for private services-producing industries, and an increase of 2.2 percent for government (table 16). Overall, 18 of 22 industry groups contributed to the increase in real gross output.
Annual Update of the National Economic Accounts
Today’s release presents results from the annual update of the National Economic Accounts (NEAs), which include the National Income and Product Accounts (NIPAs) and the Industry Economic Accounts (IEAs). The update includes revised estimates for the first quarter of 2019 through the first quarter of 2024 and resulted in revisions to GDP, GDP by industry, GDI, and their major components. The reference year remains 2017.
With today’s release, most data are available through BEA’s Interactive Data application on the BEA website (www.bea.gov). Refer to “Information on 2024 Annual Updates to the National, Industry, and State and Local Economic Accounts” for the complete table release schedule and a summary of results through 2023, which includes information on methodology changes. A table showing the major current dollar revisions and their sources for each component of GDP, national income, and personal income is also provided. An article describing the update in more detail will be forthcoming in the Survey of Current Business.
The updated estimates show that real GDP increased at an average annual rate of 2.3 percent from 2018 to 2023, 0.2 percentage point higher than the previously published estimate. Over the same period, real GDI increased at an average annual rate of 2.2 percent, 0.4 percentage point higher than previously published. The average of real GDP and real GDI over the same period was 2.3 percent, 0.4 percentage point higher than previously published.
For the period of economic expansion from the second quarter of 2009 through the fourth quarter of 2019, real GDP increased at an annual rate of 2.5 percent, revised up 0.1 percentage point from the previously published estimates. For the period of economic contraction from the fourth quarter of 2019 through the second quarter of 2020, real GDP decreased at an annual rate of 17.5 percent, the same as previously estimated. For the period of economic expansion from the second quarter of 2020 through the first quarter of 2024, real GDP increased at an annual rate of 5.2 percent, 0.3 percentage point higher than previously estimated.
Previously published estimates, which are superseded by today’s release, are found in BEA’s archives.
Updates for the First Quarter of 2024
For the first quarter of 2024, real GDP is now estimated to have increased 1.6 percent (table 1), an upward revision of 0.2 percentage point from the previously published estimate, primarily reflecting an upward revision to consumer spending that was partly offset by downward revisions to private inventory investment and residential fixed investment.
The price index for gross domestic purchases is now estimated to have increased 3.0 percent, a downward revision of 0.1 percentage point. The PCE price index increased 3.4 percent, the same as previously published. Excluding food and energy, the PCE price index increased 3.7 percent, the same as previously published.
First Quarter 2024
Previous Estimate
Revised
(Percent change from preceding quarter)
Real GDP
1.4
1.6
Current-dollar GDP
4.5
4.7
Real GDI
1.3
3.0
Average of Real GDP and Real GDI
1.4
2.3
Gross domestic purchases price index
3.1
3.0
PCE price index
3.4
3.4
PCE price index excluding food and energy
3.7
3.7
Personal Income
Current-dollar personal income is now estimated to have increased $536.4 billion in the first quarter, an upward revision of $139.6 billion from the previous estimate. The revision primarily reflected an upward revision to compensation (led by private wages and salaries) (table 8).
Disposable personal income increased $465.1 billion, or 9.2 percent, in the first quarter, an upward revision of $224.9 billion from the previous estimate. Real disposable personal income increased 5.6 percent, an upward revision of 4.3 percentage points.
Personal saving was $1.15 trillion in the first quarter, an upward revision in change of $188.3 billion. The personal saving rate—personal saving as a percentage of disposable personal income—was 5.4 percent (revised) in the first quarter.
Gross Domestic Income and Corporate Profits
Real GDI is now estimated to have increased 3.0 percent in the first quarter (table 1); in the previously published estimates, first-quarter GDI was estimated to have increased 1.3 percent. The leading contributor to the upward revision was compensation, based primarily on new first-quarter wage and salary estimates from the Bureau of Labor Statistics’ Quarterly Census of Employment and Wages. The average of real GDP and real GDI is now estimated to have increased 2.3 percent in the first quarter; in the previously published estimates, the average of GDP and GDI was estimated to have increased 1.4 percent.
Profits from current production (corporate profits with inventory valuation and capital consumption adjustments) is now estimated to have decreased $65.1 billion in the first quarter, a downward revison of $18.0 billion (table 10).
Profits of domestic financial corporations increased $57.4 billion, a downward revision of $7.6 billion. Profits of domestic nonfinancial corporations decreased $124.9 billion, a downward revision of $10.4 billion. Rest-of-the-world profits increased $2.3 billion, the same as previously estimated. In the first quarter, receipts are now estimated to have increased $25.7 billion, and payments are estimated to have increased $23.4 billion.
GDP by Industry
In the first quarter, real value added for private goods-producing industries is now estimated to have decreased 2.6 percent, a downward revision of 1.5 percentage points. Private services-producing industries increased 2.6 percent, an upward revision of 0.7 percentage point. Government increased 1.9 percent, a downward revision of 0.4 percentage point.
Real gross output is now estimated to have increased 2.8 percent, an upward revision of 0.3 percentage point. Private goods-producing industries increased 1.6 percent, an upward revision of 0.4 percentage point. Private services-producting industries increased 3.3 percent, an upward revision of 0.2 percentage point. Government increased 2.3 percent, an upward revision of 0.6 percentage point.
* * *
Next release, October 30, 2024, at 8:30 a.m. EDT Gross Domestic Product, Third Quarter 2024 (Advance Estimate)
LONDON, UK – SEPTEMBER 26, 2024 – Today, Samsung Electronics UK announced innovations that provide users with smarter and more efficient ways to control their energy. The company unveiled new technology and partnerships to optimise energy usage throughout the home.
Ahead of Winter, Samsung UK revealed a host of advancements powered by SmartThings Energy: eco-tech provider Hive’s thermostats will be integrated into SmartThings from the middle of October, so customers will benefit from an extension of the British Gas PeakSave program, and Tesla technology will also be compatible with the SmartThings App.
Increased SmartThings Connectivity with Hive Integration
To further simplify how users manage their energy usage at home, SmartThings Energy is integrating Hive’s thermostats, so that households can control their home’s temperature directly through the SmartThings app.
The integration of Hive thermostats allows consumers to check their home’s current temperature and set new temperature targets as well as setting at home temperatures when customers are on the move. Installing a Hive Thermostat can save customers up to £172 per year on their heating bill[1]
Maximising Energy Savings through Leading Partnerships
In partnership with British Gas, Samsung UK is also helping households better manage their energy use and make savings when it comes to their energy bills. The expansion of the collaboration between Samsung and British Gas allows SmartThings Energy users to automate appliances, and other connected products, as part of British Gas PeakSave.
The PeakSave program rewards customers for reducing their electricity usage during peak hours, to times when there is more renewable energy readily available. SmartThings Energy users can automate appliances’ operating modes during these times, allowing them to easily take advantage of periods when electricity is half-price due to there being lots of renewable energy available, and rewards users for shifting their electricity to when there is less demand. So far, British Gas has paid over £13 million to 650,000 customers taking part in the scheme.
Boosted Home Energy Experience with Tesla Energy API for UK users
Energy-saving starts within the home, but it doesn’t need to stop there. Earlier this year at CES Samsung announced its collaboration with Tesla for SmartThings Energy and now UK users can benefit from this increased connectivity, allowing users to easily access information relating to users’ energy production, storage and usage via SmartThings Energy.
Made possible through Tesla’s open APIs, the expansion of SmartThings Energy allows users to connect with their Tesla Powerwall, and Solar Inverter for a more streamlined smart home experience.
In addition to making it easier to manage energy consumption, this integration allows for better preparations for power disruptions and outages. SmartThings syncs up with the Tesla app’s Powerwall ‘Storm Watch’ function – meaning in the case of extreme weather events users can be alerted through SmartThings on their connected Samsung TV’s and mobile.
Deborah Honig, Chief Customer Officer, Samsung UK and Ireland, comments: “We know that controlling energy consumption is a top priority for our customers, and as we head into winter this becomes an even bigger priority.
“We are continually evolving our SmartThings energy management features and extending our partnerships with British Gas and Tesla, to make it even easier and more intuitive for customers to manage their home energy usage.
“By providing new automated tech solutions that help our customers save time, money and energy, we are seeing even more people do that ‘little bit extra’ every day to take of their home and the planet.”
Dan Rosenfield, Managing Director of Hive, added: “We are delighted to be extending our partnership with Samsung to energise a greener, fairer future for our customers. As we head into Winter, we are making it easier for our customers to save money on their energy bills and cut carbon through integrating our market-leading propositions into the SmartThings app.”
SmartThings is the only place where Tesla Powerwalls, British Gas PeakSave, Samsung Smart Home appliances, and Smart Meters can be managed in one place to optimise the use of energy across the home. These new partnerships and innovations are part of Samsung’s drive to enhance the multi-device experience of SmartThings users.
[1] Saving of £172.17 based on a Ofgem typical annual gas consumption of 11,500 kWh at the October 2024 UK average unit price of 6.238 pence per kWh including VAT. Emissions saved per year: 508 kg CO2 (0.184kg per kWh). Actual savings will vary depending on individual circumstances./span>
The value of Hong Kong’s total exports increased to $381.3 billion in August, up 6.4% on the same month last year, the Census & Statistics Department announced today.
The value of the city’s imports rose 7.9% to $414.4 billion in the same period.
A trade deficit of $33.1 billion, or 8% of the value of imports, was recorded for the month.
Comparing the three-month period to August with the preceding three months on a seasonally adjusted basis, the value of Hong Kong’s exports rose 0.3%, while that of its imports increased 3.8%.
The Government said the value of merchandise exports grew solidly in August over a year earlier. Exports to the Mainland, the US and the European Union registered increases of varying degrees, while exports to other major Asian markets were of mixed performance.
Looking ahead, the Government said that performance of Hong Kong’s exports should remain positive if external demand continues to hold up, but noted that geopolitical tensions and trade conflicts will present risks.
A new Smoke Free website has launched to help people in Coventry and Warwickshire quit smoking.
It provides details of local free, confidential stop smoking services, as well as resources and information about smoking and vaping. It was created through a partnership between Warwickshire County Council (WCC) and Coventry City Council (CCC) with funding from the UK Government.
The website is part of a national effort championed by the UK Government to create the first ever smoke free generation. Under this initiative, earlier this year both councils received funding to increase local authority-led stop smoking services and support to reduce smoking rates across Coventry and Warwickshire.
An estimated 18.4% of people aged 18+ smoke in Coventry and 13.9% in Warwickshire. In Warwickshire, this varies across the district and boroughs. (Source: Annual Population Survey, Office for National Statistics, 2022.) Those who wish to quit often struggle due to their addiction to nicotine – over 80% of smokers start before they turn twenty, most as children (Source: Tobacco and Vapes Bill 2024). The new Smoke Free website and enhanced services and initiatives aim to tackle this by providing evidence-based support that is free, non-judgemental, and easy to access.
People aged 12+ who live, work, or are registered with a GP in Coventry or Warwickshire are entitled to free support. Smokers who sign up to their local stop smoking service get access to the following:
12 weeks of one-to-one support (face-to-face or virtual) with a specialist stop smoking practitioner.
People who quit smoking with the support of a stop smoking service are three times more likely to quit for good.
A male Warwickshire resident, aged 67, who recently accessed the Warwickshire stop smoking service said : “I have smoked for over 50 years and smoking 30 cigarettes a day I never in a million years thought I could do it, all of the staff I have spoken to during my journey have been amazing and I thank them very much for helping me get where I am today. I have quit and remain confident that I will continue to stay quit for the future ahead.”
Allison Duggal, Director of Public Health in Coventry said: “The website will help people to access services and it really makes sense to work alongside Warwickshire colleagues.
“We have a particular focus on young people, in fact I started smoking myself at a young age and it doesn’t surprise me that eight of 10 smokers started before they turn 20.
“I managed to stop 21 years ago, but I know it is not an easy process for people. We have lots more work to do to help people through the process of stopping. It’s about managing cravings, withdrawals and the reliance that people have with smoking.
“People from the age of 12 can access free support so we want everyone to know there is help available.”
She added: “I feel so much healthier and it’s why I feel able to train for my first marathon.”
Councillor Margaret Bell, Portfolio Holder for Social Care and Health at WCC, said: “We know how challenging quitting smoking can be, but having the right support makes all the difference. Our new website is part of a wider enhancement of the stop smoking support available to people in Warwickshire.
“Smoking has a huge impact on an individual’s health – quitting can reduce your risk of developing dementia, lung disease, heart disease, cancer and stroke. Stopping smoking also boosts your mental health and wellbeing. We encourage any residents who smoke to visit the website and learn more about the support available, and in doing so, take their first step towards happier, healthier lives.”
Smokers are encouraged to learn more by visiting smokefreecw.co.uk. Free stop smoking support can also be accessed via phone on 0800 122 3780 for Coventry services or 0333 005 0092 for Warwickshire services.
Stopping smoking is hard, but when a new baby is due, quitting smoking is one of the best choices people can make as a family to give their baby the best start in life. Across Coventry and Warwickshire, there are specialist Stop Smoking in Pregnancy advisors trained to support pregnant people and their families through their journey to stop smoking. Information on stop smoking in pregnancy services.
Both WCC and CCC are also increasing the awareness of the impact of vaping, with the clear message: if you don’t smoke, don’t vape and children should never vape. Vaping information and advice.
Further work is being scoped to provide additional support and initiatives to reduce smoking prevalence across Coventry and Warwickshire with a particular focus on priority groups.
Source: The White House
New Executive Order Directs Federal Agencies to Combat Emerging Firearms Threats andImprove School-Based Active Shooter Drills
Today, President Biden and Vice President Harris are announcing a new Executive Order directing federal agencies to improve school-based active shooter drills and combat the emerging threats of machinegun conversion devices and unserialized, 3D-printed firearms, as well as additional executive actions that advance the Biden-Harris Administration’s agenda to reduce gun violence and save lives.
After the prior Administration oversaw the largest one-year increase in murders ever recorded, President Biden and Vice President Harris took action from the start of their Administration to reduce violent crime. The President and the Vice President helped deliver over $15 billion in funding through the American Rescue Plan for law enforcement, community violence interventions, and other public safety strategies. By the middle of 2022, the Biden-Harris Administration had already announced more executive actions to reduce gun violence than any other administration. Then, on June 25, 2022, President Biden signed into law the Bipartisan Safer Communities Act, the most significant gun violence prevention law in nearly 30 years. On September 22, 2023, to help drive further progress, President Biden established the first-ever White House Office of Gun Violence Prevention, overseen by Vice President Harris.
Under the leadership of President Biden and Vice President Harris, in 2023 the United States experienced the single largest homicide rate drop in recent history. The reduction in homicide has accelerated this year. Data submitted to the Department of Justice shows that the homicide rate dropped another 17 percent from January through June 2024, compared to the same time period in 2023. Data from the Gun Violence Archive indicates that the number of mass shootings so far this year is 20 percent lower than it was at this time last year.
Today, as we mark one year since the establishment of the Office, President Biden and Vice President Harris are announcing additional meaningful actions to reduce gun violence and save lives. This announcement builds on the numerous additional life-saving actions the Biden-Harris Administration has taken, as detailed in the Office’s Year One Progress Report.
President Biden is signing an Executive Order to accelerate progress on two key priorities: combating emerging firearms threats and improving school-based active shooter drills.
Combatting Emerging Firearms Threats: In April 2021, one of the Biden-Harris Administration’s first executive actions to reduce gun violence was to address the emerging threat of firearms without serial numbers, often referred to as “ghost guns.” To expand these efforts, ATF established an Emerging Threats Center. This Center focuses ATF’s resources on identifying developments in illicit firearm marketplaces, including the use of new technologies to make and unlawfully distribute undetectable firearms and devices that convert semi-automatic firearms into illegal machineguns.
Now, President Biden and Vice President Harris are taking additional action on two emerging firearms threats: machinegun conversion devices and unserialized, 3D-printed firearms.
Machinegun conversion devices enable semi-automatic firearms, including easily concealable handguns, to match or exceed the rate of fire of many military machineguns with a single engagement of the trigger—up to 20 bullets in one second. From 2017 through 2021, ATF recovered 5,454 of these devices, a 570 percent increase over the previous five-year period. Machinegun conversion devices are illegal to possess under federal law, but we continue to see these devices show up at crime scenes because they are small, cheap, and easy to install. Machinegun conversion devices are often illegally imported or illegally made on a 3D printer from computer code found online. The 3D-printing of a machinegun conversion device costs as little as 40 cents and takes fewer than 30 minutes.
Unserialized, 3D-printed firearms can be used for illegal purposes such as gun trafficking, unlawful possession by people convicted of felonies or subject to domestic violence restraining orders, or unlawfully engaging in the business of manufacturing or selling firearms. These firearms can be 3D-printed from computer code downloaded from the Internet and produced without serial numbers that law enforcement use to trace firearms recovered in criminal investigations. Some 3D-printed firearms can be made to be undetectable by magnetometers used to secure airports, courthouses, and event spaces, even though these undetectable firearms are illegal to make, sell, or possess under federal law. As 3D-printing technology continues to develop rapidly, the safety threat posed by 3D-printed firearms may suddenly increase.
In this Executive Order, President Biden is establishing an Emerging Firearms Threats Task Force, consisting of leadership from key federal departments and agencies. President Biden is directing the Task Force to issue a report within 90 days that includes: an assessment of the threat posed by machinegun conversion devices and unserialized, 3D-printed firearms; an assessment of federal agencies’ operational and legal capacities to detect, intercept, and seize machinegun conversion devices and unserialized, 3D-printed firearms; and an interagency plan for combatting these emerging threats. The report will include any additional authorities or funding the federal agencies need from Congress in order to complete this work.
Improving School-Based Active Shooter Drills: The Biden-Harris Administration is committed to preventing gun violence in schools, including by keeping guns out of the hands of potential school shooters and investing more resources in school safety and violence prevention. The majority of schools are currently using drills to prepare for an active shooter situation. Despite the ubiquity of these drills, there is very limited research on how to design and deploy these drills to maximize their effectiveness and limit any collateral harms they might cause. Many parents, students, and educators have expressed concerns about the trauma caused by some approaches to these drills. Federal agencies need to help schools improve drills so they can more effectively prepare for an active shooter situation while also preventing or minimizing any trauma.
In the Executive Order, President Biden is directing the Secretary of Education and the Secretary of Homeland Security, in coordination with the Attorney General, the Secretary of Health and Human Services, and the U.S. Surgeon General, to develop and publish, within 110 days, information for K-12 schools and institutions of higher education regarding school-based active shooter drills. The information will include a summary of: existing research on active shooter drills and resources for school districts and institutions of higher education on how to create, implement, and evaluate evidence-informed active shooter drills; how to conduct effective and age- and developmentally-appropriate drills; how best to communicate with students, families, and educators about these drills; how to prevent students and educators from experiencing trauma or psychological distress associated with these drills; and how best to serve people with disabilities and those with language-related needs, including by ensuring compliance with federal civil rights laws, when designing and implementing school-based active shooter drills.
In addition to the Executive Order, federal departments and agencies are taking the following actions:
Promoting Safe Gun Storage and Red Flag Laws
Encouraging Safe Storage of Firearms: Today, the Department of Education is providing schools, school boards, and policymakers with a new tool to promote safe gun storage in their communities. Following up on its initial safe storage actions, the Department of Education is publishing an interactive website that highlights examples of state, community, and school district actions across the nation that promote safe gun storage within school communities. The website includes a map with state safe storage laws, examples of how schools are communicating with parents about safe storage, and examples of local policies on safe storage education. This new resource builds on guidance the Department published earlier this year to highlight physical safety measures schools can pursue to help keep students safe in the event of gun violence in schools.
Clarifying Medicaid Reimbursement for Counseling on Firearm Safety: Health systems, hospitals, and healthcare workers are an essential component of a healthy gun violence prevention and intervention system. By the end of October, the Centers for Medicare and Medicaid Services (CMS) will announce that states may choose to use Medicaid to pay a health care provider for counseling parents and caregivers on firearm safety and injury prevention. This announcement will build off the coverage that Medicaid provides for “anticipatory guidance,” which is health education and counseling to help parents and caregivers understand and improve the health and development of their children. For example, Bright Futures/American Academy of Pediatrics’ guidelines include firearm safety guidance, such as safe storage guidance, as recommended anticipatory guidance for pediatricians to provide to parents.
Implementing State Red Flag Laws: The Department of Justice is announcing over $135 million in formula awards to 48 states under the Byrne State Crisis Intervention Program (Byrne SCIP), which provides funding for the implementation of extreme risk protection order, or “red flag”, programs, state crisis intervention court proceedings, and related programs/initiatives. The implementation of state red flag laws is supported by the National Extreme Risk Protection Resource Center.
Funding Community Violence Intervention
Funding Community Violence Interventions: In furtherance of the Biden-Harris Administration’s strategy to invest in community violence interventions as a proven solution to prevent gun violence, the Department of Justice is announcing an additional $85 million in funding through the Community Violence Intervention and Prevention Initiative (CVIPI). This funding will help 30 agencies and organizations develop and expand their community violence intervention work, including hospital-based violence intervention, street outreach, and cognitive behavioral therapy. These strategies are essential complements to law enforcement and this investment is part of the $400 million in total funding that the Biden-Harris Administration has secured for CVIPI. CVIPI is only one part of how the Administration funds community violence interventions. This fact sheet lists the full range of federal resources available to address community violence.
Clarifying Medicaid Reimbursement for Violence Intervention: CMS previously clarified that states may authorize health care providers to be reimbursed by Medicaid for violence intervention programs. In October, CMS expects to proactively raise this clarification with states. CMS will also explore how best to convene state governments and healthcare providers on incorporating Medicaid benefits into violence prevention programs.
Improving the Gun Background Check System
Facilitating Enhanced Background Checks for Individuals Under Age 21: The Bipartisan Safer Communities Act (BSCA) established enhanced background checks for individuals under age 21 trying to purchase a firearm. These enhanced checks have already stopped over 900 transactions, keeping guns out of the hands of dangerous individuals. But a number of states across the country have privacy laws that prevent state officials from fully responding to enhanced background check inquiries. The Biden-Harris Administration’s Safer States Agenda made fixing this issue a top priority for states, and Connecticut, Vermont, Nevada, Texas, and Kentucky have all recently made necessary changes. Today, the Department of Justice is issuing model legislation that additional states may use to inform their own legislation and allow a carve-out to share juvenile records solely for the purpose of enhanced background checks. In addition, the Justice Department is releasing information on whether state laws permit information-sharing with regard to juvenile records for the purposes of enhanced background checks.
Maximizing the Enhanced Background Check with Red Flag Laws: Part of the enhanced background check requires requesting records from state and local law enforcement and mental health repositories about potential purchasers under 21. In these and other circumstances, if a person shows clear signs of being in crisis and a danger to themselves or others, they may qualify for consideration under applicable red flag laws which would generally result in that person being ineligible to possess or receive firearms. By October 22, the Extreme Risk Protection Order (ERPO) National Resource Center will provide training to state and local law enforcement on the ERPO process, including how it intersects with individuals under 21.
Improving the Federal Gun Background Check System: BSCA’s enhanced background checks for gun purchasers under age 21 and the law’s narrowing of the “boyfriend loophole,” along with the expanding number of states with red flag laws, are placing new challenges on state and local agencies attempting to ascertain what records they need to send to the federal gun background check system. To address these challenges, there needs to be system-wide improvements and a new era of collaboration among various entities engaging with the federal gun background check system. By December 15, the Department of Justice’s Office of Justice Programs will have evaluated the existing grant programs that support improvements to the gun background check system and make any changes needed to support states looking to improve their records systems, which may include lengthening the duration of grants where appropriate.
Expanding Data on Gun Violence and Gun Trafficking
Publishing Additional Data on Ghost Gun Trends and Firearms Trafficking: This winter, ATF will publish the fourth volume of its National Firearms Commerce and Trafficking Assessment. This volume will provide an update on ghost gun trends and trafficking investigations, as well as expanded information on machinegun conversion device recoveries.
Expanding Collection of Gun Violence Data: There is a lack of reliable and timely data on gun deaths and gunshot injuries that show what is happening nationwide and in individual communities. This data is critical to focusing investment and enforcement efforts. Today, the FBI is announcing that it will collect additional detail in its data collection for gunshot injury wounds in the National Incident-Based Reporting System (NIBRS) by June 2025. The FBI will implement a new injury code to reflect a gunshot wound in the NIBRS victim segment. NIBRS will also enable law enforcement agencies to submit additional detail as to how firearms were used in specific crimes, and the nature of the crime at issue.
Improving Data on Gunshot Injuries: The Centers for Disease Control and Prevention (CDC) is improving a data visualization tool to present gun death and injury data faster and at a more local level. Using data from vital statistics and emergency rooms at the local level can help inform prevention strategies and evaluate the effectiveness of programs.
Supporting Survivors of Gun Violence
Addressing the Trauma Resulting from Gun Violence: This fall, the federal Substance Abuse and Mental Health Services Administration (SAMHSA) will take additional action to support individuals dealing with the trauma that results from gun violence. SAMHSA will release:
Best practices for local offices of violence prevention to use in addressing trauma resulting from gun violence;A tip sheet for individuals affected by gun violence who may be seeking more information on the behavioral health impacts of gun violence and how to seek help;A report on lessons learned from the federal ReCAST grant program to uplift the voices of communities impacted by violence as well as share strategies other communities can implement to promote healing, recovery, and resiliency; and
A toolkit for faith-based leaders, educators, and other leaders to help communities affected by the trauma resulting from gun violence.
Destroying Crime Guns
Ensuring Appropriate Disposition of Firearms Seized by Law Enforcement: Firearms or firearm parts that were presumed to be destroyed by law enforcement have begun showing up in crimes. Sometimes the guns recovered by law enforcement are sent to a third-party that only partially destroys them. By October 30, the Department of Justice will refresh and clarify best practices for federal law enforcement disposition of seized firearms, including when working in partnership with state and local law enforcement. The Department of Justice will also release a plan to offer new training and education for state and local partners on safe and appropriate firearm disposition.
Preventing Firearm Suicide
Facilitating Voluntary Out-of-Home Storage to Prevent Firearm Suicide: Voluntary out-of-home storage of firearms is an effective tactic to saves lives by creating time and space between a person in crisis and a firearm. A number of states, including Colorado, Louisiana, Maryland, North Carolina, and Wisconsin, have developed gun storage maps to show different locations where a gun owner can voluntarily store their firearms. A federally funded program has developed model guidelines, contracts, and standard operating procedures for businesses interested in providing this option. Today, the Department of Veterans Affairs and SAMHSA are using their network of teams committed to preventing Veteran suicide—known as the Governor’s Challenge to Prevent Suicide Among Service Members, Veterans, and Families—to encourage states to convene federally licensed gun dealers around offering out-of-home storage to our Nation’s heroes and their families.
Congress must act. While the Biden-Harris Administration’s gun violence prevention actions are saving lives, there is much more to do. President Biden and Vice President Harris continue to call on Congress to enact commonsense gun safety legislation—from a ban on assault weapons and bump stocks to universal background checks to a repeal of gun manufacturers’ immunity from liability—and to enact federal safe storage and red flag laws and fully fund community violence intervention programs and the Bureau of Alcohol, Tobacco, Firearms and Explosives (ATF).
Principal Deputy Associate Attorney General Benjamin C. Mizer announced today nearly $30 million in grant funding through the Office of Justice Programs (OJP) that will be awarded to law enforcement agencies, states, community-based organizations, national civil rights organizations, and other stakeholders to fight the rise in hate and bias crimes and incidents. These awards will help communities improve the investigation and prosecution of hate and bias crimes, solve hate crime cold cases, serve victims of these offenses, and support related research.
“These grants are vital in helping to ensure law enforcement and community members get the support they need as they continue to strive to keep all communities safe,” said Principal Deputy Associate Attorney General Benjamin C. Mizer. “Everyone in this country deserves not only to feel safe but to be safe in their communities, and we’re excited about the new grant funding investments made.”
The funding was announced at the inaugural hate crimes grantee conference organized by OJP’s Bureau of Justice Assistance (BJA). The grants are part of the Justice Department’s wide-ranging efforts to improve community safety, serve victims of crime, support America’s youth, advance science, and promote equal justice. OJP is the largest grantmaking component of the Department and houses its criminal and juvenile justice-related science and statistical units.
“Freedom from intolerance and from the fear of violence is foundational to community safety and fundamental to the concept of equal justice,” said OJP Acting Assistant Attorney General Brent J. Cohen. “I’m very pleased that OJP is making these important resources available to our community partners and proud of the work we’re engaged in, together, to end hate and bias crimes and incidents in our country.”
The funding announced today includes:
$12 million in grants under BJA’s Matthew Shepard and James Byrd Jr. Hate Crimes Program to help local law enforcement agencies and prosecutors’ offices investigate and prosecute hate and bias crimes, as well as collaborate with community partners on outreach and education to targeted communities.
More than $7.6 million in awards from BJA to 11 different community-based organizations and civil rights organizations for projects around the country dedicated to developing and implementing comprehensive hate crimes prevention and response strategies.
$1 million for the Orleans Parish, Louisiana, District Attorney’s Office under BJA’s Emmett Till Cold Case Investigation and Prosecution Program to provide resources in cold case homicide cases involving civil rights violations that occurred before 1980.
$2.7 million for RTI International and its subrecipients, the Eradicate Hate Global Summit and the International Association of Chiefs of Police, to launch BJA’s new Coordinated Hate Crimes Resource Center.
$1.125 million for the Washington State Attorney General’s Office through the Office for Victims of Crime’s Jabara-Heyer NO HATE Act State-Run Hate Crime Reporting Hotlines program.
$2.5 million through Jabara-Heyer NO HATE Act funding for the Bureau of Justice Statistics’ research and analysis project on National Incident-Based Reporting System data and hate crime reporting patterns.
$2.5 million in funding from the National Institute of Justice for three research projects on responding to hate crimes with specialized law enforcement units, including LGTBQI+ liaison units to respond to hate crimes against transgender individuals, and addressing the needs of survivors of hate crimes and their communities.
In addition to these new grant awards, Principal Deputy Associate Attorney General Mizer announced OJP’s Office of Juvenile Justice and Delinquency Prevention Youth Hate Crimes and Identity-Based Bullying Prevention Curriculum to provide resources to address hate crimes, bias incidents and identity-based bullying among youth. The curriculum is designed for middle and high school-aged youth and the teachers, counselors and others who work with them. He also announced the Community Oriented Policing Services (the COPS Office) is launching a new training on investigating hate crimes, which builds on the training the COPS Office released in 2022 on recognizing and reporting hate crimes.
Source: Hong Kong Government special administrative region
Overall Wage and Payroll Statistics
According to the figures released today (September 26) by the Census and Statistics Department (C&SD), the average wage rate for all the selected industry sections surveyed, as measured by the wage index, increased by 3.7% in nominal terms in June 2024 over a year earlier.
About 63% of the companies reported increase in average wage rates in June 2024 compared with a year ago. A total of 32% of the companies recorded decrease in average wage rates over the same period. The remaining 5% reported virtually no change in average wage rates.
After discounting the changes in consumer prices as measured by the Consumer Price Index (A), the overall average wage rate for all the selected industry sections surveyed increased by 1.9% in real terms in June 2024 over a year earlier.
As for payroll, the index of payroll per person engaged for all the industry sections surveyed increased by 3.5% in nominal terms in the second quarter of 2024 over a year earlier.
After discounting the changes in consumer prices as measured by the Composite Consumer Price Index, the average payroll per person engaged increased by 2.2% in real terms in the second quarter of 2024 compared with a year earlier.
The wage rate includes basic wages and other regular and guaranteed allowances and bonuses. Payroll includes elements covered by wage rate as well as other irregular payments to workers such as discretionary bonuses and overtime allowances. The payroll statistics therefore tend to show relatively larger quarter-to-quarter changes, affected by the number of hours actually worked and the timing of payment of bonuses and back-pay.
Sectoral Changes
For the nominal wage indices, year-on-year increases were recorded in all selected industry sections in June 2024, ranging from 3.1% to 4.5%.
For the real wage indices, year-on-year increases were also recorded in all selected industry sections in June 2024, ranging from 1.3% to 2.7%.
The year-on-year changes in the nominal and real wage indices for the selected industry sections from June 2023 to June 2024 are shown in Table 1.
As for the nominal indices of payroll per person engaged, year-on-year increases were recorded in all selected industry sections in the second quarter of 2024, ranging from 1.6% to 8.6%.
For the real payroll indices, year-on-year increases were also recorded in all selected industry sections in the second quarter of 2024, ranging from 0.4% to 7.3%.
The year-on-year changes in the nominal and real indices of payroll per person engaged for selected industry sections from the second quarter of 2023 to the second quarter of 2024 are shown in Table 2. The quarterly changes in the seasonally adjusted nominal and real indices of payroll per person engaged in the same period are shown in Table 3.
Commentary
A Government spokesman said that wages and labour earnings continued to record decent increases in the second quarter of 2024 over a year earlier.
The average wage rate for all selected industries rose further by 3.7% in nominal terms in June 2024. After discounting for inflation, the average wage rate increased by 1.9% in real terms.
Payroll per person engaged, which includes basic wage, discretionary bonuses and other irregular payments, increased further by 3.5% in nominal terms in the second quarter of 2024. After discounting for inflation, payroll per person engaged increased by 2.2% in real terms. All selected industries saw increases in payroll per person engaged in both nominal and real terms.
Looking ahead, the tight overall labour market should provide support to growth in wages and labour earnings in the near term, though the pace of growth may vary across sectors in tandem with their business performance.
Other Information
Both wage indices and payroll indices are compiled quarterly based on the results of the Labour Earnings Survey (LES) conducted by C&SD. Wage index only covers employees up to the supervisory level (i.e. not including managerial and professional employees), whereas payroll index covers employees at all levels and proprietors actively engaged in the work of the establishment.
Apart from the differences in employee coverage, wage statistics are conceptually different from the payroll statistics. Firstly, wage rate for an employee refers to the sum earned for his normal hours of work. It covers basic wages and other regular and guaranteed allowances and bonuses, but excludes earnings from overtime work and discretionary bonuses, which are however included in payroll per person engaged. Secondly, the payroll index of an industry is an indicator of the simple average payroll received per person engaged in the industry. Its movement is therefore affected by changes in wage rates, number of hours of work and occupational composition in the industry. In contrast, the wage index of an industry is devised to reflect the pure changes in wage rate, with the occupational composition between two successive statistical periods being kept unchanged. In other words, the wage index reflects the change in the price of labour. Because of these conceptual and enumeration differences between payroll and wage statistics, the movements in payroll indices and in wage indices do not necessarily match closely with each other.
It should also be noted that different consumer price indices are used for compiling the real indices of wage and payroll to take into account the differences in their respective occupation coverage. Specifically, the Composite Consumer Price Index, being an indicator of overall consumer prices, is taken as the price deflator for payroll of workers at all levels of the occupational hierarchy. The Consumer Price Index (A), being an indicator of consumer prices for the relatively low expenditure group, is taken as the price deflator for wages in respect of employees engaged in occupations up to the supervisory level.
Detailed breakdowns of the payroll and wage statistics are published in the “Quarterly Report of Wage and Payroll Statistics, June 2024”. Users can browse and download the publication at the website of C&SD (www.censtatd.gov.hk/en/EIndexbySubject.html?pcode=B1050009&scode=210).
For enquiries on wage and payroll statistics, please contact the Wages and Labour Costs Statistics Section (1) of C&SD (Tel: 2887 5550 or email: wage@censtatd.gov.hk).
Source: Hong Kong Government special administrative region
External Merchandise Trade Statistics for August 2024 External Merchandise Trade Statistics for August 2024 *****************************************************
The Census and Statistics Department (C&SD) released today (September 26) the external merchandise trade statistics for August 2024. In August 2024, the values of Hong Kong’s total exports and imports of goods both recorded year-on-year increases, at 6.4% and 7.9% respectively. In August 2024, the value of total exports of goods increased by 6.4% over a year earlier to $381.3 billion, after a year-on-year increase by 13.1% in July 2024. Concurrently, the value of imports of goods increased by 7.9% over a year earlier to $414.4 billion in August 2024, after a year-on-year increase by 9.9% in July 2024. A visible trade deficit of $33.1 billion, equivalent to 8.0% of the value of imports of goods, was recorded in August 2024. For the first eight months of 2024 as a whole, the value of total exports of goods increased by 11.5% over the same period in 2023. Concurrently, the value of imports of goods increased by 8.0%. A visible trade deficit of $216.0 billion, equivalent to 6.8% of the value of imports of goods, was recorded in the first eight months of 2024. Comparing the three-month period ending August 2024 with the preceding three months on a seasonally adjusted basis, the value of total exports of goods increased by 0.3%. Meanwhile, the value of imports of goods increased by 3.8%. Analysis by country/territory Comparing August 2024 with August 2023, total exports to Asia as a whole grew by 9.9%. In this region, increases were registered in the values of total exports to some major destinations, in particular Vietnam (+27.0%), Malaysia (+23.7%), Thailand (+15.3%), the Philippines (+14.5%) and the mainland of China (the Mainland) (+12.9%). On the other hand, decreases were recorded in the values of total exports to India (-20.5%) and Singapore (-14.5%). Apart from destinations in Asia, decreases were registered in the values of total exports to some major destinations in other regions, in particular Switzerland (-62.0%) and the United Kingdom (-46.2%). Over the same period of comparison, increases were registered in the values of imports from some major suppliers, in particular Singapore (+26.8%), Vietnam (+26.2%), Korea (+19.6%), Malaysia (+17.4%) and the Mainland (+9.7%). On the other hand, decreases were recorded in the values of imports from the Philippines (-10.0%) and the USA (-5.1%). For the first eight months of 2024 as a whole, year-on-year increases were registered in the values of total exports to some major destinations, in particular Thailand (+28.3%), Vietnam (+23.8%), the Mainland (+18.9%), the USA (+15.2%) and the United Arab Emirates (+4.8%). On the other hand, a decrease was recorded in the value of total exports to India (-10.3%). Over the same period of comparison, year-on-year increases were registered in the values of imports from some major suppliers, in particular Vietnam (+48.0%), Korea (+46.0%), Singapore (+20.7%), the Mainland (+9.6%) and Malaysia (+4.8%). On the other hand, a decrease was recorded in the value of imports from the Philippines (-13.8%). Analysis by major commodity Comparing August 2024 with August 2023, increases were registered in the values of total exports of some principal commodity divisions, in particular “office machines and automatic data processing machines” (by $14.4 billion or +43.5%) and “electrical machinery, apparatus and appliances, and electrical parts thereof” (by $13.0 billion or +7.5%). Over the same period of comparison, increases were registered in the values of imports of some principal commodity divisions, in particular “office machines and automatic data processing machines” (by $19.7 billion or +79.6%) and “electrical machinery, apparatus and appliances, and electrical parts thereof” (by $17.0 billion or +10.0%). For the first eight months of 2024 as a whole, year-on-year increases were registered in the values of total exports of some principal commodity divisions, in particular “electrical machinery, apparatus and appliances, and electrical parts thereof” (by $149.1 billion or +11.9%) and “office machines and automatic data processing machines” (by $82.3 billion or +32.6%). Over the same period of comparison, year-on-year increases were registered in the values of imports of most principal commodity divisions, in particular “electrical machinery, apparatus and appliances, and electrical parts thereof” (by $122.7 billion or +9.6%) and “office machines and automatic data processing machines” (by $70.5 billion or +35.1%). Commentary A Government spokesman said that the value of merchandise exports grew solidly in August 2024 over a year earlier. Exports to the Mainland, the United States and the European Union registered increases of varying degree, while those to other major Asian markets saw mixed performance. Looking ahead, while geopolitical tensions and trade conflicts will present risks, Hong Kong’s exports performance should remain positive if external demand continues to hold up. The Government will monitor the situation closely. Further information Table 1 presents the analysis of external merchandise trade statistics for August 2024. Table 2 presents the original monthly trade statistics from January 2021 to August 2024, and Table 3 gives the seasonally adjusted series for the same period. The values of total exports of goods to 10 main destinations for August 2024 are shown in Table 4, whereas the values of imports of goods from 10 main suppliers are given in Table 5. Tables 6 and 7 show the values of total exports and imports of 10 principal commodity divisions for August 2024. All the merchandise trade statistics described here are measured at current prices and no account has been taken of changes in prices between the periods of comparison. A separate analysis of the volume and price movements of external merchandise trade for August 2024 will be released in mid-October 2024. The August 2024 issue of “Hong Kong External Merchandise Trade” contains detailed analysis on the performance of Hong Kong’s external merchandise trade in August 2024 and will be available in early October 2024. Users can browse and download the report at the website of the C&SD (www.censtatd.gov.hk/en/EIndexbySubject.html?pcode=B1020005&scode=230). Enquiries on merchandise trade statistics may be directed to the Trade Analysis Section of the C&SD (Tel: 2582 4691).
Ends/Thursday, September 26, 2024Issued at HKT 16:30
Headline: Threat landscape for industrial automation systems, Q2 2024
Statistics across all threats
In the second quarter of 2024, the percentage of ICS computers on which malicious objects were blocked decreased by 0.9 pp from the previous quarter to 23.5%.
The percentage has decreased by 3.3 pp compared to the second quarter of 2023, when the indicator reached its highest level since records began in 2022.
Percentage of ICS computers on which malicious objects were blocked, by quarter, 2022-2024
Regions ranking
In most regions, the percentage of ICS computers that blocked malicious objects decreased compared to the first quarter of 2024. The indicator increased only in East Asia (by 1.0 pp), Western Europe (by 0.8 pp), Australia and New Zealand (by 0.7 pp) and the USA and Canada (by 0.2 pp).
Regions ranked by percentage of ICS computers where malicious objects were blocked, Q2 2024
Industries ranking
The building automation sector continues to lead the surveyed industries in terms of the percentage of ICS computers on which malicious objects were blocked. In general, this indicator continues to decrease across all industries for the second quarter in a row.
Percentage of ICS computers on which the activity of malicious objects of various categories was prevented
Diversity of detected malware
In the second quarter of 2024, Kaspersky’s protection solutions blocked malware from 11,349 different malware families of various categories on industrial automation systems.
Percentage of ICS computers on which the activity of malicious objects of various categories was prevented
Compared to the previous quarter, the most noticeable proportional increase in the second quarter of 2024 was in the percentage of ICS computers on which ransomware was blocked – a 1.2-fold increase.
Malicious object categories in numbers
Malicious objects used for initial infection
This category includes dangerous web resources, malicious scripts and malicious documents.
Denylisted internet resources – 6.63% (-0.21 pp compared to the first quarter of 2024);
Malicious scripts and phishing pages (JS and HTML) – 5.69% (-0.15 pp);
Malicious objects used to initially infect computers deliver next-stage malware – spyware, ransomware, and miners – to victims’ computers. As a rule, the higher the percentage of ICS computers on which the initial infection malware is blocked, the higher the percentage for next-stage malware.
Spyware (spy Trojans, backdoors and keyloggers) – 4.08% (+0.18 pp);
Ransomware – 0.18% (+0.03 pp);
Miners (in the form of executable files for Windows) – 0.89% (-0.03 pp).
Self-propagating malware
These are worms and viruses. Worms and virus-infected files were originally used for initial infection, but as botnet functionality evolved, they took on next-stage characteristics.
To spread across ICS networks, viruses and worms rely on removable media, network folders, infected files including backups, and network attacks on outdated software.
Worms – 1.48% (-0.03 pp);
Viruses – 1.54% (-0.02 pp).
AutoCAD malware
This category of malware is typically a low-level threat, coming last in the malware category rankings in terms of the percentage of ICS computers on which it was blocked.
AutoCAD malware – 0.42% (+0.01 pp).
Main threat sources
The internet, email clients and removable storage devices remain the primary sources of threats to computers in an organization’s technology infrastructure. (Note that the sources of blocked threats cannot be reliably identified in all cases.)
Percentage of ICS computers on which malicious objects from various sources were blocked
Source: The Conversation – Africa – By Danny Bradlow, Professor/Senior Research Fellow, Centre for Advancement of Scholarship, University of Pretoria
The statistics are stark: 54 governments, of which 25 are African, are spending at least 10% of their revenues on servicing their debts; 48 countries, home to 3.3 billion people, are spending more on debt service than on health or education.
Among them, 23 African countries are spending more on debt service than on health or education.
While the international community stands by, these countries are servicing their debts and defaulting on their development goals.
It requires the debtor to first discuss its problems with the International Monetary Fund (IMF) and obtain its assessment of how much debt relief it needs. Then it must negotiate with its official creditors – international organisations, governments and government agencies – over how much debt relief they will provide. Only then can the debtor reach an agreement – on comparable terms to the official creditors – with its commercial creditors.
Unfortunately, this process has been sub-optimal.
One reason is that it works too slowly to meet the urgent needs of distressed borrowers. As a result, it condemns debtor countries to financial limbo. The resulting uncertainty is not in anyone’s interest. For example, Zambia has been working through the G20’s cumbersome process for more than three and a half years and has not yet finalised agreements with all its creditors.
We propose a two-part approach that would improve the situation of sovereign debtors and their creditors. This proposal is based on the lessons we have learned from our work on the legal and economic aspects of developing country debt, particularly African debt.
First, we suggest that official creditors and the IMF create a strategic buyer of “last resort” that can purchase the bonds of debt distressed countries and refinance them on better terms.
Second, we recommend that all parties involved in sovereign debt restructurings adopt a set of principles that they can use to guide the debtor and its creditors in reaching an optimal agreement and monitoring its implementation.
The current approach fails to deal effectively and fairly with both the concerns of the creditors and all the debtor’s legal obligations and responsibilities. Our proposed solution would offer debtors debt relief that does not undermine their ability to meet their other legal obligations and responsibilities, while also accommodating private creditors’ preference for cash payments.
Our proposal is not risk-free. And buybacks are not appropriate for all debtors. Nevertheless it offers a principled and feasible approach to dealing with a silent debt crisis that threatens to undermine international efforts to address global challenges such as climate, poverty and inequality.
It uses the IMF’s existing resources to meet both the bondholders’ preferences for immediate cash and the developing countries’ need to reduce their debt burdens in a transparent and principled way.
It also helps the international community avoid a widespread default on debt and development.
Bondholders are a major problem
Foreign bondholders, who are the major creditors of many developing countries, have proven to be particularly challenging in providing substantive debt relief in a timely manner. In theory, they should be more flexible than official creditors.
Developing countries have been paying bondholders a premium to compensate them for providing financing to borrowers that are perceived to be risky. As a result, bondholders have already received larger payouts than official creditors. Therefore, they should be better placed than official creditors to assist the debtor in the restructuring processes.
However, despite having received large returns from defaulted bonds, bondholders have remained obstinate in debt restructurings.
Our proposal seeks to overcome this hurdle in a way that is fair to debtors, creditors and their respective stakeholders.
How it would work
First, the official creditors and the IMF should create and fund a strategic buyer “of last resort” who can purchase distressed (and expensive) debt at a discount from bondholders. The buyer, now the creditor of the country in distress, can repackage the debt and sell it to the debtor country on more manageable terms. The net result is that the bondholders receive cash for their bonds, while the debtor country benefits from substantial debt relief. In addition, the debtor and its remaining official creditors benefit from a simplified debt restructuring process.
This concept has precedent. In 1989, as part of the Highly Indebted Poor Countries Initiative, the international community’s effort to deal with the then existing debt burdens of poor countries, the World Bank Group established the Debt Reduction Facility, which helped eligible governments repurchase their external commercial debts at deep discounts. It completed 25 transactions which helped erase approximately US$10.3 billion in debt principal and over US$3.5 billion in interest arrears.
Some individual countries have also bought back their own debt. In 2009, Ecuador repurchased 93% of its defaulted debt at a deep discount. This enabled the government to reduce its debt stock by 27% and promote economic growth in subsequent years.
Unfortunately, the countries currently in debt distress lack sufficient foreign reserves to pursue such a strategy. Hence, they need to find a “friendly” buyer of last resort.
The IMF is well positioned to play this role. It has the mandate to support countries during financial crises. It also has the resources to fund such a facility. It can use a mix of its own resources, including its gold reserves, and donor funding, such as a portion of the US$100 billion in Special Drawing Rights (SDR), the IMF’s own reserve currency, which rich economies committed to reallocate for development purposes.
Such a facility, for example, would have enabled Kenya to refinance its debts at the SDR interest rate, currently at 3.75% per year, rather than at the 10.375% rate it paid in the financial markets.
It is noteworthy that the 47 low-income countries identified as in need of debt relief have just US$60 billion in outstanding debts owed to bondholders. Our proposed buyer of last resort would help reduce the burden of these countries to manageable levels.
Second, we propose that both debtors and creditors should commit to the following set of shared principles, based on internationally accepted norms and standards for debt restructurings.
Guiding principles
1. Guiding norms: Sovereign debt restructurings should be guided by six norms: credibility, responsibility, good faith, optimality, inclusiveness and effectiveness.
Optimality means that the negotiating parties should aim to achieve an outcome that, considering the circumstances in which the parties are negotiating and their respective rights, obligations and responsibilities, offers each of them the best possible mix of economic, financial, environmental, social, human rights and governance benefits.
2. Transparency: All parties should have access to the information that they need to make informed decisions.
3. Due diligence: The sovereign debtor and its creditors should each undertake appropriate due diligence before concluding a sovereign debt restructuring process.
4. Optimal outcome assessment: The parties should publicly disclose why they expect their restructuring agreement to result in an optimal outcome.
5. Monitoring: There should be credible mechanisms for monitoring the implementation of the restructuring agreement.
6. Inter-creditor comparability: All creditors should make a comparable contribution to the restructuring of debt.
7. Fair burden sharing: The burden of the restructuring should be fairly allocated between the negotiating parties.
8. Maintaining market access: The process should be designed to facilitate future market access for the borrower at affordable rates.
The G20’s current efforts to address the silent debt crisis are failing. They are contributing to the likely failure of low income countries in Africa and the rest of the global south to offer all their residents the possibility of leading lives of dignity and opportunity.
Danny Bradlow, in addition to his university position, is Co-Chair of the T20 task force on sovereign debt, and Co-Chair of the Academic Circle on the Right to Development.
Marina Zucker-Marques is a co-chair for the Brazil T20 Task Force 3 on reforming the International Financial Architecture
Kevin P. Gallagher does not work for, consult, own shares in or receive funding from any company or organisation that would benefit from this article, and has disclosed no relevant affiliations beyond their academic appointment.
Source: The Conversation – Africa – By Danny Bradlow, Professor/Senior Research Fellow, Centre for Advancement of Scholarship, University of Pretoria
The statistics are stark: 54 governments, of which 25 are African, are spending at least 10% of their revenues on servicing their debts; 48 countries, home to 3.3 billion people, are spending more on debt service than on health or education.
Among them, 23 African countries are spending more on debt service than on health or education.
While the international community stands by, these countries are servicing their debts and defaulting on their development goals.
It requires the debtor to first discuss its problems with the International Monetary Fund (IMF) and obtain its assessment of how much debt relief it needs. Then it must negotiate with its official creditors – international organisations, governments and government agencies – over how much debt relief they will provide. Only then can the debtor reach an agreement – on comparable terms to the official creditors – with its commercial creditors.
Unfortunately, this process has been sub-optimal.
One reason is that it works too slowly to meet the urgent needs of distressed borrowers. As a result, it condemns debtor countries to financial limbo. The resulting uncertainty is not in anyone’s interest. For example, Zambia has been working through the G20’s cumbersome process for more than three and a half years and has not yet finalised agreements with all its creditors.
We propose a two-part approach that would improve the situation of sovereign debtors and their creditors. This proposal is based on the lessons we have learned from our work on the legal and economic aspects of developing country debt, particularly African debt.
First, we suggest that official creditors and the IMF create a strategic buyer of “last resort” that can purchase the bonds of debt distressed countries and refinance them on better terms.
Second, we recommend that all parties involved in sovereign debt restructurings adopt a set of principles that they can use to guide the debtor and its creditors in reaching an optimal agreement and monitoring its implementation.
The current approach fails to deal effectively and fairly with both the concerns of the creditors and all the debtor’s legal obligations and responsibilities. Our proposed solution would offer debtors debt relief that does not undermine their ability to meet their other legal obligations and responsibilities, while also accommodating private creditors’ preference for cash payments.
Our proposal is not risk-free. And buybacks are not appropriate for all debtors. Nevertheless it offers a principled and feasible approach to dealing with a silent debt crisis that threatens to undermine international efforts to address global challenges such as climate, poverty and inequality.
It uses the IMF’s existing resources to meet both the bondholders’ preferences for immediate cash and the developing countries’ need to reduce their debt burdens in a transparent and principled way.
It also helps the international community avoid a widespread default on debt and development.
Bondholders are a major problem
Foreign bondholders, who are the major creditors of many developing countries, have proven to be particularly challenging in providing substantive debt relief in a timely manner. In theory, they should be more flexible than official creditors.
Developing countries have been paying bondholders a premium to compensate them for providing financing to borrowers that are perceived to be risky. As a result, bondholders have already received larger payouts than official creditors. Therefore, they should be better placed than official creditors to assist the debtor in the restructuring processes.
However, despite having received large returns from defaulted bonds, bondholders have remained obstinate in debt restructurings.
Our proposal seeks to overcome this hurdle in a way that is fair to debtors, creditors and their respective stakeholders.
How it would work
First, the official creditors and the IMF should create and fund a strategic buyer “of last resort” who can purchase distressed (and expensive) debt at a discount from bondholders. The buyer, now the creditor of the country in distress, can repackage the debt and sell it to the debtor country on more manageable terms. The net result is that the bondholders receive cash for their bonds, while the debtor country benefits from substantial debt relief. In addition, the debtor and its remaining official creditors benefit from a simplified debt restructuring process.
This concept has precedent. In 1989, as part of the Highly Indebted Poor Countries Initiative, the international community’s effort to deal with the then existing debt burdens of poor countries, the World Bank Group established the Debt Reduction Facility, which helped eligible governments repurchase their external commercial debts at deep discounts. It completed 25 transactions which helped erase approximately US$10.3 billion in debt principal and over US$3.5 billion in interest arrears.
Some individual countries have also bought back their own debt. In 2009, Ecuador repurchased 93% of its defaulted debt at a deep discount. This enabled the government to reduce its debt stock by 27% and promote economic growth in subsequent years.
Unfortunately, the countries currently in debt distress lack sufficient foreign reserves to pursue such a strategy. Hence, they need to find a “friendly” buyer of last resort.
The IMF is well positioned to play this role. It has the mandate to support countries during financial crises. It also has the resources to fund such a facility. It can use a mix of its own resources, including its gold reserves, and donor funding, such as a portion of the US$100 billion in Special Drawing Rights (SDR), the IMF’s own reserve currency, which rich economies committed to reallocate for development purposes.
Such a facility, for example, would have enabled Kenya to refinance its debts at the SDR interest rate, currently at 3.75% per year, rather than at the 10.375% rate it paid in the financial markets.
It is noteworthy that the 47 low-income countries identified as in need of debt relief have just US$60 billion in outstanding debts owed to bondholders. Our proposed buyer of last resort would help reduce the burden of these countries to manageable levels.
Second, we propose that both debtors and creditors should commit to the following set of shared principles, based on internationally accepted norms and standards for debt restructurings.
Guiding principles
1. Guiding norms: Sovereign debt restructurings should be guided by six norms: credibility, responsibility, good faith, optimality, inclusiveness and effectiveness.
Optimality means that the negotiating parties should aim to achieve an outcome that, considering the circumstances in which the parties are negotiating and their respective rights, obligations and responsibilities, offers each of them the best possible mix of economic, financial, environmental, social, human rights and governance benefits.
2. Transparency: All parties should have access to the information that they need to make informed decisions.
3. Due diligence: The sovereign debtor and its creditors should each undertake appropriate due diligence before concluding a sovereign debt restructuring process.
4. Optimal outcome assessment: The parties should publicly disclose why they expect their restructuring agreement to result in an optimal outcome.
5. Monitoring: There should be credible mechanisms for monitoring the implementation of the restructuring agreement.
6. Inter-creditor comparability: All creditors should make a comparable contribution to the restructuring of debt.
7. Fair burden sharing: The burden of the restructuring should be fairly allocated between the negotiating parties.
8. Maintaining market access: The process should be designed to facilitate future market access for the borrower at affordable rates.
The G20’s current efforts to address the silent debt crisis are failing. They are contributing to the likely failure of low income countries in Africa and the rest of the global south to offer all their residents the possibility of leading lives of dignity and opportunity.
In June, the majority of Danish banks announced interest rate changes on select deposit accounts. This happened in continuation of Danmarks Nationalbank’s interest rate cut on the 7th of June. The effect can now be seen in the interest rate on private customers’ record-breaking deposits. In August they experienced the largest interest rate drop in a single month since January 2021, when the deposit rate became negative for the first time. The interest rate thus fell by 0.10 percentage points to an average annual interest rate of 1.49 percent in August. This is still marginally higher than the level at the turn of the year. If you compare it with the banks’ lending rates to private individuals, they have fallen on average by 0.34 percentage points since the turn of the year to currently 5.59 percent. After Danmarks Nationalbank cut interest rates again with effect from the 13th of September, several banks have announced further interest rate reductions on private customers’ deposit accounts. These will take effect in the coming months.
Biggest monthly interest rate drop on deposits since January 2021
Note:
The figure shows the average interest rate p.a. on Danish private customers’ (employees, pensioners, etc.) interest-bearing deposits in Danish kroner in banks. In the figure, the observations for February 2020 and 2024 are corrected for the effect of leap years, which data for the interest statistics published in the Statbank do not take into account. Find chart data in the Statbank here.
This chart essentially shows the stresses that New Zealand’s public health system can expect to face. I have analysed the death data by age, covering all deaths from July 1998 to June 2024. For those years (using June years) I have looked at every age of death from 16 to 99 and every birth year from 1900 to 2022, and counted deaths by birth-year.
For death-age 95, the most frequent birth year was 1928. As we would expect, most deaths at these high ages occurred in 2022 or 2023, thanks to Covid19. Thus, birth years in the 1920s feature in the chart.
Birth years in the early 1930s don’t feature so much because of the low birth numbers in those years. With fewer people born in say 1933, then 1933 will not often feature as the most frequent birth year for any given age.
Birth years around 1950 do not feature. This is both because the classic baby boomer generation is a healthy generation, and also because there were not as many births in the decade after World War Two as there were in the following two decades. So, while classic baby boomers will place an increasing burden on the public health system, the biggest burdens will come from those born between 1955 and 1975. (Also, classic baby boomers have high levels of private health insurance; this will be less affordable for subsequent generations as they age.)
Birth years from 1955 to 1964 feature most strongly, mainly because births in New Zealand peaked in those years. This birth cohort will place massive pressure on New Zealand’s public health system. People dying since 1998 between age 37 and age 67 are most likely to have been born in the years either side of 1960.
The cohort born 1966 to 1974 will also place huge pressures on Te Whatu Ora (Health New Zealand), in part because there are likely to be very many new Aotearoans in this birth cohort. By and large, immigrants are healthier than the New Zealand born population, because their health is considered before New Zealand residency can be granted.
The late 1970s represents a ‘baby-bust’ generation, like the early 1930s. Hence these ‘Gen-Y’ people don’t feature in this chart. The frequencies for the late 1980s’ and early 1990s’ birth years reflect the ‘baby blip’ which began in 1987. Also, these birth years relate to death of young people, which, being less frequent, can also be a bit more random.
People born in 1939 turn 85 this year. From 1938, birth numbers generally increased each year until the early 1960s. The impact of an aging population on New Zealand’s public healthcare system is certainly beginning. This impact will escalate each year for at least the next 25 years. People born in 1961 will turn 85 in 2046.
By contrast, we have been lulled into complacency because the unusually small early-1930s’ birth cohort placed a substantially below-average pressure on public healthcare.
We note that death numbers are a proxy for the demand for high-intensity healthcare. People born after 1955 are already making considerable demands on Aotearoa New Zealand’s health care.
*******
Keith Rankin (keith at rankin dot nz), trained as an economic historian, is a retired lecturer in Economics and Statistics. He lives in Auckland, New Zealand.
Source: The Conversation (Au and NZ) – By Anthony Scott, Professor of Health Economics and Director, Centre for Health Economics, Monash Business School, Monash University
A battle between private hospitals and private health insurers is playing out in public.
At its heart is how much health insurers pay hospitals for their services, and whether that’s enough for private hospitals to remain viable.
Concerns over the viability of the private health system have caught the attention of the federal government, which has launched a review into private hospitals that has yet to be made public.
But are private hospitals really in trouble? And if so, is more public funding the answer?
Private hospitals vs private health insurers
Many private hospital operators have reported significant pressures since the start of the COVID pandemic, including staff shortages.
Inflationary pressures have increased the costs of supplies and equipment, pushing up the costs of providing hospital care.
Now, private hospitals have publicised their difficult contract negotiations with private health insurers in an attempt to gain support and help their case.
Healthscope, which runs 38 for-profit private hospitals in Australia, has been threatening to end agreements with private health insurers.
St Vincent’s, which operates ten not-for-profit private hospitals, announced it would end its contract with nib (one of Australia’s largest for-profit health insurers) but then reached an agreement.
UnitingCare Queensland, which operates four private hospitals, announced it would end its contract with the Australian Health Service Alliance, which represents more than 20 small and medium non-profit private health insurers. Since then, the two parties have also kissed and made up.
Why should we care?
There are three reasons why viability of the private health sector affects us all, regardless of whether we have private health insurance or use private hospitals.
1. Taxpayers subsidise the private health system
Australian taxpayers subsidised private health insurance premiums by A$6.3 billion
(in premium rebates) in 2021–22. Much of this makes its way to private hospitals. Medicare also subsidised fees for medical services delivered for private patients in private and public hospitals to the tune of $3.81 billion in 2023–24.
But when the going gets tough, the private health sector (both hospitals and health insurers) turns to the government for more handouts.
So we should be concerned about the value we currently get from our public investment into the private health system, and if more public investment is warranted.
2. Public hospitals may be affected if private hospitals close
Calls for greater government support for private health have long argued that a larger private hospital sector would help reduce pressures on the public system.
Indeed, this was the justification for a series of incentives introduced from the late 1990s to support private health insurance in Australia.
However, the extent of this is hotly debated. Recent evidence shows higher private health insurance coverage leads to only very small falls in waiting times in public hospitals.
While it is possible the closure of a few private hospitals might lead some patients to seek care in public hospitals, this shift might not be that large and will not increase waiting times too much.
3. Fewer private beds, but is that a bad thing?
If unviable private hospitals close or merge, we’d expect to see fewer
private hospital beds overall.
Fewer private hospital beds is not necessarily bad news. Mergers of small private day hospitals, in particular, might make them more efficient and lead to lower costs, which in turn lowers health insurance premiums.
We might also need fewer private beds. This is due to policies that try to shift health care out of hospitals into the community or the use of hospital-in-the-home schemes (where patients receive hospital-type care at home with the support of visiting health staff and/or telehealth). The private health insurers are supporting both.
If a few small private hospitals close, this reflects the market adjusting to less demand for hospital care. Some of the closures have been for maternity wards but with falling birth rates, this also seems like an appropriate market adjustment.
Any objective data about what is happening in the private hospital sector is scarce. This is mainly because the Australian Bureau of Statistics has stopped a compulsory survey of all private hospitals. The latest data we have is from 2016–17.
Health insurers are the largest payer of private hospitals and hence wield a considerable amount of negotiating power. In 2016–17, almost 80% of private hospitals’ income came from private health insurers. Health insurers have also increasingly become “active” purchasers of health care – not just passively paying insurance claims, but wanting to strike a good deal with private hospitals for their members to keep premiums (and costs) down, and profits high.
Reports of hospitals closing ignore hospitals that are opening at the same time. But since 2016–17 there are no publicly reported data on the total number of private hospitals in Australia or changes over time.
The latest figures we have show about half of all hospitals in Australia are private, and of these 62% are for-profit with the rest run by not-for-profit organisations (such as St Vincent’s).
The main for-profit providers are Ramsay Health Care and Healthscope. Both have operations overseas and were in trouble before the COVID pandemic.
Fast-forward to 2024 and the recent issues with contract negotiations suggests the financial situation of for-profit private hospitals might not have improved. So this could reflect a long-term issue with the sustainability of the private hospital sector.
What are the options?
The private health system already receives large public subsidies. So the crux of the current debate is whether the government should intervene again to prop up the private sector. Here are some options:
do nothing and let this stoush play out Closure and mergers of private hospitals might be good if smaller hospitals and wards are no longer needed and patients have other alternatives
introduce more regulation Negotiations between small groups of private hospitals and very large dominant private health insurers may not be efficient. If the insurers have significant market power they can force small groups of private hospitals into submission. Some private hospital groups may be negotiating with many different health insurers at the same time, which can be costly. Regulation of exactly how these negotiations happen could make the process more efficient and create a more level playing field
change how private hospitals are paid Public hospitals are essentially paid the same national price for each procedure they provide. This provides incentives for efficiency as the price is fixed and so if their costs are below the price, they can make a surplus. Private hospitals could also be funded this way, which could remove much of the costs of contract negotiations with private hospitals. Instead, private hospitals would be free to focus on other issues such as the number and quality of procedures, and providing high-value health care.
How do we help private hospitals become more efficient? Regulating prices and contract negotiations are a start. Kitreel/Shutterstock
What next?
Revisiting the regulation of prices and contract negotiations between private hospitals and private health insurers could potentially help the private hospital sector to be more efficient.
Private health insurers are rightly trying to encourage such efficiencies but the tools they have to do this through contract negotiations are quite blunt.
As we wait for the results of the review into the private hospital sector, value for money for taxpayers is paramount. We are all subsidising the private hospital sector.
Anthony Scott has previously received funding from the Medibank Better Health Foundation.
Terence C. Cheng does not work for, consult, own shares in or receive funding from any company or organisation that would benefit from this article, and has disclosed no relevant affiliations beyond their academic appointment
Surviving lung cancer in Aotearoa New Zealand could depend on whether you can access a GP – raising questions about equity in the country’s health system.
Our new research examines the outcomes for patients who are diagnosed with lung cancer through their GP versus those who are diagnosed at the emergency department (ED).
Examining 2,400 lung cancer diagnoses in Waikato between 2011 and 2021, we found those who are diagnosed with lung cancer after ED visits tended to have later-stage disease and poorer outcomes compared to those diagnosed after a GP referral.
We also found diagnosis after ED attendance was 27% higher for Māori than non-Māori and 22% higher for men than women.
These results raise important questions about health inequity in New Zealand and highlight the need to ensure everyone is able to access an early cancer diagnosis.
For those who are enrolled in a practice, the wait times for appointments are often such that the only option is to go to the ED for help.
This is especially true in rural areas where the hospital can become the default route to diagnosis.
Lung cancer is New Zealand’s single biggest cause of cancer deaths, with over 1,800 per year. Some 80% of those who are diagnosed with lung cancer present with advanced disease and very poor prospects of survival.
It’s also the cancer with the largest equity gap. The mortality rate for Māori with lung cancer is three to four times that of people of European descent.
While much of this disparity is due to differences in the rates of smoking among ethnic groups, there is also evidence delays in diagnosis and poorer access to surgery are also major influences on survival rates.
Identifying lung cancer
Lung cancer usually starts in the tissue lining the airways and symptoms can initially be relatively minor – some shortness of breath during exercise, a niggly cough or sharp pains while breathing.
Patients with these sorts of symptoms usually go to a GP to check whether this is something that needs further investigation.
But if someone cannot get an appointment, or does not recognise the symptoms as serious, then they are likely to delay taking action.
Advanced symptoms of lung cancer include coughing up blood or having lumps in the neck due to lymphatic spread of the cancer. People with these alarming symptoms tend to go to the hospital for treatment.
Our study confirms earlier findings that those diagnosed through the emergency department are:
more likely to have advanced disease
more likely to have a more aggressive type of cancer (called small cell cancer), and
have substantially poorer likelihoods of survival.
The median survival for those who never went to the ED was 13.6 months, while the median survival for those with one ED visit was just three months.
That said, attending an emergency department has some advantages. These include being seen by a doctor within a few hours, immediate access to x-rays and, in our major hospitals, access to the definitive diagnostic tool for a lung cancer – a computed tomography (CT) machine.
Our study found 25% of cases went to the ED two or more times in the two weeks before their diagnosis. This was especially true for those going to one of the Waikato rural hospitals, where a second or third visit was more likely before being diagnosed.
Barriers to care
It is clear New Zealand still has several barriers to primary care. This has lead to an over-reliance on emergency departments for diagnosing cancer, despite the long-running faster cancer treatment targets.
The situation is unlikely to improve. Access to GPs is getting worse, in part due to increasing fees.
Māori and Pacific patients with lung cancer were less likely than other ethnic groups to have been enrolled with a primary health organisation when they were diagnosed. They were also less likely to have visited a GP in the three months prior to diagnosis.
Making it easier to see a GP
Making general practice care more accessible is the most effective way of addressing the inequities in our lung cancer statistics.
Currently, New Zealand has only 74 GPs per 100,000 people, compared to 110 in Australia.
It is clear we need to substantially increase the number of GPs. This is a long-term project but needs to be a strategic goal for the health sector.
In the meantime, we need to make primary care more accessible by increasing patient subsidies and reducing the direct patient costs to see a doctor. At the same time, we need to better equip GPs with access to diagnostic facilities, including in our rural hospitals.
Ross Lawrenson receives funding from NZ Health Research Council. He is an Honorary Fellow of the Royal New Zealand College of General Practitioners.
Chunhuan Lao receives funding from NZ Health Research Council.
Census release of iwi data a significant resource for Te Whata –26 September 2024 –From today, individuals and dwellings data by Māori descent and iwi affiliation will be available on Te Whata.
Te Whata is a by iwi, for iwi data platform developed by Te Kāhui Raraunga and supported by Stats NZ. It is available athttp://www.tewhata.io.
Customised census iwi data requests are also available throughTe Ara Takatū.
This is the second time Stats NZ has partnered with Te Kāhui Raraunga to release Māori data from the 2023 Census on the Te Whata platform. The historic joint initiative is part of work under theMana Ōrite Relationship Agreement between the Data Iwi Leaders Group and Stats NZ.
Census release of iwi data a significant resource for Te Whata – 26 September 2024 – From today, individuals and dwellings data by Māori descent and iwi affiliation will be available on Te Whata.
Te Whata is a by iwi, for iwi data platform developed by Te Kāhui Raraunga and supported by Stats NZ. It is available at http://www.tewhata.io.
Customised census iwi data requests are also available through Te Ara Takatū.
This is the second time Stats NZ has partnered with Te Kāhui Raraunga to release Māori data from the 2023 Census on the Te Whata platform. The historic joint initiative is part of work under the Mana Ōrite Relationship Agreement between the Data Iwi Leaders Group and Stats NZ.
Visit Statistics NZ’s website to read this news story:
Air pollutant trends decrease at most monitoring sites over the last eight years–26 September 2024 –Concentrations of air pollutants decreased at many air quality monitoring sites between 2016 and 2023, according to figures released by Stats NZ today.
“PM10 trends decreased at 30 out of 41 local government monitoring sites, while trends for PM2.5 decreased at 12 out of 16 sites. Nitrogen dioxide (NO2) trends decreased at 99 out of 114 NZ Transport Agency Waka Kotahi monitoring sites between 2014 and 2023,” environment and agricultural statistics senior manager Stuart Jones said.
PM10 and PM2.5 are particles that can be suspended in the air and are less than 10 micrometres and 2.5 micrometres in diameter, respectively. They are primarily formed by residential wood burning, dust from unsealed roads, and industrial and construction activities. NO2 is a gas primarily formed through burning fossil fuels.
“PM10 can be breathed into lungs and PM2.5 is small enough to enter the blood stream. Concentrations of particles, gas, and liquid in air can be harmful to human health and contribute to health issues such as cardiovascular and respiratory health problems and increased mortality,” Jones said.
Visit our website to read this news story in full and view the indicators published today:
Air pollutant trends decrease at most monitoring sites over the last eight years – 26 September 2024 – Concentrations of air pollutants decreased at many air quality monitoring sites between 2016 and 2023, according to figures released by Stats NZ today.
“PM10 trends decreased at 30 out of 41 local government monitoring sites, while trends for PM2.5 decreased at 12 out of 16 sites. Nitrogen dioxide (NO2) trends decreased at 99 out of 114 NZ Transport Agency Waka Kotahi monitoring sites between 2014 and 2023,” environment and agricultural statistics senior manager Stuart Jones said.
PM10 and PM2.5 are particles that can be suspended in the air and are less than 10 micrometres and 2.5 micrometres in diameter, respectively. They are primarily formed by residential wood burning, dust from unsealed roads, and industrial and construction activities. NO2 is a gas primarily formed through burning fossil fuels.
“PM10 can be breathed into lungs and PM2.5 is small enough to enter the blood stream. Concentrations of particles, gas, and liquid in air can be harmful to human health and contribute to health issues such as cardiovascular and respiratory health problems and increased mortality,” Jones said.
Visit Statistics NZ’s website to read this news story in full and view the indicators published today:
Source: The Conversation – USA – By Andrew J. Hoffman, Professor of Management & Organizations, Environment & Sustainability, and Sustainable Enterprise, University of Michigan
The U.S. has seen a large number of billion-dollar disasters in recent years.AP Photo/Mark Zaleski
Millions of Americans have been watching with growing alarm as their homeowners insurance premiums rise and their coverage shrinks. Nationwide, premiums rose 34% between 2017 and 2023, and they continued to rise in 2024 across much of the country.
There are a few reasons, but a common thread: Climate change is fueling more severe weather, and insurers are responding to rising damage claims. The losses are exacerbated by more frequent extreme weather disasters striking densely populated areas, rising construction costs and homeowners experiencing damage that was once more rare.
Hurricane Ian, supercharged by warm water in the Gulf of Mexico, hit Florida as a Category 4 hurricane in October 2022 and caused an estimated $112.9 billion in damage. Ricardo Arduengo/AFP via Getty Images
Just a decade ago, few insurance companies had a comprehensive strategy for addressing climate risk as a core business issue. Today, insurance companies have no choice but to factor climate change into their policy models.
Rising damage costs, higher premiums
There’s a saying that to get someone to pay attention to climate change, put a price on it. Rising insurance costs are doing just that.
Increasing global temperatures lead to more extreme weather, and that means insurance companies have had to make higher payouts. In turn, they have been raising their prices and changing their coverage in order to remain solvent. That raises the costs for homeowners and for everyone else.
The importance of insurance to the economy cannot be understated. You generally cannot get a mortgage or even drive a car, build an office building or enter into contracts without insurance to protect against the inherent risks. Because insurance is so tightly woven into economies, state agencies review insurance companies’ proposals to increase premiums or reduce coverage.
The insurance companies are not making political statements with the increases. They are looking at the numbers, calculating risk and pricing it accordingly. And the numbers are concerning.
The arithmetic of climate risk
Insurance companies use data from past disasters and complex models to calculate expected future payouts. Then they price their policies to cover those expected costs. In doing so, they have to balance three concerns: keeping rates low enough to remain competitive, setting rates high enough to cover payouts and not running afoul of insurance regulators.
But climate change is disrupting those risk models. As global temperatures rise, driven by greenhouse gases from fossil fuel use and other human activities, past is no longer prologue: What happened over the past 10 to 20 years is less predictive of what will happen in the next 10 to 20 years.
The number of billion-dollar disasters in the U.S. each year offers a clear example. The average rose from 3.3 per year in the 1980s to 18.3 per year in the 10-year period ending in 2024, with all years adjusted for inflation.
With that more than fivefold increase in billion-dollar disasters came rising insurance costs in the Southeast because of hurricanes and extreme rainfall, in the West because of wildfires, and in the Midwest because of wind, hail and flood damage.
Hurricanes tend to be the most damaging single events. They caused more than US$692 billion in property damage in the U.S. between 2014 and 2023. But severe hail and windstorms, including tornadoes, are also costly; together, those on the billion-dollar disaster list did more than $246 billion in property damage over the same period.
As insurance companies adjust to the uncertainty, they may run a loss in one segment, such as homeowners insurance, but recoup their losses in other segments, such as auto or commercial insurance. But that cannot be sustained over the long term, and companies can be caught by unexpected events. California’s unprecedented wildfires in 2017 and 2018 wiped out nearly 25 years’ worth of profits for insurance companies in that state.
To balance their risk, insurance companies often turn to reinsurance companies; in effect, insurance companies that insure insurance companies. But reinsurers have also been raising their prices to cover their costs. Property reinsurance alone increased by 35% in 2023. Insurers are passing those costs to their policyholders.
What this means for your homeowners policy
Not only are homeowners insurance premiums going up, coverage is shrinking. In some cases, insurers are reducing or dropping coverage for items such as metal trim, doors and roof repair, increasing deductibles for risks such as hail and fire damage, or refusing to pay full replacement costs for things such as older roofs.
Some insurances companies are simply withdrawing from markets altogether, canceling existing policies or refusing to write new ones when risks become too uncertain or regulators do not approve their rate increases to cover costs. In recent years, State Farm and Allstate pulled back from California’s homeowner market, and Farmers, Progressive and AAA pulled back from the Florida market, which is seeing some of the highest insurance rates in the country.
In some cases, insurers are restricting coverage. Roof repairs, like these in Fort Myers Beach, Fla., after Hurricane Ian, can be expensive and widespread after windstorms. Joe Raedle/Getty Images
State-run “insurers of last resort,” which can provide coverage for people who can’t get coverage from private companies, are struggling too. Taxpayers in states such as California and Florida have been forced to bail out their state insurers. And the National Flood Insurance Program has raised its premiums, leading 10 states to sue to stop them.
According to NOAA data, 2023 was the hottest year on record “by far.” And 2024 could be even hotter. This general warming trend and the rise in extreme weather is expected to continue until greenhouse gas concentrations in the atmosphere are abated.
In the face of such worrying analyses, U.S. homeowners insurance will continue to get more expensive and cover less. And yet, Jacques de Vaucleroy, chairman of the board of reinsurance giant Swiss Re, believes U.S. insurance is still priced too low to fully cover the risk from climate change.
Climate change is a major factor in the rising cost of insurance. Join us for a special free webinar with experts Andrew Hoffman of the University of Michigan and Melanie Gall of Arizona State University to discuss the arithmetic behind these rising rates, what climate change has to do with it, and what may be coming in your future insurance bills.
Andrew J. Hoffman does not work for, consult, own shares in or receive funding from any company or organization that would benefit from this article, and has disclosed no relevant affiliations beyond their academic appointment.
Associate Education Minister David Seymour says data released today shows increased school attendance in Term 2 of 2024 with 53.2 per cent of students regularly attending, an increase of 6.1 percentage points compared to the same term last year.
Regular attendance across primary students increased by 7 percentage points, to 56.8 per cent, and by 4.5 percentage points for secondary students to 46.7 per cent. Rates also rose across all ethnicity groups, year levels, and school equity index groups.
“Attending school is the first step towards achieving positive education outcomes. Positive education outcomes can lead to better health, higher incomes, better job stability and greater participation within communities. These are opportunities that every student deserves,” says Mr Seymour.
“Every single education region showed increases in regular attendance, with South and South-West Auckland, and Tai Tokerau demonstrating the largest increases compared to Term 2 2023, with increases of 10.3 and 9.4 percentage points respectively.”
Students are regularly attending school when they are present for more than 90 per cent of the term. The Government target for student attendance is 80 per cent of students present for more than 90 per cent of the term by 2030.
“Missing a week or more of school in a term may not seem like a lot but actually equates to missing one year of schooling by the time the student is 16. Regular attendance is so important for giving students the best opportunities and setting them up for success,” says Mr Seymour.
“Winter illnesses played a significant role and attendance numbers are still behind the same period in 2019, when almost 58 per cent of students were regularly attending school. Although school attendance is on the rise, the government is working hard to raise it further.
“Today I am announcing new initiatives that form Phase 2 of the Attendance Action Plan to ensure that schools, the Ministry of Education, wider government, family, and caregivers are doing everything they can to get students back to school.
“If the truancy crisis isn’t addressed there will be an 80-year long shadow of people who missed out on education when they were young, are less able to work, less able to participate in society, more likely to be on benefits. That’s how serious this is.”
Tourism is Alberta’s number one service export sector, bringing jobs, dollars and prosperity into the province’s economy. The 2023 tourism indicators make it clear: investments made by Alberta’s government in the province’s tourism sector are paying off. According to the latest data from Statistics Canada, in 2023 visitors spent $12.7 billion in Alberta, surpassing 2022’s record-setting $10.7 billion by nearly 20 per cent.
In addition, international visitor spending surpassed pre-pandemic levels, injecting $2.9 billion into Alberta’s economy in 2023. This is an increase of more than 25 per cent from the previous high of $2.3 billion in 2019.
“This past February, Alberta’s government launched a long-term tourism strategy, setting the bold and ambitious goal of growing Alberta’s visitor economy from $10 billion in annual visitor expenditure to $25 billion annually by 2035. The strength of Alberta’s tourism industry—as demonstrated by our record-breaking year—show that the strategy is working. We are well on our way to reaching our goal.”
Alberta’s tourism strategy focuses on the five key pillars of leadership and alignment, competitive product, people and careers, expansion of access and Indigenous tourism to drive the province’s visitor economy to new heights. Travel Alberta, the province’s destination management organization, is key to the tourism strategy.
Notably, Travel Alberta’s investments in growth projects drove $155 million in total economic impact, creating jobs across the province. The organization also secured more than 300,000 direct airline seats to Alberta from international and transborder target markets, yielding nearly $11 in visitor spending for every dollar invested.
“This continued growth demonstrates that our strategies to develop and promote Alberta’s tourism sector are yielding strong results. Together, in partnership with the thousands of hardworking Albertans that make up the tourism industry, we’re building world-class destinations that support long-term prosperity for communities across the province.”
Quick facts
Statistics Canada determines spending from people travelling from international countries through their Visitor Travel Survey.
International expenditures in Alberta grew by 91 per cent year-over-year—faster than in other major provinces such as British Columbia (81 per cent), Ontario (77 per cent) and Quebec (63 per cent).
Travel Alberta is the destination management organization of the Government of Alberta. It operates under the Travel Alberta Act within the Ministry of Tourism and Sport.
Related information
Travel Alberta visitor spend data
Higher ground: a tourism sector strategy
Travel Alberta Annual Report 2023-24
Multimedia
Video message from Minister of Tourism and Sport Joseph Schow
Related news
En route to Alberta (Apr. 15, 2024)
Supporting new adventures in Alberta (Jan. 23, 2024)
Tourism spending recovers two years ahead of schedule (Nov. 17, 2023)
I am delighted to be able to speak before you today, as representatives of Hessian family businesses. Family businesses play a significant role for the German economy and German society.
In cooperation with the audit firm EY, the University of St. Gallen in Switzerland compiles the Global Family Business Index.[1] It lists the 500 largest family businesses in the world. And, last year, 78 businesses on this list – nearly 16% – were located in Germany. This puts Germany in second place behind the United States, which, however, has nearly five times the GDP of Germany. According to EY data, these 78 businesses generated the equivalent of just over €1 trillion in revenues in 2023.[2] Germany’s share of total revenues is therefore just over 10%. And, let it be noted, these are merely the largest and highest-revenue family enterprises.
However, when we talk about family businesses, it is naturally not just numbers that come to mind. It’s about much more than that, not least about tradition. What I often hear in this context is that “family businesses think in terms of generations, not quarterly reports”. For me, staying power is a good and important quality to have in order to comprehensively rise to challenges and overcome them sustainably. And we are currently facing our share of challenges; of that there is no doubt. I am referring to macroeconomic challenges, which also matter to family businesses.
Once a year, the Society for the German Language (Gesellschaft für die deutsche Sprache) chooses several terms as “Words of the Year”. Krisenmodus – “crisis mode” – took first place last year.[3] The term Krisenmodus will probably ring a bell if you look back across the past few years: the COVID–19 pandemic, disintegrating supply chains, high energy prices. This has also left its mark on economic growth, which, this year, will remain weak as well.
In my speech, I want to discuss in depth the factors that are still continuing to gnaw away at growth. These factors can be either temporary or also permanent in nature. My focus will be on the permanent factors, as we have to address these structural factors in order to make long-term progress. I will subsequently discuss which economic policy measures can specifically help overcome the current weak growth. However, let me first put the current period of economic weakness into context. How serious is the situation really?
2 Are Germany’s days as an industrial superpower coming to an end?
In the first half of 2024, like last year, Germany ranked among the laggards in terms of growth in the euro area. German GDP more or less stagnated in the first six months of the year, whereas the euro area average picked up markedly. Germany does not come off favourably in a global comparison, either. The advanced economies’ collective GDP rose by 0.5% in the spring, and of these, the United States even saw a 0.7% increase.
Third-quarter economic figures for Germany have likewise remained weak. All the while, the media seem to be trying to outdo each other with horror stories about the German economy. “Germany’s days as an industrial superpower are coming to an end” was, for instance, the title of a Bloomberg article in February on the current economic situation in Germany.[4] We read further on in that story that the “underpinnings of Germany’s industrial machine have fallen like dominoes”.
Just a cursory look back over the history of our economy shows us this: there is nothing inherently new about such headlines and debates. Germany weathered a pronounced slump around the turn of the millennium. Bloomberg Businessweek titled the cover page of its February 2003 issue “The decline of Germany”.[5] And, at the end of 2004, German author Gabor Steingart published a book titled Deutschland – der Abstieg eines Superstars (Germany – The decline of a superstar).[6] Is that painful crisis threatening to repeat itself? Are we in decline?
Without wanting to get ahead of myself: we are undoubtedly in a midst of a difficult transformation process. But it’s a process we have the power to shape. And if we shape it right, then my clear response is: No, in my opinion Germany is not in decline! How is today’s situation in Germany different from that at the turn of the millennium? Let’s take a look at the numbers.
At that time, the unemployment rate as calculated by the International Labour Organization (ILO) stood at over 9% on average; it is now 3.3%, and thus also well below the euro area average of 6.5%. Back then, the most pressing labour market problem was unemployment; now, it is the shortage of skilled workers.
Moreover, German firms’ profitability and capital base are much better now than they were 25 years ago. As a case in point, the average capital ratio was 23% then, whereas in the 2020 to 2022 period it averaged 30%. The profit margin went up from 3.4% at the time to 4.5% in the 2020 to 2022 period. These data are subject to a major time lag, which is why we do not yet have any numbers for 2023.
However, what are the reasons for the current feeble growth dynamics? The energy crisis had an outsized impact on Germany, an exporting country where manufacturing has a special status. As, before the outbreak of Russia’s war of aggression against Ukraine, dependency on inexpensive Russian energy deliveries was high – too high. Moreover, the fallout from the high inflation weighed on the economy. Many consumers kept their purse strings tight. In addition, the restrictive monetary policy is dampening economic activity. And last but not least, industry continues to be impacted by weak foreign demand, particularly because our euro area trading partners’ imports rose less strongly than world trade. What we know for sure is that some of these factors are only temporary. We therefore assume that Germany’s economy will be able to slowly regain some momentum.
3 Structural challenges
Some factors, however, have a longer-term effect. We are facing extensive structural challenges which can likewise dampen growth. To wit, energy costs are set to remain higher than before Russia’s war of aggression against Ukraine for quite a while to come. The price of natural gas fell from some €240 per kilowatt hour in August 2022 to €30 in early 2024, before then bouncing back up to around €38 in August of this year, still well above the average price of €13 in the pre-crisis year of 2019.
But the desired transition to a carbon-free energy supply will be costly as well, at least over a relatively long transition period. Plus there are further challenges such as demographic change, the reduction of unilateral dependence on imports and fragmentation of international trade.
The transition to a climate-neutral economy, above all, will require massive investment. On this point, a study commissioned by the KfW Group estimated the volume of investment needed to reach Germany’s net-zero targets by mid-century. The result: around €5 trillion. [7] A McKinsey study even puts the figure higher still, at €6 trillion.[8] And just like when you retrofit an old building to improve its energy efficiency, that number includes investment that will be made in any event. But the estimated incremental investment is considerable, too. The KfW study puts this at around €72 billion per year, or just under 2% of German GDP.
And even though the comprehensive digitalisation process that needs to take place will offer huge opportunities, it, too, will require investment, not to mention training or reconceptualising of processes and business lines. But how is investment faring in Germany at the moment? Let’s take a look at the statistics.
They show that investment in buildings, machinery and equipment, and other assets in Germany has not grown over the past few years. And declining investment was a key factor behind the slight contraction in economic output in the second quarter. But not just that: in a recent analysis the audit firm EY found that the number of foreign investment projects in Germany has dropped for the past six years in a row.[9] All things considered, despite the aforementioned challenges and the need for investment that they entail, there is currently no indication of an investment boom.
But what are the reasons for this weak investment propensity? We have investigated this question through our business survey, the Bundesbank Online Panel – Firms. In it, around 7,400 German firms were asked in the third quarter of 2023 about their motives for investment. We published the results in the May edition of our Monthly Report.[10]
The poor macroeconomic setting was evidently the key reason for declining investment. This was closely followed by high energy and wage costs, a shortage of skilled workers, uncertainty about regulation, and high taxes and public levies. Low public funding, inefficient public administration and poor digital infrastructure played a lesser role. These findings may be a year old, but there is much to suggest that they remain valid.
4 The tasks of economic policy
This brings us to the following question: what can economic policy do to remove barriers to investment, or at least mitigate them? One thing it certainly cannot do is directly influence the challenging global setting. For certain other barriers, however, it is very much possible and preferable to tackle them through economic policy. I would like to address three such areas: energy and climate policy, bureaucratic hurdles and the labour market.
4.1 Energy and climate policy
The first area primarily concerns planning certainty and reliability in energy and climate policy. The terms planning certainty and reliability were not plucked out of thin air, as shown by the Economic Policy Uncertainty Index. Developed by the economists Scott Baker, Nicholas Bloom and Steven Davis, this index is based on the analysis of pertinent newspaper articles.[11] According to the index, economic policy uncertainty in Germany has risen much more strongly over the past few years than the average for Europe.[12] Deciding to invest in green technologies is mostly tied up with irreversible costs. So where there is uncertainty about future policy, firms understandably hesitate before making such decisions.
Now, there is no doubt about the basic direction we’re heading in: we have to become carbon neutral if we care even just a little for the welfare of subsequent generations. But when it comes to the details, there is indeed uncertainty. How will the costs of fossil fuels develop? How will the costs of environmentally friendly energy develop and will there be a reliable supply? What will government regulation, taxation, and support look like?
To reduce these kinds of uncertainties about the energy transition, it is vital that we have a transparent, purposeful and consistent overall framework. This framework includes having sufficient capacity to import and store climate-neutral energy, and back-up power plants for the event that a dunkelflaute – a period with no wind or sunlight – coincides with a period of high energy needs. And, of course, an efficient energy grid. It will therefore be increasingly important, too, to expand power lines connecting Germany from north to south, but also connecting us to our neighbours in Europe.
The Bundesbank believes that the key instrument to achieve climate objectives should be a price on carbon emissions. This is because carbon pricing ensures that savings and investment are made where it is possible to do so with the lowest costs. However, the crucial thing is to apply carbon pricing as broadly, uniformly and predictably as possible.
Ambitious carbon pricing not only creates incentives for the use of renewable energy, but also for greater energy efficiency. Our April Monthly Report showed how important advancements in energy efficiency are to not missing climate targets.[13] Increases in energy efficiency reduce aggregate energy intensity and thereby boost aggregate production. They thus counteract the activity-dampening stimuli likely to emanate from a higher carbon price.
So the production losses or gains that would be associated with achieving climate goals depend not least on energy-saving technological progress. Besides carbon pricing, subsidies for research and development are one conceivable instrument to increase energy efficiency. However, subsidies should be used in a measured and purposeful manner.
I’m not just concerned about the burden on government finances, which we naturally have to keep an eye on as well. When government interventions become too complex and too extensive, they can significantly distort market incentives. It is possible, for example, that firms keep putting off the necessary investment in the hopes of receiving future subsidies. Some subsidies still in place in the energy and transportation sectors actually run counter to the climate goals. To a certain extent, they therefore act in the same way as a negative carbon price.[14] And last but not least, excessive government intervention ultimately leads to bureaucratic hurdles.
4.2 Bureaucratic hurdles
That brings me to the second area where economic policy can improve the investment climate: the burden of bureaucracy. We should make a distinction between two different aspects here. First, there is the extent of requirements placed on firms. For example, there has recently been intense debate about the Supply Chain Act and questions surrounding data protection. In this respect, politicians should make sure they don’t throw the baby out with the bathwater. Even if the objectives are legitimate, the ability to implement measures has to be borne in mind.
Second, the speed of bureaucracy is important. In Germany, congestion occurs not just on the motorways but also in approval processes. It can sometimes take years for a wind turbine to go into operation, say. When it comes to the pace and efficiency of bureaucracy, especially, we should consider digitalisation as a huge opportunity. Digital technologies can simplify and streamline administrative processes. Incidentally, that is very much in the interest of the administration seeing as it, too, is affected by the shortage of skilled workers. It would appear somewhat logical to bundle more processes when it comes to the digitalisation of administration.
That means the targeted transferral of responsibilities to central units, which develop harmonised approaches in a cost-effective way. This would open the door to achieving economies of scale, if the relevant costs per process are reduced thanks to a larger area of application, say. What I’m thinking about here is the digitalisation of the tax administration, for instance. It could likely leverage efficiency reserves if certain tasks were delegated to a single unit. A modern form of federalism could also help us to leverage efficiency reserves, specifically when those responsible actually learn from the best practices of others.
And I’m speaking on this not just as an economist, but also as the president of a large public authority. Dismantling bureaucracy and driving digitalisation often require enormous effort and persistence. But they also present huge opportunities. There’s a reason why the Society for the German Language listed “AI boom” as another “Word of the Year” in 2023, ranking it number eight.
4.3 Labour market
The third area where economic policy can play an important role is the labour market. You, as operators of businesses, have been complaining of a shortage of skilled workers for many years now. Quite apart from the current bout of economic weakness, the problem has been increasingly exacerbated by demographic change. And it will become even greater in the future.
The number of vacancies per unemployed person is often used as an indicator of tightness in the labour market. Up until 2014, there were around three vacancies for every 10 unemployed persons.[15] At the moment, there are roughly six jobs available for every ten unemployed persons. And the number of vacancies has also climbed to an all-time high since the end of the pandemic and is barely coming down. There is a shortage of skilled workers, and a shortage of labour.
There is a host of conceivable measures to reduce this shortage: open up better employment opportunities for women and older people, make a targeted play for skilled workers from abroad, strengthen vocational and further training, and do a better job of getting the long-term unemployed and immigrants into work.
Equally, we shouldn’t lose sight of the groups that so far haven’t participated in the labour market – known as the “hidden reserve”. According to the Federal Statistical Office, Germany’s hidden reserve recently came to almost 3.2 million people.[16] Close to 60% of them have a mid to high-level qualification. Looking at the hidden reserve, there are significant differences between the genders. For example, many women state that they cannot work because they care for children or family members. We should make better use of this untapped potential labour force. Expanded care facilities for children or dependants requiring care are an important way to help more people enter the labour market.
I am certain that many of you have already taken steps at your businesses to make it easier to reconcile work and family life: you operate kindergartens or have spaces reserved at other childcare facilities, offer flexible working time models or the option of working from home – the list of possibilities is long.
The number of older persons in employment could be increased as well, for example if the statutory retirement age were linked to life expectancy after 2030. This would allow the ratio of retirement to working years to be more or less stabilised. Without this link, the ratio would carry on growing as life expectancy continues to rise. Also, in the short term, it might be worth considering limiting the financial incentives to take early retirement.
After all, in the interests of preserving a good employment and investment climate, it is important to see to it that the tax burden on labour and capital remains reasonable. Germany, for instance, has a high corporate tax burden in comparison to other countries.[17]
The Federal Government has the three economic policy areas I have just spoken about on its radar. This can be seen in this year’s growth initiative from 17 July. The bundle of 49 measures is intended – amongst other things – to increase incentives to work, including making it more attractive for older people to remain in work, accelerate the reduction of bureaucracy and secure the further expansion of renewable energy generation. The growth initiative is an important step in the right direction if Germany wants to rise to today’s challenges. Much depends on its implementation, however. And there is still much to be done.
As an economist myself I must of course not forget what the term “budget constraints” implies: it is not easy to deal with all these challenges when the public purse is light. This being as it is, a critical evaluation of economic policy priorities is almost certainly unavoidable, and that evaluation will remain on the agenda even if the debt brake were to be reformed. The Bundesbank would tolerate a reform if it would continue to guarantee sound government finances. And we have proposed some stability-oriented reforms.
4.4 More financing via the capital markets union
I have gone over what politics and politicians can do to improve the investment climate in Germany. But whether or not an investment will pay off over the long term is not the only important factor. Any investment project must also be funded.
That brings me to the European perspective. Because, all too often, businesses come up against internal European borders in their search for funding. An integrated capital market across the whole of Europe could give European businesses access to more funding for important private investments. But to forge that integrated pan-European capital market, we must make swift progress on both the banking and capital markets unions.
To demonstrate my point with figures: securitisation markets in the EU saw a volume of around €800 billion in 2020. In the United States, this volume was at around US$3.2 trillion, excluding government-guaranteed products.[18] So that’s a different magnitude altogether, even though the United States and the EU have comparably large economies when measured by purchasing power parity.[19] The European securitisation market fell apart following the financial crisis and has never fully recovered since. The securitisation volume in the United States, on the other hand, has already exceeded pre-crisis levels, with the caveat that American market structures are not perfectly comparable with European ones.
You may be thinking that securitisation has a bad reputation. And you would be right. After the 2008 financial crisis it was the poster child for “bad financial market innovations” and mainly brought to mind the sale of potentially non-performing loans to unsuspecting investors. As the head of the Bundesbank’s financial crisis management team at the time, I had an unmatched position from which to examine the dynamics of the crisis in detail.
The financial crisis did indeed lay bare the weaknesses in the securitisation process, which can particularly come to bear in highly complex securitisation transactions. These related to deficits surrounding transparency, risk management and valuation methods. Properly structured and well regulated, though, securitisation vehicles can definitely offer added value to our economy. Securitisation markets complement other sources of long-term financing in the real economy. They give enterprises the opportunity to broaden their funding.
This particularly applies to small and medium-sized enterprises, because securitisation gives them indirect access to capital market investors. Moreover, securitisation can relieve the pressure on bank balance sheets and open up additional scope for lending to the private sector. Well-regulated and structured securitisation markets could improve the allocation of resources in an economy and ensure a better distribution of risk.[20] This could reduce funding costs and increase economic growth.
Support for the securitisation market is thus an important element of EU plans for a capital markets union. But there are others. The creation of integrated financial supervisory structures is planned. National insolvency rules, accounting and securities law are to be harmonised. The goal is to create a level playing field for all financial market participants operating at the EU level. And so long as this goal remains abstract, pretty much nobody has a problem with it. As soon as concrete decisions and negotiations enter the picture, however, unity often dissipates. Harmonising national rules is impossible without compromise, after all.
Happily, more and more European policymakers are coming around to the view that we urgently need a common capital market. There’s been some movement on that front in the last few months. I think, for example, that we have made good progress towards developing a European securitisation market. We need to break down the barriers separating European capital markets one by one!
5 Conclusion
Ladies and gentlemen,
As far as the structural challenges are concerned, we need to set the necessary changes in motion and make them fit for purpose. I am certain we can achieve that. The underpinnings of Germany’s industrial machine are still intact, and Germany’s position as an industrial and investment location is better than its present reputation implies. After recording sluggish growth at the turn of the millennium, Germany ranked as an economic powerhouse in Europe for more than decade.[21] Perhaps that should inspire us to invest shrewdly and sufficiently in our future.
Economic policymaking can lay a solid foundation for that investment, but it is not all-powerful. It all comes down to enterprises and their employees in the end. Academic studies show that family businesses have greater resilience when in crisis mode than other enterprises.[22] I therefore firmly believe that all of you, as operators of family-owned businesses, continue to play an important role in ensuring the German economy rises to the challenges it faces today. And thus in ensuring that Germany remains ready for what the future holds
See EBA (2022), Joint Committee advice on the review of the securitisation prudential framework (Banking), p. 24. For comparison purposes, the total volume of the US securitisation market (US$13,131 billion) was adjusted for agency ABSs (75%), while the total volume of the EU securitisation market (€3,058 billion) was adjusted for mortgage CBs (63%) and other CBs (11%).
Buchner et al. (2021), Resilienz von Familienunternehmen – Eine systematische Literaturanalyse, Betriebswirtschaftliche Forschung und Praxis 73, Vol. 3, pp. 225 f.
Women in the science, technology, engineering, and mathematics fields are experiencing a new period of growth, acceptance, and respect in the modern workforce.
But when UConn alumna Jeanine Armstrong Gouin studied civil engineering in the 1980s, it was hard to feel welcome in an engineering building that didn’t even have a women’s bathroom.
Despite the dreary beginning, Gouin (who graduated in 1987, about four years before the Castleman Building installed women’s restrooms) delivered an inspirational message to an audience of young female STEM students last week.
A member of the audience asks a question during the Q&A portion of the Career Panel.
The Women in STEM Frontiers in Research Expo (WiSFiRE) was held on Friday at the UConn Storrs campus. It brought together university undergraduate and graduate students, faculty, staff, alumni, and STEM employees and supporters.
WiSFiRE was one of the first conferences in the region to specifically highlight the work of women researchers in STEM. That mission has been solidified through a recent endowment by Gouin.
Gouin, who is both a UConn Trustee and U.S. division president of environmental consulting firm SLR International Corp., made an undisclosed gift in July to endow the Jeanine Armstrong Gouin Initiative for Women in Leadership at the UConn College of Engineering.
The gift will provide financial support for leadership programs and activities that are available to all engineering students, not just women.
Part of that endowment will continue to support WiSFiRE.
Friday’s event included panels, technical talks, and networking opportunities for the men and women leading the STEM fields today.
Speakers, panelists and moderators included: Gouin; physics professor Nora Berrah; alumna and University of Kentucky professor Gosia Chwatko; earth sciences professor Ran Feng; animal science professor Sarah Reed; chemical and biomolecular engineering professor Kristina Wagstrom; civil and environmental engineering professor Guiling Wang; electrical and computer engineering professor Zongjie Wang; statistics professor Elizabeth Schifano; biomedical engineering professor Leila Daneshmandi; civil and environmental engineering professor Alexandra Hain; molecular and cell biology professor Kat Milligan-McClellan; biomedical engineering professor Kristin Morgan; civil and environmental engineering professor Fatemeh Fakhrmoosavi; animal science professor Maria Gracia Gervasi; mechanical, aerospace, and manufacturing engineering professor SeungYeon Kang; computing professor Lina Kloub; chemistry professor Priya Shah; pharmacy professor Kristin Waters, and mathematics professor Xiaodong Yan.
The expo is co-chaired by UConn Engineering professors Qian Yang and Anna Tarakanova.
To the students and budding engineers, UConn faculty advised them to challenge themselves, answer the unanswered questions, get involved, and above all else, be the hard worker they always dreamed of being.
“Learn the skills you know you need to learn,” Wagstrom said. “Critically look at everything you’re producing. You are the best judge of your own work.”
Tarakanova explained that through Gouin’s support, they hope to build momentum throughout the year, with smaller events and opportunities to gather together between the annual exposition.
Jeanine Armstrong Gouin presenting during the fourth annual WiSFiRE.
“We look to establish more mentor/mentee models through the STEM fields in the university,” Tarakanova said. “While many of us are blessed to have found our ‘home’ of supporters early on in our careers, there are many young women who still need to find their ‘STEM sisters.’”
After the event, participants supplied feedback about the days’s offerings.
“I personally enjoyed seeing that many amazing women in STEM,” one participant said. “It’s been a long time since the last time I felt welcome in an academic environment, but this event reminded me of who I always wanted to be.”
Students enjoyed the opportunities for networking, and the panel speakers.
“I enjoyed talking to other people, hearing the inspirational words, and hearing students present research,” one student commented. “I didn’t realize how intimidated I was by research before, and this experience has given me confidence and assurance that I can do it too.”
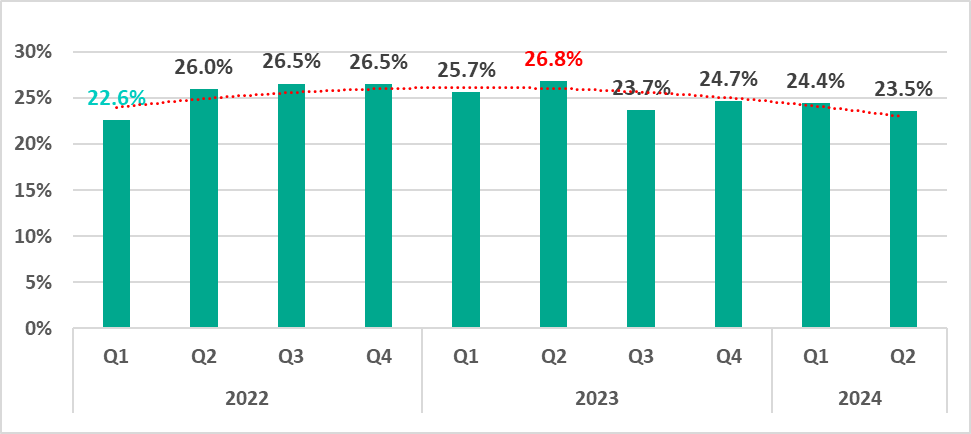
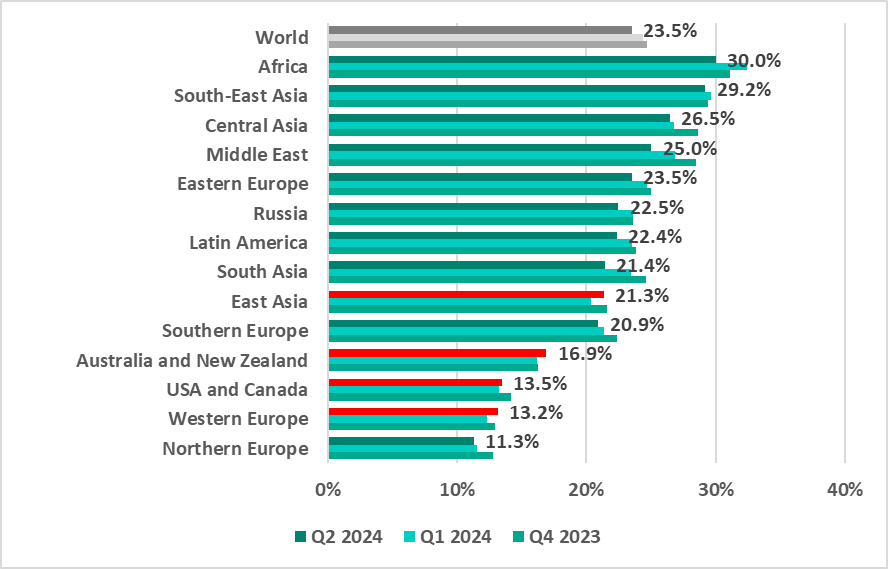
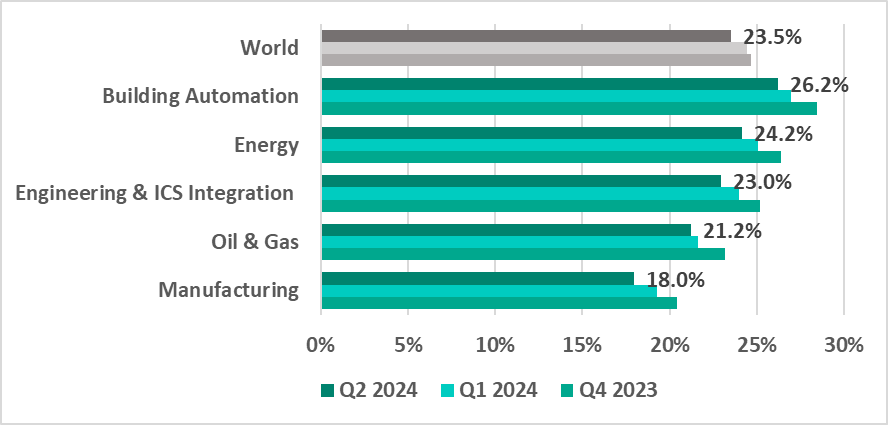
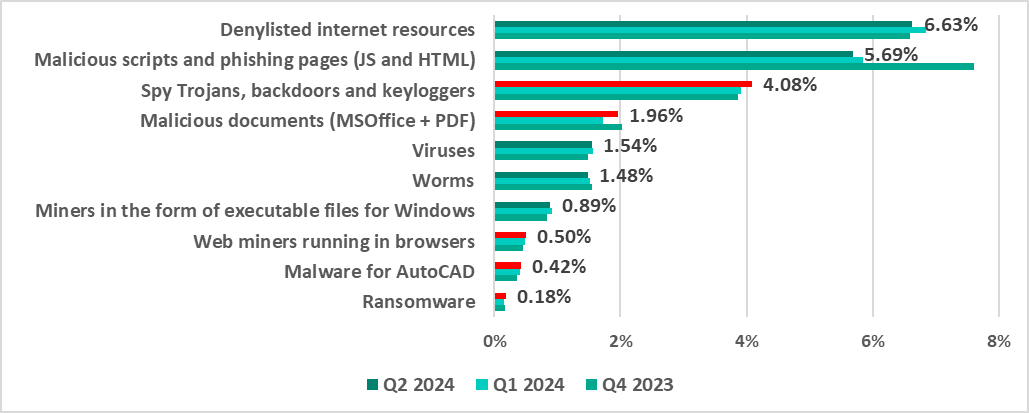
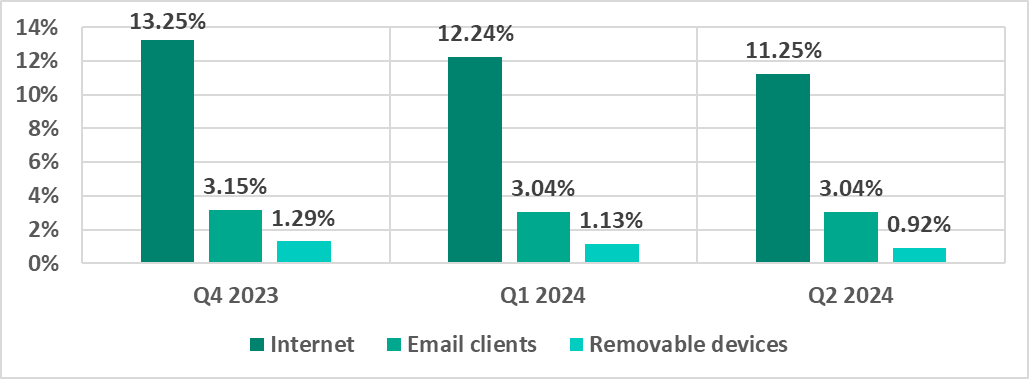
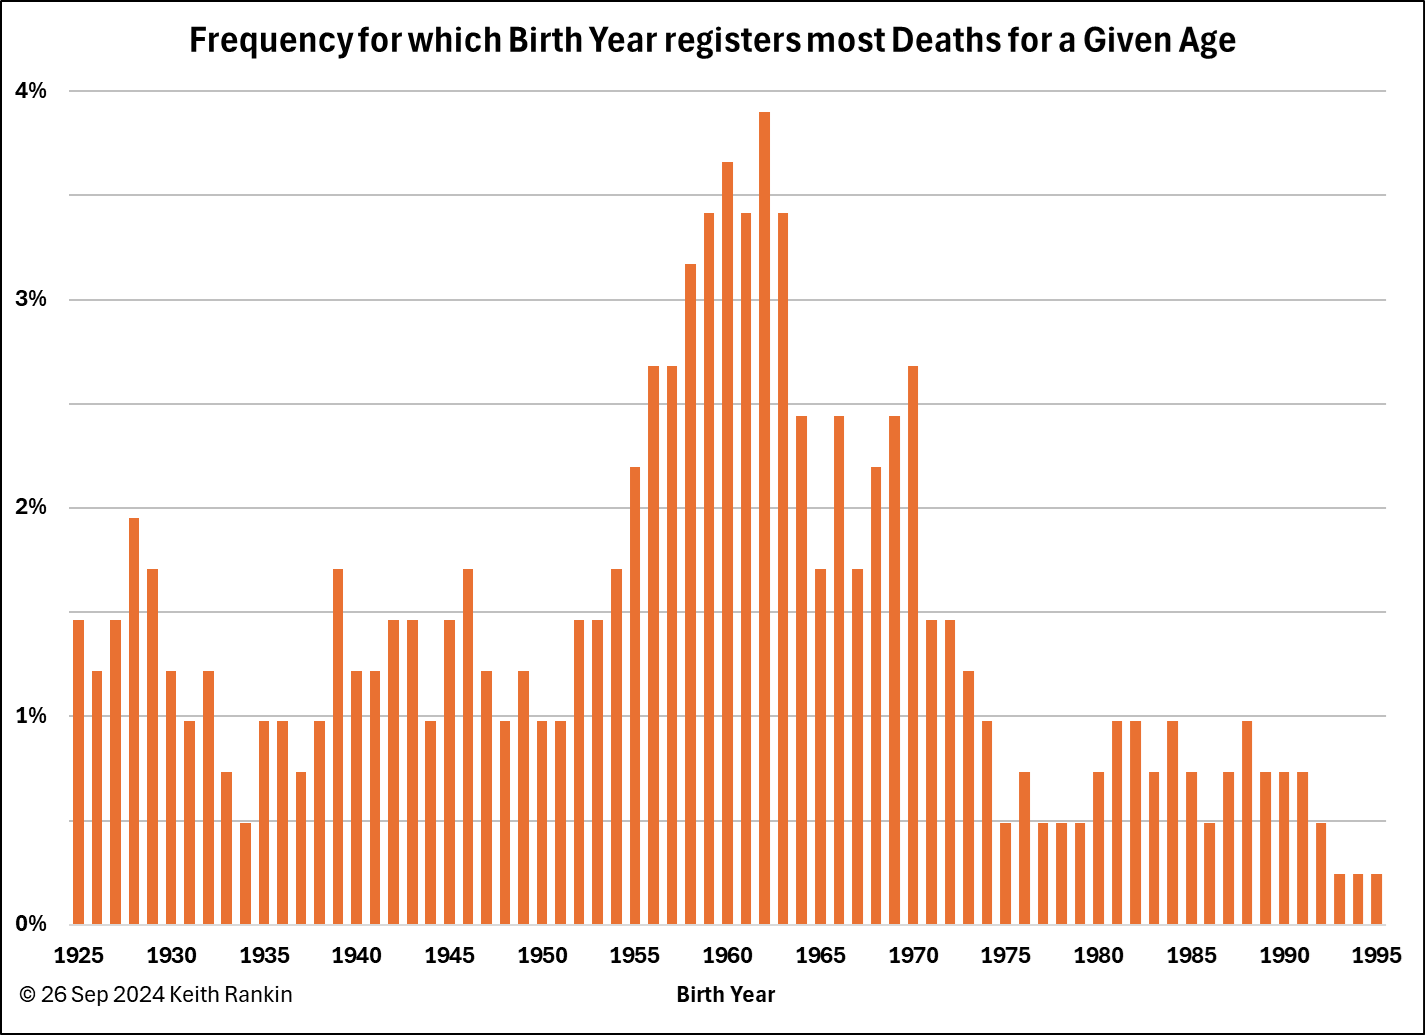