Category: Statistics

  • MIL-OSI Australia: New pedestrian crossing on Canberra Avenue to improve student safety

    Source: Australian National Party

    As part of ACT Government’s ‘One Government, One Voice’ program, we are transitioning this website across to our . You can access everything you need through this website while it’s happening.

    Released 12/05/2025

    As part of its ongoing commitment to road safety, the ACT Government has announced the installation of a new signalised midblock pedestrian crossing on Canberra Avenue near Burke Crescent. The crossing will improve safety for students from St Edmund’s and St Clare’s Colleges, supporting safer commutes to and from school.

    Minister for City and Government Services Tara Cheyne said the decision to install the crossing reflects the Government’s commitment to protecting vulnerable road users, particularly young people.

    “This crossing will make a real difference for students who cross this busy road every day. Their safety is our priority, and we’re acting to ensure they can travel to and from school with greater confidence,” Minister Cheyne said.

    “The ACT Government will fast-track design of the crossing to support seeking approvals and enable construction. More information will be provided to the local school community on timing in the next couple of months.”

    Minister for Education Yvette Berry welcomed the announcement, noting the importance of a safe and supportive environment for students beyond the school gate.

    “Students should be able to get to and from school safely, no matter how they travel. This new crossing will provide the school communities greater peace of mind and help support student wellbeing,” Minister Berry said.

    The announcement coincides with National Road Safety Week 2025, a time to reflect on the impact of road trauma and the collective responsibility to keep our roads safe.

    “In 2024, eleven people tragically lost their lives on ACT roads, and already this year, we have lost three more. And I know that the incident in late March outside St Eddies has had and will continue to have a profound impact on this tight-knit community,” Minister Cheyne said. “Every death or injury is a devastating reminder that road trauma has lasting impacts on families, friends, and the wider community. These are not just statistics – they are lives lost too soon, and futures cut short or dramatically altered.”

    “National Road Safety Week is a time to come together with other jurisdictions and shine a light on the importance of safe driving behaviours. We must all remember that road safety is everyone’s responsibility, and every action we take behind the wheel matters.”

    The ACT Government remains committed to Vision Zero, a future where no one is killed or seriously injured on our roads.

    “When we drive, we’re not just responsible for ourselves, we’re responsible for everyone around us. Vision Zero means choosing to slow down, staying alert, and driving to the conditions. Even one death on our roads is one too many.”

    “The ACT Government, alongside ACT Policing, continues to deliver education and enforcement campaigns to change attitudes and behaviours on our roads. Road safety doesn’t begin and end with Road Safety Week – it is an everyday priority.”

    “Every crash carries a cost – emotionally, economically, and socially. We must never accept road trauma as an unavoidable part of transport. Every life lost is preventable, and every life matters.”

    During National Road Safety Week, the ACT Government urges all Canberrans to take the pledge to drive so others survive.

    – Statement ends –

    Tara Cheyne, MLA | Media Releases

    «ACT Government Media Releases | «Minister Media Releases

    MIL OSI News

  • MIL-OSI United Kingdom: Promoting Gaelic in the Hebrides

    Source: Scottish Government

    Support for local projects.

    Gaelic initiatives in the Outer Hebrides are to benefit from Scottish Government funding as part of efforts to grow the language.

    An Taigh Cèilidh (The Cèilidh House), a Gaelic cultural centre in Stornoway, will receive £10,000 to undertake renovations and purchase musical instruments. The visitor attraction includes a shop and café and hosts cèilidhs and other live music events in the Gaelic language.

    Funding of £110,000 will also be provided to MG ALBA (The Gaelic Media Service) to modernise studios used by BBC ALBA in Stornoway. Independent research has found that Gaelic media generates £1.34 for every £1 invested and supports 340 jobs across Scotland, including 160 jobs in the islands.

    Deputy First Minister Kate Forbes announced the funding ahead of a visit to Stornoway following one year in office as Scotland’s first Gaelic Secretary.

    Ms Forbes said:

    “The Scottish Government recognises that urgent action is needed to grow the Gaelic language in communities where it is traditionally spoken.

    “This investment will support Gaelic community events in Stornoway and ensure that Gaelic broadcasters can continue to develop high-quality programmes. This follows the success of BBC ALBA’s crime thriller series An t-Eilean (The Island).

    “To grow Gaelic across Scotland, we are also introducing the Scottish Languages Bill to strengthen Gaelic education provision and investing £35.7 million in initiatives to promote the language in 2025-26.”

    Background

    Funding is being made available through 2024-25 Gaelic Capital Fund allocations.

    Census statistics show that 14,633 people in the Outer Hebrides had some Gaelic skills 2022, a decrease of 1,856 people from 2011.

    Research from Ernst and Young on the economic impact of MG ALBA is available online.

    A’ cur Gàidhlig air adhart anns na h-Eileanan an Iar

    Taic do phròiseactan ionadail

    Tha iomairtean Gàidhlig anns Na h-Eileanan an Iar gus buannachd fhaighinn à maoineachadh le Riaghaltas na h-Alba a tha ag obair a dh’ionnsaigh fàs a’ chànain.

    Gheibh An Taigh Cèilidh, ionad cultarail Gàidhlig ann an Steòrnabhagh, £10,000 gus obair-leasachaidh a leantainn is ionnsramaidean ciùil a cheannachd. Tha bùth is cafaidh aig an ionad is bidh e a’ cur air dòigh cèilidhean agus tachartasan ciùil beò eile anns a’ Ghàidhlig.

    Thèid cuideachd maoineachadh luach £110,000 a thoirt do MG ALBA gus ùrachadh a dhèanamh ri stiùideothan a tha air an cleachdadh le BBC ALBA ann an Steòrnabhagh. Tha rannsachadh neo-eisimeileach air lorg gu bheil na meadhanan Gàidhlig a’ cruthachadh £1.34 airson gach £1 a tha air a thasgadh annta. Bidh iad cuideachd a’ cur taic ri 340 cosnadh air feadh Alba le 160 dhiubh sin anns na h-eileanan.

    Chaidh am maoineachadh seo a chur an cèill leis an Leas-Phrìomh Mhinistear Ceit Fhoirbeis is i a’ tadhal air Steòrnabhagh aon bhliadhna bhon a chaidh a cur an dreuchd mar a’ chiad Rùnaire Gàidhlig aig Alba.

    Thuirt a’ Bh-uas. Fhoirbeis:

    “Tha Riaghaltas na h-Alba ag aithneachadh gu bheil gnìomh èiginneach a dhìth gus fàs a thoirt air a’ Ghàidhlig sna coimhearsnachdan far an tèid a bruidhinn gu traidiseanta.

    “Cuiridh an tasgadh airigid seo taic ri tachartasan coimhearsnachd Gàidhlig ann an Steòrnabhagh. Nì e cuideachd cinnteach gun urrainn do chraoladairean Gàidhlig cumail orra a bhith a’ leasachadh phrògraman fìor mhath. Tha seo a’ leantainn air cho soirbheachail ’s a bha an sreath dràma eucorach aig BBC ALBA, An t-Eilean.

    “Gus am bi a’ Ghàidhlig a’ fàs air feadh Alba, tha sinn cuideachd a’ toirt a-steach Bile nan Cànan Albannach gus foghlam Gàidhlig a neartachadh agus a’ cur £35.7 millean ri iomairtean gus an cànan a chur air adhart ann an 2025-26.”

    Cùl-fhiosrachadh

    Tha am maoineachadh a’ tighinn bho Mhaoin-chalpa na Gàidhlig 2024-25. 

    Sheall àireamhan a’ chunntais-shluaigh gun robh ìre de Ghàidhlig aig 14,633 neach sna h-Eileanan an Iar ann an 2022, ìsleachadh de 1,856 neach ann an 2011.

    ’S urrainnear rannsachadh le Ernst agus Young mu bhuaidh eaconamaich MG ALBA fhaighinn air-loidhne.

    MIL OSI United Kingdom

  • MIL-OSI New Zealand: Stats NZ information release: Rainbow/LGBTIQ+ population: 2023 Census

    Source: Statistics New Zealand

    Rainbow/LGBTIQ+ population: 2023 Census 13 May 2025 – Rainbow /LGBTIQ+ population: 2023 Census provides data on LGBTIQ+ communities with the release of 24 new Aotearoa Data Explorer tables.

    The 2023 Census was the first census to collect information on LGBTIQ+ communities in Aotearoa New Zealand. The LGBTIQ+ population output from the 2023 Census includes people who are lesbian, gay, bisexual, transgender, non-binary, were born with a variation of sex characteristics, or have other minority genders or sexual identities.

    LGBTIQ+ statistics give a picture of the diversity within our population, and enable people to advocate for the needs of LGBTIQ+ communities. This data is valuable for informing local and central government planning, service provision, and policy development. It also allows us to understand how outcomes differ for LGBTIQ+ and non-LGBTIQ+ people in New Zealand.

    Files:

    MIL OSI New Zealand News

  • MIL-OSI Submissions: Unemployment rate remains at 5.1 percent in the March 2025 quarter – Stats NZ media and information release: Labour market statistics: March 2025 quarter

    Source: Statistics New Zealand

    Unemployment rate remains at 5.1 percent in the March 2025 quarter7 May 2025 – The seasonally adjusted unemployment rate was 5.1 percent in the March 2025 quarter, unchanged from last quarter, according to figures released by Stats NZ today.

    In the March 2025 quarter:

    • the unemployment rate was 5.1 percent
    • the employment rate was 67.2 percent
    • annual wage inflation was 2.9 percent
    • average ordinary time hourly earnings were $42.79.

    “Seasonally adjusted levels of unemployment remained at 156,000 between the December 2024 and March 2025 quarters,” labour market spokesperson Abby Johnston said. 

    Files:


    MIL OSI

  • MIL-OSI Submissions: Stats NZ information release: Rainbow/LGBTIQ+ population: 2023 Census

    Source: Statistics New Zealand

    Rainbow/LGBTIQ+ population: 2023 Census13 May 2025 – Rainbow /LGBTIQ+ population: 2023 Census provides data on LGBTIQ+ communities with the release of 24 new Aotearoa Data Explorer tables.

    The 2023 Census was the first census to collect information on LGBTIQ+ communities in Aotearoa New Zealand. The LGBTIQ+ population output from the 2023 Census includes people who are lesbian, gay, bisexual, transgender, non-binary, were born with a variation of sex characteristics, or have other minority genders or sexual identities.

    LGBTIQ+ statistics give a picture of the diversity within our population, and enable people to advocate for the needs of LGBTIQ+ communities. This data is valuable for informing local and central government planning, service provision, and policy development. It also allows us to understand how outcomes differ for LGBTIQ+ and non-LGBTIQ+ people in New Zealand.

    Files:

    MIL OSI

  • MIL-Evening Report: Range anxiety – or charger drama? Australians are buying hybrid cars because they don’t trust public chargers

    Source: The Conversation (Au and NZ) – By Ganna Pogrebna, Executive Director, AI and Cyber Futures Institute, Charles Sturt University

    VisualArtStudio/Shutterstock

    Range anxiety has long been seen as the main obstacle stopping drivers from going electric.

    But range isn’t the real issue. The average range of a new electric vehicle (EV) is more than 450 kilometres, and top models offer more than 700km per charge. By contrast, the average car is driven about 33km per day in Australia as of 2020.

    What’s really going on is charger anxiety – the question of whether you can find somewhere reliable to recharge when you’re away from home. Australia’s public chargers are not common enough or reliable enough to give motorists certainty they can find a place to recharge.

    This is why many drivers are hedging their bets. Rather than embracing battery-electric vehicles, many Australian drivers are opting for hybrids as well as plug-in hybrids (PHEVs), which couple a smaller battery with an internal combustion engine. Hybrids and PHEVs accounted for almost 20% of new car sales from July–September last year, compared to 6.5% for fully electric vehicles.

    Labor’s reelection could lead to better charging infrastructure. Last term, the federal government set a goal of a fast charging station every 150km along major highways, while state governments are also building more. But so far, these efforts aren’t enough to ensure Australia has reliable chargers in the right locations. Until then, cautious drivers will buy hybrids.

    Australia’s charger network has expanded, but many drivers are anxious about availability and reliability.
    Stepan Skorobogadko/Shutterstock

    Public chargers matter

    EV owners charge their cars at home an estimated 70–85% of the time. They use public chargers just 10–20% of the time and workplace charging 6–10% of the time.

    This makes sense – home charging is reliable and cheap. But these figures also point to a problem: EV drivers don’t trust public chargers.

    At present, Australia has about 3,700 public chargers nationwide. Each charging station typically supports one or two EVs, often offering different charging speeds. By contrast, there are around 6,600 service stations, with the ability to fuel multiple vehicles at once.


    Other countries have much larger charger networks. The United Kingdom has more than 40,000 and Canada 16,000. China, the world leader, has almost 10 million.

    China now has 10 million EV chargers.
    Tang Yan Song/Shutterstock

    Outside major Australian cities, chargers are harder to find and are often broken or in use. Chargers are usually not staffed, meaning there’s no one watching to prevent vandalism or organise maintenance.

    EV plugs are not yet standardised. Some plugs may not be available, and using chargers isn’t always easy. By contrast, petrol cars use standard nozzles, payment is simpler and staff and CCTV presence discourages vandalism and ensures the pumps work.

    If a petrol car runs out of fuel, the problem can be solved with a lift and a jerry can. But if your EV runs flat in a rural area because you can’t find a charger, you may have to get it towed.

    This lack of reliability is more than just a logistical hurdle — it’s a psychological barrier.

    Psychological roadblocks

    A recent study found the fear of running out of charge was a major psychological barrier to buying an EV – particularly for rural and regional Australians, who drive longer distances. As long as chargers remain unreliable or located too far apart, this anxiety will persist.

    In Australia, it’s easy to find reports of broken chargers, long queues at charging stations, gaps in the rural network and personal anecdotes of EV owners struggling to find a way to charge.

    A 2023 survey found almost 70% of EV owners had come across an inoperable charger at least once over the previous six months.

    What can Australia take from overseas experience?

    Australia’s government wants to increase EV uptake. While EVs are getting cheaper, the supporting infrastructure isn’t good enough yet to make them the norm.

    Across the European Union, chargers are being installed every 60km along major highways and efforts are being made to tackle psychological barriers to uptake.

    Federal and state governments in the United States have invested heavily in filling gaps in the charger network and working with consumers to encourage more sustainable commuting.

    Plug-in hybrids are powered by batteries and an internal combustion engine.
    algre/Shutterstock

    Choosing a hybrid is rational but not ideal

    It should be no surprise more Australians are buying hybrids as a safety net, given there are plenty of service stations and not as many EV chargers. City driving can allow near-total use of the electric motor, while longer trips still require petrol.

    The choice is rational. But it’s not ideal from an environmental point of view. Traditional hybrids are still largely powered by an internal combustion engine, while PHEVs can run as electric for longer but still use their combustion engines.

    While plug-ins have lower emissions than traditional vehicles, they often fail to deliver the full emissions savings drivers and regulators might hope for. Many drivers don’t charge regularly and rely instead on petrol.

    Chargers aren’t the only factor, of course. A tax break for PHEVs boosted their popularity for several years before ending in April, while sales of Tesla EVs have fallen off a cliff due to the unpopularity of owner Elon Musk.

    What needs to change?

    The solutions are straightforward: expand the charger network, especially in regional and rural areas. Improve maintenance schedules and ensure existing chargers are reliable. Make sure data on their availability is accessible in real time so drivers can avoid anxiety and frustration. Counter EV misinformation and anecdotal biases with information campaigns.

    When EV ownership and charging in Australia is practical and low risk, the sluggish EV transition will accelerate. But until then, many drivers will keep buying hybrids as a compromise.

    Ganna Pogrebna does not work for, consult, own shares in or receive funding from any company or organisation that would benefit from this article, and has disclosed no relevant affiliations beyond their academic appointment.

    ref. Range anxiety – or charger drama? Australians are buying hybrid cars because they don’t trust public chargers – https://theconversation.com/range-anxiety-or-charger-drama-australians-are-buying-hybrid-cars-because-they-dont-trust-public-chargers-250281

    MIL OSI AnalysisEveningReport.nz

  • MIL-Evening Report: A looming workforce crisis in NZ tourism and hospitality threatens industry growth plans

    Source: The Conversation (Au and NZ) – By Anthony Brien, Associate Professor, Department of Global Value Chains and Trade, Lincoln University, New Zealand

    Getty Images

    Last week’s big tourism conference in Rotorua saw plenty of optimism about the industry’s potential, but also warnings that airline capacity is hampering post-COVID growth.

    The focus on bringing more foreign tourists to New Zealand is understandable, given the sector accounts for 7.5% of GDP and is our second highest export earner. But there is deeper problem, too. We already struggle to serve current visitor numbers – how will we handle more?

    International tourism injected NZ$16.9 billion into the economy in the year to March 2024. Total tourism expenditure (domestic and international) hit a record $44.4 billion, up nearly 15% from the previous year.

    The government has responded with a $13.5 million global marketing boost, and business leaders are celebrating. The big question is whether we will have the workforce to match the ambition.

    Because right now, the pipeline of skilled, engaged people willing to work, grow and lead in tourism and hospitality isn’t flowing.

    Without an industry-led, well-funded campaign to rebuild the perception of tourism and hospitality as credible, rewarding and sustainable career options, New Zealand has a crisis in the making.

    Who wants to work in tourism and hospo?

    Fewer New Zealanders are choosing tourism and hospitality as a career. With the number of locals studying tourism and hospitality collapsing, both sectors are increasingly dependent on foreign workers.

    Tourism education numbers for the past decade show:

    • 1,355 equivalent full-time students were enrolled in tourism-related courses in 2024, down from 3,750 in 2015 – a 63% drop

    • enrolments in bachelor’s degrees in tourism management fell from 45 in 2015 to 25 in 2024 – a 44% drop

    • postgraduate enrolments in tourism management are down 75%, with only 20 in 2024.

    The figures for hospitality education paint an even grimmer picture:

    • enrolments in hospitality courses fell from from 915 in 2015 to just 250 in 2024 – a 73% drop

    • cookery course enrolments fell from 4,125 to 1,140 – a 72% drop

    • food and beverage service training fell from 1,445 in 2015 to just 340 in 2024 – a 76% drop

    • hospitality management degree enrolments fell from 380 in 2015 to 210 in 2024 – a 45% drop.

    These figures do not include actual workplace training, but they still illustrate a clear trend.

    The looming workforce shortage

    Minister of Tourism and Hospitality Louise Upston recently said, “We need to grow tourism businesses. We need to grow the value from the tourism visitors we have.” She’s right. But without a viable workforce, none of this is possible.

    As to why more New Zealanders aren’t keen to work in the sector, Upston said, “I just don’t think the sector’s promoted it well enough.” This is despite many years of industry exhortations to “grow the domestic workforce”, “attract more young people” and “build career pathways”.

    COVID-19 certainly hurt the industry’s image as a place to work. But the challenges around neglected workforce development, career promotion and long-term planning predate the pandemic.

    Other industries and professions – including construction, agriculture and accounting – have invested heavily in scholarships, internships, mentoring and reputation building. Tourism and hospitality haven’t matched this and now risk losing young people to global demand.

    If the pattern continues, there will be a national shortage of qualified staff and competent managers, and greater reliance on short-term and migrant labour. That leads in turn to overworked staff, poorer service, and businesses forced to reduce hours or close altogether.

    Investment in the future

    In the 1970s and 80s, New Zealand had to import tourism and hospitality talent to grow the industries. Without real change, those days may return.

    Apart from what is offered by two major hotel chains, few formal internships exist. Such programmes are not simply part-time jobs, they’re investments in future talent, involving professional guidance and meaningful experience. They take effort, but they work.

    Meanwhile, degree-level programmes are already being dropped. If lower-level course enrolments continue to fall, these programmes may close too. The burden then falls on businesses to train and educate staff. But those same businesses say they can’t find enough staff today.

    This is more than a workforce problem, it’s a national economic risk. Spending millions on attracting visitors only to deliver a substandard experience is not a good use of taxpayer money.

    Without people, there is no hospitality. Without hospitality, there is no tourism. And without a sustainable tourism industry, New Zealand’s economy will suffer.

    Anthony Brien is a member of Tourism Industry Aotearoa.

    ref. A looming workforce crisis in NZ tourism and hospitality threatens industry growth plans – https://theconversation.com/a-looming-workforce-crisis-in-nz-tourism-and-hospitality-threatens-industry-growth-plans-256212

    MIL OSI AnalysisEveningReport.nz

  • MIL-OSI: Amplify Energy Announces First Quarter 2025 Results, Beta Development Update and Updated Full-Year 2025 Guidance

    Source: GlobeNewswire (MIL-OSI)

    HOUSTON, May 12, 2025 (GLOBE NEWSWIRE) — Amplify Energy Corp. (NYSE: AMPY) (“Amplify,” the “Company,” “us,” or “our”) announced today its operating and financial results for the first quarter of 2025 and updated full-year 2025 guidance for the Company.

    Beta Development Program Update

    • Amplify initiated a development drilling program in the prolific Beta oilfield in 2024 to demonstrate the significant upside potential of the asset and generate strong incremental cash flows for the Company, with results to date proving out the viability and long-term potential of the program
    • Completed the C54 well in mid-April 2025
      • Drilled well utilizing lessons learned from 2024 program including the implementation of a managed pressure drilling system
      • IP20 was approximately 800 Bopd, which has been the strongest initial well performance in the program
      • With the C54 online, the three wells completed in the D-Sand (our primary target formation) are all projected to have greater than 90% IRR at $60/bbl oil prices
    • Completed the C48 well in mid-February 2025 as the first C-Sand completion
      • Initially planned as a D-Sand completion, but due to drilling complications elected to complete the shallower C-Sand
      • Current production rate of approximately 100 BOPD
      • Well exhibits lower oil gravities and reservoir pressures than the D-Sand completions
      • Future injection support in the area to increase reservoir pressure and deliverability is expected to prove the C-Sand as a viable future target zone
    • With the recent completions of the C48 and C54, the field now has four new development wells online, which, after offsetting the asset’s base decline, have increased Beta production by approximately 35% since early 2024
    • Based on Beta development success, at year-end 2024 Amplify had 25 SEC Proved Undeveloped (“PUD”) locations (21 D-Sand locations) with approximately $144 million in PV-10 value1
      • D-Sand completions to date are significantly outperforming the type curve utilized in SEC PUD value/reserves indicating material upside above the current valuation estimate
      • Substantial future development remains at Beta beyond the current SEC PUD locations which are based on conservative volumetric and recovery factor assumptions

    First Quarter Highlights

    • During the first quarter of 2025, the Company:
      • Achieved average total production of 17.9 MBoepd
      • Generated net cash provided by operating activities of $25.5 million and a net loss of $5.9 million
      • Delivered Adjusted EBITDA of $19.4 million and Adjusted Net Income of $3.8 million
      • Generated $6.3 million in net proceeds from the sale of undeveloped Haynesville acreage in East Texas
        • In May 2025, sold additional Haynesville interests generating $1.5 million in proceeds
      • Generated $0.9 million of Adjusted EBITDA at Magnify Energy Services, Amplify’s wholly owned subsidiary (“Magnify”)
      • As of March 31, 2025, Amplify had $125.0 million outstanding under the revolving credit facility
        • Net debt to Last Twelve Months (“LTM”) Adjusted EBITDA of 1.3x2

    (1)   2024 Year End reserves are evaluated at flat pricing: (NYMEX WTI, HH) – $65.00, $4.00

    (2)   Net debt as of March 31, 2025, consisting of $125 MM outstanding under its revolving credit facility with ~$0 MM of cash and cash equivalents, and LTM Adjusted EBITDA as of the first quarter of 2025.

    Martyn Willsher, Amplify’s President and Chief Executive Officer, commented, “Amplify’s strong first quarter operating and financial results continue to demonstrate the significant value derived from the Company’s portfolio of assets. At Beta, we brought online two wells this year, which strengthen our conviction about the prolific untapped value that remains in the reservoir. In East Texas and the Eagle Ford, we anticipate our non-operated development projects will begin producing in the second quarter, with improved natural gas prices driving strong economics for our East Texas wells. Also, in East Texas, we recently monetized a portion of our undeveloped acreage with Haynesville rights in two separate transactions for net proceeds of $7.8 million dollars, while retaining an interest in over 30 gross locations to realize upside value in future periods.”

    Mr. Willsher continued, “In light of recent market volatility and a material reduction in oil prices, we conducted a comprehensive review of our remaining uncommitted 2025 capital budget and have elected to temporarily defer three development projects at Beta resulting in capital savings of approximately $15 million in 2025. While our Beta development projects have strong economics at current oil prices, we have flexibility on the timing of these projects and are committed to maintaining strong free cash flow and a healthy balance sheet for our investors. Our diversified portfolio of mature, low-decline assets and robust hedge book protect our cash flow profile during commodity downturns, allowing us the flexibility to scale up or down investments in either oil or gas projects depending on market conditions.”

    Mr. Willsher concluded, “Going forward, Amplify intends to focus on prudent management of its existing asset base to maximize free cash flow and is conducting a thorough review of additional operating and overhead cost-saving opportunities. The Company will also continue to evaluate portfolio optimization opportunities, which could enable us to accelerate Beta development.”

    Key Financial Results

    During the first quarter of 2025, the Company reported a net loss of approximately $5.9 million. The net loss was primarily attributable to a non-cash unrealized loss on commodity derivatives during the period partially offset by a gain on the sale of East Texas properties. Excluding the impact of the non-cash unrealized loss on commodity derivatives, the East Texas divestiture, and additional other one-time impacts, Amplify generated Adjusted Net Income of $3.8 million in the first quarter of 2025.

    First quarter 2025 Adjusted EBITDA was $19.4 million, a decrease of approximately $2.4 million from the prior quarter. The decrease was primarily due to higher lease operating expense and general and administrative expense that are typically higher in the first quarter offset by stronger gas price realizations compared to the prior quarter.

    Free cash flow was negative $7.2 million for the first quarter, which was in-line with expectations, due to planned capital investments.


      First Quarter Fourth Quarter
    $ in millions  2025   2024 
    Net income (loss) ($5.9 ) ($7.4 )
    Net cash provided by operating activities $25.5   $12.5  
    Average daily production (MBoe/d) 17.9   18.5  
    Total revenues excluding hedges $72.1   $69.0  
    Adjusted EBITDA (a non-GAAP financial measure) $19.4   $21.8  
    Adjusted net income (loss), (a non-GAAP financial measure) $3.8   $5.1  
    Total capital $23.1   $15.3  
    Free Cash Flow (a non-GAAP financial measure) ($7.2 ) $2.9  
         

    Revolving Credit Facility and Liquidity Update

    As of March 31, 2025, Amplify had total debt of $125 million under its revolving credit facility. Net debt to LTM Adjusted EBITDA was 1.3x (net debt as of March 31, 2025). The borrowing base is redetermined on a semi-annual basis with the next redetermination expected in the second quarter of 2025.

    Corporate Production and Pricing

    During the first quarter of 2025, average daily production was approximately 17.9 Mboepd, a decrease of 0.6 Mboepd from the prior quarter. The decrease in production was driven by natural gas and NGL volumes affected by a gas imbalance adjustment in East Texas and adverse weather in Oklahoma, causing widespread power outages. These temporary production issues were factored into the production guidance previously presented for 2025.

    The Company’s product mix for the quarter was 46% crude oil, 16% NGLs, and 38% natural gas.

        Three Months   Three Months
        Ended   Ended
        March 31, 2025   December 31, 2024
             
    Production volumes – MBOE:      
      Bairoil 280     293  
      Beta 315     308  
      Oklahoma 393     436  
      East Texas / North Louisiana 570     609  
      Eagle Ford (Non-op) 49     60  
      Total – MBoe 1,607     1,706  
      Total – MBoe/d 17.9     18.5  
      % – Liquids 62 %   62 %
             

    Total oil, natural gas and NGL revenues for the first quarter of 2025 were approximately $70.3 million, before the impact of derivatives. The Company realized a net gain on commodity derivatives of $0.5 million during the first quarter. Oil, natural gas and NGL revenues, net of realized hedges, decreased $0.4 million for the first quarter compared to the prior quarter.

    The following table sets forth information regarding average realized sales prices for the periods indicated:

      Crude Oil ($/Bbl) NGLs ($/Bbl) Natural Gas ($/Mcf)
      Three Months
    Ended
    March 31,
    2025
      Three Months
    Ended
    December 31,
    2024
      Three Months
    Ended
    March 31,
    2025
      Three Months
    Ended
    December 31,
    2024
      Three Months
    Ended
    March 31,
    2025
      Three Months
    Ended
    December 31,
    2024
                           
    Average sales price exclusive of realized derivatives and certain deductions from revenue $ 67.82   $ 66.82   $ 25.24     $ 23.46     $ 3.87   $ 2.52  
    Realized derivatives   0.49     1.43                 0.04     0.76  
                           
    Average sales price with realized derivatives exclusive of certain deductions from revenue $ 68.31   $ 68.25   $ 25.24     $ 23.46     $ 3.91   $ 3.28  
    Certain deductions from revenue           (1.78 )     (1.37 )     0.02     (0.01 )
                           
    Average sales price inclusive of realized derivatives and certain deductions from revenue $ 68.31   $ 68.25   $ 23.46     $ 22.09     $ 3.93   $ 3.27  
                           

    Costs and Expenses

    Lease operating expenses in the first quarter of 2025 were approximately $37.4 million, or $23.28 per Boe, a $2.3 million increase compared to the prior quarter and in-line with internal projections. Lease operating expenses are expected to decrease in the second half of 2025 after cost savings projects are completed in Bairoil, and fewer expense workovers are conducted later in the year. Lease operating expenses do not reflect $0.9 million of income generated by Magnify in the first quarter.

    Severance and ad valorem taxes in the first quarter were approximately $4.4 million, a decrease of $1.0 million compared to $5.4 million in the prior quarter. Lower production taxes were primarily due to lower production and a one-time benefit from reversing a prior accrual for waste emissions charges. Severance and ad valorem taxes as a percentage of revenue were approximately 6.2% in the first quarter. The Company anticipates that taxes as a percentage of revenue will remain within its previously announced guidance range for 2025.

    Amplify incurred $4.3 million, or $2.67 per Boe, of gathering, processing and transportation expenses in the first quarter, compared to $4.5 million, or $2.62 per Boe, in the prior quarter.

    Cash G&A expenses in the first quarter were $7.3 million, down 7% compared to the first quarter of 2024, and in-line with expectations. The Company anticipates that quarterly cash G&A expenses will be significantly lower throughout the remainder of the year primarily due to annual year-end processes that impact various cost drivers in the first quarter. The Company expects costs to be in line with our previously announced guidance range.

    Depreciation, depletion and amortization expense in the first quarter totaled $8.5 million, or $5.29 per Boe, compared to $8.4 million, or $4.93 per Boe, in the prior quarter.

    Net interest expense was $3.5 million in the first quarter, a decrease of $0.2 million compared to $3.7 million in the prior quarter.

    Amplify recorded minimal current income tax expense for the first quarter of 2025.

    Capital Investment Update

    Cash capital investment during the first quarter of 2025 was approximately $23.1 million. During the first quarter, the Company’s capital allocation was approximately 55% for development drilling, recompletions and facility projects at Beta, and approximately 30% for non-operated development projects in East Texas and the Eagle Ford, with the remainder distributed across the Company’s other assets.

    The following table details Amplify’s capital invested during the first quarter of 2025:

      First Quarter
      2025 Capital
      ($ MM)
    Bairoil $ 1.3
    Beta $ 12.7
    Oklahoma $ 1.4
    East Texas / North Louisiana $ 3.4
    Eagle Ford (Non-op) $ 3.9
    Magnify Energy Services $ 0.3
    Total Capital Invested $ 23.1
       

    2025 Operations & Development Plan

    Amplify has adjusted its 2025 operations and development plan for the current lower commodity price environment. The Company is electing to reduce discretionary development capital at Beta for the second half of 2025, while our previously committed non-operated projects in East Texas and the Eagle Ford are expected to be completed and brought online in the second quarter.

    Amplify’s current plan is to complete three wells at Beta in 2025, including the C48 and C54 wells, which were brought online in mid-February and mid-April, respectively. Amplify intends to drill and complete its next Beta well in the third quarter, which will be a D-Sand completion drilled in the same fault block as the recently completed C54 and the C59, which was completed in October 2024 and is still producing greater than 500 bopd. With the exceptional economics at Beta, Amplify will consider adding back development wells later this year should commodity prices improve.

    Other capital at Beta for 2025 includes $8 million to upgrade a two-mile pipeline that ships all produced fluid from platform Eureka to platform Elly, facility upgrades and capital workovers. Additional information regarding the Beta development plan can be found in the Company’s investor presentation under the investor relations section of the website.

    In East Texas, we are participating in the completion of four non-operated development projects, which we expect to be online in late second quarter. Operators in the area are taking advantage of strong natural gas prices and favorable economics, and the Company anticipates more activity in this area. For the Company’s operated assets, the team is focused on prudent management of the field, such as optimizing field compression, artificial lift enhancement, and equipment insourcing, which is expected to improve the production profile and lower lease operating costs.

    Also in East Texas, as previously announced, Amplify sold 90% of its interest in certain units with Haynesville rights in Harrison County, Texas, in addition to 11 gross operated wells, and purchased a 10% interest in adjacent acreage, generating $6.3 million in net proceeds from the sale. This transaction also established an area of mutual interest (“AMI”) with the counterparty covering 10,000 gross acres. We estimate the AMI has more than 30 potential gross drilling locations.

    In May 2025, Amplify completed a separate transaction, which monetized 90% of its interests in three additional units with Haynesville rights in Panola and Shelby Counties, finalizing a separate AMI consisting of seven total units. Amplify also retained a 10% working interest with the ability to participate in any well drilled within the boundary of the AMI. Upon closing the transaction, Amplify generated approximately $1.5 million in proceeds.

    From November 2024 to present, Amplify has generated proceeds of $9.2 million related to Haynesville acreage transactions, while retaining a 10% working interest in two newly created AMIs in the Haynesville play of East Texas.

    In the Eagle Ford, we are participating in 14 gross (0.7 net) new development wells and two gross (0.4 net) recompletion projects. These non-operated wells, with highly accretive forecasted returns, have been completed and are scheduled to come online in early May. The Company is also evaluating additional development opportunities recently offered by our partners in fields where we have interests.

    Updated Full-Year 2025 Guidance

    Based on recent reductions to crude oil prices, Amplify has decided to modify its capital plans in order to maintain positive free cash flow in 2025. As a result of these modifications, we are providing updated guidance. The following guidance is subject to the cautionary statements and limitations described under the “Forward-Looking Statements” caption at the end of this press release. Amplify’s updated 2025 guidance is based on its current expectations regarding capital investment and full-year 2025 commodity prices for crude oil of $61.75/Bbl (WTI) and natural gas of $3.60/MMBtu (Henry Hub), and on the assumption that market demand and prices for oil and natural gas will continue at levels that allow for economic production of these products. Additionally, the Company expects to invest approximately 95% of its capital in the first three quarters of the year primarily in connection with the Beta development program and for non-operated development projects in East Texas and the Eagle Ford.

    A summary of the guidance is presented below:

      March 5, 2025
      March 7, 2025
      Previous Guidance   Updated Guidance
                   
      FY 2025E   FY 2025E
                   
      Low   High   Low   High
                   
    Net Average Daily Production              
    Oil (MBbls/d) 8.5 9.4   8.3 8.9
    NGL (MBbls/d) 3.0 3.3   3.0 3.3
    Natural Gas (MMcf/d) 45.0 51.0   45.0 50.0
    Total (MBoe/d) 19.0 21.0   19.0 20.5
                   
    Commodity Price Differential / Realizations (Unhedged)              
    Oil Differential ($ / Bbl) ($3.25) ($4.25)   ($3.25) ($4.25)
    NGL Realized Price (% of WTI NYMEX) 27% 31%   27% 31%
    Natural Gas Realized Price (% of Henry Hub) 85% 92%   85% 92%
                   
    Other Revenue              
    Magnify Energy Services ($ MM) $4 $6   $4 $6
    Other ($ MM) $2 $3   $2 $3
    Total ($ MM) $6 $9   $6 $9
                   
    Gathering, Processing and Transportation Costs              
    Oil ($ / Bbl) $0.65 $0.85   $0.65 $0.85
    NGL ($ / Bbl) $2.75 $4.00   $2.75 $4.00
    Natural Gas ($ / Mcf) $0.55 $0.75   $0.55 $0.75
    Total ($ / Boe) $2.25 $2.85   $2.25 $2.85
                   
    Average Costs              
    Lease Operating ($ / Boe) $18.50 $20.50   $18.50 $20.50
    Taxes (% of Revenue) (1) 6.0% 7.0%   6.0% 7.0%
    Cash General and Administrative ($ / Boe) (2)(3) $3.40 $3.90   $3.40 $3.90
                   
    Adjusted EBITDA ($ MM) (2)(3) $100 $120   $80 $110
    Cash Interest Expense ($ MM) $12 $18   $12 $18
    Capital Investment ($ MM) $70 $80   $55 $70
    Free Cash Flow ($ MM) (2)(3) $10 $30   $10 $20
                   

    (1) Includes production, ad valorem and franchise taxes
    (2) Refer to “Use of Non-GAAP Financial Measures” for Amplify’s definition and use of cash G&A, Adjusted EBITDA and free cash flow, non-GAAP measures (cash income taxes, which are not included in free cash flow, are expected to range between $0 – $1 million for the year)
    (3) Amplify believes that a quantitative reconciliation of such forward-looking information to the most comparable financial measure calculated and presented in accordance with GAAP cannot be made available without unreasonable efforts. A reconciliation of these non-GAAP financial measures would require Amplify to predict the timing and likelihood of future transactions and other items that are difficult to accurately predict. Neither of these forward-looking measures, nor their probable significance, can be quantified with a reasonable degree of accuracy. Accordingly, a reconciliation of the most directly comparable forward-looking GAAP measures is not provided.

    Hedging

    Amplify maintains a robust hedge book to support its cash flow profile and provide downside protection in weak commodity environments. Recently, the Company added to its hedge position, further protecting future cash flows.

    Amplify executed crude oil swaps covering the first half of 2026 at a weighted average price of $62.55 per barrel and the first half of 2027 with a weighted average price of $61.93 per barrel. The Company also added natural gas swaps covering 2026 at a weighted average price of $4.12 per MMBtu, collars for the first quarter of 2026 with a weighted average floor of $4.50 per MMBtu and a weighted average ceiling of $5.73 and natural gas collars for 2027 with a weighted average floor of $3.57 per MMBtu and a weighted average ceiling of $4.58 per MMBtu.

    The following table reflects the hedged volumes under Amplify’s commodity derivative contracts and the average fixed floor and ceiling prices at which production is hedged for April 2025 through December 2027, as of May 12, 2025:

      2025   2026   2027
               
    Natural Gas Swaps:          
    Average Monthly Volume (MMBtu)   560,000     515,000     137,500
    Weighted Average Fixed Price ($) $ 3.75   $ 3.80   $ 4.01
               
    Natural Gas Collars:          
    Two-way collars          
    Average Monthly Volume (MMBtu)   500,000     517,500     437,500
    Weighted Average Ceiling Price ($) $ 3.90   $ 4.11   $ 4.21
    Weighted Average Floor Price ($) $ 3.50   $ 3.58   $ 3.56
               
    Oil Swaps:          
    Average Monthly Volume (Bbls)   141,444     125,500     30,667
    Weighted Average Fixed Price ($) $ 70.61   $ 66.40   $ 61.93
               
    Oil Collars:          
    Two-way collars          
    Average Monthly Volume (Bbls)   45,333        
    Weighted Average Ceiling Price ($) $ 80.20        
    Weighted Average Floor Price ($) $ 70.00        
               

    Amplify has posted an updated investor presentation containing additional hedging information on its website, www.amplifyenergy.com, under the Investor Relations section.

    Quarterly Report on Form 10-Q

    Amplify’s financial statements and related footnotes will be available in its Quarterly Report on Form 10-Q for the quarter ended March 31, 2025, which Amplify expects to file with the SEC on May 12, 2025.

    About Amplify Energy

    Amplify Energy Corp. is an independent oil and natural gas company engaged in the acquisition, development, exploitation and production of oil and natural gas properties. Amplify’s operations are focused in Oklahoma, the Rockies (Bairoil), federal waters offshore Southern California (Beta), East Texas / North Louisiana, and the Eagle Ford (Non-op). For more information, visit www.amplifyenergy.com.

    Conference Call

    Amplify will host an investor teleconference tomorrow at 10 a.m. Central Time to discuss these operating and financial results. Interested parties may join the call by dialing (888) 999-3182 at least 15 minutes before the call begins and providing the Conference ID: AEC1Q25. A telephonic replay will be available for fourteen days following the call by dialing (800) 654-1563 and providing the Access Code: 52458798. A transcript and a recorded replay of the call will also be available on our website after the call.

    Forward-Looking Statements

    This press release includes “forward-looking statements” within the meaning of Section 27A of the Securities Act of 1933, as amended, and Section 21E of the Securities Exchange Act of 1934, as amended. All statements, other than statements of historical fact, included in this press release that address activities, events or developments that the Company expects, believes or anticipates will or may occur in the future are forward-looking statements. Terminology such as “may,” “will,” “would,” “should,” “expect,” “plan,” “project,” “intend,” “anticipate,” “believe,” “estimate,” “predict,” “potential,” “pursue,” “target,” “outlook,” “continue,” the negative of such terms or other comparable terminology are intended to identify forward-looking statements. These statements include, but are not limited to, statements about the Company’s expectations of plans, goals, strategies (including measures to implement strategies), objectives and anticipated results with respect thereto. These statements address activities, events or developments that we expect or anticipate will or may occur in the future, including things such as projections of results of operations, plans for growth, goals, future capital expenditures, competitive strengths, references to future intentions and other such references. These forward-looking statements involve risks and uncertainties and other factors that could cause the Company’s actual results or financial condition to differ materially from those expressed or implied by forward-looking statements. These include risks and uncertainties relating to, among other things: the Company’s evaluation and implementation of strategic alternatives; risks related to the redetermination of the borrowing base under the Company’s revolving credit facility; the Company’s ability to satisfy debt obligations; the Company’s need to make accretive acquisitions or substantial capital expenditures to maintain its declining asset base, including the existence of unanticipated liabilities or problems relating to acquired or divested business or properties; volatility in the prices for oil, natural gas and NGLs; the Company’s ability to access funds on acceptable terms, if at all, because of the terms and conditions governing the Company’s indebtedness, including financial covenants; general political and economic conditions, globally and in the jurisdictions in which we operate, including the Russian invasion of Ukraine, and ongoing conflicts in the Middle East, trade wars and the potential destabilizing effect such conflicts may pose for the global oil and natural gas markets; expectations regarding general economic conditions, including inflation; and the impact of local, state and federal governmental regulations, including those related to climate change and hydraulic fracturing, and potential changes in these regulations. Please read the Company’s filings with the SEC, including “Risk Factors” in the Company’s Annual Report on Form 10-K, and if applicable, the Company’s Quarterly Reports on Form 10-Q and Current Reports on Form 8-K, which are available on the Company’s Investor Relations website at https://www.amplifyenergy.com/investor-relations/sec-filings/default.aspx or on the SEC’s website at http://www.sec.gov, for a discussion of risks and uncertainties that could cause actual results to differ from those in such forward-looking statements. You are cautioned not to place undue reliance on these forward-looking statements, which speak only as of the date of this press release. All forward-looking statements in this press release are qualified in their entirety by these cautionary statements. Except as required by law, the Company undertakes no obligation and does not intend to update or revise any forward-looking statements, whether as a result of new information, future results or otherwise.

    Use of Non-GAAP Financial Measures

    This press release and accompanying schedules include the non-GAAP financial measures of Adjusted EBITDA, Adjusted Net Income (Loss), free cash flow, net debt, PV-10 and cash G&A. The accompanying schedules provide a reconciliation of these non-GAAP financial measures to their most directly comparable financial measures calculated and presented in accordance with GAAP. Amplify’s non-GAAP financial measures should not be considered as alternatives to GAAP measures such as net income, operating income, net cash flows provided by operating activities, standardized measure of discounted future net cash flows, or any other measure of financial performance calculated and presented in accordance with GAAP. Amplify’s non-GAAP financial measures may not be comparable to similarly titled measures of other companies because they may not calculate such measures in the same manner as Amplify does.

    Adjusted EBITDA. Amplify defines Adjusted EBITDA as net income (loss) plus Interest expense, net; Income tax expense (benefit); DD&A; Accretion of AROs; Loss or (gain) on commodity derivative instruments; Cash settlements received or (paid) on expired commodity derivative instruments; Amortization of gain associated with terminated commodity derivatives; Losses or (gains) on sale of properties; Share-based compensation expenses; Exploration costs; Acquisition and divestiture related costs; Loss on settlement of AROs; Bad debt expense; and Pipeline incident loss. Adjusted EBITDA is commonly used as a supplemental financial measure by management and external users of Amplify’s financial statements, such as investors, research analysts and rating agencies, to assess: (1) its operating performance as compared to other companies in Amplify’s industry without regard to financing methods, capital structures or historical cost basis; (2) the ability of its assets to generate cash sufficient to pay interest and support Amplify’s indebtedness; and (3) the viability of projects and the overall rates of return on alternative investment opportunities. Since Adjusted EBITDA excludes some, but not all, items that affect net income or loss and because these measures may vary among other companies, the Adjusted EBITDA data presented in this press release may not be comparable to similarly titled measures of other companies. The GAAP measures most directly comparable to Adjusted EBITDA are net income and net cash provided by operating activities.

    Adjusted Net Income (Loss). Amplify defines Adjusted Net Income (Loss) as net income (loss) adjusted for unrealized loss (gain) on commodity derivative instruments, acquisition and divestiture-related expenses, unusual and infrequent items, and the income tax expense or benefit of these adjustments using our federal statutory tax rate. Adjusted Net Income (Loss) excludes the impact of unusual and infrequent items affecting earnings that vary widely and unpredictably. This measure is not meant to disassociate these items from management’s performance but rather is intended to provide helpful information to investors interested in comparing our performance between periods. Adjusted Net Income (Loss) is not considered to be an alternative to net income (loss) reported in accordance with GAAP.

    Free cash flow. Amplify defines free cash flow as Adjusted EBITDA, less cash interest expense and capital expenditures. Free cash flow is an important non-GAAP financial measure for Amplify’s investors since it serves as an indicator of the Company’s success in providing a cash return on investment. The GAAP measures most directly comparable to free cash flow are net income and net cash provided by operating activities.

    Net debt. Amplify defines net debt as the total principal amount drawn on the revolving credit facility less cash and cash equivalents. The Company uses net debt as a measure of financial position and believes this measure provides useful additional information to investors to evaluate the Company’s capital structure and financial leverage.

    PV-10. PV-10 is a non-GAAP financial measure that represents the present value of estimated future cash inflows from proved oil and natural gas reserves that are calculated using the unweighted arithmetic average first-day-of-the-month prices for the prior 12 months, less future development and operating costs, discounted at 10% per annum to reflect the timing of future cash flows. The most directly comparable GAAP measure to PV-10 is standardized measure. PV-10 differs from standardized measure in its treatment of estimated future income taxes, which are excluded from PV-10. Amplify believes the presentation of PV-10 provides useful information because it is widely used by investors in evaluating oil and natural gas companies without regard to specific income tax characteristics of such entities. PV-10 is not intended to represent the current market value of our estimated proved reserves. PV-10 should not be considered in isolation or as a substitute for the standardized measure as defined under GAAP. As GAAP does not prescribe a comparable GAAP measure for PV-10 of reserves adjusted for pricing sensitives, it is not practicable for us to reconcile PV-10 to a standardized measure or any other GAAP measure.

    Cash G&A. Amplify defines cash G&A as general and administrative expense, less share-based compensation expense; acquisition and divestiture costs; bad debt expense; and severance payments. Cash G&A is an important non-GAAP financial measure for Amplify’s investors since it allows for analysis of G&A spend without regard to share-based compensation and other non-recurring expenses which can vary substantially from company to company. The GAAP measures most directly comparable to cash G&A is total G&A expenses.

    Contacts

    Jim Frew — Senior Vice President and Chief Financial Officer
    (832) 219-9044
    jim.frew@amplifyenergy.com

    Michael Jordan — Director, Finance and Treasurer
    (832) 219-9051
    michael.jordan@amplifyenergy.com

    Selected Operating and Financial Data (Tables)

    Amplify Energy Corp.      
    Selected Financial Data – Unaudited      
    Statements of Operations Data      
             
        Three Months   Three Months
        Ended   Ended
    (Amounts in $000s, except per share data) March 31, 2025   December 31, 2024
             
    Revenues:      
      Oil and natural gas sales $ 70,341     $ 67,189  
      Other revenues   1,709       1,832  
      Total revenues   72,050       69,021  
             
    Costs and Expenses:      
      Lease operating expense   37,417       35,100  
      Pipeline incident loss   396       2,405  
      Gathering, processing and transportation   4,286       4,468  
      Exploration   6       10  
      Taxes other than income   4,384       5,356  
      Depreciation, depletion and amortization   8,494       8,418  
      General and administrative expense   10,815       9,486  
      Accretion of asset retirement obligations   2,183       2,156  
      Realized (gain) loss on commodity derivatives   (503 )     (4,052 )
      Unrealized (gain) loss on commodity derivatives   14,820       13,357  
      (Gain) loss on sale of properties   (6,251 )     (1,367 )
      Other, net   (3 )     334  
      Total costs and expenses   76,044       75,671  
             
    Operating Income (loss)   (3,994 )     (6,650 )
             
    Other Income (Expense):      
      Interest expense, net   (3,519 )     (3,684 )
      Other income (expense)   115       (113 )
      Total other income (expense)   (3,404 )     (3,797 )
             
      Income (loss) before reorganization items, net and income taxes   (7,398 )     (10,447 )
             
    Income tax benefit (expense) – current   (1 )     2,132  
    Income tax benefit (expense) – deferred   1,538       886  
             
      Net income (loss) $ (5,861 )   $ (7,429 )
             
    Earnings per share:      
      Basic and diluted earnings (loss) per share $ (0.15 )   $ (0.19 )
             
    Selected Financial Data – Unaudited      
    Operating Statistics      
               
          Three Months   Three Months
          Ended   Ended
    (Amounts in $000s, except per unit data) March 31, 2025   December 31, 2024
               
    Oil and natural gas revenue:      
      Oil Sales $ 49,982   $ 50,817
      NGL Sales   6,157     6,602
      Natural Gas Sales   14,202     9,770
      Total oil and natural gas sales – Unhedged $ 70,341   $ 67,189
               
    Production volumes:      
      Oil Sales – MBbls   737     760
      NGL Sales – MBbls   263     299
      Natural Gas Sales – MMcf   3,647     3,883
      Total – MBoe   1,607     1,706
      Total – MBoe/d   17.9     18.5
               
    Average sales price (excluding commodity derivatives):      
      Oil – per Bbl $ 67.82   $ 66.82
      NGL – per Bbl $ 23.46   $ 22.09
      Natural gas – per Mcf $ 3.89   $ 2.52
      Total – per Boe $ 43.76   $ 39.37
               
    Average unit costs per Boe:      
      Lease operating expense $ 23.28   $ 20.57
      Gathering, processing and transportation $ 2.67   $ 2.62
      Taxes other than income $ 2.73   $ 3.14
      General and administrative expense $ 6.73   $ 5.56
      Realized gain/(loss) on commodity derivatives $ 0.31   $ 2.38
      Depletion, depreciation, and amortization $ 5.29   $ 4.93
               
    Selected Financial Data – Unaudited      
    Asset Operating Statistics      
             
        Three Months   Three Months
        Ended   Ended
        March 31, 2025   December 31, 2024
             
    Production volumes – MBOE:      
      Bairoil   280       293  
      Beta   315       308  
      Oklahoma   393       436  
      East Texas / North Louisiana   570       609  
      Eagle Ford (Non-op)   49       60  
      Total – MBoe   1,607       1,706  
      Total – MBoe/d   17.9       18.5  
      % – Liquids   62 %     62 %
             
    Lease operating expense – $M:      
      Bairoil $ 13,732     $ 11,800  
      Beta   13,305       12,113  
      Oklahoma   3,856       3,948  
      East Texas / North Louisiana   4,981       5,887  
      Eagle Ford (Non-op)   1,542       1,351  
      Total Lease operating expense: $ 37,416     $ 35,099  
             
    Capital expenditures – $M:      
      Bairoil $ 1,322     $ 190  
      Beta   12,733       10,001  
      Oklahoma   1,445       168  
      East Texas / North Louisiana   3,449       2,758  
      Eagle Ford (Non-op)   3,905       2,125  
      Magnify Energy Services   263       82  
      Total Capital expenditures: $ 23,117     $ 15,324  
             
    Selected Financial Data – Unaudited              
    Balance Sheet Data              
                       
    (Amounts in $000s) March 31, 2025
      December 31, 2024
                       
    Assets              
      Cash and Cash Equivalents $     $  
      Accounts Receivable   35,893       39,713  
      Other Current Assets   24,296       32,064  
        Total Current Assets $ 60,189     $ 71,777  
                       
      Net Oil and Gas Properties $ 400,770     $ 386,218  
      Other Long-Term Assets   292,680       289,081  
        Total Assets $ 753,639     $ 747,076  
                       
    Liabilities              
      Accounts Payable $ 19,863     $ 13,231  
      Accrued Liabilities   40,343       43,413  
      Other Current Liabilities   18,658       11,494  
        Total Current Liabilities $ 78,864     $ 68,138  
                       
      Long-Term Debt $ 125,000     $ 127,000  
      Asset Retirement Obligation   131,158       129,700  
      Other Long-Term Liabilities   15,680       13,326  
        Total Liabilities $ 350,702     $ 338,164  
                       
    Shareholders’ Equity              
      Common Stock & APIC $ 440,266     $ 440,380  
      Accumulated Earnings (Deficit)   (37,329 )     (31,468 )
        Total Shareholders’ Equity $ 402,937     $ 408,912  
                       
    Selected Financial Data – Unaudited      
    Statements of Cash Flows Data      
           
      Three Months   Three Months
      Ended   Ended
    (Amounts in $000s) March 31, 2025   December 31, 2024
           
           
    Net cash provided by (used in) operating activities $ 25,501     $ 12,455  
    Net cash provided by (used in) investing activities   (21,497 )     (19,379 )
    Net cash provided by (used in) financing activities   (4,004 )     6,924  
           
    Selected Operating and Financial Data (Tables)      
    Reconciliation of Unaudited GAAP Financial Measures to Non-GAAP Financial Measures    
    Adjusted EBITDA and Free Cash Flow      
             
        Three Months   Three Months
        Ended   Ended
    (Amounts in $000s) March 31, 2025   December 31, 2024
             
    Reconciliation of Adjusted EBITDA to Net Cash Provided from Operating Activities:    
      Net cash provided by operating activities $ 25,501     $ 12,455  
      Changes in working capital   (5,372 )     4,770  
      Interest expense, net   3,519       3,684  
      Amortization of gain associated with terminated commodity derivatives   159       159  
      Amortization and write-off of deferred financing fees   (315 )     (315 )
      Exploration costs   6       10  
      Acquisition and divestiture related costs   1,629       1,424  
      Plugging and abandonment cost   171       754  
      Current income tax expense (benefit)   1       (2,132 )
      Pipeline incident loss   396       2,405  
      (Gain) loss on sale of properties   (6,251 )     (1,367 )
    Adjusted EBITDA: $ 19,444     $ 21,847  
             
    Reconciliation of Free Cash Flow to Net Cash Provided from Operating Activities:    
    Adjusted EBITDA: $ 19,444     $ 21,847  
      Less: Cash interest expense   3,545       3,598  
      Less: Capital expenditures   23,117       15,324  
    Free Cash Flow: $ (7,218 )   $ 2,925  
             
    Selected Operating and Financial Data (Tables)      
    Reconciliation of Unaudited GAAP Financial Measures to Non-GAAP Financial Measures    
    Adjusted EBITDA and Free Cash Flow      
             
        Three Months   Three Months
        Ended   Ended
    (Amounts in $000s) March 31, 2025   December 31, 2024
             
    Reconciliation of Adjusted EBITDA to Net Income (Loss):      
      Net income (loss) $ (5,861 )   $ (7,429 )
      Interest expense, net   3,519       3,684  
      Income tax expense (benefit) – current   1       (2,132 )
      Income tax expense (benefit) – deferred   (1,538 )     (886 )
      Depreciation, depletion and amortization   8,494       8,418  
      Accretion of asset retirement obligations   2,183       2,156  
      (Gains) losses on commodity derivatives   14,317       9,305  
      Cash settlements received (paid) on expired commodity derivative instruments   503       4,052  
      Amortization of gain associated with terminated commodity derivatives   159       159  
      Acquisition and divestiture related costs   1,629       1,424  
      Share-based compensation expense   1,890       1,686  
      (Gain) loss on sale of properties   (6,251 )     (1,367 )
      Exploration costs   6       10  
      Loss on settlement of AROs   (3 )     334  
      Bad debt expense         28  
      Pipeline incident loss   396       2,405  
    Adjusted EBITDA: $ 19,444     $ 21,847  
             
      Reconciliation of Free Cash Flow to Net Income (Loss):      
      Adjusted EBITDA: $ 19,444     $ 21,847  
      Less: Cash interest expense   3,545       3,598  
      Less: Capital expenditures   23,117       15,324  
      Free Cash Flow: $ (7,218 )   $ 2,925  
             
    Selected Operating and Financial Data (Tables)      
    Reconciliation of Unaudited GAAP Financial Measures to Non-GAAP Financial Measures    
    Net Income (Loss) to Adjusted Net Income (Loss)      
               
          Three Months   Three Months
          Ended   Ended
    (Amounts in $000s, except per share data) March 31, 2025   December 31, 2024
               
    Reconciliation of Adjusted Net Income (Loss):      
      Net income (loss) $ (5,861 )   $ (7,429 )
      Unrealized (gain) loss on commodity derivatives   14,820       13,357  
      Acquisition and divestiture related costs   1,629       1,424  
      Non-recurring costs:      
        Income tax expense (benefit) – deferred   (1,538 )     (886 )
        Gain on sale of properties   (6,251 )     (1,367 )
      Tax effect of adjustments   971       (12 )
        Adjusted net income (loss) $ 3,770     $ 5,087  
               
    Selected Operating and Financial Data (Tables)          
    Reconciliation of Unaudited GAAP Financial Measures to Non-GAAP Financial Measures      
    Cash General and Administrative Expenses          
               
      Three Months   Three Months
      Ended   Ended
    (Amounts in $000s) March 31, 2025   December 31, 2024
               
    General and administrative expense $ 10,815   $ 9,486
    Less: Share-based compensation expense   1,890     1,686
    Less: Acquisition and divestiture costs   1,629     1,424
    Less: Bad debt expense       28
    Less: Severance payments      
    Total Cash General and Administrative Expense $ 7,296   $ 6,348
               

    The MIL Network

  • MIL-OSI Europe: Text adopted – Ninth report on economic and social cohesion – P10_TA(2025)0098 – Thursday, 8 May 2025 – Strasbourg

    Source: European Parliament

    The European Parliament,

    –  having regard to Articles 2 and 3 of the Treaty on European Union,

    –  having regard to Articles 4, 162, 174 to 178, and 349 of the Treaty on the Functioning of the European Union (TFEU),

    –  having regard to Regulation (EU) 2021/1060 of the European Parliament and of the Council of 24 June 2021 laying down common provisions on the European Regional Development Fund, the European Social Fund Plus, the Cohesion Fund, the Just Transition Fund and the European Maritime, Fisheries and Aquaculture Fund and financial rules for those and for the Asylum, Migration and Integration Fund, the Internal Security Fund and the Instrument for Financial Support for Border Management and Visa Policy(1) (Common Provisions Regulation),

    –  having regard to Regulation (EU) 2021/1058 of the European Parliament and of the Council of 24 June 2021 on the European Regional Development Fund and on the Cohesion Fund(2),

    –  having regard to Regulation (EU) 2021/1059 of the European Parliament and of the Council of 24 June 2021 on specific provisions for the European territorial cooperation goal (Interreg) supported by the European Regional Development Fund and external financing instruments(3),

    –  having regard to Regulation (EU) 2021/1057 of the European Parliament and of the Council of 24 June 2021 establishing the European Social Fund Plus (ESF+) and repealing Regulation (EU) No 1296/2013(4),

    –  having regard to Regulation (EU) 2021/1056 of the European Parliament and of the Council of 24 June 2021 establishing the Just Transition Fund(5),

    –  having regard to Regulation (EU) 2021/2115 of the European Parliament and of the Council of 2 December 2021 establishing rules on support for strategic plans to be drawn up by Member States under the common agricultural policy (CAP Strategic Plans) and financed by the European Agricultural Guarantee Fund (EAGF) and by the European Agricultural Fund for Rural Development (EAFRD) and repealing Regulations (EU) No 1305/2013 and (EU) No 1307/2013(6),

    –  having regard to Regulation (EU) 2020/460 of the European Parliament and of the Council of 30 March 2020 amending Regulations (EU) No 1301/2013, (EU) No 1303/2013 and (EU) No 508/2014 as regards specific measures to mobilise investments in the healthcare systems of Member States and in other sectors of their economies in response to the COVID-19 outbreak (Coronavirus Response Investment Initiative)(7),

    –  having regard to Regulation (EU) 2020/558 of the European Parliament and of the Council of 23 April 2020 amending Regulations (EU) No 1301/2013 and (EU) No 1303/2013 as regards specific measures to provide exceptional flexibility for the use of the European Structural and Investments Funds in response to the COVID-19 outbreak(8),

    –  having regard to Regulation (EU) 2020/461 of the European Parliament and of the Council of 30 March 2020 amending Council Regulation (EC) No 2012/2002 in order to provide financial assistance to Member States and to countries negotiating their accession to the Union that are seriously affected by a major public health emergency(9),

    –  having regard to Regulation (EU) 2020/2221 of the European Parliament and of the Council of 23 December 2020 amending Regulation (EU) No 1303/2013 as regards additional resources and implementing arrangements to provide assistance for fostering crisis repair in the context of the COVID-19 pandemic and its social consequences and for preparing a green, digital and resilient recovery of the economy (REACT-EU)(10),

    –  having regard to Regulation (EU) 2022/562 of the European Parliament and of the Council of 6 April 2022 amending Regulations (EU) No 1303/2013 and (EU) No 223/2014 as regards Cohesion’s Action for Refugees in Europe (CARE)(11),

    –  having regard to Regulation (EU) 2022/2039 of the European Parliament and of the Council of 19 October 2022 amending Regulations (EU) No 1303/2013 and (EU) 2021/1060 as regards additional flexibility to address the consequences of the military aggression of the Russian Federation FAST (Flexible Assistance for Territories) – CARE(12),

    –  having regard to the URBACT programme for sustainable urban cooperation, established in 2002,

    –  having regard to the Urban Agenda for the EU of 30 May 2016,

    –  having regard to the Territorial Agenda 2030 of 1 December 2020,

    –  having regard to the 9th Cohesion Report, published by the Commission on 27 March 2024(13), and the Commission communication of 27 March 2024 on the 9th Cohesion Report (COM(2024)0149),

    –  having regard to the study entitled ‘The future of EU cohesion: Scenarios and their impacts on regional inequalities’, published by the European Parliamentary Research Service in December 2024,

    –  having regard to the Commission report of February 2024 entitled ‘Forging a sustainable future together – Cohesion for a competitive and inclusive Europe’(14),

    –  having regard to the opinion of the European Economic and Social Committee of 31 May 2024 on the 9th Cohesion Report(15),

    –  having regard to the opinion of the Committee of the Regions of 21 November 2024 entitled ‘A renewed Cohesion Policy post 2027 that leaves no one behind – CoR responses to the 9th Cohesion Report and the Report of the Group of High-Level Specialists on the Future of Cohesion Policy’,

    –  having regard to the report entitled ‘The future of European competitiveness – A competitiveness strategy for Europe’, published by the Commission on 9 September 2024,

    –  having regard to the agreement adopted at the 21st Conference of the Parties to the UN Framework Convention on Climate Change (COP21) in Paris on 12 December 2015 (the Paris Agreement),

    –  having regard to the study entitled ‘Streamlining EU Cohesion Funds: addressing administrative burdens and redundancy’, published by its Directorate-General for Internal Policies of the Union in November 2024(16),

    –  having regard to a Regulation of the European Parliament and of the Council of 7 May 2025 on the Border Regions’ Instrument for Development and Growth in the EU (BRIDGEforEU)(17),

    –  having regard to the Commission communication of 3 May 2022 entitled ‘Putting people first, securing sustainable and inclusive growth, unlocking the potential of the EU’s outermost regions’ (COM(2022)0198),

    –  having regard to the opinion in the form of a letter from the Committee on Agriculture and Rural Development(18),

    –  having regard to its resolution of 25 March 2021 on cohesion policy and regional environment strategies in the fight against climate change(19),

    –  having regard to its resolution of 20 May 2021 on reversing demographic trends in EU regions using cohesion policy instruments(20),

    –  having regard to its resolution of 14 September 2021 entitled ‘Towards a stronger partnership with the EU outermost regions(21),

    –  having regard to its resolution of 15 September 2022 on economic, social and territorial cohesion in the EU: the 8th Cohesion Report(22),

    –  having regard to its resolution of 21 November 2023 on possibilities to increase the reliability of audits and controls by national authorities in shared management(23),

    –  having regard to its resolution of 23 November 2023 on harnessing talent in Europe’s regions(24),

    –  having regard to its resolution of 14 March 2024 entitled ‘Cohesion policy 2014-2020 – implementation and outcomes in the Member States(25),

    –  having regard to Rule 55 of its Rules of Procedure,

    –  having regard to the report of the Committee on Regional Development (A10-0066/2025),

    A.  whereas cohesion policy is at the heart of EU policies and is the EU’s main tool for investments in sustainable economic, social and territorial development, and contributing to the Green Deal objectives, across the EU under its multiannual financial frameworks for the periods of 2014-2020 and 2021-2027; whereas cohesion policy, as mandated by the Treaties, is fundamental for a well-functioning and thriving internal market by promoting the development of all regions in the EU, and especially the less developed ones;

    B.  whereas cohesion policy has fostered economic, social and territorial convergence in the EU, notably by increasing the gross domestic products, for example, of central and eastern EU Member States, which went from 43 % of the EU average in 1995 to around 80 % in 2023; whereas the 9th Cohesion Report highlights that, by the end of 2022, cohesion policy supported over 4,4 million businesses, creating more than 370 000 jobs in these companies; whereas it also underlines that cohesion policy generates a significant return on investment, and that each euro invested in the 2014–2020 and 2021–2027 programmes will have generated 1,3 euros of additional GDP in the Union by 2030; whereas cohesion policy constituted, on average, around 13 % of total public investment in the EU(26);

    C.  whereas the Commission report entitled ‘The long-term vision for the EU’s rural areas: key achievements and ways forward’, presented alongside the ninth Cohesion Report, underlines that EUR 24,6 billion, or 8 % of the rural development pillar of the common agricultural policy, is directed towards investments in rural areas beyond farming investments, setting the scene for a debate on the future of rural areas;

    D.  whereas between 2021 and 2027, cohesion policy will have invested over EUR 140 billion in the green and digital transitions(27), to help improve networks and infrastructure, support nature conservation, improve green and digital skills and foster job creation and services for the public;

    E.  whereas despite the widely acknowledged and proven positive impact of cohesion policy on social, economic and territorial convergence, significant challenges remain, marked notably by development disparities at sub-national level, within regions and in regions caught in a development trap, and by the impact of climate change, in terms of demography, the digital and green transitions, and connectivity, but also in terms of sustainable economic development, in particular in least developed regions and rural and remote areas;

    F.  whereas cohesion policy and sectoral programmes of the EU have repeatedly and efficiently helped regions to respond effectively to emergencies and asymmetric shocks such as the COVID-19 crisis, Brexit, the energy crisis and the refugee crisis caused by Russia’s invasion of Ukraine, as well as natural disasters, even though it is a long-term, structural policy and not a crisis management instrument or the ‘go-to’ emergency response funding mechanism; whereas such crises have delayed the implementation of the European Structural and Investment Funds and whereas a considerable number of projects financed with Recovery and Resilience Facility (RRF) funds have been taken for the most part from projects that had been slated for investment under cohesion policy;

    G.  whereas despite measures already taken for the 2014-2020 and 2021-2027 periods, the regulatory framework governing the use and administration of cohesion policy instruments and funds should be further simplified and interoperable digital tools better used and developed, including the establishment of one-stop digitalised service centres, with the objective of streamlining procedures, enhancing stakeholder trust, reducing the administrative burden, increasing flexibility in fund management and speeding up payments, not only for the relevant authorities but also for the final beneficiaries; whereas it is necessary to increase the scope for using funds more flexibly, including the possibility of financing the development of dual-use products; whereas it is of utmost importance to formulate any future cohesion policy with a strategic impetus throughout the funding period, which could, however, be reassessed at midterm;

    H.  whereas the low absorption rate of the 2021-2027 cohesion policy funds, currently at just 6 %, is not because of a lack of need from Member States or regions, but rather stems from delays in the approval of operational programmes, the transition period between financial frameworks, the prioritisation of NextGenerationEU by national managing authorities, limited administrative capacity and complex bureaucratic procedures; whereas Member States and regions may not rush to absorb all available funds as they anticipate a possible extension under the N+2 or N+3 rules;

    I.  whereas radical modifications to the cohesion regulatory framework, from one programming period to the next, contribute to generating insecurity among the authorities responsible and beneficiaries, gold-plating legislation, increasing error rates (and the accompanying negative reputational and financial consequences), delays in implementation and, ultimately, disaffection among beneficiaries and the general population;

    J.  whereas there is sometimes competition between cohesion funds, emergency funds and sectoral policies;

    K.  whereas demographic changes vary significantly across EU regions, with the populations of some Member States facing a projected decline in the coming years and others projected to grow; whereas demographic changes also take place between regions, including movement away from outermost regions, but are generally observed as movement from rural to urban areas within Member States, wherein women are leaving rural areas in greater numbers than men, but also to metropolitan areas, where villages around big cities encounter difficulties in investing in basic infrastructure; whereas the provision of essential services such as healthcare, education and transportation must be reinforced in all regions, with a particular focus on rural and remote areas; whereas a stronger focus is needed on areas suffering from depopulation and inadequate services, requiring targeted measures to encourage young people to remain through entrepreneurship projects, high-quality agriculture and sustainable tourism;

    L.  whereas taking account of the ageing population is crucial in order to ensure justice among the generations and thereby to strengthen participation, especially among young people;

    M.  whereas urban areas are burdened by new challenges resulting from the population influx to cities, as well as rising housing and energy prices, requiring the necessary housing development, new environmental protection and energy-saving measures, such as accelerated deep renovation to combat energy poverty and promote energy efficiency; whereas the EU cohesion policy should help to contribute to an affordable and accessible housing market for all people in the EU, especially for low- and middle-income households, urban residents, families with children, women and young people;

    N.  whereas effective implementation of the Urban Agenda for the EU can enhance the capacity of cities to contribute to cohesion objectives, thereby improving the quality of life of citizens and guaranteeing a more efficient use of the EU’s financial resources;

    O.  whereas particular attention needs to be paid to rural areas, as well as areas affected by industrial transition and EU regions that suffer from severe and permanent natural or demographic handicaps, brain drain, climate-related risks and water scarcity, such as the outermost regions, and in particular islands located at their peripheries or at the periphery of the EU, sparsely populated regions, islands, mountainous areas and cross-border regions, as well as coastal and maritime regions;

    P.  whereas Russia’s war of aggression against Ukraine has created a new geopolitical reality that has had a strong impact on the employment, economic development and opportunities, and general well-being of the population living in regions bordering Ukraine, Belarus and Russia, as well as candidate countries such as Ukraine and Moldova, which therefore require special attention and support, including by accordingly adapting cohesion policy; whereas this war has led to an unprecedented number of people seeking shelter in the EU, placing an additional burden on local communities and services; whereas the collective security of the EU is strongly dependent on the vitality and well-being of regions situated at the EU’s external borders;

    Q.  whereas the unique situation of Northern Ireland requires a bespoke approach building on the benefits of PEACE programmes examining how wider cohesion policy can benefit the process of reconciliation;

    R.  whereas 79 % of citizens who are aware of EU-funded projects under cohesion policy believe that EU-funded projects have a positive impact on the regions(28), which contributes to a pro-EU attitude;

    S.  whereas overall awareness of EU-funded projects under cohesion policy has decreased by 2 percentage points since 2021(29), meaning that greater decentralisation should be pursued to bring cohesion policy even closer to the citizen;

    1.  Insists that the regional and local focus, place-based approach and strategic planning of cohesion policy, as well as its decentralised programming and implementation model based on the partnership principle with strengthened implementation of the European code of conduct, the involvement of economic and civil society actors, and multi-level governance, are key and positive elements of the policy, and determine its effectiveness; is firmly convinced that this model of cohesion policy should be continued in all regions and deepened where possible as the EU’s main long-term investment instrument for reducing disparities, ensuring economic, social and territorial cohesion, and stimulating regional and local sustainable growth in line with EU strategies, protecting the environment, and as a key contributor to EU competitiveness and just transition, as well as helping to cope with new challenges ahead;

    2.  Calls for a clear demarcation between cohesion policy and other instruments, in order to avoid overlaps and competition between EU instruments, ensure complementarity of the various interventions and increase visibility and readability of EU support; in this context, notes that the RRF funds are committed to economic development and growth, without specifically focusing on economic, social and territorial cohesion between regions; is concerned about the Commission’s plans to apply a performance-based approach to the European Structural and Investment Funds (ESIF); acknowledges that performance-based mechanisms can be instrumental in making the policy more efficient and results-orientated, but cautions against a one-size-fits-all imposition of the model and expresses serious doubt about ideas to link the disbursement of ESIF to the fulfilment of centrally defined reform goals, even more so if the reform goals do not fall within the scope of competence of the regional level;

    3.  Is opposed to any form of top-down centralisation reform of EU funding programmes, including those under shared management, such as the cohesion policy and the common agricultural policy, and advocates for greater decentralisation of decision-making to the local and regional levels; calls for enhanced involvement of local and regional authorities and economic and civil society actors at every stage of EU shared management programmes, from preparation and programming to implementation, delivery and evaluation, keeping in mind that the economic and social development of, and territorial cohesion between, regions can only be accomplished on the basis of good cooperation between all actors;

    4.  Emphasises that the European Agricultural Fund for Rural Development (EAFRD) plays a key role, alongside cohesion policy funds, in supporting rural areas; stresses that the EAFRD’s design must align with the rules of cohesion policy funds to boost synergies and facilitate multi-funded rural development projects;

    5.  Is convinced that cohesion policy can only continue to play its role if it has solid funding; underlines that this implies that future cohesion policy must be provided with robust funding for the post-2027 financial period; stresses that it is necessary to provide funding that is ambitious enough and easily accessible to allow cohesion policy to continue to fulfil its role as the EU’s main investment policy, while retaining the flexibility to meet potential new challenges, including the possibility of financing the development of dual-use products, and to enable local authorities, stakeholders and beneficiaries to effectively foster local development; is of the firm opinion that the capacity to offer flexible responses to unpredictable challenges should not come at the expense of the clear long-term strategic focus and objectives of cohesion policy;

    6.  Underlines the importance of the next EU multiannual financial framework (MFF) and the mid-term review of cohesion policy programmes 2021-2027 in shaping the future of cohesion policy; reiterates the need for a more ambitious post-2027 cohesion policy in the next MFF 2028-2034; calls, therefore, for the upcoming MFF to ensure that cohesion policy continues to receive at least the same level of funding as in the current period in real terms; furthermore calls for cohesion policy to remain a separate heading in the new MFF; stresses that cohesion policy should be protected from statistical effects that may alter the eligibility of regions by changing the average EU GDP; reiterates the need for new EU own resources;

    7.  Proposes, therefore, that next MFF be more responsive to unforeseen needs, including with sufficient margins and flexibilities from the outset; emphasises in this regard, however, that cohesion policy is not a crisis instrument and that it should not deviate from its main objectives, namely from its long-term investment nature; calls for the European Union Solidarity Fund to be strengthened, including in its pre-financing, making it less bureaucratic and more easily accessible, in order to develop an appropriate instrument capable of responding adequately to the economic, social and territorial consequences of future natural disasters or health emergencies; emphasises the need for Parliament to have adequate control over any emergency funds and instruments;

    8.  Recognises the need to also use nomenclature of territorial units for statistics (NUTS) 3 classification for specific cases, in a manner that recognises that inequalities in development exist within all NUTS 2 regions; is of the opinion that regional GDP per capita must remain the main criterion for determining Member States’ allocations under cohesion policy; welcomes the fact that, following Parliament’s persistent calls, the Commission has begun considering additional criteria(30) such as greenhouse gas emissions, population density, education levels and unemployment rates, in order to provide a better socio-economic overview of the regions;

    9.  Stresses that the rule of law conditionality is an overarching conditionality, recognising and enforcing respect for the rule of law, also as an enabling condition for cohesion policy funding, to ensure that Union resources are used in a transparent, fair and responsible manner with sound financial management; considers it necessary to reinforce respect for the rule of law and fundamental rights, and to ensure that all actions are consistent with supporting democratic principles, gender equality and human rights, including workers’ rights, the rights of disabled people and children’s rights, in the implementation of cohesion policy; highlights the important role of the European Anti-Fraud Office and the European Public Prosecutor’s Office in protecting the financial interests of the Union;

    10.  Calls for further efforts to simplify, make more flexible, strengthen synergies and streamline the rules and administrative procedures governing cohesion policy funds at EU, national and regional level, taking full advantage of the technologies available to increase accessibility and efficiency, building on the existing and well-established shared management framework, in order to strengthen confidence among users, thus encouraging the participation of a broader range of economic and civil society actors in projects supported and maximising the funds’ impact; calls for further initiatives enabling better absorption of cohesion funds, including increased co-financing levels, higher pre-financing and faster investment reimbursements; calls for local administration, in particular representing smaller communities, to be technically trained for better administrative management of the funds; stresses, therefore, the importance of strengthening the single audit principle, further expanding simplified cost options and reducing duplicating controls and audits that overlap with national and regional oversight for the same project and beneficiary, with a view to eliminating the possibility of repeating errors in subsequent years of implementation;

    11.  Calls on the Commission and the Member States to give regions greater flexibility already at the programming stage, in order to cater for their particular needs and specificities, emphasising the need to involve the economic and civil society actors; underlines that thematic concentration was a key element in aligning cohesion policy with Europe 2020 objectives; asks the Commission, therefore, to present all findings related to the implementation of thematic concentration and to draw lessons for future legislative proposals;

    12.  Acknowledges that the green, digital and demographic transitions present significant challenges but, at the same time, opportunities to achieve the objective of economic, social and territorial cohesion; recognises that, statistically, high-income areas can hide the economic problems within a region; is aware of the risk of a widening of regional disparities, a deepening of social inequalities and a rising ‘geography of discontent’ related to the transition process; underlines the need to reach the EU’s sustainability and climate objectives, and to maintain shared economic growth by strengthening the Union’s competitiveness; calls, therefore, for a European strategy that guarantees harmonious growth within the Union, meeting the respective regions’ specific needs; reaffirms its commitment to pursuing the green and digital transitions, as this will create opportunities to improve the EU’s competitiveness; underlines the need to invest in infrastructure projects that enhance connectivity, particularly in sustainable, intelligent transport, and in energy and digital networks, ensuring that all regions, including remote and less-developed ones, are fully integrated into the single market and benefit equitably from the opportunities it provides; emphasises, in this context, the need to support the development of green industries, fostering local specificities and traditions to increase the resilience of the economic environment and civil society to future challenges;

    13.  Urges that the cohesion policy remain consistent with a push towards increasing innovation and completing the EU single market, in line with the conclusions of the Draghi report on European competitiveness; underlines, in the context of regional disparities, the problem of the persisting innovation divide and advocates for a tailored, place-based approach to fostering innovation and economic convergence across regions and reducing the innovation gap; calls for a stronger role for local and regional innovation in building competitive research and innovation ecosystems and promoting territorial cohesion; points to new EU initiatives, such as regional innovation valleys and partnerships for regional innovation, that aim to connect territories with different levels of innovation performance and tackle the innovation gap; considers that this approach will reinforce regional autonomy, allowing local and regional authorities to shape EU policies and objectives in line with their specific needs, characteristics and capacities, while safeguarding the partnership principle;

    14.  Is convinced that cohesion policy needs to continue to foster the principle of just transition, addressing the specific needs of regions, while leaving no territory and no one behind; calls for continued financing of the just transition process, with the Just Transition Fund being fully integrated into the Common Provisions Regulation and endowed with reinforced financial means for the post-2027 programming period; emphasises, nonetheless, the need to assess the impact of the Just Transition Fund on the transformation of eligible regions and, while ensuring it remains part of cohesion policy, refine its approach in the new MFF on the basis of the findings and concrete measures to ensure the economic and social well-being of affected communities;

    15.  Underlines the need to improve the relationship between cohesion policy and EU economic governance, while avoiding a punitive approach; stresses that the European Semester should comply with cohesion policy objectives under Articles 174 and 175 TFEU; calls for the participation of the regions in the fulfilment of these objectives and for a stronger territorial approach; calls for a process of reflection on the concept of macroeconomic conditionality and for the possibility to be explored of replacing this concept with new forms of conditionality to better reflect the new challenges ahead;

    16.  Is concerned about the growing number of regions in a development trap, which are stagnating economically and are suffering from sharp demographic decline and limited access to essential services; calls, therefore, for an upward adjustment in co-financing for projects aimed at strengthening essential services; stresses the role of cohesion policy instruments in supporting different regions and local areas that are coping with demographic evolution affecting people’s effective right to stay, including, among others, challenges related to depopulation, ageing, gender imbalances, brain drain, skills shortages and workforce imbalances across regions; recognises the need for targeted economic incentives and structural interventions to counteract these phenomena; in this context, calls for the implementation of targeted programmes to attract, develop and retain talent, particularly in regions experiencing significant outflows of skilled workers, by fostering education, culture, entrepreneurship and innovation ecosystems that align with local and regional economic needs and opportunities;

    17.  Recognises the importance of supporting and financing specific solutions for regions with long-standing and serious economic difficulties or severe permanent natural and demographic handicaps; reiterates the need for maintaining and improving the provision of quality essential services (such as education and healthcare), transport and digital connectivity of these regions, fostering their economic diversification and job creation, and helping them respond to challenges such as rural desertification, population ageing, poverty, depopulation, loneliness and isolation, as well as the lack of opportunities for vulnerable people such as persons with disabilities; underlines the need to prioritise the development and adequate funding of strategic sectors, such as renewable energy, sustainable tourism, digital innovation and infrastructure, in a manner that is tailored to the economic potential and resources of each region, in order to create broader conditions for endogenous growth and balanced development across all regions, especially rural, remote and less-developed areas, border regions, islands and outermost regions; recalls the importance of strong rural-urban linkages and particular support for women in rural areas;

    18.  Emphasises the need for a tailored approach for the outermost regions, as defined under Article 349 TFEU, which face unique and cumulative structural challenges due to their remoteness, small market size, vulnerability to climate change and economic dependencies; underlines that these permanent constraints, including the small size of the domestic economy, great distance from the European continent, location near third countries, double insularity for most of them, and limited diversification of the productive sector, result in additional costs and reduced competitiveness, making their adaptation to the green and digital transition particularly complex and costly; underlines their great potential to further develop, inter alia through improved regional connectivity, key sectors such as blue economy, sustainable agriculture, renewable energies, space activities, research or eco-tourism; reiterates its long-standing call on the Commission to duly consider the impact of all newly proposed legislation on the outermost regions, with a view to avoiding disproportionate regulatory burdens and adverse effects on these regions’ economies;

    19.  Underlines the fact that towns, cities and metropolitan areas have challenges of their own, such as considerable pockets of poverty, housing problems, traffic congestion and poor air quality, generating challenges for social and economic cohesion created by inharmonious territorial development; emphasises the need for a specific agenda for cities and calls for deepening their links with functional urban areas, encompassing smaller cities and towns, to ensure that economic and social benefits are spread more evenly across the entire territory; highlights the need to strengthen coordination between the initiatives of the Urban Agenda for the EU and the instruments of cohesion policy, favouring an integrated approach that takes into account territorial specificities and emerging challenges; calls, furthermore, for more direct access to EU funding for regional and local authorities, as well as cities and urban authorities, by inter alia widening the use of integrated territorial investments (ITI);

    20.  Stresses the need to continue and strengthen investments in affordable housing within the cohesion policy framework, recognising its significance for both regions and cities; highlights the need to foster its changes relevant to investing in housing beyond the two current possibilities (energy efficiency and social housing); emphasises the important role that cohesion policy plays in the roll-out and coordination of these initiatives; believes, furthermore, that it is important to include housing affordability in the URBACT initiative;

    21.  Stresses the strategic importance of strong external border regions for the security and resilience of the EU; calls on the Commission to support the Member States and regions affected by Russia’s war of aggression against Ukraine, in particular the regions on the EU’s eastern border, by revising the Guidelines on regional State aid(31), through tailor-made tools and investments under the cohesion policy, as well as supporting them to make the most of the possibilities offered by the cohesion policy funds, including Interreg, in a flexible way, to help cope with the detrimental socio-economic impact of the war on their populations and territories; calls, furthermore, for support to be given to regions bordering candidate countries such as Ukraine and Moldova to strengthen connections and promote their EU integration;

    22.  Highlights the added value of territorial cooperation in general and cross-border cooperation in particular; underlines the importance of Interreg for cross-border regions, including outermost regions; emphasises its important role in contributing to their development and overcoming cross-border obstacles, including building trust across borders, developing transport links, identifying and reducing legal and administrative obstacles and increasing the provision and use of cross-border public services, among others; considers Interreg as the main EU instrument for tackling the persistent cross-border obstacles faced by emergency services, and proposes that there be a more prominent focus on these services; underlines the fact that cross-border areas, including areas at the EU’s external borders, bordering aggressor countries often face specific challenges; believes that EU border regions, facing multiple challenges, must be supported and is of the opinion that they must be provided with increased means; welcomes the new regulation on BRIDGEforEU; emphasises the importance of small-scale and cross-border projects and stresses the need for effective implementation on the ground; calls on the Commission to encourage Member States to actively support awareness-raising campaigns in bordering regions to maximise the impact of cross-border cooperation;

    23.  Recalls the need to ‘support cohesion’, rather than just rely on the ‘do no harm to cohesion’ principle, which means that no action should hamper the convergence process or contribute to regional disparities; calls for a stronger integration of these principles as cross-cutting in all EU policies, to ensure that they support the objectives of social, economic and territorial cohesion, as set out in Articles 3 and 174 TFEU; calls, furthermore, on the Commission to issue specific guidelines on how to implement and enforce these principles across EU policies, paying particular attention to the impact of EU laws on the competitiveness of less developed regions; reiterates that new legislative proposals need to take due account of local and regional realities; suggests that the Commission draw on innovative tools such as RegHUB (the network of regional hubs) to collect data on the impact of EU policies on the regions; to this end, underlines the need to strengthen the territorial impact assessment of EU legislation, with a simultaneous strengthening of the territorial aspects of other relevant policies; insists that promoting cohesion should also be seen as a way of fostering solidarity and mutual support among Member States and their regions; calls on the Commission and the Member States to continue their efforts regarding communication and visibility of the benefits of cohesion policy, demonstrating to citizens the EU’s tangible impact and serving as a key tool in addressing Euroscepticism; welcomes the launch of the multilingual version of the Kohesio platform;

    24.  Notes with concern the severe decline in recent years of adequate levels of national funding by Member States towards their poorer regions; recalls the importance of respecting the EU rule on additionality; calls on the Commission to ensure that national authorities take due account of internal cohesion in drafting and implementing structural and investment fund projects;

    25.  Insists that, in addition to adjusting to regional needs, cohesion policy must be adapted to the smallest scale, i.e. funds must be accessible to the smallest projects and project bearers; points out that their initiatives are often the most innovative and have a significant impact on rural development; reiterates that these funds should be accessible to all, regardless of their size or scope; approves of the Cohesion Alliance’s call for ‘a post-2027 Cohesion Policy that leaves no one behind’;

    26.  Stresses that delays in the MFF negotiations, together with the fact that Member States have placed a greater focus on the programming of the RRF funds, led to considerable delays in the programming period 2021-2027; stresses the importance of a timely agreement in the next framework, and therefore calls for the Common Provisions Regulation (CPR) and the budget negotiations to be finalised at least one year before the start of the new funding period so that Member States can develop their national and regional funding strategies in good time to ensure a successful transition to the next funding period and the continuation of existing ESIF projects;

    27.  Instructs its President to forward this resolution to the Council, the Commission, the European Economic and Social Committee, the European Committee of the Regions and the national and regional parliaments of the Member States.

    (1) OJ L 231, 30.6.2021, p. 159, ELI: http://data.europa.eu/eli/reg/2021/1060/oj.
    (2) OJ L 231, 30.6.2021, p. 60, ELI: http://data.europa.eu/eli/reg/2021/1058/oj.
    (3) OJ L 231, 30.6.2021, p. 94, ELI: http://data.europa.eu/eli/reg/2021/1059/oj.
    (4) OJ L 231, 30.6.2021, p. 21, ELI: http://data.europa.eu/eli/reg/2021/1057/oj.
    (5) OJ L 231, 30.6.2021, p. 1, ELI: http://data.europa.eu/eli/reg/2021/1056/oj.
    (6) OJ L 435, 6.12.2021, p. 1, ELI: http://data.europa.eu/eli/reg/2021/2115/oj.
    (7) OJ L 99, 31.3.2020, p. 5, ELI: http://data.europa.eu/eli/reg/2020/460/oj.
    (8) OJ L 130, 24.4.2020, p. 1, ELI: http://data.europa.eu/eli/reg/2020/558/oj.
    (9) OJ L 99, 31.3.2020, p. 9, ELI: http://data.europa.eu/eli/reg/2020/461/oj.
    (10) OJ L 437, 28.12.2020, p. 30, ELI: http://data.europa.eu/eli/reg/2020/2221/oj.
    (11) OJ L 109, 8.4.2022, p. 1, ELI: http://data.europa.eu/eli/reg/2022/562/oj.
    (12) OJ L 275, 25.10.2022, p. 23, ELI: http://data.europa.eu/eli/reg/2022/2039/oj.
    (13) European Commission: Directorate-General for Regional and Urban Policy, Ninth report on economic, social and territorial cohesion, 2024.
    (14) European Commission: Directorate-General for Regional and Urban Policy, Forging a sustainable future together: Cohesion for a competitive and inclusive Europe – Report of the High-Level Group on the Future of Cohesion Policy, February 2024.
    (15) OJ C, C/2024/4668, 9.8.2024, ELI: http://data.europa.eu/eli/C/2024/4668/oj.
    (16) European Parliament: Policy Department for Structural and Cohesion Policies, Directorate-General for Internal Policies, Streamlining EU Cohesion funds – addressing administrative burdens and redundancy, 2024.
    (17) Not yet published in the Official Journal.
    (18) Not yet published in the Official Journal.
    (19) OJ C 494, 8.12.2021, p. 26.
    (20) OJ C 15, 12.1.2022, p. 125.
    (21) OJ C 117, 11.3.2022, p. 18.
    (22) OJ C 125, 5.4.2023, p. 100.
    (23) OJ C, C/2024/4207, 24.7.2024, ELI: http://data.europa.eu/eli/C/2024/4207/oj.
    (24) OJ C, C/2024/4225, 24.7.2024, ELI: http://data.europa.eu/eli/C/2024/4225/oj.
    (25) OJ C, C/2024/6562, 12.11.2024, ELI: http://data.europa.eu/eli/C/2024/6562/oj.
    (26) European Commission, Ninth report on economic, social and territorial cohesion, op.cit.
    (27) European Commission: Ninth report on economic, social and territorial cohesion, op. cit.
    (28) European Commission: Directorate-General for Regional and Urban Policy and Directorate-General for Communication, Citizens’ awareness and perceptions of EU Regional Policy, Flash Eurobarometer 531, 2023.
    (29) Flash Eurobarometer 531, op. cit.
    (30) European Court of Auditors, Rapid case review – Allocation of Cohesion policy funding to Member States for 2021-2027, March 2019.
    (31) Commission communication of 29 April 2021 entitled ‘Guidelines on regional State aid’ (OJ C 153, 29.4.2021, p. 1).

    MIL OSI Europe News

  • MIL-OSI Europe: Text adopted – The European Water Resilience Strategy – P10_TA(2025)0091 – Wednesday, 7 May 2025 – Strasbourg

    Source: European Parliament

    The European Parliament,

    –  having regard to the Treaty of the Functioning of the European Union (TFEU), in particular Article 191 thereof,

    –  having regard to the Agreement adopted at the 21st Conference of the Parties to the UNFCCC (COP21) in Paris on 12 December 2015 (the Paris Agreement),

    –  having regard to the United Nations 2030 Agenda for Sustainable Development and the Sustainable Development Goals (SDGs), with particular emphasis on the SDG 6 on clean water and sanitation,

    –  having regard to the Kunming-Montreal Global Biodiversity Framework, adopted in December 2022,

    –  having regard to the Stockholm Convention on Persistent Organic Pollutants of 22 May 2001,

    –  having regard to the precautionary principle and the principles that preventive action should be taken, that environmental damage should, as a priority, be rectified at source and that the polluter should pay, as enshrined in Article 191(2) TFEU,

    –  having regard to Regulation (EU) 2021/1119 of the European Parliament and of the Council of 30 June 2021 establishing the framework for achieving climate neutrality and amending Regulations (EC) No 401/2009 and (EU) 2018/1999 (European Climate Law)(1),

    –  having regard to Directive 2000/60/EC of the European Parliament and of the Council of 23 October 2000 establishing a framework for Community action in the field of water policy(2) (Water Framework Directive),

    –  having regard to Directive 2006/118/EC of the European Parliament and of the Council of 12 December 2006 on the protection of groundwater against pollution and deterioration(3) (Groundwater Directive),

    –  having regard to Directive 2008/105/EC of the European Parliament and of the Council of 16 December 2008 on environmental quality standards in the field of water policy, amending and subsequently repealing Council Directives 82/176/EEC, 83/513/EEC, 84/156/EEC, 84/491/EEC, 86/280/EEC and amending Directive 2000/60/EC of the European Parliament and of the Council(4) (Environmental Quality Standards Directive),

    –  having regard to Directive 2007/60/EC of the European Parliament and of the Council of 23 October 2007 on the assessment and management of flood risks(5),

    –  having regard to Directive (EU) 2020/2184 of the European Parliament and of the Council of 16 December 2020 on the quality of water intended for human consumption(6) (Drinking Water Directive),

    –  having regard to Regulation (EU) 2020/741 of the European Parliament and of the Council of 25 May 2020 on minimum requirements for water reuse(7) (Water Reuse Regulation),

    –  having regard to Directive 2008/56/EC of the European Parliament and of the Council of 17 June 2008 establishing a framework for community action in the field of marine environmental policy (Marine Strategy Framework Directive)(8),

    –  having regard to Directive (EU) 2024/3019 of the European Parliament and of the Council of 27 November 2024 concerning urban wastewater treatment(9) (revised Urban Wastewater Treatment Directive),

    –  having regard to Directive (EU) 2024/1785 of the European Parliament and of the Council of 24 April 2024 amending Directive 2010/75/EU on industrial emissions (integrated pollution prevention and control) and Council Directive 1999/31/EC on the landfill of waste(10),

    –  having regard to Council Directive 91/676/EEC of 12 December 1991 concerning the protection of waters against pollution caused by nitrates from agricultural sources(11),

    –  having regard to Regulation (EU) 2024/1991 of the European Parliament and of the Council of 24 June 2024 on nature restoration and amending Regulation (EU) 2022/869(12),

    –  having regard to Directive (EU) 2022/2557 of the European Parliament and of the Council of 14 December 2022 on the resilience of critical entities and repealing Council Directive 2008/114/EC(13) (Critical Entities Resilience Directive),

    –  having regard to Directive (EU) 2022/2555 of the European Parliament and of the Council on 14 December 2022 on measures for a high common level of cybersecurity across the Union, amending Regulation (EU) No 910/2014 and Directive (EU) 2018/1972, and repealing Directive (EU) 2016/1148 (NIS 2 Directive)(14),

    –  having regard to Directive 2009/128/EC of the European Parliament and of the Council of 21 October 2009 establishing a framework for Community action to achieve the sustainable use of pesticides(15),

    –  having regard to Regulation (EU) 2021/2115 of the European Parliament and of the Council of 2 December 2021 establishing rules on support for strategic plans to be drawn up by Member States under the common agricultural policy (CAP Strategic Plans) and financed by the European Agricultural Guarantee Fund (EAGF) and by the European Agricultural Fund for Rural Development (EAFRD) and repealing Regulations (EU) No 1305/2013 and (EU) No 1307/2013(16),

    –  having regard to Commission Regulation (EU) 2024/3190 of 19 December 2024 on the use of bisphenol A (BPA) and other bisphenols and bisphenol derivatives with harmonised classification for specific hazardous properties in certain materials and articles intended to come into contact with food, amending Regulation (EU) No 10/2011 and repealing Regulation (EU) 2018/213(17),

    –  having regard to the Commission communication of 19 February 2021 entitled ‘A Vision for Agriculture and Food’ (COM(2025)0075),

    –  having regard to the Commission communication of 11 December 2019 on the European Green Deal (COM(2019)0640),

    –  having regard to the Commission communication of 29 January 2025 entitled ‘A Competitiveness Compass for the EU’ (COM(2025)0030),

    –  having regard to the Commission communication of 12 May 2021 entitled ‘Pathway to a Healthy Planet for All – EU Action Plan: ‘Towards Zero Pollution for Air, Water and Soil’’ (COM(2021)0400),

    –  having regard to the Commission communication of 24 February 2021 entitled ‘Forging a climate-resilient Europe – the new EU Strategy on Adaptation to Climate Change’ (COM(2021)0082),

    –  having regard to the Commission communication of 18 July 2007 on addressing the challenge of water scarcity and droughts in the European Union (COM(2007)0414),

    –  having regard to the Commission communication of 11 March 2020 entitled ‘A new Circular Economy Action Plan: For a cleaner and more competitive Europe’ (COM(2020)0098),

    –  having regard to the Commission communication of 14 November 2012 entitled ‘A Blueprint to Safeguard Europe’s Water Resources’ (COM(2012)0673),

    –  having regard to the EU biodiversity strategy for 2030,

    –  having regard to the COP29 Declaration on Water for Climate Action, endorsed by the European Union,

    –  having regard to the European Oceans Pact announced by Commission President von der Leyen in her political guidelines for the next European Commission (2024-2029) on 18 July 2024,

    –  having regard to the European climate adaptation plan and the European water resilience strategy announced by Commission President von der Leyen in her political guidelines for the next European Commission (2024-2029) on 18 July 2024,

    –  having regard to the EU’s 8th environment action programme,

    –  having regards to its resolution of 5 October 2022 entitled ‘Access to water as a human right – the external dimension’(18),

    –  having regard to its resolution of 19 September 2024 on the devastating floods in central and eastern Europe, the loss of lives and the EU’s preparedness to act on such disasters exacerbated by climate change(19),

    –  having regard to its resolution of 6 October 2022 on momentum for the ocean: strengthening ocean governance and biodiversity(20),

    –  having regard to its resolution of 28 November 2019 on the climate and environment emergency(21),

    –  having regard to its resolution of 14 November 2024 on the UN climate change conference in Baku, Azerbaijan (COP29)(22),

    –  having regard to the Commission report of 4 February 2025 on the implementation of the Water Framework Directive (2000/60/EC) and the Floods Directive (2007/60/EC) entitled ‘Third river basin management plans – Second flood risk management plans’ (COM(2025)0002),

    –  having regard to the European Court of Auditors special report 15/2024 of 16 October 2024 entitled ‘Climate adaptation in the EU – action not keeping up with ambition’,

    –  having regard to former Finnish President Sauli Niinistö’s report of 30 October 2024 entitled ‘Safer Together – Strengthening Europe’s civil and military preparedness and readiness’,

    –  having regard to Enrico Letta’s report of April 2024 entitled ‘Much more than a market’,

    –  having regard to its resolution of 17 December 2020 on the implementation of the EU water legislation(23),

    –  having regard to the European Court of Auditors special report 33/2018 of 18 December 2018 entitled ‘Combating desertification in the EU: a growing threat in need of more action,

    –  having regard to the European citizens’ initiative (ECI) on the right to water,

    –  having regard to its resolution of 8 September 2015 on the follow-up to the European Citizens’ Initiative Right2Water(24),

    –  having regard to UN General Assembly Resolution 64/292 of 28 July 2010, which recognises the human right to water and sanitation,

    –  having regard to the Strategic Dialogue on the future of EU agriculture,

    –  having regard to the European Court of Auditors special report 20/2024 of 30 September 2024 entitled ‘Common Agricultural Policy Plans – Greener, but not matching the EU’s ambitions for the climate and the environment’,

    –  having regard to European Environment Agency report 07/2024 of 15 October 2024 entitled ‘Europe’s state of water 2024: the need for improved water resilience’ (EEA Report 07/2024),

    –  having regard to the Environment Council conclusions of 17 June 2024 on the 8th environment action programme,

    –  having regard to European Court of Auditors special report 20/2021 of 28 September 2021 entitled ‘Sustainable water use in agriculture: CAP funds more likely to promote greater rather than more efficient water use’,

    –  having regard to the European Economic and Social Committee declaration of 26 October 2023 for an EU Blue Deal,

    –  having regard to the Commission proposal of 5 July 2023 for a directive of the European Parliament and of the Council on Soil Monitoring and Resilience (Soil Monitoring Law) (COM(2023)0416),

    –  having regard to its position at first reading of 24 April 2024 on the proposal for a directive of the European Parliament and of the Council amending Directive 2000/60/EC establishing a framework for Community action in the field of water policy, Directive 2006/118/EC on the protection of groundwater against pollution and deterioration and Directive 2008/105/EC on environmental quality standards in the field of water policy(25),

    –  having regard to Rule 55 of its Rules of Procedure,

    –  having regard to the opinion of the Committee on Agriculture and Rural Development,

    –  having regard to the report of the Committee on the Environment, Climate and Food Safety (A10-0073/2025),

    A.  whereas water is essential for life and humanity; whereas the EU has to manage current and future water resources efficiently and respond effectively to the current water challenges, as they directly affect human health, the environment and its ecosystems, strategic socio-economic activities such as energy production, agriculture and food security, and the EU’s competitiveness;

    B.  whereas water is a scarce and limited resource and, while 70 % of the earth’s surface is water-covered, available and usable fresh water accounts for only 0,5 % of water on earth(26); whereas mountains are real water towers and important freshwater reservoirs in Europe, the Alps alone providing 40 % of Europe’s fresh water(27);

    C.  whereas groundwater supplies two thirds of the EU’s drinking water and supports many ecosystems(28); whereas the services provided by freshwater ecosystems are worth over EUR 11 trillion in Europe, and provide considerable health and recreational benefits, such as from angling(29);

    D.  whereas water stress is already occurring in Europe, affecting approximately 20 % of Europe’s territory and 30 % of the population on average every year, figures that are likely to increase in the future on account of climate change(30), despite the fact that total water abstraction at the EU-27 level appeared to decrease by 15 % between 2000 and 2019; whereas the increase in the number and recurrence of extreme weather events such as droughts and floods, and the fact that they are expected to become yet more frequent in the near future, poses a risk to human life and the EU’s food sovereignty and could lead to regions in Europe becoming uninhabitable;

    E.  whereas 78 % of Europeans consider that the EU should propose additional measures to address water-related issues in Europe and 21 % of Europeans consider pollution to be the main threat linked to water in their country(31);

    F.  whereas the human right to water and sanitation was recognised as a human right in a resolution adopted by the UN General Assembly on 28 July 2010;

    G.  whereas the European Citizens’ Initiative Right2Water was the first ever to gather the required number of signatories, calling for the EU to ensure the right to water for all;

    H.  whereas the provisions of Article 14 TFEU and Protocol No 26 thereto on Services of General Interest are key elements to be prominently taken into account in all aspects of the design and implementation of the European water resilience strategy (EWRS), thus safeguarding the status of Europe’s water services as essential public services, and ensuring accessibility, equity, affordability and the maintenance of high quality standards;

    I.  whereas the Member States should follow up on the recommendations of the Commission report of November 2023(32) in order to improve water balances as the knowledge basis for making decisions about water allocation;

    J.  whereas substantive corporate value may be at risk owing to worsening water insecurity, with a decrease in the capacity of production or its complete halt as a consequence; whereas assets in water-stressed regions could become stranded, temporarily or permanently, if assumptions made about water availability and access prove inaccurate, if regulatory responses are unanticipated or if risk mitigation and stewardship plans are not put in place(33);

    K.  whereas the deadline set by the Water Framework Directive (WFD) for European rivers, lakes, transitional waters, coastal waters and groundwaters to achieve ‘good’ status was 2015, with a possible postponement to 2027 under certain conditions; whereas the objective of achieving good chemical status for all EU water bodies by 2027 remains far from being achieved, primarily due to substances such as mercury, brominated flame retardants and polycyclic aromatic hydrocarbons(34);

    L.  whereas the 2025 report on the implementation of the WFD shows that delays in meeting the WFD’s targets are not due to a deficiency in the legislation but to a lack of funding, slow implementation and insufficient integration of environmental objectives into sectoral policies; whereas analysis has shown that the Member States are not meeting the annual investment needs, which are estimated to be EUR 77 billion, with a financing gap currently estimated at around EUR 25 billion a year; whereas the report also shows the clear need for the Member States to increase their level of ambition and accelerate action to reduce the compliance gap as much as possible before 2027, to increase investment and ensure adequate financing, including via EU funds, to achieve the objectives of their programmes of measures, as well as to put in place additional measures to reduce current persistent environmental challenges to and improve transboundary cooperation;

    M.  whereas the water legislation has been evaluated as fit for purpose; whereas it establishes a framework for the protection of inland surface waters, transitional waters, coastal waters and groundwater; whereas, at the same time, it allows for less stringent environmental objectives to be achieved if socio-economic needs served by such human activity cannot be achieved by other means and it allows for a failure to achieve the objectives for water bodies if the reason for the failure is overriding public interest; whereas the legislation is proportionate and mandates the authorities of the Member States, in line with the principle of subsidiarity, to decide on the overriding public interest; whereas in some cases this may be the protection of the environment and in others a socio-economic activity;

    N.  whereas industry accounts for approximately 40 % of total water abstraction in Europe; whereas the largest categories of the annual water abstraction in the EU-27, according to the statistical classification of economic activities in the European Community (NACE), are abstraction for cooling in electricity generation (34 %), followed by abstraction for agriculture (29 %), public water supply (21 %) and manufacturing (15 %)(35); whereas data on water abstraction and use in the EU is historical and poor(36);

    O.  whereas electricity production is the largest water-abstracting sector, but most of the water is returned to the environment after cooling or turbine propulsion; whereas overall, agriculture is the highest net water-consuming sector at the EU level, as most of the water is consumed by the crop or evaporates; whereas other uses, such as industry and water utilities, abstract and consume comparatively less water, but they can represent significant pressures at a local level, especially on groundwater(37);

    P.  whereas all industrial activity requires water to produce its end products or to support production activities; whereas businesses depend on water for their daily operations, and as water scarcity increases, it can disrupt operations, raise costs and create regulatory and reputational risks;

    Q.  whereas the energy sector relies heavily on water resources; whereas this dependency poses a serious risk as water scarcity can impact energy production processes and supply security, especially where water is used as feedstock or for cooling; whereas the transition to renewable energy, particularly wind and solar energy, offers sustainable and water-efficient decarbonisation pathways and the opportunity to halt or reverse the trend of increasing water consumption;

    R.  whereas water is an essential resource for agriculture in the production of high-quality food, feed and renewable raw materials; whereas agriculture depends on water availability and irrigation helps to shield farmers from irregular rainfall and to increase the viability, yield and quality of the crops, but is a significant drain on water resources; whereas in view of climate change, changing weather patterns and increased frequency of floods and droughts, the importance of water as a resource for the production of high-quality agricultural products and of the need for water to be used efficiently will therefore be fundamental to the security of food supply and to the solutions to address water scarcity; whereas reducing pressure on surface water and groundwater from agriculture must go hand in hand with investment aimed at the use of reclaimed water and innovative desalination technologies, thereby achieving a better water balance as well as promoting clean alternative energies such as green hydrogen;

    S.  whereas global population growth requires increased food production, and the EU must guarantee food sovereignty, as laid down in Article 39 TFEU;

    T.  whereas reliable data on water accounting, that is, the systematic study of the current status and trends in water supply, demand, accessibility and use in domains that have been specified(38), is crucial for an assessment of the current situation in the EU and for European competitiveness;

    U.  whereas the potential of wastewater as an alternative water supply is underestimated, given that 60-70 % of the potential value of wastewater across the EU is currently unexploited(39) and less than 3 % of treated wastewater is reused in the EU(40); whereas there is significant potential for circular approaches to water in households, as only a small amount of the water in households is used for drinking and eating and therefore requires the highest quality standards;

    V.  whereas a very large quantity of water is lost due to obsolete or ageing water networks and the lack of necessary maintenance; whereas investment in the maintenance, improvement and development of resilient innovative irrigation infrastructures is essential for reducing and improving the efficiency of water consumption in agriculture; whereas such improvements in efficiency enable the water saved to be used for other purposes or enable the natural flow rates of watercourses to be maintained;

    W.  whereas clean and sufficient water is an essential element in implementing and achieving a real sustainable circular economy in the EU;

    X.  whereas water leakage is an underestimated global issue, which significantly exacerbates water scarcity, with an average of 23 % of treated water lost during distribution in the EU due to leaky pipes, outdated treatment facilities and insufficient reservoirs(41); whereas the revised Drinking Water Directive included measures to reduce water leakages, as well as risk assessment and management of the catchment areas for drinking water abstraction;

    Y.  whereas in 2021, 91 % of Europe’s groundwater bodies were reported as having achieved ‘good quantitative status’, while 77 % were reported as having ‘good chemical status’(42);

    Z.  whereas in 2021, only 37 % of Europe’s surface water bodies were reported as being in ‘good’ or ‘high’ ecological status, while 29 % achieved ‘good chemical status’(43);

    AA.  whereas the European Environment Agency emphasises that the proportion of surface waters failing to achieve good ecological status is uneven across Europe, and that these are more prevalent in parts of central and western Europe, and stresses that differences in water status between the Member States may be caused by different pressures, but that those differences may also result from varying approaches to monitoring and assessment(44);

    AB.  whereas the quality of surface waters across the continent reflects continuing and combined pressures, in particular diffuse pollution and the degradation of their natural flow and physical features; whereas pollution by nutrients and persistent priority substances, as well as by substances newly emerging as pollutants, continues; whereas groundwaters are affected by diffuse pollution and also suffer from intensive abstraction(45);

    AC.  whereas groundwater supplies 65 % of water for drinking and 25 % of water for agricultural irrigation in the EU(46); whereas it is a finite resource that needs to be protected from pollution and over-exploitation(47);

    AD.  whereas monitoring data from the European Environment Agency indicates widespread pollution by per- and polyfluoralkyl substances (PFAS), commonly referred to as ‘forever chemicals’, in European waters, posing significant risks to aquatic ecosystems and human health; whereas short-chain PFAS trifluoroacetic acid (TFA) has been detected in drinking water all over Europe; whereas PFAS persist in the environment, bioaccumulate in living organisms and cause adverse (eco)toxicological effects; whereas from a group of 6 000 to 10 000 individual substances, only a few have been extensively studied and their impact on human health and environment is known; whereas 99 % of PFAS remain undetected in the environment as a result of limits in monitoring;

    AE.  whereas the lack of EU-wide quality standards for PFAS in groundwater and insufficient monitoring of less-studied PFAS compounds exacerbate the challenge of achieving good chemical status for EU waters in line with the WFD and pose a substantial technical and financial burden on health systems and on water service providers while jeopardising applications of water and sewage sludge reuse;

    AF.  whereas hazardous chemicals, including heavy metals and other pollutants, released into water bodies by industrial activities, significantly impact water quality and aquatic ecosystems(48);

    AG.  whereas pharmaceutical substances are increasingly identified in surface water and groundwater; whereas pollution caused by pharmaceutical residues necessitates advanced water treatment technologies, including membrane filtration, activated carbon treatment, advanced oxidation processes and other innovative purification techniques;

    AH.  whereas Directive 2010/75/EU(49) mandates that the potential aggravation of the impact of industrial discharges on the state of water bodies due to variations of water flow dynamics should be explicitly taken into account in the granting and reviewing of permits; whereas the best available techniques will newly incorporate notions of environmental performance levels related to water and permits, which translate the use of these techniques into environmental performance limit values; whereas this is a welcome change with a potential improvement to the industry’s resilience, as EU installations may already face a lower production capacity seasonally due to water scarcity;

    AI.  whereas urban wastewater is one of the main sources of water pollution, if not properly collected and treated; whereas the objectives of the Urban Wastewater Treatment Directive should not be lowered, and its scope should be extended to other sectors and substances that contribute to water pollution;

    AJ.  whereas nutrient pollution in EU water bodies leads to eutrophication, loss of biodiversity, and degradation of aquatic ecosystems(50); whereas pesticide run-off contaminates surface water and groundwater, threatening water quality and human health;

    AK.  whereas research indicates that exposure in Europe to the synthetic chemical bisphenol A (BPA), which is used in products ranging from plastic and metal food containers to reusable water bottles, is well above acceptable health safety levels(51);

    AL.  whereas soil and nutrient management lies at the basis of improving water quality and availability; whereas the EWRS should focus on improving nutrient management, with the aim of closing nutrient loops to reduce nutrient emissions to waterways; whereas the safe use of sewage sludge in agriculture will also reduce the EU’s very high dependency on the import of phosphorus mineral fertiliser, for example, from Russia; whereas the safe use of sludge should therefore also be considered as contributing to European resilience and strategic autonomy;

    AM.  whereas climate change represents a major threat to water resources and aquatic ecosystems; whereas many impacts of climate change are felt through water, such as more intense and frequent droughts, more extreme flooding and more erratic seasonal rainfall; whereas floods and water scarcity compromise food and water security, and the health of the general population, ultimately affecting social cohesion, economic prosperity and stability, as well as jeopardising the long-term availability of this valuable resource;

    AN.  whereas the European climate risk assessment recognised that Europe’s policies and adaptation actions are not keeping pace with the rapidly growing risks that threaten ecosystems, infrastructure, food and water supply and people’s health, as well as the economy and finance(52);

    AO.  whereas assessments by the Intergovernmental Panel on Climate Change show that the sea level rise due to climate change is leading to an increase in the salinity of soils and freshwaters, compromising ecosystem health and water quality, as well as affecting 80 million Europeans living in low elevation coastal zones and flood plains; whereas freshwater and marine ecosystems are interconnected as riverine pollution, disruption to sediment flows and water shortages all have a very strong impact on the health of marine ecosystems, particularly the coastal ones, as well as on the viability of social and economic activities that depend on them, such as transport, fisheries, agriculture, aquaculture and tourism;

    AP.  whereas prolonged drought, extreme heat and large-scale flooding events, caused by changing weather patterns, will intensify and become more frequent throughout the continent, damaging ecosystems and human health and leading to major disruption to economic activities and decreasing the overall quantity and quality of available water; whereas preserving water resources and the natural functions of rivers, while supplying sufficient water of good quality, is becoming a major challenge that will require increased climate change mitigation and adaptation efforts, effective management and innovative measures to increase water availability; whereas managing water scarcity and flood risks affordably and sustainably will increasingly become important across the EU;

    AQ.  whereas in 2022, Europe experienced its hottest summer and the second warmest year on record, leading to drought impacting over 15 % of EU territory; whereas the average annual economic loss caused by droughts in the EU between1981 and 2010 was estimated at around EUR 9 billion per year; whereas with no adaptation measures, it is estimated that annual drought losses in Europe and the UK could increase to EUR 45 billion per year up to 2100 with warming of 3°C(53); whereas in the period of 1998-2020, floods comprised 43 % of all disaster events in Europe; whereas climate change impacts and socio-economic developments are leading to more frequent flooding, affecting an increasing number of people and causing increasing damage; whereas 12 % of Europe’s population lives in floodplains(54);

    AR.  whereas the cost of inaction in addressing water-related challenges is extremely high, given that 90 % of disasters are related to water(55); whereas without policy action, the cost of economic losses from coastal floods alone could exceed EUR 1 trillion per year by the end of the century in the EU(56) and the economic cost of droughts in Europe could exceed EUR 65 billion a year by 2100(57);

    AS.  whereas significant differences exist between the Member States in water availability, management strategies and usage patterns, and vulnerability to climate change impacts can vary considerably; whereas a tailored approach is required to enhance water resilience and ensure sustainable water management;

    AT.  whereas droughts constitute one of the chief catastrophic consequences of climate change; whereas around 23 % of the EU’s territory is moderately susceptible to desertification and 8 % is highly susceptible to it; whereas Hungary, Bulgaria, Spain and Italy are among the countries most affected, and 74 % of Spain’s surface area is at risk of desertification; whereas the EWRS should look beyond prolonged droughts, but rather address the reality that the semi-arid line is moving north, resulting in increasing areas in the EU that will face chronic long-term unavailability of sufficient freshwater resources;

    AU.  whereas policies related to desertification, water consumption and climate change are closely interconnected; whereas as part of the United Nations Convention to Combat Desertification, the EU reaffirmed in 2015 and later re-confirmed in 2024(58) its commitment to achieving land degradation neutrality by 2030, which, according to the European Court of Auditors special report on desertification, is unlikely to be achieved;

    AV.  whereas water infrastructure can help maintain a constant and predictable flow and supply of water; whereas in 2022, the annual average river discharge across Europe was the second lowest since records began in 1991(59);

    AW.  whereas downstream areas are particularly dependent on upstream water management and abstraction; whereas the Member States should refrain from implementing measures that significantly increase flood risks upstream or downstream of other countries in the same river basin, in accordance with the WFD;

    AX.  whereas nature-based solutions are pertinent interventions that, when tailored to specific ecosystems and needs, can increase resilience in the water cycle and provide multiple benefits in terms of biodiversity protection, carbon sequestration, improved water quality, nutrient retention, supply of drinking water, wildfire prevention and flood risk mitigation; whereas nature-based solutions can enhance the effectiveness and the operable life of water infrastructure, therefore ensuring, in many cases, complementarity of both solutions;

    AY.  whereas natural water retention measures are nature-based solutions that aim to store water in natural, agricultural, forested and urban landscapes;

    AZ.  whereas water is not a commercial product like any other but, rather, a heritage which must be protected, defended and treated as such; whereas, under Directive (EU) 2024/1203 on the protection of the environment through criminal law(60), abstraction of surface water or groundwater within the meaning of the WFD constitutes a criminal offence where such conduct is unlawful and intentional, and causes, or is likely to cause, substantial damage to the ecological status or the ecological potential of surface water bodies or to the quantitative status of groundwater bodies;

    BA.  whereas soil biodiversity and soil organic carbon affect water retention capacity; whereas soil erosion, compaction and certain soil management practices that cause soil degradation lead to a steady decrease in the water retention capacity of soil, which as a consequence exacerbates drought and flood events with a direct negative impact on farming; whereas healthy soil is therefore one of the drivers of water resilience, which itself should be approached and managed at river basin level; whereas better land management is key to preventing disasters;

    BB.  whereas the current multiannual financial framework (MFF) includes an ambitious but non-binding target of dedicating at least 7,5 % of annual EU spending to the biodiversity objectives in 2024 and 10 % in both 2026 and 2027; whereas the new financial framework should incorporate a water perspective with a view to allocating sufficient resources to the future EWRS in order to ensure resilient water ecosystems and infrastructure, and security of water supply, and to facilitate investments in innovative solutions;

    BC.  whereas cohesion funding has played a crucial role in improving water and sanitation services across the Member States; whereas continued support is required to ensure their long-term resilience and compliance with increasingly stringent quality standards;

    BD.  whereas pricing policies can improve the efficiency of water use; whereas such policies are a national competence and account for the regional differences in water availability and the source of water supply; whereas pricing can play a significant role in prompting households and other economic sectors to optimise consumption, as well as in ensuring that water users effectively participate in recovering the costs of water services; whereas pricing policies should also consider affordability for households and small businesses;

    BE.  whereas digitalisation and innovation can effectively assist the Member States, regional bodies and the Commission in collecting data on and monitoring water management; whereas the EU is at the forefront of new technological developments in the water sector, accounting for 40 % of all international patent families in this sector between 1992 and 2021(61), a position that needs to be fostered and nurtured, and the potential of the internal market fully exploited; whereas hurdles for the introduction and scaling-up of new water technologies need to be examined and a just European level playing field guaranteed; whereas continued support for research in water technology innovation is needed to secure and to create jobs and boost European competitiveness;

    BF.  whereas innovation is a crucial tool to help the water sector meet the challenges of the United Nation’s SDGs, adapt to climate change and become more water-efficient;

    BG.  whereas deployment of monitoring and modelling technologies is still lagging behind in many Member States, and the digitalisation of the sector is too slow; whereas provisions on the river basin management plans in the WFD do not explicitly include concrete measures to digitise the water sector; whereas common shortcomings for the current policies harnessing the potential digital solutions are related to the lack of technology guidance, monitoring standards, policy integration, standardisation and public involvement;

    BH.  whereas the water sector is vulnerable to various threats, including physical attacks, cyberattacks and contamination with harmful agents; whereas such incidents could result in widespread illness, casualties and service disruptions, significantly impacting public health, the environment and economic stability; whereas the digitalisation of water management might introduce further security risks in a context of increasing hostile attacks on critical infrastructure; whereas the implementation of the NIS2 Directive and Critical Entities Resilience Directive can contribute to mitigating security risks to vital (drinking) water systems and (drinking) water infrastructure, arising from geopolitical tensions;

    BI.  whereas advances in sensor technology, computing, artificial intelligence (AI) and big data management can help monitor water quantity and quality and inform the operational decisions of the policymakers and water management companies; whereas innovations in nature-based systems to manage water are available and can contribute to resilient water management;

    BJ.  whereas water is a vital component in the life cycle of AI, both in the operation of data centres and the manufacture of hardware; whereas the rapid expansion of AI could result in an exponential increase in water demand; whereas that dependency on an increasingly scarce resource poses significant challenges in terms of sustainability; whereas strategic technologies, such as semiconductors, hydrogen, electric vehicle batteries and data centres, play a key role in achieving a competitive and autonomous EU;

    BK.  whereas chiller and cooling tower systems, based on innovative cooling technologies such as evaporative and closed-loop cooling, are already available and can contribute to reducing water consumption in industrial, heating, ventilation and air conditioning systems applications;

    BL.  whereas research must be promoted with a view to producing alternative active ingredients to combat pests, to ensure greater plant health and reduce the use of inputs and phytosanitary products;

    BM.  whereas water resilience is crucial in education and teaching, and in raising awareness and giving information about the functioning of the water cycle;

    BN.  whereas limited access to water and related infrastructure has a negative impact, especially on women, as it undermines the realisation of other human rights, such as self-determination, economic independence and education;

    BO.  whereas 60 % of European river basin districts are transnational, which makes effective transboundary cooperation crucial; whereas 20 European countries depend on other countries for more than 10 % of their water resources, with five countries relying on more than 75 % of their resources coming from abroad via rivers(62); whereas this cooperation should be strengthened to account for current and future climate challenges such as droughts and floods;

    BP.  whereas United Nations Secretary-General António Guterres appointed a Special Envoy on Water, aiming to enhance international cooperation and synergies among international water processes;

    BQ.  whereas clean water access and sustainable and resilient sanitation infrastructure are key components of the One Health approach, recognising the interconnection between the health of humans and water pollution;

    BR.  whereas water cooperation across borders and sectors generates many benefits, including enhancing food security, sustaining healthy livelihoods and ecosystems, helping address resilience to climate change, contributing to disaster risk reduction, providing renewable energy, supporting cities and industry, and fostering regional integration and peace;

    BS.  whereas geopolitical developments demonstrate that the EU should be ready to withstand the challenges that go beyond the environmental sphere; whereas non-environmental threats, such as recent accidents related to the damaged cable in the Baltic Sea, send the EU a strong message that strengthening transboundary cooperation is key in addressing both the environmental and security-related objectives;

    BT.  whereas about 41 000 kilometres of inland waterways flow through 25 of the Member States; whereas inland waterways, which rely on the availability of water resources, perform a crucial role in optimising water supply and mitigating the impact of droughts and floods, as well as supporting the economic activities and the development of regions;

    BU.  whereas the increasing water scarcity, inequalities in access to water, and external shocks to the water sector have heightened interdependencies, increasing competition for water and leading to complex economic repercussions;

    General remarks

    1.  Welcomes and supports President von der Leyen’s announcement in the political guidelines for the next European Commission (2024-2029) on putting forward a European Water Resilience Strategy (EWRS) addressing water efficiency, scarcity, pollution and water-related risks, as well as the recognition that water is an indispensable resource that is increasingly under stress from climate change and increasing demands;

    2.  Believes that while implementing legislation, economic competitiveness should be taken into account in line with the Competitiveness Compass; calls for the implementation of EU environmental legislation in order to build a resilient and competitive Europe, mitigate and adapt to climate change, halt biodiversity loss, prevent pollution, ensure food security, limit resource use and waste, and strive towards efficient use of resources, including water, while taking into account the precautionary principle, the control-at-source principle and the polluter-pays principle; highlights the fact that water availability impacts the quantity, quality, variety and seasonal availability of foods that can be produced;

    3.  Calls for the EU to integrate its commitments to the COP29 Baku Dialogue on Water for Climate Action and the UN 2023 Water Conference into the international dimension of the strategy;

    4.  Stresses the urgent need to enhance water resilience and management to ensure sustainable freshwater supplies for people, the economy and the environment; emphasises that the EWRS should be developed in coordination with the European Oceans Pact, ensuring a cohesive and integrated approach to managing freshwater and ocean resources, addressing interconnected challenges, enhancing competitiveness and promoting sustainable water management across inland and marine environments, while ensuring a holistic ‘source-to-sea’ approach;

    5.  Insists on the need for a comprehensive and holistic EWRS that integrates water quality, quantity, security, infrastructure, technology and management aspects and includes the restoration of the water cycle as a key element, as it underpins economic activities, ensures resource availability and contributes to climate regulation;

    6.  Stresses the importance of water supply, in particular drinking water, as well as water security of supply; points out that all environmental restoration projects should take into account the water security aspects, prioritising solutions that not only provide environmental benefits, but also guarantee the supply and efficient management of water; emphasises, furthermore, that ecological restoration measures should be carried out in synergy with the development of the EU’s renewable energy potential and not impact the overall energy resilience;

    7.  Recommends that lakes and other freshwater-dependent habitats be included in the strategy, alongside rivers, transitional waters and groundwater, as essential components of the EU’s water resilience efforts;

    8.  Stresses the urgent need to improve crisis-warning systems with regard to heavy water incidents, as well as to improve preventive measures;

    9.  Calls on the Commission to present a European climate adaptation plan, including concrete legislative proposals and actions, particularly regarding infrastructure resilience, water management and nature-based solutions, while prioritising the protection of vulnerable communities, to make the EU more resilient and to lead by example;

    10.  Reiterates that access to clean and safe drinking water and sanitation is a human right; emphasises that this right must be unequivocally ensured, with everyone having access to affordable and good quality water services, including the inhabitants of islands and outermost regions;

    11.  Stresses that no one, whether in public places or private establishments, should be denied access to water supplied from a distribution network intended for human consumption, where available;

    12.  Notes that industrial activities and agricultural production require water to produce their end products or to support production activities, with the amount of water used varying depending on the type of activity; highlights the fact that ensuring Europe’s competitiveness and strategic autonomy requires a water-smart society where technology and data enhance a circular economy, fostering sustainable and water-efficient practices; calls on all relevant actors to accelerate the transition towards water-efficient, circular industry and agriculture by promoting and investing in innovative solutions, including digital tools and technologies, resource recovery, water reuse, renewable energy production, infrastructure, nature-based solutions and inclusive governance mechanisms;

    13.  Urges the Commission to integrate and mainstream the water dimension into internal and external EU policies through a cross-sectoral approach in order to ensure that water resilience, sustainability and security is woven into the fabric of European policies; calls on the Commission, in particular, to carry out a water-related assessment of any regulatory measure, including related to energy, as part of the socio-economic and environmental impact assessment; emphasises that assessing how each EU policy, and EU-funded projects and infrastructure, can impact water resources in terms of quantity, quality and accessibility would ensure that water resilience is a cornerstone of policy formulation and implementation, thus shifting the paradigm from treating water as an infinite resource to recognising its intrinsic value for humanity and for the EU’s ecological and socio-economic landscape and its competitiveness;

    Water efficiency

    14.  Stresses that efficient water use is essential for preserving the EU’s water resources and that water efficiency should be a key objective of the EU; calls, in this regard, for a consequential reduction in water demand, including by addressing excessive leakage levels, investing in research and innovative solutions, modernising industrial and production processes, upgrading water infrastructure, managing water resources and peak demands sustainably, prioritising uses and ensuring that higher water efficiency results in a reduction in overall freshwater consumption as well as in an increase in water availability in water-stressed areas at the local and regional levels; believes that areas affected by prolonged drought and desertification should be given priority;

    15.  Calls for a legislative framework setting sectoral water efficiency and water abstraction targets at basin level, based on up-to-date assessments of water availability and climate risks, including a water valuation approach that accounts for ecosystem services and long-term sustainability, and covering all water uses, including industry, energy, agriculture, public institutions and households; underlines the fact that these targets should be ambitious yet adaptable, taking into account the specific circumstances and progress already achieved by each Member State to ensure continued efforts towards efficiency gains across all regions; stresses the importance of efficient and uniform data collection practices across the Member States and all sectors, including through the use of innovative technologies, as well as real-time data collection points for more transparency on water consumption; emphasises the need to carry out an appropriate assessment of the environmental and socio-economic impacts of water use; stresses that the strategic importance of food production must not be compromised; emphasises that science, research and technology are important for water efficiency and water use as well as for the circular economy in this regard; calls for the creation and promotion of new smart and high-performance irrigation systems, rainwater retention and water from reuse, as well as water-efficient irrigation systems;

    16.  Reiterates the need to develop a common EU methodology for setting water efficiency and water abstraction targets to ensure the sustainable use of available renewable water resources within an integrated water resources management framework which gives due consideration to linkages beyond the water sector through the water-energy-food-ecosystems nexus, thus enabling decision-makers and economic actors to plan the necessary investment to ensure water supply security in an increasingly sustainable manner, while giving due consideration to the characteristics of the water bodies concerned;

    17.  Calls for close collaboration on integrated energy and water resource planning and related technologies across all sectors at national, regional and local levels, including between all stakeholders, in order to establish mechanisms for ensuring coherence across water and energy policies;

    18.  Calls on the Commission to put forward a comprehensive policy on sustainable water management for industry based on reducing, recovering, reusing and recycling, including a focus on the use of water-efficient and circular technologies, water recycling, pollutant reduction strategies and the promotion of closed-loop systems;

    19.  Recalls that the growing threat of water scarcity is jeopardising industries and projects that are key to Europe’s competitiveness drive, including semiconductors, data centres, renewable hydrogen and electric vehicle battery production; notes that these industries will increasingly face pressure to reduce their environmental impact and improve water resource efficiency, including both direct and indirect water usage; calls on the Member States to support water-intensive industries in setting up water-efficiency plans aimed at saving, reusing and recycling water, preventing water pollution and implementing water-efficient technologies; calls on the Commission to incorporate comprehensive water management strategies into relevant EU industrial policies and sector-specific transition pathways, with a particular focus on strategic water-intensive sectors;

    20.  Stresses that knowledge, data, research and technology are key for efficient water use; calls for adequate financial and technical support to be given to the Member States to implement efficient water management measures, including by means of innovative and modern technologies;

    21.  Welcomes the recommendations of the final report of the Strategic Dialogue on the future of EU agriculture underlining that sustainable farming practices and new business models need to be scaled up to promote more efficient use of natural resources, especially water;

    22.  Calls for the transition to a more sustainable and competitive farming model, assisted by the implementation of sustainable practices and innovative solutions that promote biodiversity, reduce chemical inputs and enable water resources to be managed efficiently, including nature-based solutions, regenerative management, smart precision irrigation technologies, digital monitoring systems, advanced treatment methods and smart water distribution networks, optimising consumption and preventing water resource depletion, and that help ensure continued productivity while enabling agriculture to reduce pollution, use pesticides and fertilisers efficiently, improve the hydrological cycle, enhance groundwater recharge and adapt to lower water use; considers that technological solutions can also include measures that can increase water absorption, infiltration and retention in agricultural systems, which are important amid increasing occurrences of both drought and heavy rains;

    23.  Points out that innovative irrigation solutions and practices can enhance water efficiency in agriculture, gaining an economic advantage while also reducing environmental burdens; notes that farmers generally lack sufficient means and incentives to know about water use by crops, actual irrigation applications, the yield responses of crops to different water management practices, and thus current on-farm water-efficiency levels; calls on the Commission and the Member States to incentivise the uptake and support the maintenance of innovative irrigation solutions such as drip irrigation to allow for an active management of water levels and efficient use of water resources, as well as to promote continuous knowledge exchange, so that all relevant stakeholders can share greater responsibility across the entire water supply chain;

    24.  Recalls that the use of nutrients such as nitrate and phosphate is essential for food production, as this activity would not be possible without their use; recommends better consideration of the nutrient cycle in agricultural production and the exploitation of the value in urban wastewater; calls for more research into the effective use of nutrients and the development of nutrient recovery technologies, in order to decrease the Union’s dependence on imported raw materials; recognises the high potential for nutrient recovery from water and calls on the Member States to support the agricultural sector to optimise their nutrient consumption including by using resources (nitrate and phosphorus) recovered from wastewater treatment plants; calls on the Commission to propose an integrated nutrient management action plan to effectively address loss of valuable agricultural inputs, recycling of nutrients, nutrient pollution and inefficiencies in the nutrient cycle; calls for the proper and safe recovery of phosphorus from organic sources and for incentivising investments in its recovery and circular nutrient management in accordance with the Commission’s JRC publication(63);

    25.  Stresses that the current Nitrates Directive is due for revision, as outdated provisions promote the use of artificial fertilisers rather than organic manure; calls for an urgent review of the Nitrates Directive before the end of this year, and its revision to promote circular nutrient management;

    26.  Emphasises, in line with the final report of the Strategic Dialogue on the future of EU agriculture, the need to support the transition to regionally adapted crop and seed varieties and the switch to different crops, with reduced water requirements and greater drought resistance, as well as the need to support the adoption of appropriate soil management practices; considers the need for stronger support for scientific research and technological development related to the breeding of new species, to enable the production and supply of foodstuffs to be diversified and their quality enhanced, while raising the level of protection for human health and the environment; notes the potential of plant varieties that are more resistant to water stress and pests and could play a role in reducing water use and could reduce the environmental footprint of crops;

    27.  Calls for financial and technical support for farmers and rural communities, particularly in water-stressed areas, to help them adopt sustainable land management practices that improve soil and water quality, contribute to biodiversity and mitigate climate change; emphasises the need for special attention to be given to regions that are particularly vulnerable to soil degradation and water scarcity;

    28.  Acknowledges the significant efforts made by farmers to enhance water quality and emphasises the need for an appropriate timeframe to allow the effects of these measures to be accurately assessed;

    29.  Points to the success of the agricultural European Innovation Partnership EIP‑AGRI and calls for the continuation of knowledge exchange, expertise and peer-to-peer learning via the EU’s Common Agricultural Policy (CAP) Network;

    30.  Notes the links between carbon sinking and water availability, and calls for coherence between the water resilience strategy and carbon farming schemes;

    31.  Reiterates that the Water Reuse Regulation aims at reducing the pressure on water bodies by setting out provisions on reusing water after appropriate treatment extends its life cycle, thereby preserving water resources; emphasises, however, that regulatory, financial and technological barriers, including the economic competitiveness of reclaimed wastewater, risk management planning and the sharing of responsibilities, contribute to the slow uptake of reuse of reclaimed water for agriculture; calls, therefore, on the Commission and the Member States to adopt supportive policies, at both the EU and the local level, that incentivise water reuse practices, taking into account the importance of adapting wastewater treatment and quality requirements to the intended water use; notes that treated wastewater also finds valuable applications in various industrial processes and urban contexts, contributing to reducing the pressure on freshwater resources and the conservation of drinking water; calls therefore on the Commission to assess a possible extension of the scope of the Water Reuse Regulation in order to establish, at EU level, minimum water quality standards for safe water reuse for industrial and urban purposes;

    32.  Calls on the Commission and the Member States to specify systems of regulatory and financial incentives for the reuse of treated wastewater in water-intensive sectors and to provide specific funding for the construction of infrastructure connecting wastewater treatment plants and refined water distribution networks; urges a streamlined approach in EU legislation to remove administrative barriers and promote safe and efficient water recycling across the Member States; calls on the Member States to set up national water reuse and saving plans to incentivise cross-sectoral cooperation in water management;

    33.  Reiterates that reused water could alleviate abstraction from rivers, lakes and groundwater for irrigated agriculture; underlines the fact that reused water can contribute to maintaining base flows and minimum water levels during dry periods;

    34.  Highlights the potential of the building sector to save water, for example, with the help of smart sub-metering systems, efficient greywater systems, reuse of domestic wastewater or rainwater harvesting; stresses that the energy performance of buildings can be enhanced by water efficiency, reducing greenhouse gas emissions; calls on the Member States and local authorities to incentivise water-saving features in new buildings; stresses, in this regard, that water-efficient practices should be factored into urban planning; highlights the fact that harvesting rain water as well as using and reusing water efficiently can improve climate adaptation in cities;

    35.  Calls for the transition, in industry and in the energy and digital sectors, to optimised cooling efficiency and alternative cooling methods that are less water-dependent, in order to ensure significant water savings in these sectors;

    36.  Points out that, while households represent 10 % of the overall water consumption in the EU, action on improving domestic water efficiency is also necessary; notes that water-saving technological solutions are readily available and can reduce water consumption in households without compromising comfort or requiring high investment; calls on the Member States to support consumers in transitioning towards such technologies and to strengthen consumer awareness of water consumption and potential efficiency gains by anchoring domestic water efficiency in water, building and consumer policies across the EU;

    37.  Notes that the leakage rates from pipes are high in some Member States, which increases the total share of domestic water consumption; welcomes the provisions of the new Drinking Water Directive on leakage rates and the ongoing work of the Commission to evaluate those rates and set threshold values that will trigger action in the Member States concerned; calls on the Member States to urgently tackle leakage in water supply networks and to fully implement the monitoring and reporting requirements of the Drinking Water Directive, so that the Commission can set a threshold value for leakage by January 2028; emphasises the need for sustainable urban irrigation networks to be modernised, to curb leakages and reduce their water footprint; calls on the Member States to regularly inform the public about the efficiency and effectiveness of their water supplies;

    38.  Points out that public sector organisations provide significant untapped potential for saving water by virtue of their size or their nature as public organisations; believes that the public sector should act as a role model for other sectors;

    39.  Calls on the Commission and the Member States to promote easily accessible and free information, training, advisory programmes and information campaigns aimed at raising public awareness of sustainable water resource management;

    40.  Recommends that water-efficiency aspects, such as reductions in water loss and reuse of water, be integrated in the upcoming revision of the public procurement framework;

    Water pollution

    41.  Underlines the fact that the existing EU water policy framework is designed to address the effective management of water resources and the protection and restoration of freshwater and marine ecosystems, but that its poor implementation and enforcement, insufficient funding and lack of proper cost-benefit analyses of the implementation measures undermine its effectiveness;

    42.  Calls on the Commission and the Member States to implement and enforce the current legislation, in particular the WFD and its ‘daughter’ directives (the Groundwater Directive and the Environmental Quality Standards Directive), with a particular focus on strengthening the monitoring and reporting mechanisms to ensure that all Member States consistently implement the required water protection measures; recalls the need for sufficient funding to implement these acts;

    43.  Stresses that the chemical pollution of surface water and groundwater poses a threat to the aquatic environment, with effects such as acute and chronic toxicity in aquatic organisms, accumulation of pollutants in the ecosystem and loss of habitats and biodiversity, as well as to human health;

    44.  Calls for the establishment of comprehensive EU-wide quality standards for PFAS in groundwater and surface water; stresses that respective updates of the relevant directives are essential for safeguarding water quality and achieving good chemical status for water bodies as mandated under the WFD;

    45.  Insists that essential uses of PFAS in critical sectors, such as medical devices, pharmaceuticals and products necessary for the twin transition to a climate neutral and digital economy, are not endangered in the context of upcoming legislative and non-legislative proposals; calls on the Commission to propose to phase out forever chemicals (PFAS) – starting with consumer goods – linked to harmful effects on human health and the environment, based on scientific evidence, allowing their use where there are no safe alternatives; underlines the need to scale up investments and accelerate the research and development of equivalent and safe alternatives;

    46.  Calls on the Commission to propose updated limits on PFAS in drinking water, taking into account the latest scientific knowledge;

    47.  Emphasises the urgency of addressing, primarily at the source, and effectively monitoring pollution from pharmaceuticals, bisphenols, antimicrobial resistance genes, persistent organic pollutants and other existing and emerging pollutants, to align with the EU’s zero pollution ambition and the goal of achieving good chemical status for all water bodies;

    48.  Calls on the Commission to close the gaps with enhanced funding and the enforcement of current laws, and the integration of circular economy principles to mitigate pollution at its source and safeguard water ecosystems for future generations; underscores the fact that antibiotic-resistant bacteria and certain emerging pollutants remain insufficiently addressed, necessitating further innovation and investment; emphasises the need for all sectors to apply sustainable production processes and circular practices, proactively preventing pollutants from entering water systems;

    49.  Recalls that microplastics may enter drinking water sources in a number of ways: from surface run-off (for example, after a rain event) to wastewater effluent (both treated and untreated), combined sewer overflows, industrial effluent, degraded plastic waste and atmospheric deposition; calls on the Commission to put forward, in line with the requirements of the Drinking Water Directive, a full risk assessment of microplastics in drinking water, while continuously working on reliable and robust sampling and analytical methods in order to appropriately address the potential threat of this emerging pollutant to sources of water intended for human consumption;

    50.  Emphasises the need to improve the monitoring and regulation of plastic pollution in freshwater and marine environments, with particular attention to microplastics and single-use plastics; encourages the Commission to assess current enforcement mechanisms and consider further measures to protect water quality;

    51.  Calls on the stakeholders to develop safe water contact materials, to substitute BPA and other bisphenols and ensure compliance with Regulation (EU) 1935/2004 on materials and articles intended to come into contact with food(64) and the recently adopted provisions as regards the use of BPA and other bisphenols and bisphenol derivatives (Commission Regulation (EU) 2024/3190);

    52.  Recalls that the revised Urban Wastewater Treatment Directive, in effect since 1 January 2025, imposes new obligations regarding water purification, requiring pharmaceutical and cosmetic producers to cover at least 80 % of the costs of removing micropollutants from wastewater, with the aim of reducing harmful substances in the environment; notes the existence of differing figures and assessments regarding the impact this would have on the pharmaceutical sector and, consequently, on the availability and affordability of medicines, and therefore calls on the Commission to conduct a new and comprehensive assessment of the impact on this sector;

    53.  Calls for increased EU support for local authorities for the modernisation of wastewater treatment plants and the promotion of water reuse, to align with the EU’s zero pollution ambition, ensuring that municipal wastewater management contributes effectively to good chemical and ecological water status;

    54.  Calls for increased monitoring of pesticide residues in water bodies and enforcement of pesticide application regulations to mitigate their impact on water quality; stresses the need for increased funding to support farmers in the adoption of low-input and organic farming practices that reduce reliance on chemical pesticides and fertilisers, as well as to provide appropriate training and independent advisory services to farmers and other operators on the use, effectiveness and toxicity of pesticides, as well as best practice;

    55.  Insists on the integration of circular economy principles to reduce hazardous chemical use in industrial processes; stresses the need for additional funding to support industries in transitioning to clean technologies that minimise water pollution(65);

    56.  Recognises the role of treated sludge as a local and circular source of fertiliser, contributing to soil health, nutrient recycling and reduced dependency on synthetic fertilisers; emphasises the importance of preventing PFAS, heavy metals, microplastics and other harmful substances from entering sewer networks in order to enable the safe and sustainable use of high-quality sewage sludge in agriculture;

    57.  Calls on the Commission to include an overview of measures in an annex to the EWRS, with a timeline for achieving the objectives in question;

    Adaptation to climate change: floods, droughts, stress areas, disaster preparedness

    58.  Calls for the climate adaptation proofing of all new EU legislative and non-legislative acts in order to ensure the integration of climate adaptation into sectoral plans and policy measures affecting water and land use; highlights, in this regard, the need for increased climate ambition as part of the fight against climate change, while urging the Member States to ensure that all climate adaptation measures affecting water use contribute to long-term, improved water resilience; calls on the Commission to take fully into account the geographical and environmental conditions in the Member States, as well as the specific situation of islands, outermost regions and other areas of high vulnerability, such as areas affected by desertification, when adopting new legislative and non-legislative proposals; asks the Commission to present a roadmap for current and ongoing legislative and non-legislative policy measures, including targets and monitoring requirements affecting water and land use;

    59.  Emphasises the need for tailored climate adaptation measures for the Mediterranean region, which faces unique challenges such as prolonged droughts and saline intrusion into freshwater resources;

    60.  Stresses the specific challenges faced by island areas due to the scarcity of drinking water and calls for targeted measures to protect island water resources, including improving rainwater collection and storage infrastructure, and implementing alternative water sources, while enhancing water resource monitoring and management systems; calls, further, on the Member States to take better account of mountainous regions in national adaptation plans in order to meet the specific challenges of water management in mountainous areas;

    61.  Reiterates that climate change mitigation and adaptation solutions should not come at the cost of ecosystem degradation, and should avoid increasing the demand for water- and energy-intensive activities, and should instead prioritise energy- and water-efficient innovation and technologies as part of moving towards a more resource-efficient economy, without undermining its productivity, while ensuring equitable access to water for all; points out that, in order to be effective, climate change mitigation and adaptation solutions should be tailored to national circumstances, while enhancing competitiveness and productivity in the short and long term; points out the possibilities of synergies, in this regard, with innovative energy production such as photovoltaics and biogas, as it can also contribute to an increase in agricultural income;

    62.  Recognises the importance of reserving water for nature and the need to maintain healthy freshwater ecosystems, for the good functioning of the water cycle, for human activities and for mitigating the impacts of droughts and water scarcity; underlines, in the context of restoring freshwater ecosystems and the natural functions of rivers, the importance of removing ‘obsolete barriers’, namely artificial barriers that no longer fulfil their original purpose or are no longer needed, wherever such opportunities exist, on the basis of current knowledge and experience; calls for the establishment of specific programmes for the cleaning and conservation of river channels, ensuring minimum flow and reducing the accumulation of debris and sediment that can affect water storage and distribution capacity;

    63.  Insists that, with climate change impact becoming more persistent, flood and drought management must fully integrate the arising risks, including changing weather patterns, such as increased rain patterns leading to excess of water; is convinced that a combination of monitoring and data collection, preparedness, emergency and recovery responses taking into account the principle of ‘building back better’(66)on the one hand, and adapting societal and economic activities on the other, is essential to reduce vulnerability and increase resilience, especially in the light of the quantitative aspect of water becoming more prominent; stresses, in this regard, the need for climate-resilient nature-based solutions and infrastructure that take into account the impact of extreme climate events in their development to ensure their viability in the face of extreme climate events;

    64.  Recalls that in 2007, the WFD was supplemented by Directive 2007/60/EC on the assessment and management of flood risks, which aims to establish a framework to reduce the adverse consequences of flooding on human health, the environment, cultural heritage and economic activity; notes that making the two directives mutually compatible is achieved through risk management plans and river basin flood management plans as the components of an integrated water management system in which coordination is crucial; recalls that flood prevention is closely connected to urban green spaces, soil protection strategies and investment in drainage networks;

    65.  Stresses that preparedness for water scarcity and drought can be significantly improved in the EU, considering that no drought management plans are in place in several Member States(67); calls on the Member States and, where applicable, competent regional and local authorities, to develop drought management plans, particularly with a view to ensuring the provision of drinking water, ensuring food production and integrating digitalised monitoring, control and early warning systems in order to support effective and data-based decisions on protection, response and communication measures with clearly defined areas of responsibility; points out the need to introduce EU-level provisions as regards drought management plans, similar to the ones on flood management plans;

    66.  Insists, in view of the numerous climatic events, such as floods, droughts and cyclones, which have affected Europe, on the importance of the EU having a robust mechanism for responding to such crises, including systems for warning and providing assistance to the civilian population; points out that digital monitoring, adequate public display of relevant data and early warning systems are key to developing effective drought and flood management plans at the level of the Member States; emphasises, further, the importance of fully using the available EU tools, such as the flood forecasts of the European Flood Awareness System and the Global Flood Awareness System, and the Global Flood Monitoring tool, as part of the Copernicus Emergency Management Service;

    67.  Stresses the importance of the Union Civil Protection Mechanism (UCPM) in helping countries hit by water-related disasters such as flood and droughts; calls for increased funding to provide the UCPM with sufficient and upgraded resources in order to increase preparedness and improve capacity building;

    68.  Calls on the Commission and the Member States to enhance citizen preparedness in the event of water-related disasters or crisis; stresses the importance of information campaigns and demonstration exercises in education facilities, public administration and businesses in order to build a ‘preparedness culture’ for citizens;

    69.  Calls on the Member States to systematically renew and upgrade their water infrastructure, including drinking water and sanitation infrastructure, as well as infrastructure regulating river flows, and to invest in innovative solutions based on good practice, making water systems more resilient to climate change, ensuring stable drinking water supply, enabling the early detection of losses and reducing water leakages and waste, while optimising water transport and storage systems; highlights the fact that funding for innovative water infrastructure is insufficient compared to the investment needs across the EU; calls, in this regard, for dedicated funding, on national, regional or EU level, to ensure adequate financing for the development, maintenance and modernisation of water-resilient infrastructure, to foster innovative solutions and technologies and ensure long-term sustainability of that water infrastructure;

    70.  Regrets that, despite the threat that desertification poses to water quality and availability, soil fertility and food production, and despite the fact that 13 Member States have declared themselves to be affected by desertification in the context of the United Nations Convention to Combat Desertification, the Commission is not addressing desertification effectively and efficiently; urges the Commission, therefore, in line with the Council conclusions of 14 October 2024 on desertification, land degradation and drought, to present an integrated EU-wide action plan to combat desertification, land degradation and drought, aiming at building resilience to drought and achieving land degradation neutrality in the EU by 2030, based on a full impact assessment;

    71.  Insists that the agricultural sector be further supported in implementing new technologies to reduce the demand for water, while at the same time increasing access to water, including by supporting water retention and groundwater recharge; calls for research results, for example on seawater desalination, to be made accessible and to facilitate the deployment of innovative desalination solutions; calls on the Member States to create natural water reserves based on up-to-date assessments of climate risks to protect critical water supplies and their catchments, and taking into consideration the environmental and socio-economic impact of developing such reserves; points out that such natural water reserves would complement the WFD’s requirement for Member States to identify water bodies used for drinking water abstraction, making sure they meet the objectives set out in Article 4 WFD and in the Drinking Water Directive, and would ensure their necessary protection; notes that such natural water reserves already exist under different forms in various Member States; stresses that assistance should be given to Member States or local and regional governments to help them develop natural water reserves;

    72.  Notes the potential of retention infrastructure as an example of water generation systems created using the best available, cost-effective techniques that have the lowest environmental impact, including by means of wastewater reuse or rainwater collection, in order to reduce the risks of droughts and floods, increase water security and foster circularity, water reclamation and reuse; believes that water retention facilities may be useful tools provided that they are authorised by local or national authorities under clear conditions, including the capacity of local groundwater to sustain such activities and the need for farmers accessing the water resource to adapt their practices to more sustainable practices, in particular in terms of water needs and water quality; calls on the Commission to use its available tools, including financial support, to streamline this approach among the Member States;

    73.  Deplores the unlawful or intentional abstraction of water, which is likely to cause substantial damage to water bodies; calls for strong dissuasive measures to be applied, including through the criminal law, to protect the ecological status or the ecological potential of surface water bodies or of the quantitative status of groundwater bodies; notes that additional support for training and knowledge transfer for national enforcement capacities is needed;

    74.  Notes the important cross-cutting role of nature-based solutions in addressing the challenges of the triple planetary crisis and restoring the natural water cycle; calls on the Commission and the Member States to prioritise, taking into account the environmental and socio-economic impacts, the deployment of nature-based solutions for water resilience in their policy actions and recommendations, such as the re-wetting of wetlands and peatlands to increase ground water availability and surrounding soil moisture, the restoration and protection of floodplains, natural water retention measures, revegetation as a barrier against floods, and rainwater conservation, in order to strengthen water availability, mitigate climate change risks and support long-term resilience for communities, businesses and food production; underlines that, in addition to nature-based solutions, complementary investment in engineering solutions remains necessary to ensure successful climate adaptation and water resilience in the long term;

    Funding and pricing

    75.  Notes that nature-based solutions and natural water retention measures have the potential to restore groundwater levels and support ecological flows while reducing water-related risks from water scarcity, floods and droughts; notes that in flood management, nature-based solutions cannot usually replace existing solutions and may not be effective for the most extreme events; points out, however, that nature-based solutions can enhance the effectiveness and operable life of grey infrastructure by increasing water absorption capacity, reducing water velocity and regulating peak flows; reiterates, in this regard, that the effectiveness of nature-based solutions is context-specific and must be adapted to the local situation; emphasises in this regard that a ‘one solution that fits all’ does not exist;

    76.  Stresses the need to provide financial support for sustainable innovative methods and solutions, while having due regard to public-private partnerships;

    77.  Stresses, in the context of climate adaptation, the importance of healthy soils in ensuring water security and circularity; emphasises that the natural water retention of soils must be improved through measures to enhance soil health, minimising carbon losses, as well as actions at the level of the water body, such as the stabilisation of riverbanks, including through re-naturalisation, and the restoration of the retention capacities of aquifers;

    78.  Notes that thoroughly designed forest management measures can improve watershed health, regulate water flow and reduce drought and flood stress, given the essential role of trees and forests in water cycle regulation, through their ability to purify water, increase the availability of water resources and improve soil moisture retention; proposes that this be duly considered when the Commission, in cooperation with the Member States, develops Union disaster resilience goals and that it be considered in the development and refinement of disaster risk management and contingency planning; highlights the need, in this regard, for more research, data collection, innovation and funding to support land managers in preventing the impact of environmental stressors such as drought floods and diminishing watershed function;

    79.  Recognises that urban areas are increasingly vulnerable to water-related climate risks such as flooding, water shortages and heat stress; calls for the integration of urban water resilience planning into climate adaptation strategies, including investment in green roofs, permeable infrastructure, rainwater harvesting and storm water retention systems, as well as measures aimed at increasing green and blue spaces in urban areas, in order to mitigate extreme weather impacts and to reduce the risks to human life and property; calls further for the maintenance of, and regained access to, urban waterways in cities;

    80.  Emphasises that the EWRS should ensure adequate funding from public and private sources in order to support the modernisation, upgrading, adaptation and maintenance of resilient water infrastructure, sustainable water management, data collection, research, effective monitoring, digitalisation, upskilling, nature-based solutions, the development and the uptake of innovative water-efficient technologies, as well as to ensure environmental and socio-economic sustainability in line with the goals set by the new European Competitiveness Compass;

    81.  Calls on the Commission to create a separate and dedicated fund for water resilience within the upcoming MFF; believes that specific financial mechanisms should also be established within the European Regional Development Fund and the Cohesion Fund to support water-smart technologies and water investment; strongly believes that, in the interim, water should be prioritised in existing funding frameworks, including the Cohesion Fund; stresses that EU funding mechanisms must incorporate considerations of social equity and affordability, in particular in the context of providing water services to the population, ensuring support for Member States and citizens with greater financial constraints and specific realities, while meeting water management obligations; highlights the importance of adjusting existing funding, subsidies and financing streams related to water management and other related land uses, moving away from outdated engineering solutions to innovative ones, as well as nature-based solutions or a combination thereof;

    82.  Calls for targeted funding, via Horizon Europe and the EIP-AGRI, for field trials on the water relations of different cropping systems; calls for the recognition of the role of women in water policies and for specific funding to be identified to promote their access to agriculture;

    83.  Recalls that the lack of dedicated funding for water or binding funding targets within the current MFF limits the EU’s capacity to direct targeted investment towards essential water resilience measures, including infrastructure modernisation, innovation, climate adaptation measures and the implementation of nature-based solutions, and thus its competitive capacity, as the absence of a water balance creates an additional burden for the economy of the regions; notes that outermost and mountainous regions and islands in the EU are particularly struggling to access funding or public-private partnerships to support local and regional investment in water management and infrastructure;

    84.  Stresses the important role of the European Investment Bank (EIB) in water financing; highlights the fact that the EIB is actively investing in and supporting the water sector; stresses that the EU should collaborate with the EIB to share best practice and calls, further, on the EIB and other financial institutions to strengthen their role in the funding of innovative and resilient water infrastructure, improved sanitation and drinking water infrastructure, digitalisation, as well as to support projects aimed at flood risk reduction, erosion prevention and the revitalization of watercourses, by facilitating favourable conditions for water investment;

    85.  Urges the Commission to explore and promote innovative financing mechanisms, including payments for ecosystem services and green bonds, while ensuring regulatory clarity and safeguards to prevent market distortions; calls on the EIB and other financial institutions to prioritise low-interest loans and credits for Member States and regional and local authorities undertaking large-scale restoration projects, with specific provisions to support economically disadvantaged regions;

    86.  Highlights the importance of public-private partnerships as a source of funding for water investment; calls on the Commission to incentivise private investment in the water sector by creating a supportive regulatory framework that may include co-financing opportunities and public-private partnerships in order to drive innovation, improve infrastructure and ensure sustainable water management solutions across the Member States; underlines, nevertheless, that the involvement of private investment in the EU water sector must not undermine the status of water as a public good and a public service, and that the long-term resilience of the sector, as well as the principles of accessibility, affordability and sustainability must be ensured;

    87.  Calls on the Member States to adopt governance frameworks that clearly define the roles and responsibilities of stakeholders in planning, financing and implementing nature-based solutions; believes that these frameworks should integrate funding from diverse sources, including philanthropic contributions and private-sector partnerships, while ensuring equitable access to resources for small-scale projects, particularly managed at local or regional levels;

    88.  Urges the Commission and the Member States to address water aspects in their budgets and to improve governance within the regions in the use of EU funds;

    89.  Underlines the need to provide targeted financial and technical assistance to municipalities to facilitate compliance with water-related legislation;

    90.  Encourages the Member States to accelerate the granting of authorisations for sustainable and innovative resilient water infrastructure projects to enable their rapid implementation in the face of the urgent challenges;

    91.  Notes that the application of the cost recovery principle on water services, which provides that all water users effectively and proportionately participate financially in the recovery of the costs of water services, remains low to non-existent in several Member States; calls on the Member States and their regional authorities to implement adequate water pricing policies and apply the cost recovery principle for both environmental and resource costs in line with the WFD; calls on the Member States to take into account the long investment cycles when implementing the cost recovery principle and to ensure sufficient funding is available for needed (re)investment;

    92.  Stresses the importance of ensuring that water pricing supports long-term water security by reflecting the economic, environmental and resource costs of water use; encourages the Member States and competent regional and local authorities to ensure that water pricing is economically sustainable, socially fair and promotes efficient water use, and that it reflects the availability of water across different Member States and regions, particularly in water-stressed regions, while safeguarding affordability for households and small businesses; calls on the Member States and competent regional and local authorities to insure transparent water prices and to raise awareness of the value of water services;

    93.  Points out that competent national water authorities will play a central role in implementing new water management and conservation plans at the level of the Member States; calls, therefore, on the Members States to financially and technically increase the capacity of those competent authorities to play a more significant enabling and advisory role in sustainable and future-proof water management and storage infrastructure; believes that EU funds, such as the Just Transition Fund, should be used to further assist Member States and water agencies in implementation;

    Digitalisation, security and technological innovation

    94.  Stresses the potential and the necessity for digitalisation and AI in improving the management and monitoring of bodies of water and water infrastructure, as well as in reporting and ensuring the comparability of data reflecting different geographical flow conditions;

    95.  Calls on the Commission, the Member States and water providers to mainstream transparency and digitalisation as fundamental principles in water management and to enhance the use of management and metering data, with the aim of strengthening monitoring, assessment, accountability and decision-making, while optimising and simplifying reporting obligations; calls for digitally enabled water technologies to facilitate real-time, sample-based and distance monitoring and reporting on water quality, leakages, usage and resources; calls for improved efficiency in the use of public funds and public spending in this area; recognises that widespread deployment of innovative digital technologies needs to be accompanied by digital skills training;

    96.  Emphasises the need to promote digitalisation and data-centric solutions in building a water-smart society; stresses the need to develop digital solutions for monitoring water consumption and optimising the use of water resources across all sectors; calls on the Commission, in cooperation with the Member States, to provide financial support for the implementation of smart water management systems, focusing on the needs of small and medium-sized enterprises (SMEs);

    97.  Points out that water systems, including water treatment and distribution systems, are considered one of the nation’s critical infrastructures and security pillars, and hence key for the EU’s strategic autonomy, and require increased protection and the ability of utilities to detect, respond to, and recover from physical and cyberthreats and cyberattacks; notes that a higher level of digitalisation comes with new vulnerabilities; points out that, in the event of a threat or an attack, water system operators can lose their ability to control the flow and quality of the water or lose the ability to track the true status of the water system; insists that vulnerability assessments and an emergency response plan should be an integral part of the water management system in every Member State; encourages the promotion of information sharing about threats to cybersecurity and procedures to exchange best practice among operators, as well as to establish a cybersecurity culture through technical security measures, competence building and awareness creation and communication; draws attention to the measures and provisions in the NIS2 Directive and the Critical Entities Resilience Directive which could help mitigate the arising security risks; calls on the Commission to take the lead in reinforcing the EU-level coordination formats and to propose effective tools in the upcoming Preparedness Union Strategy with the aim of ensuring timely preparedness to tackle environmental and non-environmental risks to the water bodies that are threatening the EU’s overall security;

    98.  Calls on the Commission and the Member States to increase the involvement of women in decisions regarding water resilience; calls for the adoption of a methodological approach that effectively considers gender-related needs in the implementation of water supply projects, by implementing monitoring, reporting and tracking that use tools and indicators disaggregated by gender;

    99.  Notes that better data and data analysis are key to evidence-based decision-making and the swift identification of small changes in water quality that could present a threat to bodies of water, together with the evaluation of best practice and identification of the most cost-effective and impactful measures;

    100.  Stresses that improved, reliable and interoperable data on water supply, demand, distribution, accessibility and use are needed and that data points need to be established; urges the Commission and the Member States to enhance data collection and improve data interoperability across all levels to support the implementation of current water legislation, as well as to facilitate circular economy and water-smart industrial symbiosis strategies; highlights the fact that data and AI could be used in modelling water and energy consumption as well as reuse and recycling capacities;

    101.  Calls on the Commission to better recognise the fundamental role of the water sector in bolstering EU competiveness by fostering research and innovation and promoting entrepreneurship and talent; emphasises, in this regard, the importance of ramping up innovation in the water sector; points out that the European Innovation Centre for Industrial Transformation and Emissions, created as part of Directive 2010/75/EU, could play a role in this regard, as it evaluates the environmental performance of industrial technologies and gathers information on innovative industrial environmental techniques; points, further, to existing partnerships like the Water4All Partnership, a funding programme for scientific research;

    102.  Believes that there is a need to build and nurture multi-stakeholder platforms to promote innovation uptake at all levels, local and national; recommends that these platforms involve a wide range of participants – the public and private sectors, and civil society associations – to build a coalition of partners to bring about change; supports the promotion of knowledge sharing on how digital water technologies can support the implementation of existing EU water legislation, as well as capacity building at local, regional and national levels; calls on the Commission and the Members States to expand digital skills, and research and development (R&D) programmes targeting water, including through collaboration with universities, research centres and SMEs;

    103.  Acknowledges the critical role of data centres in the digital economy; notes with concern that the rapid expansion of the technology could lead to a substantial increase in AI’s demand for water resources associated with their operations, which could undermine the environmental benefits that AI promises to deliver, such as resource optimisation and carbon emission reductions, and stresses the need to integrate water efficiency measures in their design and operation; urges the Commission to address the use of water resources by information and communications technologies (ICT) and, in particular, by AI and data centres in its EWRS, in particular by encouraging data centres to reuse treated water and to promote the design of more efficient chips and components to reduce the need for cooling; recommends that the Member States prioritise water resilience strategies that address the specific challenges posed by data centres to ensure the sustainability of both the digital and the environmental agendas;

    104.  Recalls that seawater desalination is the process of removing salt from sea or brackish water to make it useable for a range of ‘fit for use’ purposes, including drinking, and that it is thus an important technological solution for people’s livelihoods; notes that, at the same time, desalination is an energy-intensive process and should ideally be done using renewable energy, whenever possible, in order to minimise environmental impacts; reiterates that desalination produces a by-product, brine (a concentrated salt solution), that must be properly disposed of to avoid adverse impacts on the marine environment; considers, therefore, that desalination based on reverse osmosis or thermal technologies should be applied, if other more environmentally sustainable options are not available or cannot be implemented, particularly in remote areas and islands; highlights, in this regard, the ongoing work on new technological solutions, such as microbial desalination cells, offering an environmentally sustainable and innovative alternative to traditional desalination methods, particularly to provide clean water and wastewater treatment to small, isolated locations without electricity;

    105.  Stresses the need for increased funding and R&D into technologies such as innovative desalination techniques in order to increase the efficiency, sustainability and the scaling up of such technologies; calls for research into the possibilities of using such technologies in agriculture to diversify the water supply points and therefore decrease the vulnerability of the sector to water stress;

    106.  Notes that in the last decade, there have been many scientific breakthroughs for making water treatment smarter and more circular, with these solutions offering opportunities for using digital solutions, AI and remote sensing to use water more efficiently and by reusing treated wastewater for irrigation and recovering energy and nutrients from wastewater;

    107.  Calls on the Commission and the Member States to address the regulatory obstacles within the single market to facilitate the development, scaling-up, and placing on the market of innovative biotechnology and biomanufacturing solutions and the promotion of cleaner manufacturing and circularity;

    108.  Calls for the funding, development and authorisation of innovative solutions for crop protection and fertilisation, including biological control agents and active substances with lower impact on the environment, which are needed for a just transition to more sustainable agricultural systems;

    109.  Calls for specific programmes to be established for the cleaning and conservation of river channels, ensuring adequate flow and reducing the accumulation of debris and sediment that can affect water storage and distribution capacity;

    Cross-border and international cooperation

    110.  Stresses the need for a comprehensive EWRS that fosters cross-border cooperation, more uniform data collection and reporting, sharing best practice between local, regional and national actors, ensuring sustainable water management and equitable resource distribution among the Member States, preventing water challenges such as scarcity and flood risk from being passed on to other Member States;

    111.  Emphasises that climate change represents a major threat to water resources and aquatic ecosystems; notes that floods and water scarcity compromise food and water security and the health of the general population, ultimately affecting social cohesion and stability; recognises that water resilience is crucial for preventing and addressing current and future health, food, energy and security crises; emphasises that water resilience promotes transboundary water cooperation, serving as a catalyst for peace and security, as countries are interconnected through shared rivers and groundwater resources;

    112.  Calls for increased cross-border cooperation between the Member States in the management of shared river basins and groundwater aquifers and in the effective collection and sharing of data on water quality, pollution levels and water levels; recommends the establishment of regional cooperation centres to coordinate the implementation of joint water resilience strategies, taking into account the climate, social and economic challenges of each territory;

    113.  Calls for enhanced international cooperation, including at the level of river basins, to address the growing water crisis, ensure clean and high-quality water, promote sustainable water management and implement various innovative water technologies, including nature-based solutions; calls for the anchoring of cooperation across borders at operational, tactical and strategic levels;

    114.  Calls for the establishment of cross-border projects under Interreg and other EU funds to improve regional cooperation in the management of water resources, with a particular focus on ensuring the fair distribution of water between sectors and Member States;

    115.  Stresses the need to strengthen EU monitoring capacities through digitalisation and modern technologies, including satellite surveillance and real-time pollution tracking, which are essential for preventing and combating cross-border pollution;

    116.  Urges the Commission to implement a specific diplomatic role dedicated to resolving water-related conflicts, promoting water cooperation and protecting water sources and systems, particularly during armed conflicts and in transboundary contexts;

    117.  Urges the EU to lead international efforts to protect and restore water ecosystems in line with the SDG 6 on clean water and sanitation;

    o
    o   o

    118.  Instructs its President to forward this resolution to the Council and the Commission.

    (1) OJ L 243, 9.7.2021, p. 1, ELI: http://data.europa.eu/eli/reg/2021/1119/oj.
    (2) OJ L 327, 22.12.2000, p. 1, ELI: http://data.europa.eu/eli/dir/2000/60/oj.
    (3) OJ L 372, 27.12.2006, p. 19, ELI: http://data.europa.eu/eli/dir/2006/118/oj.
    (4) OJ L 348, 24.12.2008, p. 84, ELI: http://data.europa.eu/eli/dir/2008/105/oj.
    (5) OJ L 288, 6.11.2007, p. 27, ELI: http://data.europa.eu/eli/dir/2007/60/oj.
    (6) OJ L 435, 23.12.2020, p. 1, ELI: http://data.europa.eu/eli/dir/2020/2184/oj.
    (7) OJ L 177, 5.6.2020, p. 32, ELI: http://data.europa.eu/eli/reg/2020/741/oj.
    (8) OJ L 164, 25.6.2008, p. 19, ELI: http://data.europa.eu/eli/dir/2008/56/oj.
    (9) OJ L, 2024/3019, 12.12.2024, ELI: http://data.europa.eu/eli/dir/2024/3019/oj.
    (10) OJ L, 2024/1785, 15.7.2024, ELI: http://data.europa.eu/eli/dir/2024/1785/oj.
    (11) OJ L 375, 31.12.1991, p. 1, ELI: http://data.europa.eu/eli/dir/1991/676/oj.
    (12) OJ L, 2024/1991, 29.7.2024, ELI: http://data.europa.eu/eli/reg/2024/1991/oj.
    (13) OJ L 333, 27.12.2022, p. 164, ELI: http://data.europa.eu/eli/dir/2022/2557/oj.
    (14) OJ L 333, 27.12.2022, p. 80, ELI: http://data.europa.eu/eli/dir/2022/2555/oj.
    (15) OJ L 309, 24.11.2009, p. 71, ELI: http://data.europa.eu/eli/dir/2009/128/oj.
    (16) OJ L 435, 6.12.2021, p. 1, ELI: http://data.europa.eu/eli/reg/2021/2115/oj.
    (17) OJ L, 2024/3190, 31.12.2024, ELI: http://data.europa.eu/eli/reg/2024/3190/oj.
    (18) OJ C 132, 14.4.2023, p. 54.
    (19) OJ C, C/2024/7216, 10.12.2024, ELI: http://data.europa.eu/eli/C/2024/7216/oj.
    (20) OJ C 132, 14.4.2023, p. 106.
    (21) OJ C 232, 16.6.2021, p. 28.
    (22) OJ C, C/2025/808, 11.2.2025, ELI: http://data.europa.eu/eli/C/2025/808/oj.
    (23) OJ C 445, 29.10.2021, p. 126.
    (24) OJ C 316, 22.9.2017, p. 99.
    (25) Texts adopted, P9_TA(2024)0358.
    (26) World Meteorological Organization, 2021 State of Climate Services – Water, WMO-No 1278, WMO, Geneva, 2021.
    (27) European Environment Agency, Water resources across Europe – confronting water scarcity and drought, EEA Report 2/2009.
    (28) EEA Report 07/2024.
    (29) WWF, High Cost of Cheap Water, WWF, Gland, 2021.
    (30) EEA Report 07/2024.
    (31) European Commission, Attitudes of Europeans towards the environment, Special Eurobarometer 550, May 2024.
    (32) European Commission: Directorate-General for Environment, et al., Implementation of water balances in the EU – Final report, Publications Office of the European Union, 2024.
    (33) Disclosure Insight Action (CDP) and Planet Tracker, High and Dry. How Water Issues Are Stranding Assets, 2022.
    (34) EEA Report 07/2024.
    (35) European Environment Agency, ‘Water abstraction by economic sector in the 27 EU Member States, 2000-2022’, European Environment Agency website, 5 December 2024, https://www.eea.europa.eu/en/analysis/indicators/water-abstraction-by-source-and/water-abstraction-by-economic?activeTab=8a280073-bf94-4717-b3e2-1374b57ca99d.
    (36) Eurostat, ‘Archive: Water use in industry’, Eurostat website, https://ec.europa.eu/eurostat/statistics-explained/index.php?title=Archive:Water_use_in_industry&oldid=196132#Further_Eurostat_information.
    (37) EEA Report 07/2024.
    (38) Food and Agriculture Organization of the United Nations, Water accounting and auditing, A sourcebook, FAO Water Reports 43, FAO, Rome, 2016.
    (39) European Investment Bank, Wastewater as a resource, EIB, 2022.
    (40) European Commission: Directorate-General for Environment, ‘Water reuse: New EU rules to improve access to safe irrigation’, European Commission website, 26 June 2023, https://environment.ec.europa.eu/news/water-reuse-new-eu-rules-improve-access-safe-irrigation-2023-06-26_en.
    (41) European Commission: Directorate-General for Environment, ‘Zero pollution: Improved quality and access to drinking water’, European Commission website, 12 January 2023, https://environment.ec.europa.eu/news/improved-quality-and-access-drinking-water-all-europeans-2023-01-12_en.
    (42) EEA Report 07/2024.
    (43) Ibid.
    (44) Ibid.
    (45) Ibid.
    (46) Ibid.
    (47) Ibid.
    (48) European Environment Agency, ‘Industrial pollutant releases to water in Europe’, European Environment Agency website, 30 May 2024, https://www.eea.europa.eu/en/analysis/indicators/industrial-pollutant-releases-to-water.
    (49) Directive 2010/75/EU of the European Parliament and of the Council of 24 November 2010 on industrial emissions (integrated pollution prevention and control) (OJ L 334, 17.12.2010, p. 17, ELI: http://data.europa.eu/eli/dir/2010/75/oj).
    (50) European Commission ‘Nitrates’, European Commission website, https://environment.ec.europa.eu/topics/water/nitrates_en#implementation.
    (51) European Environment Agency, ‘Public exposure to widely used Bisphenol A exceeds acceptable health safety levels’, European Environment Agency website, 14 September 2023, https://www.eea.europa.eu/en/newsroom/news/public-exposure-to-bisphenol-a.
    (52) European Environment Agency, European Climate Risk Assessment, EEA Report 01/2024.
    (53) Cammalleri, C. et al., Global warming and drought impacts in the EU, JRC Technical Report , Publications Office of the European Union, Luxembourg.
    (54) EEA Report 07/2024.
    (55) Feyen, L. et al., Climate change impacts and adaptation in Europe, JRC PESETA IV final report, Publications Office of the European Union, Luxembourg.
    (56) European Environment AgencyEuropean Climate Risk Assessment, EEA Report 01/2024.
    (57) United Nations Office for Disaster Risk Reduction, GAR Special Report on Drought 2021, Geneva, UNDRR, 2021.
    (58) Council conclusions of 14 October 2024 on Desertification, Land Degradation and Drought.
    (59) EEA Report 07/2024.
    (60) Directive (EU) 2024/1203 of the European Parliament and of the Council of 11 April 2024 on the protection of the environment through criminal law and replacing Directives 2008/99/EC and 2009/123/EC (OJ L, 2024/1203, 30.4.2024, ELI: http://data.europa.eu/eli/dir/2024/1203/oj).
    (61) European Patent Office, Innovation in water-related technologies, EPO, Munich 2024.
    (62) EEA Report 07/2024.
    (63) European Commission JRC Science for Policy Report, ‘Technical proposals for the safe use of processed manure above the threshold established for Nitrate Vulnerable Zones by the Nitrates Directive (91/676/EEC)’, 2020.
    (64) Regulation (EC) No 1935/2004 of the European Parliament and of the Council of 27 October 2004 on materials and articles intended to come into contact with food and repealing Directives 80/590/EEC and 89/109/EEC (OJ L 338, 13.11.2004, p. 4, ELI: http://data.europa.eu/eli/reg/2004/1935/oj).
    (65) European Environment Agency,‘Industrial pollutant releases to water in Europe, European Environment Agency website, 30 May 2024, https://www.eea.europa.eu/en/analysis/indicators/industrial-pollutant-releases-to-water.
    (66) United Nations Office for Disaster Risk Reduction, Build Back Better in recovery, rehabilitation and reconstruction, UNISDR, Geneva, 2019.
    (67) European Commission: Directorate-General for Environment et al. Stock-taking analysis and outlook of drought policies, planning and management in EU Member States – Final Report, Publications Office of the European Union, 2023.
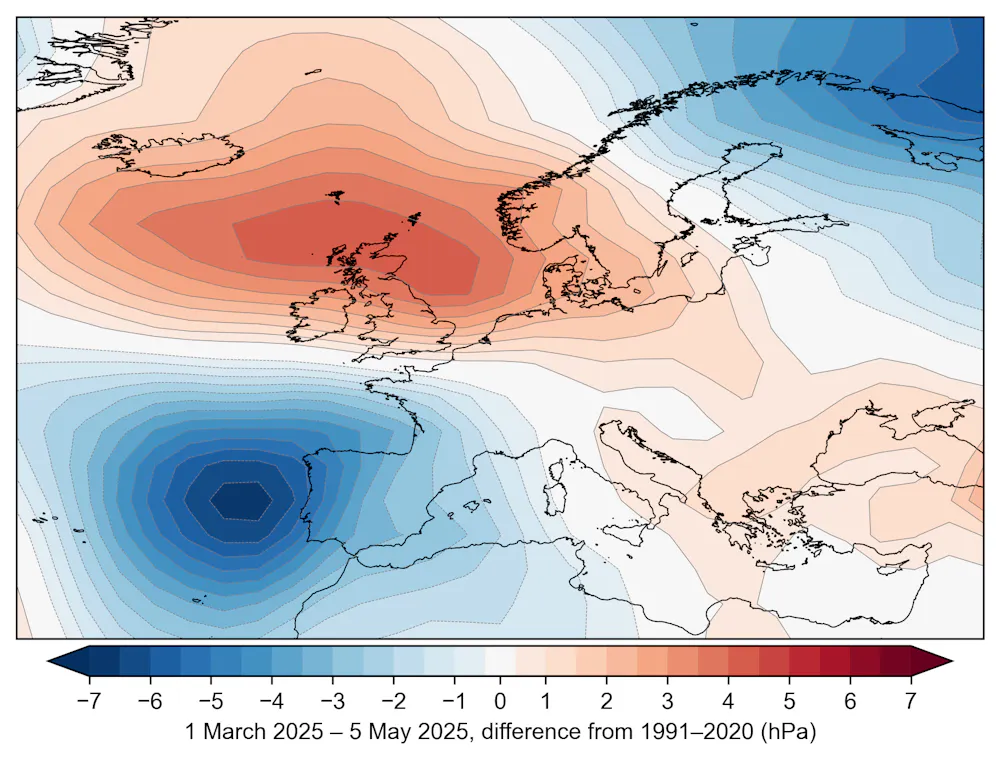
    MIL OSI Europe News

  • MIL-OSI Russia: Kazakhstan’s GDP grew by 6 percent in January-April 2025

    Translation. Region: Russian Federal

    Source: People’s Republic of China in Russian – People’s Republic of China in Russian –

    Source: People’s Republic of China – State Council News

    ALMATY, May 12 (Xinhua) — Kazakhstan’s GDP growth was 6 percent in January-April 2025, according to forecast data from the National Statistics Bureau of Kazakhstan, the press service of the Ministry of National Economy of Kazakhstan reported on Monday.

    Acceleration of the pace of development is noted in key sectors of the economy: transport /22.4 percent/, trade /7 percent/. Growth was also recorded in agriculture /3.9 percent/ and communications /2.6 percent/.

    Growth in the transport sector was achieved due to an increase in the volume of services for the transportation of goods by rail and pipeline transport, the shares of which in the total volume of the industry amounted to 20.5 percent and 19.6 percent, respectively.

    In the construction industry, the index of physical volume of work amounted to 16.2%.

    The trade sector demonstrated steady growth – 7% against 6.3% in the first quarter. The wholesale trade indicator increased to 7.4%, retail – to 6.1%.

    In industry, the production index reached 6.4%. Growth was noted in the mining sector – 7.1%, in particular due to an increase in coal production /11.2%/. In the manufacturing industry, the indicator is 7.2%, including the production of food products /12%/, tobacco products /26.3%/, chemical products /11.2%/ and mechanical engineering /11.2%/.

    Agriculture is also showing positive dynamics. The gross output index for January-April was 3.9 percent. –0–

    MIL OSI Russia News

  • MIL-OSI USA: USDA forecasts winter wheat production up 2% in 2025, orange production up slightly from April forecast

    Source: US National Agricultural Statistics Service

    WASHINGTON, May 12, 2025 – U.S. farmers are expected to produce 1.38 billion bushels of winter wheat this year, according to the Crop Production report released today by USDA’s National Agricultural Statistics Service (NASS). In NASS’s first winter wheat production forecast for 2025, production is expected to increase 2% from 2024. As of May 1, the U.S. yield is expected to average 53.7 bushels per acre, up 2.0 bushels from last year’s average of 51.7 bushels per acre.

    Hard Red Winter production is forecast at 784 million bushels, up 2% from a year ago. Soft Red Winter, at 345 million bushels, is expected to increase 1% from 2024. White Winter, at 2.53 million bushels, is up 7% from last year. Of the White Winter production, 20.6 million bushels are Hard White and 232 million bushels are Soft White.

    The U.S. all orange forecast for the 2024-2025 season is 2.46 million tons, up slightly from the previous forecast, and down 8% from the 2023- 2024 final utilization. The Florida all orange forecast, at 11.6 million boxes (521,000 tons), is up less than 1 percent from the previous forecast and down 36% from last season’s final utilization.

    U.S. almond production (shelled basis) is forecast at 2.80 billion pounds, up 3% from the previous year.

    NASS surveyed approximately 8,800 producers across the country in preparation for this Crop Production report. This monthly report contains data for the United States, including area planted and harvested, yield, and production. The report also contains a weather summary, a monthly agricultural summary, and an analysis of precipitation and the degree of departure from the normal precipitation map for the month. All NASS reports are available online at nass.usda.gov.

    Have a question about the Crop Production report? Join #NASS Agricultural Statistics Board Chair Lance Honig for a live #StatChat@usda_nasson X today at 1:30 p.m. EDT.

    MIL OSI USA News

  • MIL-OSI Global: How the weather got ‘stuck’ over the UK – and produced an unusually dry and warm spring

    Source: The Conversation – UK – By Simon H. Lee, Lecturer in Atmospheric Science, University of St Andrews

    Wildfires have ignited in forests and on moorland across the UK in recent months. LSP EM/Shutterstock

    A “blocking” weather system lingering high above the UK has produced one of the driest, warmest and brightest starts to spring on record.

    April 2025 was the sunniest since records began in 1910. This followed the third-sunniest March, and both months saw temperatures well above average nationwide. On May 1, the temperature reached 29.3°C in Kew Gardens in London – a new record for the date.

    Meteorologists are warning of the potential for a summer drought, as the UK has seen roughly half its usual amount of rainfall for March and April. While farmers fret about this year’s harvest, some water companies are urging customers to help reservoir levels recover by limiting water use.

    Meanwhile, wildfires have engulfed forest and moorland in areas of Scotland, Wales and England.

    Most of the UK has experienced a record-dry spring so far.
    Met Office

    For several weeks, a stubborn area of high pressure over the UK has diverted the usual flow of mild, moist air from the North Atlantic like a boulder in a river. This is known as a blocking weather system.

    Within it, air descends, warms and dries, which is why this weather pattern tends to be linked to heatwaves and drought. Blocking is usually persistent, making it seem like the weather is stuck.

    Here’s how climate change may have played a role in setting up this unusual spring.


    Get your news from actual experts, straight to your inbox. Sign up to our daily newsletter to receive all The Conversation UK’s latest coverage of news and research, from politics and business to the arts and sciences. Join The Conversation for free today.


    The human fingerprint

    The warming climate means that unusually warm weather is occurring more often and becoming more intense. At the same time, we can expect more periods of both severe drought and extreme rainfall. Sudden changes from drought to deluge, termed “weather whiplash”, are due to the intensification of the water cycle in a warmer atmosphere that can hold more water vapour.

    However, certain weather patterns are necessary to produce extreme weather. More blocking events in future could increase the chance of heatwaves or drought. But are blocking weather patterns becoming more common?

    It’s difficult to determine how weather patterns will change as a result of the rising concentration of greenhouse gases in the atmosphere, which is predominantly caused by the burning of fossil fuels.

    Part of the difficulty arises from the fact that weather patterns vary year to year. Several years in a row with more blocking events than usual could make it seem like blocking is increasing due to climate change, but it could simply be down to chance.

    As a result, it is difficult to detect the fingerprint of human activity from weather observations alone. For example, blocking weather patterns over Greenland during summer have happened more often in recent decades, which can enhance the melting of the ice sheet. But it isn’t clear that this trend is the result of human-induced climate change.

    Climate models do suggest future changes in the occurrence of blocking, however. These computer simulations, consisting of equations that describe the fundamental physics of the atmosphere, are the main tool scientists use to perform experiments that parse how the climate will behave in future.

    The blocking system is visible in the area of high pressure over Britain and Ireland.
    National Centers for Environmental Prediction/National Center for Atmospheric Research/NOAA Physical Sciences Laboratory, CC BY

    When scientists run climate model simulations with increased greenhouse gas concentrations the results consistently show a decrease in blocking events. But blocking generally happens more often in real life than model simulations, which reduces the confidence scientists have in future projections.

    Keeping track of the jet stream

    The movement of weather systems in Earth’s mid-latitudes – including over the UK – is linked to the jet stream, which is a fast-flowing river of air driven by the contrast in temperature between the poles and mid-latitudes.

    Some researchers have suggested that, because the Arctic is warming faster than the tropics, the jet stream may weaken and become more “wavy”, increasing the occurrence of blocking events, contrary to what most climate models show.

    Outside of the scientific community, this idea has become popular. However, the hypothesis remains controversial among scientists, and observational evidence has weakened in recent years.

    In fact, tens of kilometres above the Earth’s surface, near commercial aircraft cruising altitudes, the opposite trends are occurring: the temperature difference between the Arctic and mid-latitudes is increasing, acting to increase the strength of the jet stream.

    There are considerable challenges with understanding how climate change is affecting the large-scale atmospheric patterns which drive the weather we experience. These include large natural variability and imperfect climate models. Models mostly suggest a decline in blocking events with climate change, though this remains relatively uncertain compared with other aspects of the science.

    Overall, we can be confident that climate change is bringing warmer conditions in all seasons. Scientists also have strong evidence to suggest that drought conditions will become more common. These changes are already affecting food production, energy generation and water availability and these impacts will continue to worsen with climate change.


    Don’t have time to read about climate change as much as you’d like?

    Get a weekly roundup in your inbox instead. Every Wednesday, The Conversation’s environment editor writes Imagine, a short email that goes a little deeper into just one climate issue. Join the 45,000+ readers who’ve subscribed so far.


    Simon H. Lee has received funding from the Natural Environment Research Council and the National Science Foundation.

    Matthew Patterson receives funding from the Natural Environment Research Council in the UK via the the National Centre for Atmospheric Science.

    ref. How the weather got ‘stuck’ over the UK – and produced an unusually dry and warm spring – https://theconversation.com/how-the-weather-got-stuck-over-the-uk-and-produced-an-unusually-dry-and-warm-spring-255987

    MIL OSI – Global Reports

  • MIL-OSI USA: Baldwin Slams Trump Plan to Shutter Agency that Addresses Opioid Epidemic and Provides Mental Health Support

    US Senate News:

    Source: United States Senator for Wisconsin Tammy Baldwin

    WASHINGTON, D.C. – U.S. Senator Tammy Baldwin (D-WI) and her colleagues are condemning the Trump Administration’s proposed dissolution of a core agency responsible for addressing the opioid crisis and providing mental health support to Wisconsin families. Under President Trump’s restructuring plan and the White House Office of Management and Budget’s budget proposal, the Substance Abuse and Mental Health Services Administration (SAMHSA) will be shut down. The Senators expressed deep concerns about the consequences of dismantling SAMHSA, outlined the impacts on the worsening behavioral and mental health crisis, and detailed why the proposal is unlawful.

    “At a time when America is in a dual mental health and substance use crisis, a time when youth suicide is at all-time highs, a time when synthetic opioids are destroying communities and taking lives, this proposed destruction of SAMHSA will harm the American people,” wrote Baldwin and the Senators. “This proposed reorganization and your proposed cuts of over $1 billion to mental health and substance use programs threaten the lives of millions of Americans and appear to violate federal law.”

    According to the National Survey on Drug Use and Health, nearly 50 million Americans aged 12 and older battled a substance use disorder and 58.7 million Americans aged 18 and older experienced a mental illness in 2023. The programs administered by SAMHSA are essential to addressing this national crisis. The Trump Administration’s actions harm the operations of crucial programs, including roughly $7 billion in grant distribution, access to early intervention for mental health care, and support services for crisis care, many of which are statutorily required.

    “SAMHSA, its functions, its role, and many of its positions are clearly outlined and required by federal law. Firing most of SAMHSA’s staff and breaking up SAMHSA appear to violate these statutory requirements,” continued Baldwin and the Senators. “Downsizing SAMHSA into a new ‘division’, dismantling its functions, and firing over half its workforce puts at risk the lives of the 58.7 million Americans who experience a mental health condition and 48.5 million of those who are impacted by a substance use disorder.”

    The Senators emphasized the importance of SAMHSA’s essential work in administering programs including State Opioid Response grants, the National Survey of Drug Use and Health for crucial behavioral health data collection, the Assisted Outpatient Treatment Program for funding community-based care, and FindTreatment.gov for connecting people to mental health care resources, including the 988 Suicide & Crisis Lifeline.

    Furthermore, the Senators stressed that Congress has passed multiple bills creating and expanding SAMHSA’s behavioral and mental health services, and that eliminating SAMHSA would violate the law. The bipartisan Alcohol, Drug Abuse, and Mental Health Administration Reorganization Act (ADAMHA), signed into law by President George H.W. Bush in 1992, established SAMHSA and included requirements for various grant programs and roles that the Trump Administration has proposed eliminating. The ADAMHA Reorganization Act codified additional positions and transferred numerous authorities to SAMHSA.

    Moreover, the 21st Century Cures Act established the Interdepartmental Serious Mental Illness Coordinating Committee through 2027, which the Trump Administration terminated, and codified SAMHSA’s Center for Behavioral Health Statistics and Quality to administer the annual National Survey of Drug Use and Health, but the team responsible for the survey was reportedly eliminated in the mass layoffs.

    The Senators concluded by demanding answers on the Trump Administration’s plans for the continuity of SAMHSA’s statutorily required roles and programs and the impacts of HHS’ restructuring.

    “We demand that HHS not unlawfully dismantle SAMHSA, which would only serve to further exacerbate a growing mental health and substance use disorder crisis,” concluded Baldwin and the Senators.

    The full letter is available here and below.

    Dear Secretary Kennedy,

    We write in strong opposition to the proposed dissolution of the Substance Abuse and Mental Health Administration (SAMHSA) outlined in the Department of Health and Human Services (HHS) fact sheet on March 27, 2025, and by the proposal from the White House Office of Management and Budget. At a time when America is in a dual mental health and substance use crisis, a time when youth suicide is at all-time highs, a time when synthetic opioids are destroying communities and taking lives, this proposed destruction of SAMHSA will harm the American people. This proposed reorganization and your proposed cuts of over $1 billion to mental health and substance use programs threaten the lives of millions of Americans and appear to violate federal law, including the Alcohol, Drug Abuse, and Mental Health Administration (ADAMHA) Reorganization Act and the 21st Century Cures Act.

    President George H.W. Bush signed the bipartisan ADAMHA Reorganization Act into law in 1992. This law formed SAMHSA, a new agency to be the nation’s lead on community-based mental health and substance use disorder prevention, treatment, and recovery services. In addition to creating a variety of grant programs to be administered by SAMHSA, the ADAMHA Reorganization Act created the role of the Assistant Secretary, transferred numerous authorities to SAMHSA, and created Centers and Center Director and Associate Administrator positions. Therefore, SAMHSA, its functions, its role, and many of its positions are clearly outlined and required by federal law. Firing most of SAMHSA’s staff and breaking up SAMHSA appear to violate these statutory requirements.

    SAMHSA leads the government’s efforts to promote mental health, prevent substance misuse, and advance the behavioral health of people across this country. SAMHSA’s programs provide a model for behavioral health care. Downsizing SAMHSA into a new “division”, dismantling its functions, and firing over half its workforce puts at risk the lives of the 58.7 million Americans who experience a mental health condition and 48.5 million of those who are impacted by a substance use disorder.

    The White House Office of Management and Budget HHS Budget Proposal eliminates SAMHSA and creates a new “Mental Health Division”, demotes substance use from its focus, and guts budgets focused on prevention, treatment, and recovery. Amid a dual crisis, this undoes the bipartisan work that Congress and past Administrations have worked to improve. And the federal investments, the expansion of SAMHSA’s work through grant programs and expertise, have worked – for the first time in years, the U.S. has seen a decline in opioid overdose deaths. As the mental health crisis grows, as new synthetic opioids continue to surge, restructuring the agency stands to reverse this historic decline. Now is not the time to change course and risk American lives.

    Congress has passed numerous bills expanding SAMHSA services to reach more Americans. In 2014, the Protecting Access to Medicare Act (PAMA) was signed into law, creating the Assisted Outpatient Treatment (AOT) Program, which funds community-based programs for adults with serious mental illness. This program allows individuals to stay in their community and their homes while also receiving “medically prescribed mental health treatment.” For example, using SAMHSA funds, an AOT program in Montana is working to reduce homelessness and incarceration while improving health and social outcomes for individuals with serious mental illness. Because HHS is dissolving SAMHSA and firing its staff, Montana is in jeopardy of losing the ability to provide their patients with up-to-date, evidence-based services, a key SAMHSA function. Any interruption to the effective delivery of these programs has detrimental consequences.

    In 2016, Congress again prioritized SAMHSA and expanded its services and programming by passing the 21st Century Cures Act. This bill codified SAMHSA’s Center for Behavioral Health Statistics and Quality (CBHSQ), requiring CBHSQ to perform several functions. One of these requirements was to publish an annual report on mental health and substance use disorder , also known as the National Survey of Drug Use and Health (NSDUH). NSDUH is the only source of behavioral health data for people 12 and older in the U.S. and is a critical tool to combat these dual crises. Without this data, states would not be able to implement State Opioid Response grants with fidelity.

    The State Opioid Response (SOR) grant was created to address the overdose crisis, which is now driven by illicit fentanyl, and is meant to help states provide a continuum of care, including prevention, harm reduction, treatment, and recovery services. Funding to support states in combating this epidemic is critical, especially as the crisis is exacerbated by other synthetic opioids. States use SOR funding to purchase and distribute naloxone, test strips, buprenorphine, and much more. SOR is proven to be effective – in 2023, the percentage of people who did not use substances increased by 29.7 percent. SOR funding and NSDUH data give states the ability to purchase these medications, implement these programs, and track outcomes. Reports suggest the entire team running NSDUH was fired on April 1, 2025. Without NSDUH data, states will have inaccurate information on how opioids are affecting their communities, which will result in a lack of resources, incomplete strategies, and an increase in deaths.

    In addition to data collection, CBHSQ is responsible for operating FindTreatment.gov, a critical tool where individuals can find treatment for mental health and substance use disorder care. Launched in 2019 under the first Trump Administration, FindTreatment.gov provides individuals with resources in their communities and connects those in crisis with helplines, including the 988 Suicide & Crisis Lifeline. Without adequate staffing of FindTreatment.gov, people across this country are left stranded, not knowing where to turn to find treatment and services. The mass terminations at SAMHSA’s CBHSQ and HHS’s announced reorganization make unclear who is operating and overseeing this program that President Trump proudly launched. It is unclear how HHS can now live up to its claim of continuing “to support people who seek substance use treatment on their journey to recovery.”

    The 21st Century Cures Act not only expanded data collection but also improved interdepartmental coordination, something that you claim to prioritize. This bill established the first ever Interdepartmental Serious Mental Illness Coordinating Committee (ISMICC) to better direct mental health services for adults and children with a serious mental illness. ISMICC is tasked with evaluating the effects of federal programs, including programs for suicide prevention and overdose reduction, so they can provide “recommendations for actions that agencies can take to better coordinate the administration of mental health services.” By law, ISMICC must be operating to achieve these goals through at least September 30, 2027. However, HHS terminated ISMICC on April 9, 2025. By dismissing ISMICC, HHS is actively putting people in crisis at risk and violating a statutory requirement to protect the American people.

    We demand that HHS not unlawfully dismantle SAMHSA, which would only serve to further exacerbate a growing mental health and substance use disorder crisis. To better understand HHS’s plans and statutory compliance, we request responses to the following questions by May 16, 2025.

    1. Per the 21st Century Cures Act, SAMHSA is required to have an Assistant Secretary, a Chief Medical Officer, and a Director, with specific qualifications, at each of its four mandated Centers – the Center for Substance Abuse Treatment, the Center for Substance Abuse Prevention, the Center for Mental Health Services, and CBHSQ.
      1. Who is currently serving in these roles, and what are their qualifications?
      1. Have any of the people in these roles been subject to the reduction in force that occurred on April 1, 2025? If so, please explain why these legally mandated positions were part of the reduction.
      1. What is HHS’s plan to maintain these positions and centers under the restructuring at HHS?
    1. SAMHSA is required to have Associate Administrators for Alcohol Prevention and Treatment Policy and Women’s Services.
      1. Who is currently serving in these roles, and what are their qualifications?
      1. Have any of the people in these roles been subject to the reduction in force that occurred on April 1, 2025? If so, please explain why these legally mandated positions were part of the reduction.
      1. What is HHS’s plan to maintain these positions under the restructuring at HHS?
    1. SAMHSA is required to have a National Mental Health and Substance Use Policy Laboratory to coordinate policy changes, review programs, identify duplication, and more.
      1. Please provide a list of all employees in SAMHSA’s Policy Laboratory as of January 19, 2025, and as of April 15, 2025, including job title and General Schedule rank. Please indicate which staff were part of the reduction in force that occurred on April 1, 2025.
      1. How did HHS determine that the proposed restructuring will not prevent fulfilling these statutory duties?
    1. Which Centers and Branches are overseeing each of SAMHSA’s grant programs, including AOT? Please provide the number of employees currently employed for each Center and Branch, and the number of grants each employee is required to supervise.
    1. Who is overseeing each of CBHSQ’s data collection and roles, including NSDUH and FindTreatment.gov? Please provide a list of staff working on each service and provide their qualifications.
    1. Is NSDUH data still being collected through its contract with RTI International?
      1. Does HHS plan to continue its contract with RTI International and ensure all payments are received promptly?
      1. Has there been any break in data collection since January 20, 2025? If so, why, and what did HHS do to restore any missing information?
    1. Why did HHS terminate statutorily-required ISMICC?
      1. When will ISMICC be restored?
    1. What is HHS’s long-term plan with SAMHSA under the restructuring? Please explain how HHS plans to remain in compliance with all relevant statutes under this restructure.
    1. Explain how your decision to dissolve SAMHSA into a “division” will increase efficacy and improve mental health and substance use disorder outcomes for Americans.

    Thank you for your attention to this urgent matter.

    MIL OSI USA News

  • MIL-OSI Canada: Economic Development Week Celebrates Saskatchewan’s Strong Economy

    Source: Government of Canada regional news

    Released on May 12, 2025

    The Government of Saskatchewan has proclaimed May 11 to May 17 as Economic Development Week in the province. The week focuses on the crucial role of Saskatchewan businesses and economic development organizations in growing and creating opportunities in the province.

    “The work that our business community has been doing across the province, has led to strong investment and economic growth in recent years,” Trade and Export Development Minister Warren Kaeding said. “Businesses, and investors, are choosing Saskatchewan because of our low tax rates, our transparent regulatory environment and the strong suite of incentives with personalized support that we offer.”

    Private capital investment in Saskatchewan increased last year by 17.3 per cent to $14.7 billion, ranking first among provinces for growth. This influx of investment is creating jobs and opportunities for the people of the province and is leading to a better quality of life for all Saskatchewan citizens. 

    “Today, we recognize that economic development is an ongoing process rather than a result,” SEDA Chief Executive Officer Verona Thibault said. “It is a process that aims to improve socioeconomic wellbeing, resulting in wealth generation, job creation and community renewal. We celebrate leaders and community builders across Saskatchewan who invest their skills and resources to ensure our local and provincial prosperity.” 

    Saskatchewan is committed to fostering a competitive business environment where all businesses can succeed. Through its network of nine international offices, the province is able to attract investment from all over the world, while seeking new markets for its goods. 

    The strong entrepreneurial spirit that exists in Saskatchewan has led to some significant economic successes recently. The value of Saskatchewan exports increased from $17 billion in 2007 to nearly $50 billion on average over the past 3 years. 

    Statistics Canada’s latest GDP numbers also indicate that Saskatchewan’s 2024 real GDP reached an all-time high of $80.5 billion. This represents an increase of 3.4 per cent, which ranks second in terms of percentage change among the provinces. 

    As part of Economic Development Week, May 12 was proclaimed Indigenous Economic Development Day. The day highlights the impact that increased Indigenous participation in the provincial economy has on creating jobs, opportunities and improving the lives of all Saskatchewan people. 

    -30-

    For more information, contact:

    MIL OSI Canada News

  • MIL-OSI Africa: Crime affects everyone, not only certain groups: Lamola

    Source: South Africa News Agency

    International Relations and Cooperation Minister Ronald Lamola has firmly denied allegations of persecution against white South Africans, especially white farmers. 

    This is after a group of 49 Afrikaners left South Africa on Sunday after being granted refugee status by the Trump administration, following claims that they were “victims of unjust racial discrimination“.

    The group is expected to arrive at the Dulles International Airport in Virginia on Monday. 

    Addressing a media briefing in Pretoria on Monday on South Africa’s G20 Presidency, Lamola said the South African government refutes the claim that white South Africans are persecuted and qualify as refugees. 

    “We have stated… that, in line with the international definition, they do not qualify for that status, according to us, and there is no persecution of Afrikaners in South Africa.” 

    Lamola said that crime in South Africa affects all citizens regardless of race, and there is no systematic targeting of Afrikaners.

    “Crime in South Africa affects everyone, irrespective of race and gender. There is a more pronounced crime that we are dealing with, which the President has declared a pandemic, [and that] is… gender-based violence, which is a societal challenge that we have to respond to. 

    “But there’s no danger at all that backs that there is persecution of white South Africans or Afrikaners (sic).” 

    The Minister said police statistics do not support claims of racial persecution, and that crime is a national challenge affecting all South Africans. 

    “In fact, more farm dwellers are also affected by crime, and white farmers do get [more] affected by crime, just like any other South African who gets affected by crime. So this is not factual… and [it is] without basis.” 

    On the question of whether these “refugees” have been vetted, Lamola said there was a process they had to undergo involving the South African Police Service (SAPS), such as checking all their criminal records. 

    “As I’ve said earlier, they can’t provide any proof of prosecution because there’s none… And we’re glad that a number of organisations, even from Afrikaner structures, have denounced this so-called ‘persecution’.”

    Lamola stated that where there are challenges, there are platforms to resolve them within the South African context, making this a domestic issue.

    “Our legislation provides sufficient platforms for any issue to be ventilated in that regard, and white South Africans, including Afrikaners, have voiced their views in this regard, and we welcome that as the government of South Africa. We encourage more of such engagements and platforms to clarify on the world stage this disinformation.” 

    The Minister took the time to denounce the notion of persecution and highlighted domestic platforms for resolving issues. 

    Regarding the Group of 20 (G20) Leaders’ Summit set for later this year, he said all members are invited, and that the participation of the United States and Russia is left to their discretion. 

    Meanwhile, Lamola announced that South Africa has extended invitations to African countries and other global entities, with any further invitations requiring consensus among G20 members. – SAnews.gov.za

    MIL OSI Africa

  • MIL-OSI Global: What causes inequality in African countries? New book traces a vicious cycle

    Source: The Conversation – Africa – By Murray Leibbrandt, UCT Chair in Poverty and Inequality Research; Director of ARUA’s African Centre of Excellence for Inequality Resaearch with the Southern Africa Labour and Development Research Unit., University of Cape Town

    Inequality is a problem that exists in various forms in sub-Saharan Africa.

    Inequality is created by, among other factors, where you are born and live. Alongside this, income, assets, and access to education and healthcare differ among and between populations. These inequalities reinforce each other. The result is persistent poverty, lack of social mobility across generations, increased exposure to climate change, and a lack of inclusive economic growth.

    Our recently published book Inequalities in Sub-Saharan Africa: Multidimensional Perspectives and Future Challenges presents an overview of the current situation. It identifies the key dimensions, challenges and causes of inequalities in the region. The book also proposes some solutions for equitable and sustainable development. These include progressive taxation and policies that address inequalities at their roots.

    The impact of inequality

    Migration: On a global scale, the greatest determinant of individual incomes – and thus of inequalities between individuals – is place of birth. More than half of income’s variability is explained by the country of residence and by the given circumstances at birth. These include being born in a rural environment.

    In sub-Saharan Africa, especially in low-income countries, internal migration remains the most prevalent migration pattern. Migration is often the chosen route for people seeking to escape poverty. The rural exodus that characterises many countries in sub-Saharan Africa illustrates this well. Young people in Africa, faced with high unemployment rates, often see migration as the only opportunity for social mobility.

    The dynamics of international migration are more complex. Given the high costs involved, international migration concerns only 2.5% of the population in sub-Saharan Africa. This is mostly intra-continental.

    Labour market: Access to the labour market remains the main
    determinant of inequalities in sub-Saharan Africa.

    Labour markets in the region are characterised by high proportions of informal employment. Formal sectors are relatively small (about 15% of total employment on the continent). Since the turn of the century, countries like Kenya have seen their share of informal employment increase significantly (from 73% in 2001 to 83% in 2017). At the same time formal wage employment has declined.

    This amplifies inequality because the informal sector is characterised by a lack of protection and high vulnerability. But not all informal activities are precarious. Some serve as springboards into formal jobs.

    In the formal sector, wage inequality in Africa is among the highest in the world.
    In South Africa, workers in high-skilled jobs earn nearly five times more than those in low-skilled jobs.

    Young people entering the labour market have much higher unemployment rates and little chance of regular employment.

    Gender inequality: Many gender inequalities persist, particularly access to the labour market. Unpaid care work makes women’s work invisible. In many African countries, women and girls spend more time on unpaid care which limits their economic opportunities.

    These inequalities are reinforced by inequalities in access to resources. About 38% of African women report owning land, compared to 51% of African men.

    Climate change: Africa is suffering the most severe impacts – droughts, floods and food insecurity – while contributing less than 5% of global carbon emissions.

    Arid conditions affect 43.5% of agricultural land in sub-Saharan Africa compared to an estimated global average of 29%. Similarly, climate change mitigation costs, such as finding alternatives to hydroelectric power, are higher for low-income countries.

    In sub-Saharan Africa, the richest 10% emit seven times more tonnes of carbon dioxide than the poorest 50%. Disadvantaged groups are more vulnerable to adverse climate effects as their housing and wealth are more likely to be damaged by storms and floods.

    Skewed economic growth benefits: Economic growth has led to notably lower reductions in poverty in African countries than elsewhere. Unequal distribution of growth and its capture by those at the top of the income distribution ladder are evidence of non-inclusive economic growth. The richest 1% of Africans received 27% of the total revenue from growth on the continent.

    What needs to be done

    It is vital to give priority to promoting social and economic inclusion in the development strategies of African countries. Importantly, multidimensional inequalities such as income and health persist because they reinforce each other. Tackling them therefore requires coordinated and coherent policies.

    Murray Leibbrandt receives funding from the National Research Foundation of South Africa, the Agence Française de Développement, UK Research and Innovation, the World Institute for Development Economics Research and the International Inequalities Institute of the London School of Economics. He is affiliated with the United Nations University’s World Institute for Development Economics Research and the Jackson School of Global Affairs at Yale University.

    Anda David, Rawane Yasser, and Vimal Ranchhod do not work for, consult, own shares in or receive funding from any company or organisation that would benefit from this article, and have disclosed no relevant affiliations beyond their academic appointment.

    ref. What causes inequality in African countries? New book traces a vicious cycle – https://theconversation.com/what-causes-inequality-in-african-countries-new-book-traces-a-vicious-cycle-253376

    MIL OSI – Global Reports

  • MIL-OSI Africa: What causes inequality in African countries? New book traces a vicious cycle

    Source: The Conversation – Africa – By Murray Leibbrandt, UCT Chair in Poverty and Inequality Research; Director of ARUA’s African Centre of Excellence for Inequality Resaearch with the Southern Africa Labour and Development Research Unit., University of Cape Town

    Inequality is a problem that exists in various forms in sub-Saharan Africa.

    Inequality is created by, among other factors, where you are born and live. Alongside this, income, assets, and access to education and healthcare differ among and between populations. These inequalities reinforce each other. The result is persistent poverty, lack of social mobility across generations, increased exposure to climate change, and a lack of inclusive economic growth.

    Our recently published book Inequalities in Sub-Saharan Africa: Multidimensional Perspectives and Future Challenges presents an overview of the current situation. It identifies the key dimensions, challenges and causes of inequalities in the region. The book also proposes some solutions for equitable and sustainable development. These include progressive taxation and policies that address inequalities at their roots.

    The impact of inequality

    Migration: On a global scale, the greatest determinant of individual incomes – and thus of inequalities between individuals – is place of birth. More than half of income’s variability is explained by the country of residence and by the given circumstances at birth. These include being born in a rural environment.

    In sub-Saharan Africa, especially in low-income countries, internal migration remains the most prevalent migration pattern. Migration is often the chosen route for people seeking to escape poverty. The rural exodus that characterises many countries in sub-Saharan Africa illustrates this well. Young people in Africa, faced with high unemployment rates, often see migration as the only opportunity for social mobility.

    The dynamics of international migration are more complex. Given the high costs involved, international migration concerns only 2.5% of the population in sub-Saharan Africa. This is mostly intra-continental.

    Labour market: Access to the labour market remains the main determinant of inequalities in sub-Saharan Africa.

    Labour markets in the region are characterised by high proportions of informal employment. Formal sectors are relatively small (about 15% of total employment on the continent). Since the turn of the century, countries like Kenya have seen their share of informal employment increase significantly (from 73% in 2001 to 83% in 2017). At the same time formal wage employment has declined.

    This amplifies inequality because the informal sector is characterised by a lack of protection and high vulnerability. But not all informal activities are precarious. Some serve as springboards into formal jobs.

    In the formal sector, wage inequality in Africa is among the highest in the world. In South Africa, workers in high-skilled jobs earn nearly five times more than those in low-skilled jobs.

    Young people entering the labour market have much higher unemployment rates and little chance of regular employment.

    Gender inequality: Many gender inequalities persist, particularly access to the labour market. Unpaid care work makes women’s work invisible. In many African countries, women and girls spend more time on unpaid care which limits their economic opportunities.

    These inequalities are reinforced by inequalities in access to resources. About 38% of African women report owning land, compared to 51% of African men.

    Climate change: Africa is suffering the most severe impacts – droughts, floods and food insecurity – while contributing less than 5% of global carbon emissions.

    Arid conditions affect 43.5% of agricultural land in sub-Saharan Africa compared to an estimated global average of 29%. Similarly, climate change mitigation costs, such as finding alternatives to hydroelectric power, are higher for low-income countries.

    In sub-Saharan Africa, the richest 10% emit seven times more tonnes of carbon dioxide than the poorest 50%. Disadvantaged groups are more vulnerable to adverse climate effects as their housing and wealth are more likely to be damaged by storms and floods.

    Skewed economic growth benefits: Economic growth has led to notably lower reductions in poverty in African countries than elsewhere. Unequal distribution of growth and its capture by those at the top of the income distribution ladder are evidence of non-inclusive economic growth. The richest 1% of Africans received 27% of the total revenue from growth on the continent.

    What needs to be done

    It is vital to give priority to promoting social and economic inclusion in the development strategies of African countries. Importantly, multidimensional inequalities such as income and health persist because they reinforce each other. Tackling them therefore requires coordinated and coherent policies.

    – What causes inequality in African countries? New book traces a vicious cycle
    – https://theconversation.com/what-causes-inequality-in-african-countries-new-book-traces-a-vicious-cycle-253376

    MIL OSI Africa

  • MIL-OSI Global: If you really want to close the US trade deficit, try boosting innovation in rural manufacturing

    Source: The Conversation – USA – By Amitrajeet A. Batabyal, Distinguished Professor, Arthur J. Gosnell Professor of Economics, & Interim Head, Department of Sustainability, Rochester Institute of Technology

    President Donald Trump has long been preoccupied by the trade deficit — the gap between what the U.S. sells to the rest of the world and what it buys from it. He recently declared the issue a national emergency and used trade deficit data to calculate so-called “reciprocal tariffs” targeting nearly 100 countries. Although those specific tariffs are now on pause, Trump’s concern with the trade deficit persists.

    As an economist, I know there are two basic ways for a country to reduce a trade deficit: import less or export more. While Trump has focused on the former strategy, a more productive path may lie in the latter – especially by looking at untapped opportunities in rural America.

    Economists have long studied the differences between rural and urban regions. But while research shows that urban areas tend to be more technologically advanced, fast-growing and economically dynamic, economists have historically paid less attention to how regional differences affect export performance.

    New research is starting to fill that gap. Economists recently found that urban businesses export significantly more than rural ones – a difference with significant implications for national trade.

    The urban-rural export gap

    Looking at data from the Census Bureau’s Annual Business Survey as well as trade statistics from 2017 to 2020, researchers used econometric techniques to measure the urban-rural export gap. They also examined two categories of potential causes – “explained” and “unexplained.”

    The first is due to differences in what economists call “endowments” – for example, a region’s digital infrastructure, its access to renewable energy and its opportunities for high-tech employment. These endowments can be observed and therefore explained.

    The second is due to what economists call “structural advantage.” This refers to attributes of a region that matter for export performance but can’t be observed and, as a result, remain unexplained.

    They found that most of the urban-rural export gap is due to explained differences. That means rural businesses could close the export gap if they were provided with similar endowments – meaning comparable access to renewable energy, similar digital infrastructure and analogous opportunities for high-tech employment – to their urban counterparts.

    Even more strikingly, the unexplained component was negative – which means rural businesses outperform expectations given their characteristics. That suggests rural regions have significant untapped export potential.

    Several factors collectively account for the urban export advantage. First, urban regions have a greater concentration of highly educated science and technology workers. Urban businesses also tend to be larger and more tech-savvy, and because they have better access to broadband, they use cloud technology more frequently. Urban areas also have more foreign-born business owners who may leverage their international networks.

    However, many of these differences suggest possible policy solutions. For instance, since cloud adoption depends on broadband availability, it follows that investing in digital infrastructure could boost rural exports. Also, rural manufacturers, especially in sectors like metals manufacturing, show comparable or higher export intensity per worker than their urban counterparts. So encouraging rural manufacturing would be one way to reduce the urban-rural export gap.

    Rethinking trade and rural development

    I think this research has important policy implications.

    First, it shifts some of the focus away from other countries as the root cause of the trade deficit. And second, it bolsters the case for what economists call “place-based policies” targeting specific geographic areas – as opposed to “people-based policies,” which provide support directly to individuals.

    Even though many economists dislike place-based policies, they are increasingly attracting both academic and governmental attention.

    The 2022 CHIPS and Science Act had special significance to rural areas.

    During the Biden administration, three major laws – the Inflation Reduction Act, the CHIPS and Science Act and the Infrastructure Investment and Jobs Act – directed significant federal funds to rural areas. About 43% of funds from those laws – or US$440 billion – was designated as either “rural relevant” or as “rural stipulated,” meaning the funds were either geographically targeted or designed to address disproportionately rural challenges.

    Such massive investments in rural regions have led researchers and policymakers to question whether rural export underperformance stems from differences in observable endowments – in other words, things like access to broadband – or from inherent disadvantages that are much harder to deal with.

    In my view, this research provides compelling evidence that much of the urban-rural export gap is due to unequal distribution of productive assets, rather than inherent rural disadvantages. With appropriate investments in digital infrastructure, human capital and support for export-capable industries, America’s rural regions could play a much larger role in global trade. These findings also suggest the value of continued federal support for rural development efforts.

    In other words, if the U.S. wants to shrink its trade deficit, one answer could be more innovation in rural manufacturing.

    Amitrajeet A. Batabyal does not work for, consult, own shares in or receive funding from any company or organization that would benefit from this article, and has disclosed no relevant affiliations beyond their academic appointment.

    ref. If you really want to close the US trade deficit, try boosting innovation in rural manufacturing – https://theconversation.com/if-you-really-want-to-close-the-us-trade-deficit-try-boosting-innovation-in-rural-manufacturing-255851

    MIL OSI – Global Reports

  • MIL-Evening Report: If you really want to close the US trade deficit, try boosting innovation in rural manufacturing

    Source: The Conversation (Au and NZ) – By Amitrajeet A. Batabyal, Distinguished Professor, Arthur J. Gosnell Professor of Economics, & Interim Head, Department of Sustainability, Rochester Institute of Technology

    President Donald Trump has long been preoccupied by the trade deficit — the gap between what the U.S. sells to the rest of the world and what it buys from it. He recently declared the issue a national emergency and used trade deficit data to calculate so-called “reciprocal tariffs” targeting nearly 100 countries. Although those specific tariffs are now on pause, Trump’s concern with the trade deficit persists.

    As an economist, I know there are two basic ways for a country to reduce a trade deficit: import less or export more. While Trump has focused on the former strategy, a more productive path may lie in the latter – especially by looking at untapped opportunities in rural America.

    Economists have long studied the differences between rural and urban regions. But while research shows that urban areas tend to be more technologically advanced, fast-growing and economically dynamic, economists have historically paid less attention to how regional differences affect export performance.

    New research is starting to fill that gap. Economists recently found that urban businesses export significantly more than rural ones – a difference with significant implications for national trade.

    The urban-rural export gap

    Looking at data from the Census Bureau’s Annual Business Survey as well as trade statistics from 2017 to 2020, researchers used econometric techniques to measure the urban-rural export gap. They also examined two categories of potential causes – “explained” and “unexplained.”

    The first is due to differences in what economists call “endowments” – for example, a region’s digital infrastructure, its access to renewable energy and its opportunities for high-tech employment. These endowments can be observed and therefore explained.

    The second is due to what economists call “structural advantage.” This refers to attributes of a region that matter for export performance but can’t be observed and, as a result, remain unexplained.

    They found that most of the urban-rural export gap is due to explained differences. That means rural businesses could close the export gap if they were provided with similar endowments – meaning comparable access to renewable energy, similar digital infrastructure and analogous opportunities for high-tech employment – to their urban counterparts.

    Even more strikingly, the unexplained component was negative – which means rural businesses outperform expectations given their characteristics. That suggests rural regions have significant untapped export potential.

    Several factors collectively account for the urban export advantage. First, urban regions have a greater concentration of highly educated science and technology workers. Urban businesses also tend to be larger and more tech-savvy, and because they have better access to broadband, they use cloud technology more frequently. Urban areas also have more foreign-born business owners who may leverage their international networks.

    However, many of these differences suggest possible policy solutions. For instance, since cloud adoption depends on broadband availability, it follows that investing in digital infrastructure could boost rural exports. Also, rural manufacturers, especially in sectors like metals manufacturing, show comparable or higher export intensity per worker than their urban counterparts. So encouraging rural manufacturing would be one way to reduce the urban-rural export gap.

    Rethinking trade and rural development

    I think this research has important policy implications.

    First, it shifts some of the focus away from other countries as the root cause of the trade deficit. And second, it bolsters the case for what economists call “place-based policies” targeting specific geographic areas – as opposed to “people-based policies,” which provide support directly to individuals.

    Even though many economists dislike place-based policies, they are increasingly attracting both academic and governmental attention.

    The 2022 CHIPS and Science Act had special significance to rural areas.

    During the Biden administration, three major laws – the Inflation Reduction Act, the CHIPS and Science Act and the Infrastructure Investment and Jobs Act – directed significant federal funds to rural areas. About 43% of funds from those laws – or US$440 billion – was designated as either “rural relevant” or as “rural stipulated,” meaning the funds were either geographically targeted or designed to address disproportionately rural challenges.

    Such massive investments in rural regions have led researchers and policymakers to question whether rural export underperformance stems from differences in observable endowments – in other words, things like access to broadband – or from inherent disadvantages that are much harder to deal with.

    In my view, this research provides compelling evidence that much of the urban-rural export gap is due to unequal distribution of productive assets, rather than inherent rural disadvantages. With appropriate investments in digital infrastructure, human capital and support for export-capable industries, America’s rural regions could play a much larger role in global trade. These findings also suggest the value of continued federal support for rural development efforts.

    In other words, if the U.S. wants to shrink its trade deficit, one answer could be more innovation in rural manufacturing.

    Amitrajeet A. Batabyal does not work for, consult, own shares in or receive funding from any company or organization that would benefit from this article, and has disclosed no relevant affiliations beyond their academic appointment.

    ref. If you really want to close the US trade deficit, try boosting innovation in rural manufacturing – https://theconversation.com/if-you-really-want-to-close-the-us-trade-deficit-try-boosting-innovation-in-rural-manufacturing-255851

    MIL OSI AnalysisEveningReport.nz

  • MIL-OSI: Sprott Physical Uranium Trust Raises US$25.55 Million Through Non-Brokered Private Placement

    Source: GlobeNewswire (MIL-OSI)

    TORONTO, May 12, 2025 (GLOBE NEWSWIRE) — Sprott Inc. (NYSE/TSX: SII) (“Sprott”) on behalf of the Sprott Physical Uranium Trust (TSX: U.UN) (TSX: U.U) (“SPUT” or the “Trust”) today announced that SPUT has completed a US$25.55 million non-brokered private placement of trust units. The proceeds are expected to be used to cover general operating expenses of the Trust for the next year.

    “We launched SPUT with the objective of providing investors with the most liquid and efficient way to invest in physical uranium,” said John Ciampaglia, CEO of Sprott Asset Management. “Since the Trust was launched in 2021, it has purchased approximately 48 million pounds of U3O8 and not sold or loaned out a single pound. I would like to take this opportunity to strongly reiterate that SPUT has the tools, including this private placement, to deliver on its intention not to sell any of the physical uranium that SPUT holds on behalf of thousands of investors. Sprott Asset Management participated in this placement alongside the subscribers and we thank all our unitholders for their continued support of SPUT.”

    Key SPUT Statistics Pro Forma for the Offering:

    • World’s largest physical uranium fund1
    • 66.2 million pounds of physical uranium in U3O8 form
    • US$31.4 million of net cash
    • Net asset value of US$4.64 billion
    • Storage locations in Canada, the United States and France

    About Sprott

    Sprott is a global asset manager focused on precious metals and critical materials investments. We are specialists. We believe our in-depth knowledge, experience and relationships separate us from the generalists. Our investment strategies include Exchange Listed Products, Managed Equities and Private Strategies. Sprott has offices in Toronto, New York, Connecticut and California and the company’s common shares are listed on the New York Stock Exchange and the Toronto Stock Exchange under the symbol “SII”. For more information, please visit www.sprott.com.

    About SPUT

    Important information about SPUT, including its investment objectives and strategies, applicable management fees, and expenses, can be found on its website at www.sprott.com. Commissions, management fees, or other charges and expenses may be associated with investing in the Trust. The performance of the Trust is not guaranteed, its value changes frequently and past performance is not an indication of future results.

    Caution Regarding Forward-Looking Statements

    This press release contains forward-looking information within the meaning of applicable Canadian securities laws (“forward looking statements”). Forward-looking statements in this press release include, without limitation, the intended use of proceeds and the Trust’s intentions with respect to the sale of physical uranium. With respect to the forward-looking statements contained in this press release, the Trust has made numerous assumptions regarding, among other things: the uranium and nuclear energy market. While the Trust considers these assumptions to be reasonable, these assumptions are inherently subject to significant business, economic, competitive, market and social uncertainties and contingencies. Additionally, there are known and unknown risk factors that could cause the Trust’s actual results, performance or achievements to be materially different from any future results, performance or achievements expressed or implied by the forward-looking statements contained in this press release. A discussion of risks and uncertainties facing the Trust appears in the Trust’s continuous disclosure filings, which are available at www.sedarplus.ca. All forward-looking statements herein are qualified in their entirety by this cautionary statement, and the Trust disclaims any obligation to revise or update any such forward-looking statements or to publicly announce the result of any revisions to any of the forward-looking statements contained herein to reflect future results, events or developments, except as required by law.

    Investor Contact:

    Glen Williams
    Senior Managing Partner
    Investor and Institutional Client Relations
    Direct: 416-943-4394
    gwilliams@sprott.com

    ________________________
    1
    Based on Morningstar’s universe of listed commodity funds. Data as of 12/31/2024.

    The MIL Network

  • MIL-OSI Asia-Pac: Speech by SLW at plenary session of Seventh APEC Human Resources Development Ministerial Meeting (2) (English only) (with photo)

    Source: Hong Kong Government special administrative region

    Speech by SLW at plenary session of Seventh APEC Human Resources Development Ministerial Meeting (2) (English only) (with photo) 
    Good afternoon, chair and distinguished fellow ministers,
     
    It is a privilege to speak before this distinguished assembly on a topic of paramount importance to the continued success of every economy. That is talent and manpower. In our fast-paced and ever-changing world, an economy’s ability to adapt and succeed hinges on the dynamism and resilience of its workforce and how well it responds to the demands of future jobs.
     
    Based on our forecast, Hong Kong, China would face an overall manpower shortage of 180 000 in 2028, with over one-third being skilled technical workers. Broader trends such as economic restructuring, technology advancement, business automation and digitalisation across industries would alter demand for job roles and skills in the market. According to a study by the IMF (International Monetary Fund), nearly 40 per cent of jobs globally are likely to be impacted by AI, in particular in high-skill sectors.
     
    It is necessary for our workforce to continuously equip themselves with new and relevant skills to stay competitive in the evolving job market. This includes acquiring AI-related competencies, digital skills and other technical expertise that are increasingly in demand. At the same time, workers must also strengthen their adaptability, embrace lifelong learning and be open to change.
     
    Hong Kong, China makes significant investment in education to provide our young people with diversified and quality education and promote whole-person development. The huge investment we make in education allows the young to choose their own articulation pathways and join different industries according to their interests and abilities.
     
    To further elevate the status of vocational and professional education and training, we are pressing ahead with the establishment of universities of applied sciences (UAS), providing a pathway to success for young people who aspire to pursue a career in professional skilled sectors. The Hong Kong Metropolitan University and Saint Francis University were qualified as the first two UAS in Hong Kong, China.
     
    We have also supported the Vocational Training Council to provide a comprehensive system of vocational education and training services. The council offers more than 1 000 in-service training short courses annually to upgrade skills and knowledge with over a hundred thousand of student enrolments every year. Furthermore, the Employees Retraining Board provides eligible trainees with market-driven and employment-oriented courses to assist them in joining or rejoining the labour market. The Board currently offers more than 700 training courses straddling 28 industry areas.
     
    To address the challenges of the ageing population and shortage of manpower supply, Hong Kong, China has implemented various well-received talent attraction measures since end-2022. The statistics of admission applications prove that Hong Kong, China is the preferred destination for outside talent. As at end-March 2025, we received over 460 000 new applications and approved over 300 000 cases. 
     
    To build a quality talent pool for future development, we are reforming various aspects of our talent admission regime. We will shortly invite top and leading talent to come to Hong Kong, China for development so as to better realise our role as an international hub for high calibre talent. We will also allow young non-degree talent with professional and technical qualifications and experience to come to Hong Kong, China to join trades facing manpower shortage.
     
    Looking ahead, Hong Kong, China will closely monitor the employment market, continuously review manpower policies, strengthen training and employment support and encourage employers to provide a favourable work environment with a view to facilitating greater participation in the labour market and fostering sustainable economic development.
     
    Thank you.
    Issued at HKT 15:40

    NNNN

    MIL OSI Asia Pacific News

  • MIL-OSI Russia: Polytechnic athletes’ successes in April

    Translation. Region: Russian Federal

    Source: Peter the Great St Petersburg Polytechnic University – Peter the Great St Petersburg Polytechnic University –

    April was a busy month for the Polytechnic University athletes. Teams and individual participants showed outstanding results in competitions of various levels, adding many awards to the university’s collection.

    The most striking victory of this month was the performance of the assistant of the Higher School of Sports Education of the Institute of Physical Culture and Sport and Tourism Kirill Prigoda at the Russian Championship in Kazan. The three-time bronze medalist of the World Championship showed the best result in the 200 meters backstroke. His time was 2.08.55.

    From April 4 to 6, the Snezhny ski resort hosted the St. Petersburg Student Alpine Skiing and Snowboarding Competition. Polytechnicians came in second in the overall team standings in alpine skiing, Elizaveta Zvyagina showed the best result, Ekaterina Nikiforova took 3rd place. In snowboarding, the university won bronze in the overall team standings, Alexander Maslov won the gold medal.

    From April 15 to 17, the SPbPU football team participated in the first round of the XI season of the NSFL (Group A). The Polytechnicians won three victories in three matches:

    SPbPU – SevGU (Sevastopol) – 2:1; SPbPU – North Caucasian Federal University (Stavropol) – 3:1; SPbPU – ASU (Astrakhan) – 3:0.

    The hockey club “Black Bears – Polytech” once again became the winner of the St. Petersburg championship among students. During the competition, forward Maxim Pastukhov celebrated a double anniversary – five years in the student league and five championship titles. From April 22 to 27, in the all-Russian final, the Polytech team showed a brilliant game, winning in overtime. The best goalkeeper was Bogdan Olikhin, the forward was Yaroslav Abornev, the coach was Roman Mikhalchenko.

    On April 20, the Peter the Great SPbPU Kettlebell Lifting Cup competition was held, dedicated to the memory of L. A. Chaplinsky. Arina Gudkova showed the best result in the snatch (12 kg, 110 lifts), Daniil Grinyuk became the leader in the long-cycle kettlebell push (16 kg, 65 lifts). As a result, SPbPU took 1st place in the overall team standings.

    Polytechnic University also became the strongest university in the arm wrestling tournament, in which 218 athletes from universities and colleges of St. Petersburg participated. Alexander Kokorkin (55 kg), Artur Vareldzhyan (70 kg) and Anton Gagin (75 kg) took 1st place. Artem Androsov (75 kg), Maksim Cherkasov (65 kg) and Danil Tiranov (85 kg) showed the second result. Kirill Ratlov (over 90 kg) and Sergey Ryzhov (80 kg) won the bronze medal.

    From April 14 to 19, the St. Petersburg Junior Boxing Championships for boys and girls aged 19-22 were held. 81 athletes from 16 clubs in St. Petersburg took part in the competition. Our athletes fought brightly and confidently. The winners were Sofia Karyakina, Evgenia Frolova, Sofia Argandeikina, Ksenia Chistyakova and Maria Bolyshkanova. Elizaveta Kadantseva took 2nd place.

    This year, the women’s volleyball team debuted at the city championship and showed an excellent result, taking 2nd place among eight teams. The guys came out of the group in third place, but in the final they were only fourth.

    The SPbPU women’s basketball team successfully passed the LAST 28 stage of the Student Basketball Association (SBA) Cup — the main student basketball tournament in Russia. Following the games, the team made it to the final eight of the country’s strongest teams.

    On April 26 and 27, at the Russian Student Championship in Ultimate — Constructors’ Cup, the men’s and women’s teams of SPbPU showed a brilliant game. They fought in the power pool, which immediately ensured their entry into the quarterfinals.

    Despite the defeat from the Nizhny Novgorod Region (4:6), the girls left the group from 2nd place and confidently defeated Yaroslavl State University in the quarterfinals with a score of 11:2. In the semifinals there was a tough match against Moscow State Pedagogical University, but our team snatched victory – 8:6. In the finals there was a rematch with the Nizhny Novgorod Region, this time without a chance for the opponents. With a score of 14:3, Polytechnic University won gold medals. Olesya Mikhailova became the MVP according to the statistics of the entire tournament.

    The men’s team also took 2nd place in the group, losing to Moscow State University, but showed real character in the playoffs. In the quarterfinals, the guys beat First Medical (9:2), in the semifinals – Moscow State Pedagogical University (6:5). In the finals, the polytechnics again met the Moscow State University team and this time lost.

    On April 18 and 20, the Saint Petersburg Mini-Golf Championship was held. Our athletes took the entire podium in the 2005 and older category. Polina Kukhta came in first, Anastasia Kalashnikova came in second, and Anastasia Maksimova came in third.

    Please note: This information is raw content directly from the source of the information. It is exactly what the source states and does not reflect the position of MIL-OSI or its clients.

    MIL OSI Russia News

  • MIL-OSI Russia: BPMSoft and GUU agreed on the development of IT education

    Translation. Region: Russian Federal

    Source: State University of Management – Official website of the State –

    The company “BPMSoft” (part of the IT holding LANSOFT), the developer of the domestic low-code platform BPMSoft, and the State University of Management (SUM) signed an agreement on cooperation in the field of IT education.

    The partnership is aimed at developing competencies in the field of process management among students of the Institute of Industrial Management. Joint work will be carried out within the framework of the discipline “Fundamentals of Process Management” of the Department of Theory and Organization of Management, as well as in the implementation of student projects under the auspices of the project office of the State University of Management. In the future, it is planned to deepen cooperation – this is about including the courses “Business Process Engineering” and “Business Process Modeling” in the educational tracks for senior students.

    The university’s lecturers have already begun to master the functionality of the BPMSoft platform. The training is conducted according to a program developed specifically for academic partners.

    Yulia Golyakina, head of the BPMSoft Education initiative: “Today’s students are tomorrow’s architects of the digital economy. We want them to enter the market with relevant knowledge and the ability to apply modern tools in real projects. Cooperation with the State University of Management is an important step in the formation of strong practice-oriented IT education in the country.”

    Dmitry Bryukhanov, Vice-Rector for Academic Affairs at the State University of Management: “We see great potential in integrating modern platforms into the educational process. Working with BPMSoft will allow students not only to study the theory of process management, but also to apply it in practice – in the language of business, technology and project work.”

    The partnership with the State University of Management became part of a large-scale academic initiative called “BPMSoft Education”. Over the past year and a half, more than two dozen leading universities in the country have joined the project. Its goal is to train a new wave of IT specialists with practical skills in working with domestic digital solutions that are in demand in public administration and business.

    About GUU

    The State University of Management is the first educational institution that has been specializing in management education in the USSR and Russia for over 100 years. More than 12 thousand students study at the SUM in 16 bachelor’s degree programs, 13 master’s degree programs, including economics, management, business informatics, state and municipal management, transport process technology, personnel management, statistics and others, as well as postgraduate students in 14 scientific specialties. The SUM implements a unique project-based education program, starting from the 1st year and focused on practical classes throughout the year. Every year, about 4 thousand specialists and business managers undergo retraining and improve their qualifications at the SUM.

    Over the years of its existence, the university has trained about 200 thousand highly qualified managers for various sectors of the economy. Among the graduates of the State University of Management are members of the Government of the Russian Federation, deputy ministers, governors, mayors of cities, heads of municipal structures and businesses.

    About BPMSoft

    “BPMSoft” (part of the IT holding LANSOFT) is the developer of its own low-code platform BPMSoft for automation and management of business processes in a single digital environment. BPMSoft contains tools for flexible configuration and customization, ready-made business applications for managing CRM, SRM, HRM, ITSM, connectors and extensions for effective adaptation to any IT infrastructure. The BPMSoft partner network includes 100 companies engaged in the implementation of the platform and the development of their own products based on it. BPMSoft’s clients include 500 major customers: banks and insurance, fuel and energy complex and industry, retail and FMCG, IT and development, and others.

    BPMSoft is included in the register of Russian software (registry entry No. 17372), belongs to the field of artificial intelligence, has FSTEC certification for 4 UD, and is also included in the list of 520 IT solutions that can be used at critical information infrastructure facilities from January 1, 2025, in accordance with Decree of the President of the Russian Federation No. 166 dated March 30, 2022.

    About LANSOFT

    IT holding LANSOFT unites leading platform solutions in the corporate software segment into a single product portfolio: TURBO, LDM, BPMSoft, Goodt. The products complement each other and cover key business needs: from budgeting, enterprise management, working with clients and suppliers to talent management and creating advanced analytical reports. All solutions of the brand are included in the register of Russian software.

    LANSOFT has an extensive network of over 170 authorized partners for sales and implementation of products. The LANSOFT team consists of over 1,400 employees.

    Subscribe to the TG channel “Our GUU” Date of publication: 12.05.2025

    Please note: This information is raw content directly from the source of the information. It is exactly what the source states and does not reflect the position of MIL-OSI or its clients.

    MIL OSI Russia News

  • MIL-OSI Submissions: Stats NZ information release: Ready-mixed concrete: March 2025 quarter

    Source: Statistics New Zealand

    Ready-mixed concrete: March 2025 quarter12 May 2025 – Ready-mixed concrete statistics provide an indicator of construction activity.

    Key facts

    • In the March 2025 quarter, the actual volume of ready-mixed concrete produced was 854,509 cubic metres, down 1.5 percent compared with the March 2024 quarter.
    • In the year ended March 2025, 3.8 million cubic metres of ready-mixed concrete was produced, down 5.4 percent compared with the year ended March 2024.
    • In seasonally adjusted terms, the volume of ready-mixed concrete rose 1.4 percent in the March 2025 quarter, following a 4.6 percent fall in the December 2024 quarter.

    Files:


    MIL OSI

  • MIL-OSI Submissions: Electricity and gas to be included in the monthly selected price indexes – Stats NZ media release

    Source: Statistics New Zealand

    Electricity and gas to be included in the monthly selected price indexes12 May 2025 – Stats NZ will begin publishing indexes for electricity and gas as part of the monthly selected price indexes (SPI).

    The April 2025 SPI, scheduled for release on 15 May 2025, will be the first to include the indexes, which will be part of the housing and household utilities group.

    General manager and macroeconomic spokesperson Jason Attewell said this is the next step in Stats NZ’s continued commitment to improving and modernising the economic data it produces.  

    “The cost of electricity and gas prices are important to New Zealanders, especially as we head into winter. Adding these components to our monthly release now will provide decision makers and the public more timely information about energy costs,” Attewell said.

    Files:

    MIL OSI

  • MIL-OSI New Zealand: Electricity and gas to be included in the monthly selected price indexes – Stats NZ media release

    Source: Statistics New Zealand

    Electricity and gas to be included in the monthly selected price indexes 12 May 2025 – Stats NZ will begin publishing indexes for electricity and gas as part of the monthly selected price indexes (SPI).

    The April 2025 SPI, scheduled for release on 15 May 2025, will be the first to include the indexes, which will be part of the housing and household utilities group.

    General manager and macroeconomic spokesperson Jason Attewell said this is the next step in Stats NZ’s continued commitment to improving and modernising the economic data it produces.  

    “The cost of electricity and gas prices are important to New Zealanders, especially as we head into winter. Adding these components to our monthly release now will provide decision makers and the public more timely information about energy costs,” Attewell said.

    Files:

    MIL OSI New Zealand News

  • MIL-OSI New Zealand: Stats NZ information release: Ready-mixed concrete: March 2025 quarter

    Source: Statistics New Zealand

    Ready-mixed concrete: March 2025 quarter 12 May 2025 – Ready-mixed concrete statistics provide an indicator of construction activity.

    Key facts

    • In the March 2025 quarter, the actual volume of ready-mixed concrete produced was 854,509 cubic metres, down 1.5 percent compared with the March 2024 quarter.
    • In the year ended March 2025, 3.8 million cubic metres of ready-mixed concrete was produced, down 5.4 percent compared with the year ended March 2024.
    • In seasonally adjusted terms, the volume of ready-mixed concrete rose 1.4 percent in the March 2025 quarter, following a 4.6 percent fall in the December 2024 quarter.

    Files:

    MIL OSI New Zealand News

  • MIL-OSI Australia: Speech to Australian Shareholders’ Association Investor Conference

    Source: New places to play in Gungahlin

    Jeremy Hirschhorn, Second Commissioner, Client Engagement Group
    Speech delivered at the Australian Shareholders’ Association Investor Conference
    Sydney, 6 May 2025
    (Check against delivery)

    Large company investing – what the T(ax) says about the E(arnings)

    Thank you for having me here today.

    I will firstly give some background as to the health of the Australian tax system, in particular as it relates to large corporations, and the strategies of the Australian Taxation Office (ATO) in further improving that performance.

    I am then hoping to highlight to you why you should be interested in the tax performance of your investee companies (and potential signals that further questions are required), as well as some other sources of information which, directly or indirectly, may help in your investment decisions and also when, as investors, you are seeking to influence the behaviours of the companies in which you invest.

    Of course, I come here as a mere tax administrator, not as a tax policy maker or a financial adviser, let alone a sophisticated investor, so please take my comments in that context!

    The performance of the Australian tax system is fundamentally healthy, but there is more to do

    Firstly, the good news is that the Australian tax system is fundamentally healthy from an administrative perspective and compares very favourably globally. This is due in part to a competent and well-resourced administrator (I would say that!), but also due to the fact that most Australians are fundamentally honest, see the relationship between the taxes they pay and the services they seek from Government, and so willingly comply with their tax obligations (albeit not always exuberantly!).

    This is not just anecdotal: the ATO dedicates significant resources to estimating the ‘tax gap’, which is the difference between the tax payable according to current law and the tax actually collected. Our most recent estimates (published in our annual report each year) are that the overall system is operating at 90% performance at lodgment and 92.5% after compliance activity.

    This also means that the ATO doesn’t just focus on the non-compliant. The ATO puts significant effort into supporting the vast bulk of Australians (from individuals to the largest listed companies) who just want to meet their tax obligations (with as little time, cost and stress as possible) with initiatives like myTax (for individuals with simple affairs), to services for tax agents, to proactive guidance and transparency for the largest taxpayers.

    In relation to large business, despite some commentary that suggests otherwise, overall performance actually exceeds the overall system, but this is after significant dedication of compliance resources. Our estimate of compliance at lodgment is circa 92% to 93%, increasing to 96% after compliance activity. By far the major driver of the large market income tax gap relates to international issues, in particular where intra-group transfers are mis-priced. Our medium to long term aspiration is to move this to 96% correct at lodgment and 98% after compliance activity.

    Although in a good place, there is more to be done:

    • The residual tax gap over the entire tax system is approximately $45 billion, which could pay for a lot of services.
    • In relation to large companies, at least until tax performance at lodgment (92% to 93%) is higher than that of individuals at lodgment (circa 94%), ordinary Australians rightly ask the ATO to hold large companies to account (and indeed it is healthy for overall confidence that the ATO maintains vigilance with large companies regardless of performance level).

    Social licence and the silent ‘T’ in ESG

    Tax is inextricably linked to social licence. In one sense, the tax system is really the ‘sharing rules’ whereby citizens come together to pool resources to fund the things that they cannot achieve by themselves. An individual or company which aggressively avoids (or worse evades) their obligations is effectively repudiating the rules of engagement of that community and puts its social licence at risk.

    I refer to a speech by a colleague of mine, Faith Harako, entitled ‘Tax: the silent T in ESG’. In that paper, Faith noted:

    • at a societal level, tax pays for a lot of the ‘S’ and ‘E’ in ESG (being environment, social and governance): a company may really focus on its own S and E, but if it is not contributing fairly to the overall society’s initiatives, is it really pulling its weight?
    • tax transparency gives confidence to a company’s commitment to the ‘S’
    • corporate tax governance is a very important part of any company’s ‘G’.

    So, to the extent that you, as investors, consider a company’s ESG contribution as relevant to the long-term healthiness, social licence and investability of that company, it is important not to overlook the ‘silent T’.

    Not so relevant today, but Faith also made the point that tax has already addressed many of the challenges of the ‘E’ in ESG and ESG reporting, particularly relating to differences between regimes in different countries.

    Warning signs in financial statements

    If you are interested in the ESG performance of your investee companies, or merely the maintainability of after-tax earnings (accounting or cash), here are a few things (not exhaustive or prescriptive!) that you may wish to consider:

    Low accounting effective tax rate

    A low accounting effective tax rate is not necessarily problematic of itself, but it is important to understand what is driving this, for example:

    • significant operations in low (headline) tax rate jurisdictions (but even then, can that country maintain low effective tax rates?)
    • significant operations in jurisdictions where tax ‘holidays’ are provided (are these maintainable in the longer term?)
    • artificial allocation of profits to low tax rate jurisdictions (‘transfer mis-pricing’) (how long before one or more tax jurisdictions challenges this?) (A big clue to this one is where the company mostly operates in high tax jurisdictions but in its tax note has a substantial reduction in effective tax rate ‘due to overseas operations’.)
    • significant concessions under incentive schemes (e.g. patent box, research and development (R&D)) (are these schemes stable in the longer term in all jurisdictions?)
    • tax arbitrage transactions generating ‘free’ deductions (e.g. intellectual property (IP) migration schemes allowing extra deductions in another jurisdiction for internally generated IP).

    Normal accounting effective tax rate, but low cash tax rate

    Where a profitable company discloses a relatively normal effective tax rate, but is paying minimal cash tax, it is again important to understand the drivers, some examples being:

    • a ‘deferred tax liability’ or ‘DTL’ in relation to income recognised for accounting purposes (but not yet for tax) (if the earnings are not high quality enough for the tax system to tax them, are they high quality enough for your valuation models?)
    • a DTL in relation to assets for accounting purposes which have been deducted for tax (unless there is an explicit accelerated deduction regime) (if the tax system thinks the benefit of the asset has been used enough to allow a deduction, what is the quality of the accounting asset?)
    • a DTL in relation to profit repatriation from a low tax jurisdiction to a high tax jurisdiction (have profits been artificially allocated to (and retained in) low tax jurisdictions, and is this structuring sustainable?)
    • use of deferred tax assets (DTAs) for tax losses (in the best case, the DTAs exist and can be used, but even then the cash flow benefit will be lost when they are exhausted. But how/why did the company generate the tax losses in the first place?).

    Disclosure and accounting for tax disputes

    We have found that disclosure and accounting for tax disputes is often opaque to investors, with different companies taking different approaches to both disclosure and quantification.

    Some things to look out for and perhaps ask for more information from the company:

    • a note under contingent liabilities that there is a dispute but that it is not possible to quantify it at this stage
    • a part payment of an amended assessment has been paid (usually a ‘50%/50%’), but this is accounted for as a current receivable (effectively assuming that the matter will be fully won by the taxpayer) (the history of the ATO’s disputes with large corporates is that matters, even if settled, usually result in at least the 50/50 payment being retained by the ATO)
    • a note that the company has strong legal advice as to their position, and as such has made no provision for the dispute as it is more likely that the company’s position will prevail (again, the ATO’s track record demonstrates that these assertions are often ‘optimistic’)
    • whether there are any ‘buffer’, ‘hollow log’ or ‘tax contingency’ provisions embedded in the current tax provision.

    Sometimes tax disputes are a one-off but more often they are on an on-going issue (e.g. on-going pricing or mis-pricing of intra-group transfers). In these cases, the ATO will usually only settle the ‘back years’ if the ‘forward years’ are also resolved. This will usually result in increased taxation and a higher effective tax rate going forward.

    Sources of insight in addition to financial statements

    In addition to financial statements, over recent times we have seen an increase in tax transparency frameworks and reporting standards globally and in Australia. These frameworks provide further information to the public about the tax contribution and compliance of large business.

    • Known as the corporate tax transparency data, annually the ATO publishes certain limited details (total income, taxable income and tax payable) of all corporate entities with a turnover of more than $100 million. The ATO publishes contextual analysis to explain the data at a population and industry level. We also update Tax and Corporate Australia, which is a guide about the tax landscape for large business operating in Australia.
    • In a similar vein, last year we also published the first annual R&D tax incentive (R&DTI) transparency report providing transparency on the claims made by entities claiming R&D in the 2021–22 income year. Publishing this data encourages voluntary compliance with the requirements of the R&DTI program and increases public awareness of which companies have claimed the tax incentive.
    • From mid-2026, we will see a meaningful increase in the level of tax data published in Australia with the first publication of public country-by-country reports. Introduced by the Government as part of its election 2022 election platform, this is a new reporting regime that will see large multinational enterprises publish selected tax information on a country-by-country basis through an ATO facilitated website. This will allow greater visibility of the global activities of multinationals as well as key tax characteristics such as where they book revenues.
    • Many organisations supplement public information by voluntarily releasing a Tax Transparency Report. Developed by the Board of Taxation (a separate organisation from the ATO), the tax transparency codeExternal Link is designed to encourage greater transparency by the corporate sector and to enhance the community’s understanding of the corporate sector’s compliance with Australia’s tax laws. A number of organisations can be said to have achieved global best practice with their publications and set the standard for their peers, however take-up has been limited – perhaps an opportunity for an ‘if not, why not?’ question at the next AGM!
    • The ATO also voluntarily publishes a raft of information about our programs covering large business. Annually we publish aggregate findings reports for our assurance (justified trust) programs, reportable tax position schedule, advice and disputes. These reports show the level of compliance, prevalence of key tax risks, where we have been able to provide tax certainty for the large market population and insights as to our disputes and how we resolve these. These reports provide deep insights into the state of large business tax compliance and the extent of ATO intervention.

    I also take this opportunity to flag one particular piece of information that could be very useful to companies (and potentially their investors) in understanding where they stand on their tax affairs. Under our ‘justified trust’ program, we provide tax assurance ratings to the largest Australian companies, with both detailed findings and overall ratings. Under taxpayer secrecy rules, the ATO cannot separately publish these ratings, but the companies can. As a result, some leading companies are now publicly disclosing their high assurance ratings, providing confidence to stakeholders such as investors, shareholders, customers and employees. Some high-profile examples include Telstra, BHP, Woolworths, Origin and BUPA. Again, as investors (or potential investors) interested in the sustainability of an investee company’s tax settings, you may wish to ask for further information about a company’s tax assurance rating.

    Conclusion

    In summing up, it is important to understand the starting point, which is that most Australians (including most large Australian companies) are doing the right thing in relation to their tax affairs.

    As investors or potential investors, whether a company is meeting its tax obligations goes to its social licence – I would argue that if a company is not contributing fairly to the community in which it operates, its social licence is at risk, perhaps in unpredictable ways.

    There are a range of information sources from which an investor can glean information as to a company’s tax performance and I have today suggested a few things that you might be interested in looking at and indeed asking of your investee companies.

    Thank you again for the opportunity to present at today’s conference and I welcome your observations or questions.

    MIL OSI News

  • MIL-Evening Report: Victoria’s planning reforms could help solve the housing crisis. But they are under threat

    Source: The Conversation (Au and NZ) – By Brendan Coates, Program Director, Housing and Economic Security, Grattan Institute

    An aerial drone view of northern Melbourne suburbs. Elias Bitar/Shutterstock

    The federal election campaign was dominated by the housing crisis. But the real power to solve it rests with the states.

    In Victoria, reforms are underway that promise a bigger boost to the housing aspirations of younger generations than anything that occurs in the federal parliament.

    Yet these reforms are now under threat of being killed off in the Victorian parliament. If that happens, Victoria will have fewer homes and they will be more expensive, and many more younger Melburnians will be locked out of home ownership.

    We need to build more homes

    At the heart of our housing problem is the fact we just haven’t built enough homes.

    Australia has among the least housing stock per person in the developed world. This is especially true in places where people most want to live: close to jobs, transport, schools and parks.

    The reason is simple: we’ve made it hard to build more townhouses and apartments in the most desirable parts of our biggest cities.

    Like in other states, Victorian state and local governments have long restricted medium- and high-density developments to appease local opposition. The Neighbourhood Residential Zone – the most restrictive residential zone in Victoria – covers more than 42% of residential land within ten kilometres of the Melbourne CBD.

    And the politics of land-use planning – what gets built and where – favour those who oppose change. The people who might live in new housing in established suburbs – if it were to be built – don’t get a say.

    The result is a vast “missing middle”: prime inner-city land, close to jobs and transport, with housing rising only one or two storeys. Melbourne, like Sydney, is one of the least-dense cities of its size in the world, despite the city’s population having risen by 875,000 in the past decade alone. That is the equivalent of almost two Canberras.

    It’s a myth that most Victorians want a quarter-acre block if that means living a long way from jobs, transport, shops and parks. Research by both Grattan Institute and Infrastructure Victoria shows there is substantial demand for townhouses and apartments in established suburbs, if only we built more of them.

    If Melbourne’s middle suburbs – those between two and 20 kilometres from the CBD – were as dense as those of Toronto, that increase in density alone could accommodate all of the 800,000 extra homes the state government plans to build over the next decade.

    The flow-on effect is high prices and rents, a stagnating economy because fewer people can live close to jobs, and further expensive and environmentally damaging sprawl into farmland and floodplains.

    Recent research showed that 8,000 completed apartments in Melbourne remain unsold. Yet this is less than 3% of all apartments in Melbourne, and is unsurprising given past sharp rises in interest rates and increased barriers in selling to foreign buyers.

    That some newly built homes have taken longer to sell is not a reason to prevent the building of those extra homes that so many future Melburnians want to live in.

    Victoria’s planning reforms are our best chance

    Housing can become more affordable if we allow more homes to be built where residents most want to live.

    The Victorian government’s recent reforms, like those in NSW, do just this. Its “activity centre” program will allow more apartments around 60 rail stations and other transport hubs.

    Victoria’s new Townhouse and Low-Rise Code will streamline development approval processes for developments of three storeys or less in residential zones across the state. Where developments meet the code, those new homes will no longer need a planning permit and will be exempt from third-party appeals. This is already the case for knock-down rebuilds.

    These reforms have the potential to unlock hundreds of thousands of extra homes in the coming decades in areas with some of the best infrastructure, amenities and public spaces.

    Similar reforms in Auckland, starting in 2016, contributed to a home building boom that reduced rents by at least 14%. Most of this new stock was townhouses and small apartment buildings, rather than high rises.

    Urban density, if done well, can add to neighbourhood amenity while preserving local green space. Several cities with similar populations but higher densities – such as Toronto and Berlin – match or outrank Melbourne on quality-of-life measures.

    These reforms are now under threat

    These changes do not dictate where housing must be built in Melbourne: they simply permit more housing where demand is highest.

    Yet these reforms are now under threat. The Victorian Liberals and the Greens have teamed up to launch an inquiry into the state Labor government’s reforms. The inquiry is scheduled to report on Tuesday, just one day before the deadline for disallowing the reforms lapses.

    Together, the Liberals and the Greens have the power to revoke the changes in the upper house of the Victorian parliament. That would be a disaster for housing affordability in Victoria.

    The Victorian parliament shouldn’t stand in the way of young families who want to buy a townhouse in the suburb they grew up in, or seniors downsizing to an apartment in their local neighbourhood.

    These reforms are about allowing more homes, and creating a better, healthier, and more vibrant Melbourne.

    Grattan Institute began with contributions to its endowment of $15 million from each of the federal and Victorian governments, $4 million from BHP Billiton, and $1 million from NAB. In order to safeguard its independence, Grattan Institute’s board controls this endowment. The funds are invested and contribute to funding Grattan Institute’s activities. Grattan Institute also receives funding from corporates, foundations, and individuals to support its general activities, as disclosed on its website.

    Joey Moloney and Matthew Bowes do not work for, consult, own shares in or receive funding from any company or organisation that would benefit from this article, and have disclosed no relevant affiliations beyond their academic appointment.

    ref. Victoria’s planning reforms could help solve the housing crisis. But they are under threat – https://theconversation.com/victorias-planning-reforms-could-help-solve-the-housing-crisis-but-they-are-under-threat-255967

    MIL OSI AnalysisEveningReport.nz