Category: Taxation

  • MIL-OSI Banking: Grandoreiro, the global trojan with grandiose ambitions

    Source: Securelist – Kaspersky

    Headline: Grandoreiro, the global trojan with grandiose ambitions

    Grandoreiro is a well-known Brazilian banking trojan — part of the Tetrade umbrella — that enables threat actors to perform fraudulent banking operations by using the victim’s computer to bypass the security measures of banking institutions. It’s been active since at least 2016 and is now one of the most widespread banking trojans globally.

    INTERPOL and law enforcement agencies across the globe are fighting against Grandoreiro, and Kaspersky is cooperating with them, sharing TTPs and IoCs. However, despite the disruption of some local operators of this trojan in 2021 and 2024, and the arrest of gang members in Spain, Brazil, and Argentina, they’re still active. We now know for sure that only part of this gang was arrested: the remaining operators behind Grandoreiro continue attacking users all over the world, further developing new malware and establishing new infrastructure.

    Every year we observe new Grandoreiro campaigns targeting financial entities, using new tricks in samples with low detection rates by security solutions. The group has evolved over the years, expanding the number of targets in every new campaign we tracked. In 2023, the banking trojan targeted 900 banks in 40 countries — in 2024, the newest versions of the trojan targeted 1,700 banks and 276 crypto wallets in 45 countries and territories, located on all continents of the world. Asia and Africa have finally joined the list of its targets, making it a truly global financial threat. In Spain alone, Grandoreiro has been responsible for fraudulent activities amounting to 3.5 million euros in profits, according to conservative estimates — several failed attempts could have yielded beyond 110 million euros for the criminal organization.

    In this article, we will detail how Grandoreiro operates, its evolution over time, and the new tricks adopted by the malware, such as the usage of 3 DGAs (domain generation algorithm) in its C2 communications, the adoption of ciphertext stealing encryption (CTS), and mouse behavior tracking, aiming to bypass anti-fraud solutions. This evolution culminates with the appearance of lighter, local versions, now focused on Mexico, positioning the group as a challenge for the financial sector, law enforcement agencies and security solutions worldwide.

    Grandoreiro: One malware, many operators, fragmented versions

    Grandoreiro is a banking trojan of Brazilian origin that has been active since at least 2016. Grandoreiro is written in the Delphi programming language, and there are many versions, indicating that different operators are involved in developing the malware.

    Since 2016, we have seen the threat actors behind Grandoreiro operations regularly improving their techniques to stay unmonitored and active for a longer time. In 2020, Grandoreiro started to expand its attacks in Latin America and later in Europe with great success, focusing its efforts on evading detection using modular installers.

    Grandoreiro generally operates as Malware-as-a-Service, although it’s slightly different from other banking trojan families. You won’t find an announcement on underground forums selling the Grandoreiro package — it seems that access to the source-code or builders of the trojan is very limited, only for trusted partners.

    After the arrests of some operators, Grandoreiro split its codebase into lighter versions, with fewer targets. These fragmented versions of the trojan are a reaction to the recent law enforcement operations. This discovery is supported by the existence of two distinct codebases in simultaneous campaigns: newer samples featuring updated code, and older samples which rely on the legacy codebase, now targeting only users in Mexico — customers of around 30 banks.

    2022 and 2023 campaigns

    Grandoreiro campaigns commonly start with a phishing email written in the target country language. For example, the emails distributed in most of Latin America are in Spanish. However, we also saw the use of Google Ads (malvertising) in some Grandoreiro campaigns to drive users to download the initial stage of infection.

    Phishing emails use different lures to make the victim interact with the message and download the malware. Some messages refer to a pending phone bill, others mimic a tax notification, and son. In early 2022 campaigns, the malicious email included an attached PDF. As soon as the PDF is opened, the victim is prompted with a blurred image except for a part containing “Visualizar Documento” (“View Document” in Spanish). When the victim clicks the button, they are redirected to a malicious web page which prompts them to download a ZIP file. Since May 2022, Grandoreiro campaigns include a malicious link inside the email body that redirects the victim to a website that then downloads a malicious ZIP archive on the victim’s machine. These ZIP archives commonly contain two files: a legitimate file and a Grandoreiro loader, which is responsible for downloading, extracting and executing the final Grandoreiro payload.

    The Grandoreiro loader is delivered in the form of a Windows Installer (MSI) file that extracts a dynamic link library (DLL) file and executes a function embedded in the DLL. The function will do nothing if the system language is English, but otherwise the final payload is downloaded. Most likely, this means that the analyzed versions didn’t target English-speaking countries. There have also been other cases where a VBS file is used instead of the DLL to execute the final payload.

    Grandoreiro recent infection flow

    As for the malware itself, in August 2022 campaigns, the final payload was an incredibly big 414 MB portable executable file disguised with a PNG extension (which is later renamed to EXE dynamically by the loader). It masked itself as an ASUS driver using the ASUS icon and was signed with an “ASUSTEK DRIVER ASSISTANTE” digital certificate.

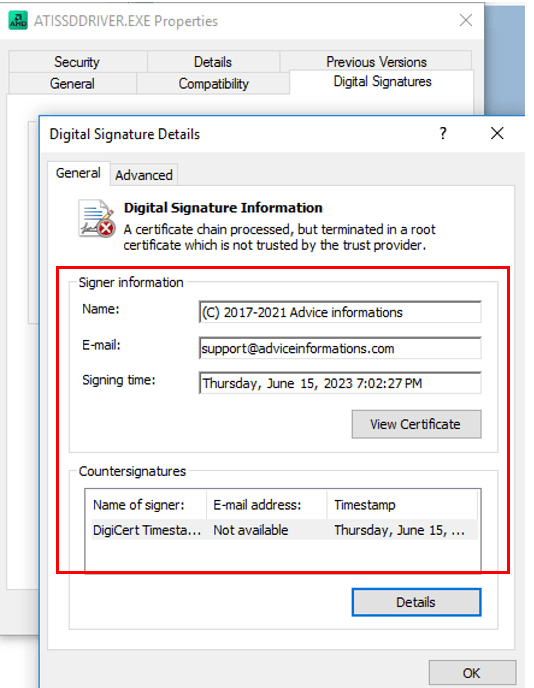
    In 2023 campaigns, Grandoreiro used samples with rather low detection rates. Initially, we identified three samples related to these campaigns, compiled in June 2023. All of them were portable executables, 390 MB big, with the original name “ATISSDDRIVER.EXE” and internal name “ATIECLXX.EXE”. The main purpose of these samples is to monitor the victims’ visits to financial institution websites and steal their credentials. The malware also allows threat actors to remotely control the victim machines and perform fraudulent transactions within them.

    In the campaign involving the discussed samples, the malware tries to impersonate an AMD External Data SSD driver and is signed with an “Advice informations” digital certificate in order to appear legitimate and evade detection.

    Implant impersonating AMD driver

    Digital certificate used by Grandoreiro malware

    In both cases, the malware is an executable that registers itself to be launched with Windows. However, it is worth noting that in the majority of Grandoreiro attacks, a DLL sideloading technique is employed, using legitimate binaries that are digitally signed to run the malware.

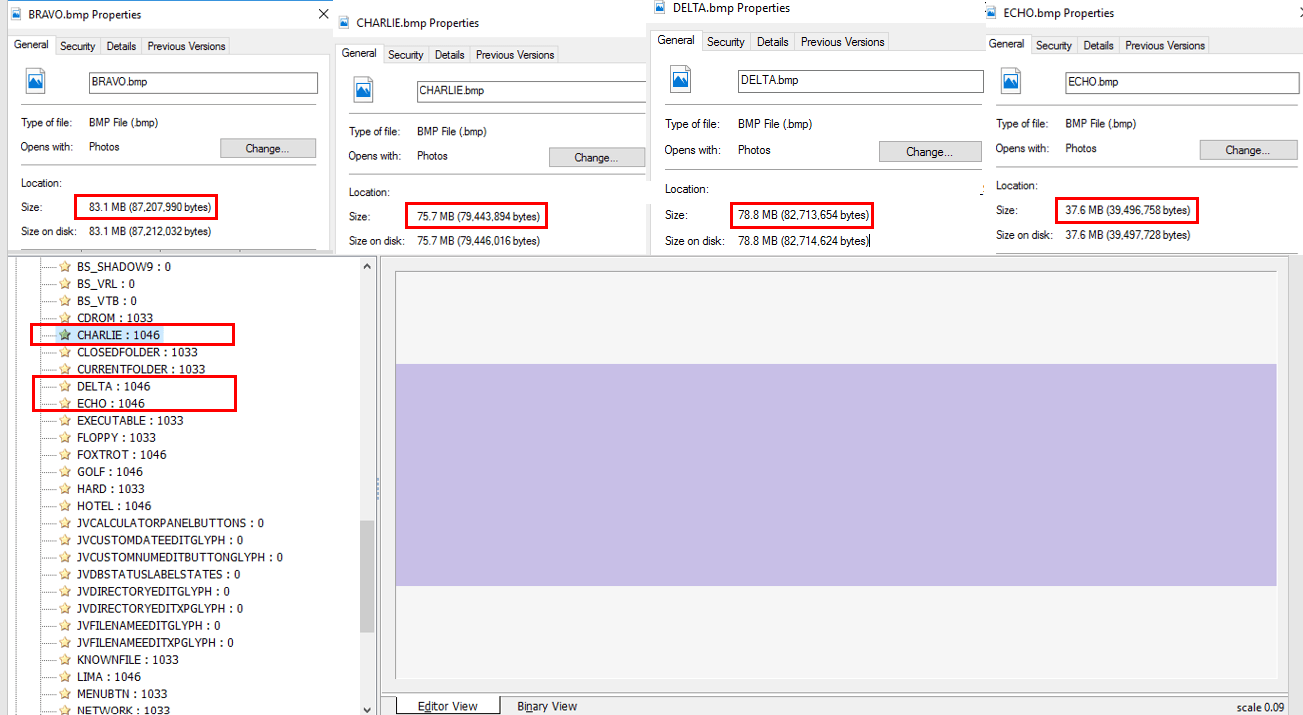
    The considerable size of the executables can be explained by the fact that Grandoreiro utilizes a binary padding technique to inflate the size of the malicious files as a way to evade sandboxes. To achieve this, the attackers add multiple BMP images to the resource section of the binary. In the example below, the sample included several big images. The sizes of the highlighted images are around 83.1 MB, 78.8 MB, 75.7 and 37.6 MB. However, there are more of them in the binary, and together all the images add ~376 MB to the file.

    Binary padding used by Grandoreiro

    In both 2022 and 2023 campaigns, Grandoreiro used a well-known XOR-based string encryption algorithm that is shared with other Brazilian malware families. The difference is the encryption key. For Grandoreiro, some magic values were the following:

    Date Encryption key
    March 2022 F5454DNBVXCCEFD3EFMNBVDCMNXCEVXD3CMBKJHGFM
    March 2022 XD3CMBKJCEFD3EFMF5454NBVDNBVXCCMNXCEVDHGFM
    August 2022 BVCKLMBNUIOJKDOSOKOMOI5M4OKYMKLFODIO
    June 2023 B00X02039AVBJICXNBJOIKCVXMKOMASUJIERNJIQWNLKFMDOPVXCMUIJBNOXCKMVIOKXCJ
    UIHNSDIUJNRHUQWEBGYTVasuydhosgkjopdf

    The various checks and validations aimed at avoiding detection and complicating malware analysis were also changed in the 2022 and 2023 versions. In contrast with the older Grandoreiro campaigns, we found that some of the tasks that were previously executed by the final payload are now implemented in the first stage loader. These tasks include security checks, anti-debugging techniques, and more. This represents a significant change from previous campaigns.

    One of these tasks is the use of the geolocation service http://ip-api.com/json to gather the target’s IP address location data. In a campaign reported in May 2023 by Trustwave, this task is performed by a JScript code embedded in an MSI installer before the delivery of the final payload.

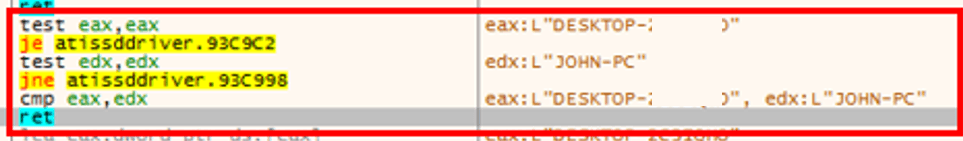
    There are numerous other checks that have been transferred into the loader, although some of them are still present in the banking trojan itself. Grandoreiro gathers host information such as operating system version, hostname, display monitor information, keyboard layout, current time and date, time zone, default language and mouse type. Then the malware retrieves the computer name and compares it against the following strings that correspond to known sandboxes:

    • WIN-VUA6POUV5UP;
    • Win-StephyPC3;
    • difusor;
    • DESTOP2457;
    • JOHN-PC.

    Computer name validation

    It also collects the username and verifies if it matches with the “John” or “WORK” strings. If any of these validations match, the malware stops its execution.

    Grandoreiro includes detection of tools commonly used by security analysts, such as regmon.exe, procmon.exe, Wireshark, and so on. The process list varies across the malware versions, and it was significantly expanded in 2024, so we’ll share the full list later in this post. The malware takes a snapshot of currently executing processes in the system using the CreateToolhelp32Snapshot() Windows API and goes through the process list using Process32FirstW() and Process32NextW(). If any of the analysis tools exists in the system, the malware execution is terminated.

    Grandoreiro also checks the directory in which it is being executed. If the execution paths are D:programming or D:script, it terminates itself.

    Another anti-debugging technique implemented in the trojan involves checking for the presence of a virtual environment by reading data from the I/O Port “0x5658h” (VX) and looking for the VMWare magic number 0x564D5868. The malware also uses the IsDebuggerPresent() function to determine whether the current process is being executed in the context of a debugger.

    Last but not least, Grandoreiro searches for anti-malware solutions such as AVAST, Bitdefender, Nod32, Kaspersky, McAfee, Windows Defender, Sophos, Virus Free, Adaware, Symantec, Tencent, Avira, ActiveScan and CrowdStrike. It also looks for banking security software, such as Topaz OFD and Trusteer.

    In terms of the core functionality, some Grandoreiro samples check whether the following programs are installed:

    • CHROME.EXE;
    • MSEDGE.EXE;
    • FIREFOX.EXE;
    • IEXPLORE.EXE;
    • OUTLOOK.EXE;
    • OPERA.EXE;
    • BRAVE.EXE;
    • CHROMIUM.EXE;
    • AVASTBROWSER.EXE;
    • VeraCrypt;
    • Nortonvpn;
    • Adobe;
    • OneDrive;
    • Dropbox.

    If any of these is present on the system, the malware stores their names to further monitor user activity in them.

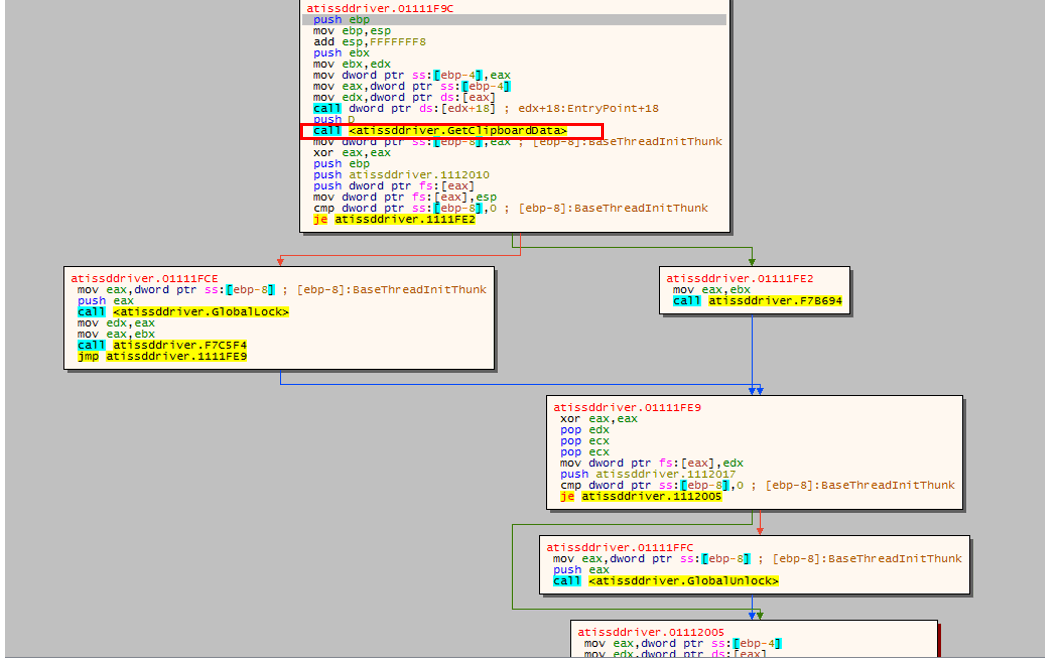
    Grandoreiro also checks for crypto wallets installed on the infected machine. The malware includes a clipboard replacer for crypto wallets, monitoring the user’s clipboard activity and replacing the clipboard data with the threat actor keys.

    Clipboard replacer

    2024 campaigns

    During a certain period of time in February 2024, a few days after the announcement of the arrest of some of the gang’s operators in Brazil, we observed a significant increase in emails detected by spam traps. There was a notable prevalence of Grandoreiro-themed messages masquerading as Mexican CFDI communications. Mexican CFDI, short for “Comprobante Fiscal Digital por Internet” is an electronic invoicing system administered by the Mexican Tax Authority (SAT — Servicio de Administración Tributaria). It facilitates the creation, transmission, and storage of digital tax documents, mandatory for businesses in Mexico to record transactions for tax purposes.

    In our investigation, we have acquired 48 samples associated not only with this instance but also with various other campaigns.

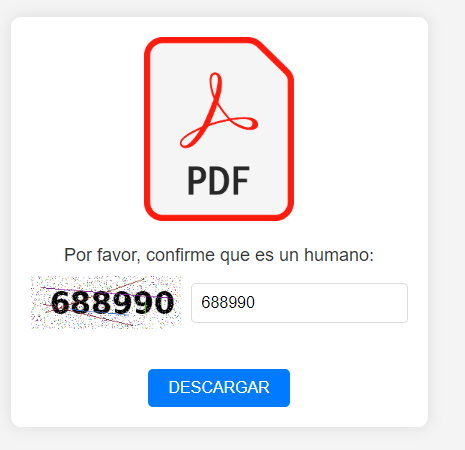
    Notably, this new campaign added a new sandbox detection mechanism, namely a CAPTCHA before the execution of the main payload, as a way to avoid the automatic analysis used by some companies:

    Grandoreiro anti-sandbox CAPTCHA

    It is worth noting that in the 2024 Grandoreiro campaigns, the new sandbox evasion code has been implemented in the downloader. Although the main sample still has anti-sandbox functionality too, if a sandbox is detected, it is simply not downloaded. Besides that, the new version also added detection of many tools to its arsenal, aiming to avoid analysis. Here is whole list of analysis tools detected by the newest versions:

    regmon.exe hopper.exe nessusd.exe OmniPeek.exe
    procmon.exe jd-gui.exe PacketSled.exe netmon.exe
    filemon.exe canvas.exe prtg.exe colasoft.exe
    Wireshark.exe pebrowsepro.exe cain.exe netwitness.exe
    ProcessHacker.exe gdb.exe NetworkAnalyzerPro.exe netscanpro.exe
    PCHunter64.exe scylla.exe OmniPeek.exe packetanalyzer.exe
    PCHunter32.exe volatility.exe netmon.exe packettotal.exe
    JoeTrace.exe cffexplorer.exe colasoft.exe tshark.exe
    ollydbg.exe angr.exe netwitness.exe windump.exe
    ida.exe pestudio.exe netscanpro.exe PRTG Probe.exe
    x64dbg.exe die.exe packetanalyzer.exe NetFlowAnalyzer.exe
    cheatengine.exe ethereal.exe packettotal.exe SWJobEngineWorker2x64.exe
    ollyice.exe Capsa.exe tshark.exe NetPerfMonService.exe
    fiddler.exe tcpdump.exe windump.exe SolarWinds.DataProcessor.exe
    devenv.exe NetworkMiner.exe PRTG Probe.exe ettercap.exe
    radare2.exe smartsniff.exe NetFlowAnalyzer.exe apimonitor.exe
    ghidra.exe snort.exe SWJobEngineWorker2x64.exe apimonitor-x64.exe
    frida.exe pcap.exe NetPerfMonService.exe apimonitor-x32.exe
    binaryninja.exe SolarWinds.NetPerfMon.exe SolarWinds.DataProcessor.exe x32dbg.exe
    cutter.exe nmap.exe ettercap.exe x64dbg.exe
    scylla.exe apimonitor.exe PCHunter64.exe x96dbg.exe
    volatility.exe apimonitor-x64.exe PCHunter32.exe fakenet.exe
    cffexplorer.exe apimonitor-x32.exe JoeTrace.exe hexworkshop.exe
    angr.exe x32dbg.exe ollydbg.exe Dbgview.exe
    pestudio.exe x64dbg.exe ida.exe sysexp.exe
    die.exe x96dbg.exe x64dbg.exe vmtoolsd.exe
    ethereal.exe fakenet.exe cheatengine.exe dotPeek.exe
    Capsa.exe hexworkshop.exe ollyice.exe procexp64.exe
    tcpdump.exe Dbgview.exe fiddler.exe procexp64a.exe
    NetworkMiner.exe sysexp.exe devenv.exe procexp.exe
    smartsniff.exe vmtoolsd.exe radare2.exe cheatengine.exe
    snort.exe dotPeek.exe ghidra.exe ollyice.exe
    pcap.exe procexp64.exe frida.exe pebrowsepro.exe
    cain.exe procexp64a.exe binaryninja.exe gdb.exe
    nmap.exe procexp.exe cutter.exe Wireshark.exe
    nessusd.exe regmon.exe hopper.exe ProcessHacker.exe
    PacketSled.exe procmon.exe jd-gui.exe SolarWinds.NetPerfMon.exe
    prtg.exe filemon.exe canvas.exe NetworkAnalyzerPro.exe

    These are some RAT features that we found in this version:

    • Auto-update feature allows newer versions of the malware to be deployed to the victim’s machine;
    • Sandbox/AV detection, still present in the main module, which includes more tools than previous versions;
    • Keylogger feature;
    • Ability to select country for listing victims;
    • Banking security solutions detection;
    • Checking geolocation information to ensure it runs in the target country;
    • Monitoring Outlook emails for specific keywords;
    • Ability to use Outlook to send spam emails.

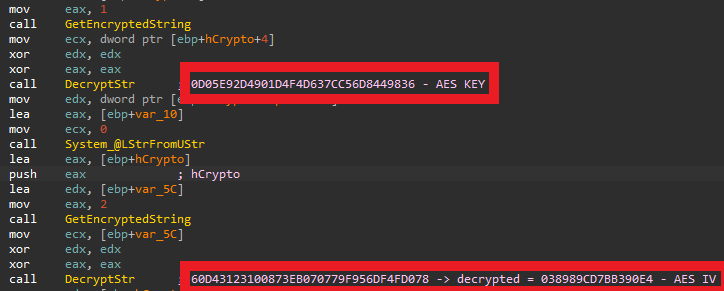
    In terms of static analysis protection, in 2024 versions, Grandoreiro has implemented enhanced encryption measures. Departing from its previous reliance on commonly shared encryption algorithms found in other malware, Grandoreiro has now adopted a multi-layered encryption approach. The decryption process in the newer versions is the following. Initially, the string undergoes deobfuscation through a simple replacement algorithm. Following this, Grandoreiro employs the encryption algorithm based on XOR and conditional subtraction typically utilized by Brazilian malware; however, it differs from them by incorporating a lengthy, 140759-byte string instead of smaller magic strings we saw in 2022 and 2023 samples. Subsequently, the decrypted string undergoes base64 decoding before being subjected to decryption via the AES-256 algorithm. Notably, the AES key and IV are encrypted within Grandoreiro’s code. Upon completion of all these steps, the decrypted string is successfully recovered.

    Grandoreiro AES key and IV

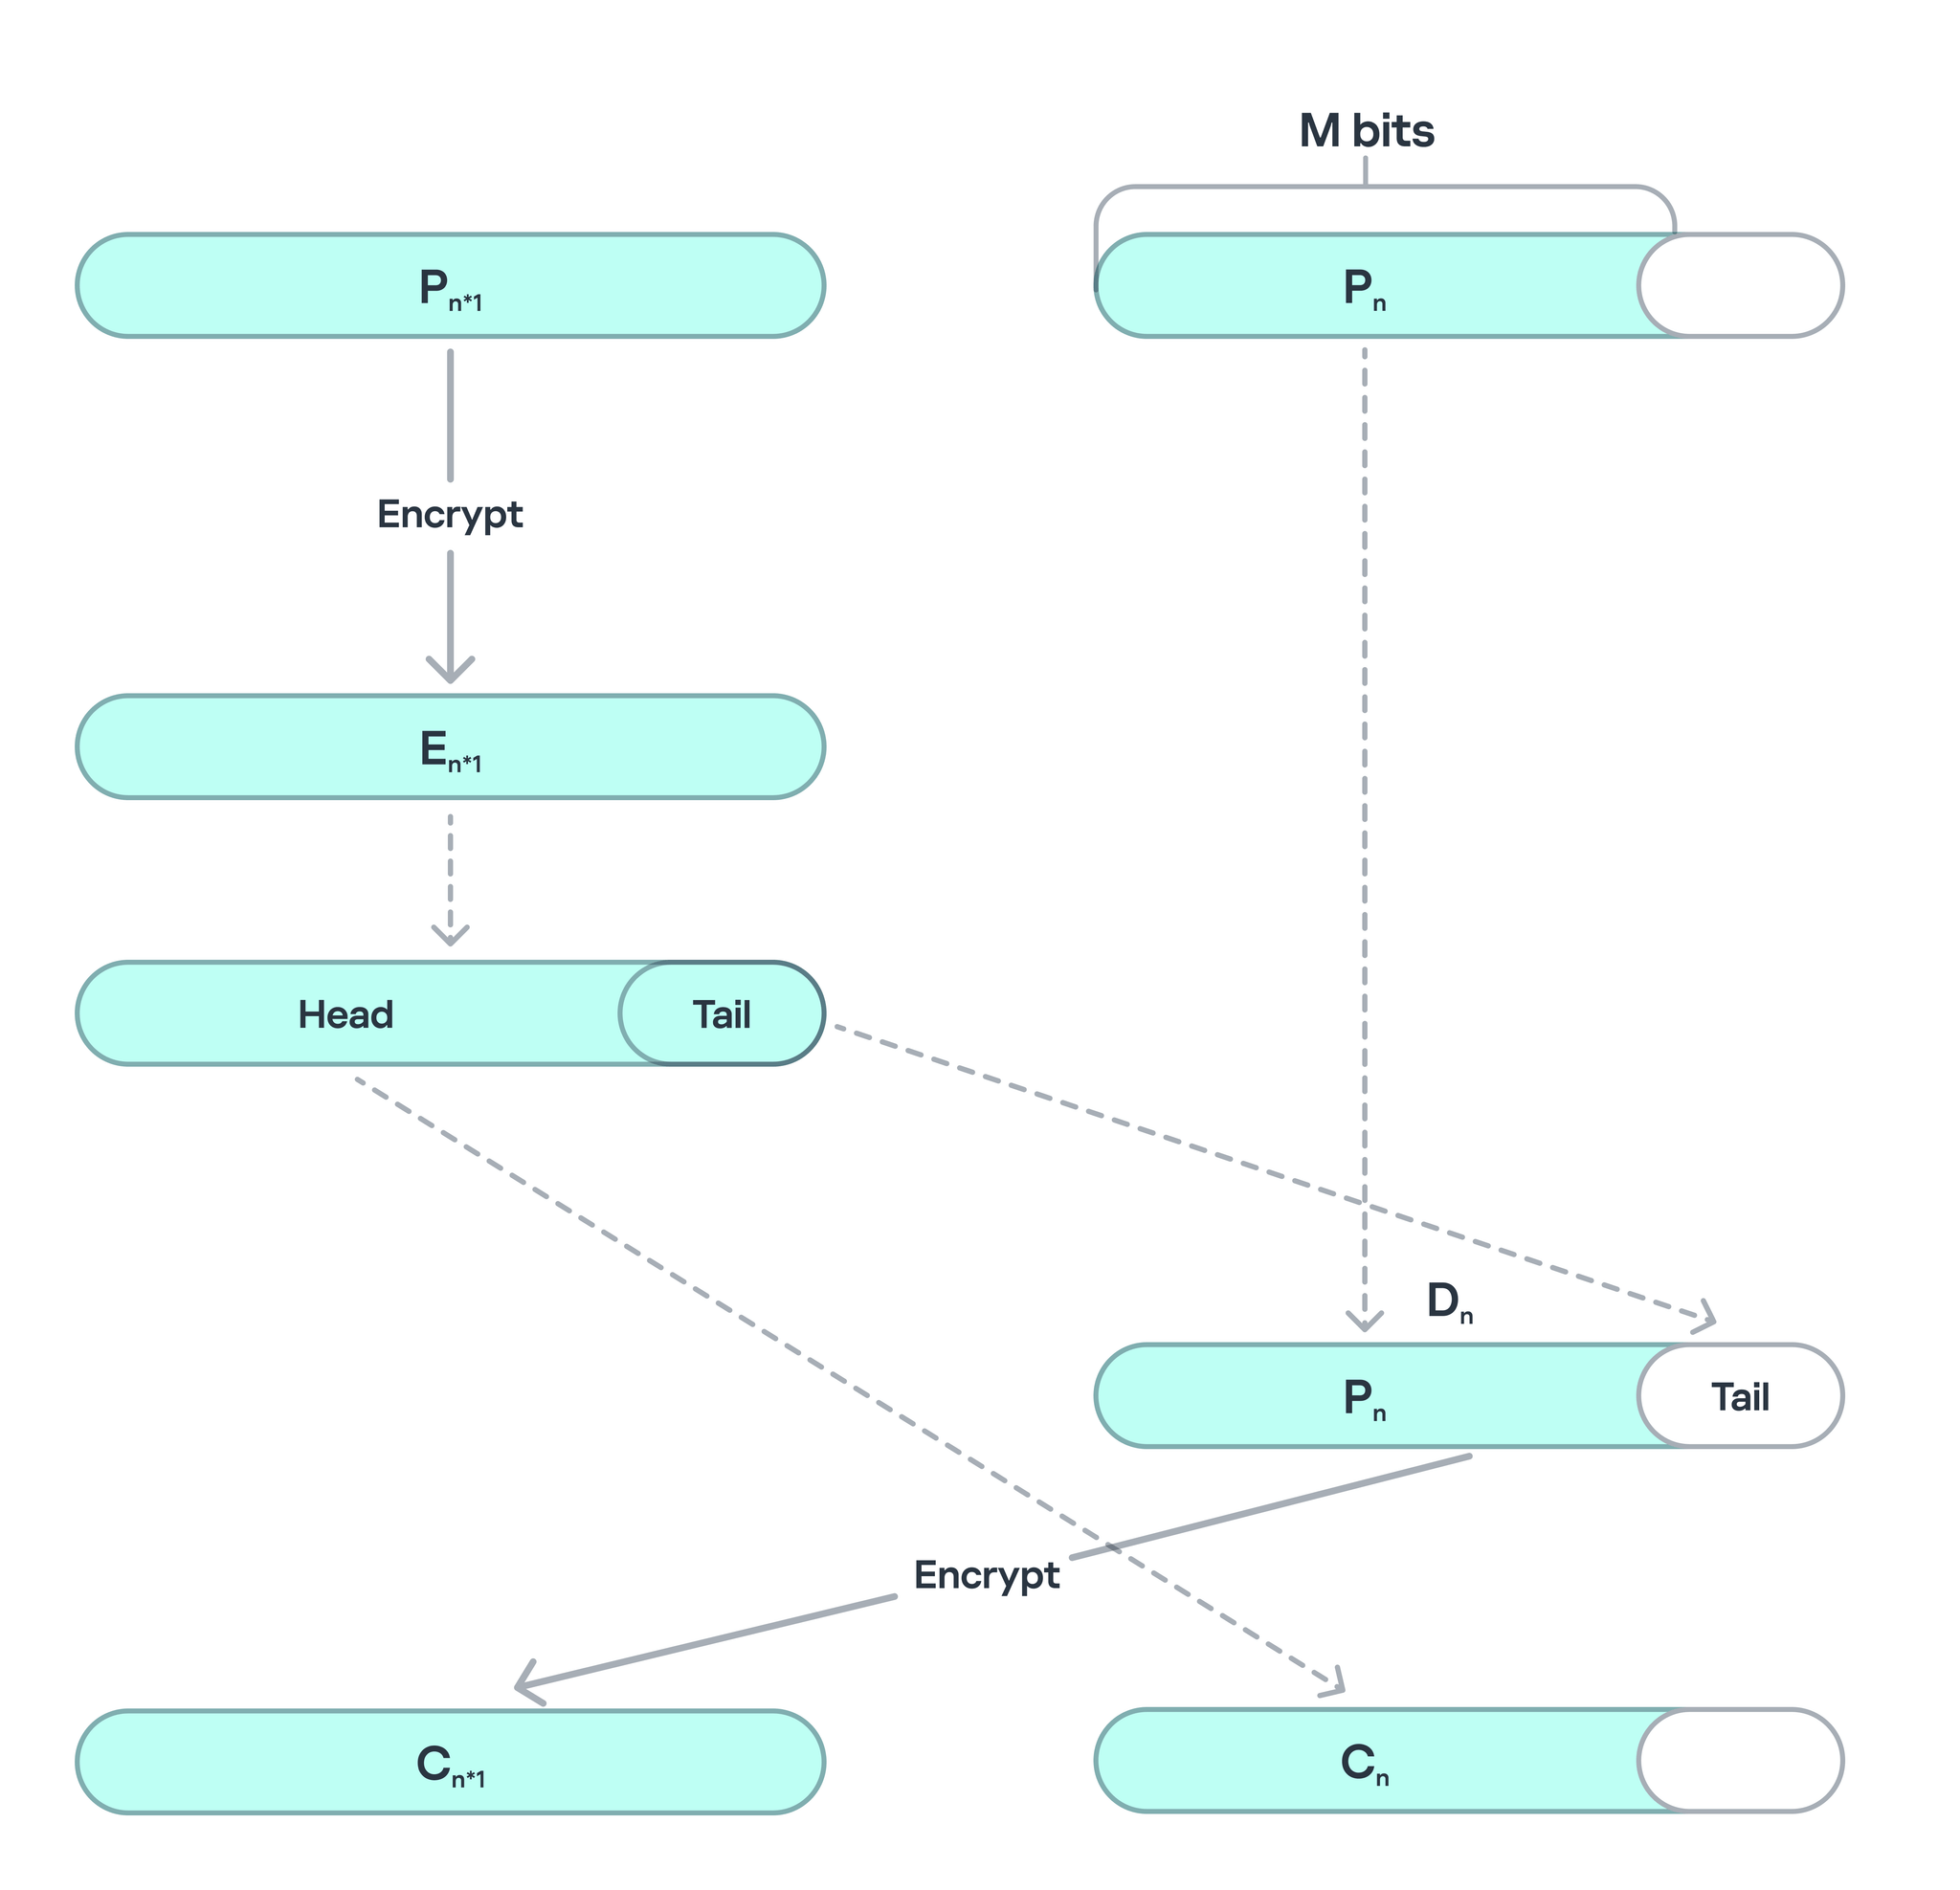
    In newer samples, Grandoreiro upgraded yet again the encryption algorithm using AES with CTS, or Ciphertext Stealing, a specialized encryption mode used when the plaintext is not a multiple of the block size, which in this case is the 128-bit (16-byte) block size used by AES. Unlike more common padding schemes, such as PKCS#7, where the final block is padded with extra bytes to ensure it fits a full block, CTS operates without padding. Instead, it manipulates the final partial block of data by encrypting the last full block and XORing its output with the partial block. This allows encryption of any arbitrary-length input without adding extra padding bytes, preserving the original size of the data.

    ECB Encryption Steps for CTS

    In the case of Grandoreiro, the malware’s encryption routine does not add standard padding to incomplete blocks of data. Their main goal is to complicate analysis: it takes time to figure out that CTS was used, and then more time to implement decryption in this mode, which makes the extraction and obfuscation of strings more complicated. This marks the first time this particular method has been observed in a malware sample.

    As the threat actors continue to evolve their techniques, changing the encryption in every iteration of the malware, the use of CTS in malware may signal a shift toward more advanced encryption practices.

    Local versions: old meets new

    In a recent campaign, our analysis has revealed the existence of an older variant of the malware that utilizes legacy encryption keys, outdated algorithms, and a simplified structure, but which runs in parallel to the campaign using the new code. This variant targets fewer banks — about 30 financial institutions, mainly from Mexico. This analysis clearly indicates that another developer, likely with access to older source code, is conducting new campaigns using the legacy version of the malware.

    How they steal your money

    Operators behind Grandoreiro are equipped with a wide variety of remote commands, including an option to lock the user screen and present a custom image (overlay) to ask the victim for extra information. These are usually OTPs (one-time passwords), transaction passwords or tokens received by SMS, sent by financial institutions.

    A new tactic that we have discovered in the most recent versions found in July 2024 and later suggests that the malware is capturing user input patterns, particularly mouse movements, to bypass machine learning-based security systems. Two specific strings found in the malware — “GRAVAR_POR_5S_VELOCIDADE_MOUSE_CLIENTE_MEDIA” (“Record for 5 seconds the client’s average mouse speed”) and “Medição iniciada, aguarde 5 segundos!” (“Measurement started, please wait 5 seconds!”) — indicate that Grandoreiro is monitoring and recording the user’s mouse activity over a short period. This behavior appears to be an attempt to mimic legitimate user interactions in order to evade detection by anti-fraud systems and security solutions that rely on behavioral analytics. Modern cybersecurity tools, especially those powered by machine learning algorithms, analyze user’s behavior to distinguish between human users and bots or automated malware scripts. By capturing and possibly replaying these natural mouse movement patterns, Grandoreiro could trick these systems into identifying the activity as legitimate, thus bypassing certain security controls.

    This discovery highlights the continuous evolution of malware like Grandoreiro, where attackers are increasingly incorporating tactics designed to counter modern security solutions that rely on behavioral biometrics and machine learning.

    To perform the cash-out in the victim’s account, Grandoreiro operators’ options are to transfer money to the account of local money mules, using transfer apps, buy cryptocurrency or gift cards, or even going to an ATM. Usually, they search for money mules in Telegram channels, paying $200 to $500 USD per day:

    Grandoreiro operator looking for money mules

    Infrastructure

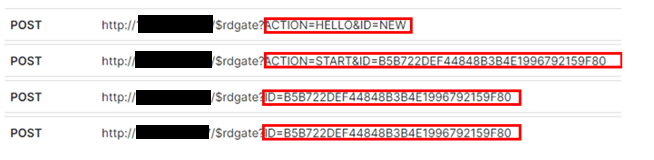
    The newest Grandoreiro version uses 3 Domain Generation Algorithms (DGAs), generating valid domains for command and control (C2) communications. The algorithm uses the current daytime to select strings of predefined lists and concatenates them with a magic key to create the final domain.

    By dynamically generating unique domain names based on various input data, the algorithm complicates traditional domain-based blocking strategies. This adaptability allows the malicious actors to maintain persistent command-and-control communications, even when specific domains are identified and blacklisted, requiring security solutions to base their protection not on a fixed list of domains, but on an algorithm for generating them.

    Since early 2022, Grandoreiro leverages a known Delphi component shared among different malware families named RealThinClient SDK to remotely access victim machines and perform fraudulent actions. This SDK is a flexible and modular framework for building reliable and scalable Windows HTTP/HTTPS applications with Delphi. By using RealThinClient SDK, the program can handle thousands of active connections in an efficient multithreaded manner.

    Grandoreiro C2 Communication

    Operator tool

    Grandoreiro’s Operator is the tool that allows the cybercriminal to remotely access and control the victim’s machine. It’s a Delphi-based software that lists its victims whenever they start browsing a targeted financial institution website.

    Grandoreiro’s Operator tool

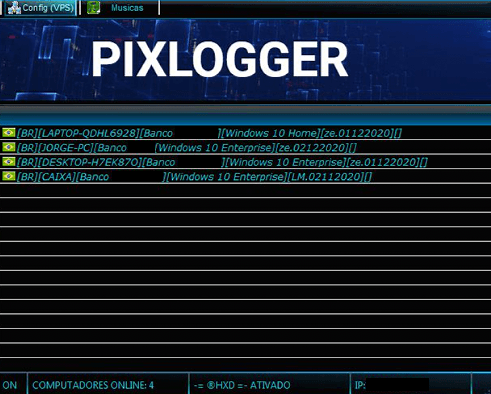
    Once the cybercriminal chooses a victim to operate on, they will be presented with the following screen, seen in the image below, which allows many commands to be executed and visualizes the victim’s desktop.
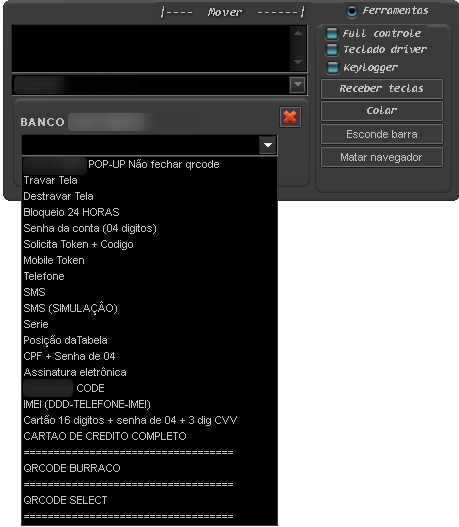
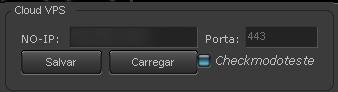
    Grandoreiro’s Operator commands

    Cloud VPS

    One overlooked feature of the Grandoreiro malware is what is called “Cloud VPS” by the attackers — it allows cybercriminals to set up a gateway computer between the victim’s machine and the malware operator, thus hiding the cybercriminal’s real IP address.

    This is also used by them to make investigation harder, as the first thing noted is the gateway’s IP address. When requesting a seizure, an investigator just finds the gateway module. Meanwhile, the criminal has already set up a new gateway somewhere else and new victims connect to the new one through its DGA.

    Grandoreiro Cloud VPS

    Victims and targets

    The Grandoreiro banking trojan is primed to steal the credentials accounts for 1,700 financial institutions, located in 45 countries and territories. After decrypting the strings of the malware, we can see the targeted banks listed separated by countries/territories. This doesn’t mean that Grandoreiro will target a specific bank from the list; it means it is ready to steal credentials and act, if there is a local partner or money mule who can operationalize and complete the action. The banks targeted by Grandoreiro are located in Algeria, Angola, Antigua and Barbuda, Argentina, Australia, Bahamas, Barbados, Belgium, Belize, Brazil, Canada, Cayman Islands, Chile, Colombia, Costa Rica, Dominican Republic, Ecuador, Ethiopia, France, Ghana, Haiti, Honduras, India, Ivory Coast, Kenya, Malta, Mexico, Mozambique, New Zealand, Nigeria, Panama, Paraguay, Peru, Philippines, Poland, Portugal, South Africa, Spain, Switzerland, Tanzania, Uganda, United Kingdom, Uruguay, USA, and Venezuela. It’s important to note that the list of targeted banks and institutions tend to slightly change from one version to another.

    From January to October 2024, our solutions blocked more than 150,000 infections impacting more than 30,000 users worldwide, a clear sign the group is still very active. According to our telemetry, the countries most affected by Grandoreiro infections are Mexico, Brazil, Spain, and Argentina, among many others.

    Conclusion

    We understand how difficult it is to eradicate a malware family, but it is possible to impede their operation with the cooperation of law enforcement agencies and the private sector — modern financial cybercrime can and must be fought.

    Brazilian banking trojans are already an international threat; they’re filling the gaps left by Eastern European gangs who have migrated into ransomware. We know that in some countries, internet banking is declining on desktops, forcing Grandoreiro to target companies and government entities who are still using operating in that way.

    The threat actors behind the Grandoreiro banking malware are continuously evolving their tactics and malware to successfully carry out attacks against their targets and evade security solutions. Kaspersky continues to cooperate with INTERPOL and other agencies around the world to fight the Grandoreiro threat among internet banking users.

    This threat is detected by Kaspersky products as HEUR:Trojan-Banker.Win32.Grandoreiro, Trojan-Downloader.OLE2.Grandoreiro, Trojan.PDF.Grandoreiro and Trojan-Downloader.Win32.Grandoreiro.

    For more information, please contact: crimewareintel@kaspersky.com

    Indicators of Compromise

    Host based
    f0243296c6988a3bce24f95035ab4885
    dd2ea25752751c8fb44da2b23daf24a4
    555856076fad10b2c0c155161fb9384b
    49355fd0d152862e9c8e3ca3bbc55eb0
    43eec7f0fecf58c71a9446f56def0240
    150de04cb34fdc5fd131e342fe4df638
    b979d79be32d99824ee31a43deccdb18

    MIL OSI Global Banks

  • MIL-OSI Security: Leader of Anchorage Drug Trafficking Conspiracy Gets 20 Years for Trafficking Fentanyl, Methamphetamine

    Source: Federal Bureau of Investigation (FBI) State Crime Alerts (b)

    ANCHORAGE, Alaska – The leader of an Anchorage drug trafficking conspiracy was sentenced today to 20 years in prison and five years’ supervised release for dealing fentanyl and methamphetamine in Anchorage.

    According to court documents, in 2022, Nigel Ivory, 29, of Anchorage, was released from prison after serving a federal sentence and began selling drugs in and around the Anchorage area.

    During the investigation, officials conducted three controlled purchases of drugs from Ivory between October 2022 and March 2023. During the first controlled purchase in October 2022, Ivory sold over 111 grams of methamphetamine and 98 fentanyl pills for $3,800. In January 2023, Ivory sold 282 fentanyl pills for $1,950. In March 2023, Ivory sold over 276 grams of methamphetamine and 487 fentanyl pills for $5,000.

    In February 2023, officials seized over $55,000 in cash that Ivory attempted to transport from Anchorage to Fort Wayne, Indiana, on a commercial flight. Ivory attempted to smuggle the cash by hiding it inside three tennis shoes in a checked bag. The cash had trace amounts of methamphetamine, cocaine and fentanyl on it. Later that month, officials also seized over 180 fentanyl pills from a co-conspirator during a traffic stop. Investigators uncovered text messages from Ivory directing the co-conspirator to hide the fentanyl pills from police.

    On June 22, 2023, officials simultaneously executed search warrants for two residences associated with Ivory, one of which was Ivory’s primary address. At 6:30 a.m., agents announced their presence outside Ivory’s residence. Ivory and a co-defendant did not come outside and surrender until 7:00 a.m. Upon searching the residence, agents recovered over $18,000 in U.S. currency, a money counter, drug packaging material, over 160 fentanyl pills, some of which were partially dissolved and scattered in a toilet bowl, two firearms and ammunition.

    In April and May 2023, law enforcement seized three additional packages, each containing more than a kilogram of fentanyl pills, from co-conspirators in the case, in which Ivory was involved in trafficking. The following co-conspirators were also charged in this case:

    • Brandon Beltz, 33, pleaded guilty to one count of conspiracy to distribute and possess with intent to distribute fentanyl on Aug. 13, 2024, and is awaiting sentencing.
    • Jack Breitenstein died of an apparent fentanyl overdose after spending nine months on pretrial release and the charges against him were dismissed on April 11, 2024. 
    • Wilanda Jackson, 23, is charged with one count of conspiracy to distribute and possess with intent to distribute fentanyl and one count of possession of a controlled substance with intent to distribute and is awaiting trial.
    • Don’Tia Nikolai, 21, is charged with one count of conspiracy to distribute and possess with intent to distribute fentanyl and one count of possession of a controlled substance with intent to distribute and is awaiting trial. 

    As a result of the investigation, the defendant is accountable for 5.3 kilograms of fentanyl and over 380 grams of methamphetamine. Ivory pleaded guilty to one count of conspiracy to distribute and possess with intent to distribute controlled substances and one count of distribution of methamphetamine and fentanyl in April 2024.

    “Fatal drug overdoses rose over 44% this past year, with the majority involving fentanyl, posing a grave threat to Alaskans,” said U.S. Attorney S. Lane Tucker for the District of Alaska. “Keeping fentanyl out of our communities is a top priority, and we urge the public to report any drug trafficking activities to law enforcement. We will continue to work closely with law enforcement to investigate and prosecute those who conspire to traffic dangerous drugs in our state.”

    “Mr. Ivory callously trafficked massive quantities of deadly fentanyl pills into and throughout Alaska, poisoning our communities and destroying lives in the process,” said Assistant Special Agent in Charge Zachary Pomerantz of the FBI Anchorage Field Office. “This investigation, worked alongside our local, state, and federal law enforcement partners, represents one of highest fentanyl seizures known in Alaska, underscoring the FBI’s commitment to disrupting and dismantling drug trafficking organizations that threaten the safety of our communities.”

    “Your Alaska State Troopers will continue to work with our local, state, and federal law enforcement partners to hold anyone that traffics dangerous drugs such as fentanyl accountable for their actions,” stated Alaska State Troopers Colonel Maurice Hughes. “I hope that this significant prison sentence serves as a deterrent to those that are peddling drugs in our state. To those trafficking dangerous drugs in Alaska, know that law enforcement will catch up to you, arrest you, and prosecute you to the fullest extent of the law.”

    The FBI Anchorage Field Office, Alaska State Troopers, Anchorage Police Department, IRS Criminal Investigation and U.S. Coast Guard Investigative Service investigated the case.

    Assistant U.S. Attorney Chris Schroeder prosecuted the case.

    UPDATE: This release has been updated to include the U.S. Coast Guard Investigative Service.

    ###

    MIL Security OSI

  • MIL-OSI USA: Warren Celebrates 5 New Zero-Emission School Buses for Worcester Public Schools

    US Senate News:

    Source: United States Senator for Massachusetts – Elizabeth Warren

    October 22, 2024

    Warren Celebrates 5 New Zero-Emission School Buses for Worcester Public Schools 

    Boston, MA – U.S. Senator Elizabeth Warren (D-Mass.) celebrated the announcement that the Worcester Public Schools will replace 5 school buses with zero-emission, clean school buses through the U.S. Environmental Protection Agency 2023 Clean School Bus Rebate program. 

    The Clean School Bus Program has awarded funding to replace nearly 9,000 natural gas and diesel buses across the country. Funding for the Clean School Bus Program comes from the Bipartisan Infrastructure Law, which provided $5 billion to transform the country’s fleet of school buses.

    “Our children shouldn’t have to breathe in dangerous exhaust while getting to and from school,” said Senator Warren. “I’ve fought hard for clean energy investments for our Commonwealth. Now, Central Massachusetts’ families will have cleaner air, even more buses that are cheaper to repair and don’t guzzle up gas, and savings for the Worcester Public Schools.” 

    Senator Warren has advocated for federal funding to jumpstart the transition to all-electric public vehicles and rail and to help tackle the climate crisis: 

    • In July 2024, Senators Warren and Markey and Representatives Lynch, Pressley, and Keating announced nearly $60 million in funding for Massachusetts communities to transition to low- or zero-emission buses. This upgrade is improving bus fleets, reducing transit systems’ reliance on fossil fuels, and curbing diesel-related air pollution along major transit corridors for Black, Brown, and low-income communities who are disproportionately harmed by the impacts of the climate crisis.
    • In May 2024, Senator Elizabeth Warren and Congressman Robert Garcia (D-Calif.) reintroduced the BUILD GREEN Infrastructure and Jobs Act, which would authorize the U.S. Department of Transportation to distribute $500 billion over ten years to electrify and modernize public vehicles  and build new electric transportation infrastructure across the country.
    • In January 2024, Senators Elizabeth Warren and Ed Markey (D-Mass.) announced that the Environmental Protection Agency awarded Massachusetts funding for 85 electric school buses under the Clean Bus Grant Program to help school districts replace polluting diesel school buses with electric or low-emission school buses. 
    • In July 2023, Senator Elizabeth Warren sent a letter to the Massachusetts Municipal Association, Massachusetts Association of School Superintendents and 33 Commonwealth municipalities, highlighting the benefits of electrifying the Commonwealth’s school bus fleets and encouraging the Associations and their members to take full advantage of the newly-announced EPA Clean School Bus Grants Program Notice of Funding Opportunity. 
    • In August 2022, Congress passed the Inflation Reduction Act, which included $1 billion for states, municipalities, tribes, and nonprofit school transportation associations to use for clean heavy duty vehicles, like school and transit buses and garbage trucks, all in part funded by Senator Elizabeth Warren’s Corporate Profits Minimum Tax to ensure America’s largest corporations pay at least 15% of their massive profits in federal taxes. 
    • In May 2021, Senator Warren and Congressman Levin (D-Mich.) introduced the Buy Green Act of 2021. First announced in March 2021, the bill would establish $1.5 trillion in federal procurement commitments over the next ten years to purchase American-made clean, renewable, and emission-free energy products for federal, state, and local use. The bill also establishes a grant program for U.S. companies to invest in clean energy manufacturing.
    • In May 2021, in a Senate Finance Committee hearing, Senator Warren made the case for large-scale federal investments in green infrastructure, as well as her Wealth Tax and other tax proposals as a way to pay for these investments. 
    • In April 2021, in a Senate Banking, Housing, and Urban Affairs Committee hearing, Senator Warren made the case for the need to tackle climate change by investing in our nation’s clean energy infrastructure, including the replacement of buses powered by diesel with electric buses. 

    MIL OSI USA News

  • MIL-OSI USA: Casten Leads Bipartisan Effort to Improve Investment Tax Credit for Geothermal Heat Pumps

    Source: United States House of Representatives – Representative Sean Casten (IL-06)

    October 22, 2024

    Washington, D.C. — U.S. Congressman Sean Casten (IL-06) led a bipartisan group of lawmakers in urging Treasury Secretary Janet Yellen to revise the proposed rule for an investment tax credit (ITC) to ensure Americans can benefit from the energy and cost savings provided by geothermal heat pump (GHP) technology.

    “The NPRM [Notice of Proposed Rulemaking] prevents multiple taxpayers that own different components of a GHP that are functionally interdependent from claiming a tax credit under the ITC. We believe this proposed rule misapplies congressional intent and creates difficulties for taxpayers in their ability to benefit from the credit,” the lawmakers wrote. “To ensure that Americans can appropriately benefit from the energy and cost savings provided by GHP systems, Treasury should modify the proposed rule to ensure that different taxpayers who own separate, functionally independent components of a GHP system are eligible to claim the ITC for the equipment they own.”

    GHP systems are among the most efficient ways to heat and cool buildings, with enormous potential to both lower energy bills and reduce carbon emissions. 

    In addition to Rep. Casten, the letter was signed by Reps. Larry Bucshon, Nanette Diaz Barragán, Nikki Budzinski, Lori Trahan, Betty McCollum, Mike Quigley, Becca Balint, Joseph Morelle, Paul Tonko, Chellie Pingree, and Rosa DeLauro.

    A copy of the letter can be found here, and text of the letter can be found below.

    Dear Secretary Yellen:

    We write in response to the Treasury Department’s (“Treasury”) Notice of Proposed Rulemaking Reg- 132569-17 (“NPRM”) for the investment tax credit (“ITC”) under Section 48 of the Internal Revenue Code, as amended (“Code”) and underscore the impact the regulation would have on the expanded deployment of geothermal heat pump (“GHP”) system technology. In particular, the NPRM prevents multiple taxpayers that own different components of a GHP that are functionally interdependent from claiming a tax credit under the ITC. We believe this proposed rule misapplies congressional intent and creates difficulties for taxpayers in their ability to benefit from the credit.

    Correcting the proposed regulation in the final rule is critical for home-based and community scale GHP systems which, by design, typically involve multiple owners. GHP networks can serve a diverse array of customer buildings while those customers own and maintain their own GHP equipment within the building.

    GHP systems are among the most efficient ways to heat and cool buildings and GHP deployment holds enormous potential to lower energy bills for American families and businesses and reduce emissions from heating and cooling homes, schools, and businesses. Due to their reliable performance during temperature extremes, GHP systems provide households with certainty in their energy bills and insulate consumers from peak energy price shocks due to extreme weather events.

    A December 2023 report from the Department of Energy’s Oak Ridge National Laboratory confirms that GHPs are a ready-made strategy for decarbonizing buildings, reducing the need for new electricity generation and transmission infrastructure, and bringing energy savings to Americans nationwide. According to DOE’s report, broad adoption of GHPs would result in cumulative savings to the U.S. economy of more than $1 trillion by 2050, eliminating the need for 24,500 miles of transmission lines, creating a 13 percent decrease in the amount of required electricity generation, and a reducing CO2 emission by 7,351 million metric tons.

    As drafted, the NPRM prevents multiple taxpayers who own different components of a GHP that are functionally interdependent from claiming a tax credit under the ITC. This is based on Treasury’s interpretation that the ground loop and the GHP units are functionally interdependent yet distinct components of the same system (unless the two taxpayers share more than 50 percent overlapping ownership of the equipment). This interpretation contravenes the plain text of Section 48, which permits the owner of energy property to claim the ITC when the original use of that energy property began with such owner. With the enactment of the Inflation Reduction Act, Congress gave much overdue recognition to GHP systems by granting the technology the same credit as the other ITC-eligible technologies.

    To ensure that Americans can appropriately benefit from the energy and cost savings provided by GHP systems, Treasury should modify the proposed rule to ensure that different taxpayers who own separate, functionally independent components of a GHP system are eligible to claim the ITC for the equipment they own.

    The proposed rule also creates a new trap for taxpayers who may believe they own an entire unit of energy property and are eligible for the ITC but are later deemed ineligible due to a finding by the IRS. This makes the ITC less flexible and would pose an increased risk for taxpayers, likely disincentivizing private sector investments in GHP and other ITC-eligible projects. Additionally, the final rule should allow individual items of energy property to qualify for the ITC even when they are placed into service after other related energy property. This level of flexibility will further incentivize the widespread investment in and adoption of GHP systems.

    To ensure the maximum deployment of GHP systems, we urge Treasury to incorporate the above changes in any final rule on the Section 48 ITC tax credit issued by the agency.

    Thank you for your attention to this important matter.

    # # #

    MIL OSI USA News

  • MIL-OSI: Vicor Corporation Reports Results for the Third Quarter Ended September 30, 2024

    Source: GlobeNewswire (MIL-OSI)

    ANDOVER, Mass., Oct. 22, 2024 (GLOBE NEWSWIRE) — Vicor Corporation (NASDAQ: VICR) today reported financial results for the third quarter ended September 30, 2024. These results will be discussed later today at 5:00 p.m. Eastern Time, during management’s quarterly investor conference call. The details for the call are below.

    Revenues for the third quarter ended September 30, 2024 totaled $93.2 million, a 13.6% decrease from $107.8 million for the corresponding period a year ago, and an 8.5% sequential increase from $85.9 million in the second quarter of 2024.

    Gross margin decreased to $45.7 million for the third quarter of 2024, compared to $55.9 million for the corresponding period a year ago but increased from $42.8 million for the second quarter of 2024. Gross margin, as a percentage of revenue, decreased to 49.1% for the third quarter of 2024, compared to 51.8% for the corresponding period a year ago and 49.8% for the second quarter of 2024. Operating expenses increased to $40.4 million for the third quarter of 2024, compared to $40.2 million for the corresponding period a year ago, and decreased sequentially from $42.6 million for the second quarter of 2024.

    Net income for the third quarter was $11.6 million, or $0.26 per diluted share, compared to net income of $16.6 million or $0.37 per diluted share, for the corresponding period a year ago and net loss of $(1.2) million, or $(0.03) per diluted share, for the second quarter of 2024.

    Cash flow from operations totaled $22.6 million for the third quarter, compared to cash flow from operations of $23.8 million for the corresponding period a year ago, and cash flow from operations of $15.6 million in the second quarter of 2024. Capital expenditures for the third quarter totaled $8.4 million, compared to $7.7 million for the corresponding period a year ago and $6.1 million for the second quarter of 2024. Cash and cash equivalents as of September 30, 2024 increased 6.2% sequentially to approximately $267.6 million compared to approximately $251.9 million as of June 30, 2024.

    Backlog for the third quarter ended September 30, 2024 totaled $150.6 million, a 13.8% decrease from $174.7 million for the corresponding period a year ago, and 2.1% sequential decrease from $153.8 million at the end of the second quarter of 2024.

    Commenting on third quarter performance, Chief Executive Officer Dr. Patrizio Vinciarelli stated: “Revenues and cash flow improved in Q3 while gross margins were impacted primarily by product mix. We are close to initial deliveries of 2nd generation, high density VPD systems for leading AI applications with current multipliers achieving superior density, bandwidth and signal integrity. Vicor’s VPD will enable AI processors setting new standards for compute performance and power system efficiency.”

    “We are off to a good start asserting our Intellectual Property against unscrupulous actors playing a game of “catch me if you can”. As indicated in a recent Initial Determination from the International Trade Commission (“ITC”), contract manufacturers may be precluded from importing computing systems using infringing modules. Redesigned modules, or discrete alternatives, may still infringe and OEMs condoning infringement are taking chances with their supply chain. Leaders in Artificial Intelligence licensing Vicor IP are wisely securing a resilient supply chain of enabling power system solutions.”

    For more information on Vicor and its products, please visit the Company’s website at http://www.vicorpower.com.

    Earnings Conference Call

    Vicor will be holding its investor conference call today, Tuesday, October 22, 2024 at 5:00 p.m. Eastern Time. Vicor encourages investors and analysts who intend to ask questions via the conference call to register with Notified, the service provider hosting the conference call. Those registering on Notified’s website will receive dial-in info and a unique PIN to join the call as well as an email confirmation with the details. Registration may be completed at any time prior to 5:00 p.m. on October 22, 2024. For those parties interested in listen-only mode, the conference call will be webcast via a link that will be posted on the Investor Relations page of Vicor’s website prior to the conference call. Please access the website at least 15 minutes prior to the conference call to register and, if necessary, download and install any required software. For those who cannot participate in the live conference call, a webcast replay of the conference call will also be available on the Investor Relations page of Vicor’s website.

    This press release contains certain forward-looking statements within the meaning of Section 27A of the Securities Act of 1933, as amended, and Section 21E of the Securities Exchange Act of 1934, as amended. Any statement in this press release that is not a statement of historical fact is a forward-looking statement, and, the words “believes,” “expects,” “anticipates,” “intends,” “estimates,” “plans,” “assumes,” “may,” “will,” “would,” “should,” “continue,” “prospective,” “project,” and other similar expressions identify forward-looking statements. Forward-looking statements also include statements regarding bookings, shipments, revenue, profitability, targeted markets, increase in manufacturing capacity and utilization thereof, future products and capital resources. These statements are based upon management’s current expectations and estimates as to the prospective events and circumstances that may or may not be within the company’s control and as to which there can be no assurance. Actual results could differ materially from those projected in the forward-looking statements as a result of various factors, including those economic, business, operational and financial considerations set forth in Vicor’s Annual Report on Form 10-K for the year ended December 31, 2023, under Part I, Item I — “Business,” under Part I, Item 1A — “Risk Factors,” under Part I, Item 3 — “Legal Proceedings,” and under Part II, Item 7 — “Management’s Discussion and Analysis of Financial Condition and Results of Operations.” The risk factors set forth in the Annual Report on Form 10-K may not be exhaustive. Therefore, the information contained in the Annual Report on Form 10-K should be read together with other reports and documents filed with the Securities and Exchange Commission from time to time, including Forms 10-Q, 8-K and 10-K, which may supplement, modify, supersede or update those risk factors. Vicor does not undertake any obligation to update any forward-looking statements as a result of future events or developments.

    Vicor Corporation designs, develops, manufactures, and markets modular power components and complete power systems based upon a portfolio of patented technologies. Headquartered in Andover, Massachusetts, Vicor sells its products to the power systems market, including enterprise and high performance computing, industrial equipment and automation, telecommunications and network infrastructure, vehicles and transportation, and aerospace and defense electronics.

    For further information contact:

    James F. Schmidt, Chief Financial Officer
    Office: (978) 470-2900
    Email: invrel@vicorpower.com

                   
    VICOR CORPORATION
                   
    CONDENSED CONSOLIDATED STATEMENT OF OPERATIONS      
    (Thousands except for per share amounts)
                   
      QUARTER ENDED   YEAR ENDED
      (Unaudited)   (Unaudited)
                   
      SEPT 30,   SEPT 30,   SEPT 30,   SEPT 30,
      2024   2023
      2024   2023
                   
                   
    Net revenues $93,166     $107,844     $262,892     $312,407  
    Cost of revenues   47,422       51,966       129,254       154,822  
    Gross margin   45,744       55,878       133,638       157,585  
                   
    Operating expenses:              
    Selling, general and administrative   23,398       22,422       72,715       63,020  
    Research and development   16,960       17,752       51,938       50,556  
    Litigation-contingency expense               19,500        
    Total operating expenses   40,358       40,174       144,153       113,576  
                   
    Income (loss) from operations   5,386       15,704       (10,515 )     44,009  
                   
    Other income (expense), net   3,713       1,917       9,244       5,643  
                   
    Income (loss) before income taxes   9,099       17,621       (1,271 )     49,652  
                   
    Less: (Benefit) provision for income taxes   (2,455 )     1,038       2,832       4,716  
                   
    Consolidated net income (loss)   11,554       16,583       (4,103 )     44,936  
                   
    Less: Net income attributable to noncontrolling interest   2       1       14       9  
                   
    Net income (loss) attributable to Vicor Corporation $11,552     $16,582     ($4,117 )   $44,927  
                   
                   
    Net income (loss) per share attributable to Vicor Corporation:              
    Basic $0.26     $0.37     ($0.09 )   $1.01  
    Diluted $0.26     $0.37     ($0.09 )   $1.00  
                   
    Shares outstanding:              
    Basic   45,117       44,433       44,829       44,275  
    Diluted   45,174       45,187       44,829       45,000  
                   
    VICOR CORPORATION
           
    CONDENSED CONSOLIDATED BALANCE SHEET
    (Thousands)
           
      SEPT 30,   DEC 31,
      2024   2023
      (Unaudited)   (Unaudited)
    Assets      
           
    Current assets:      
    Cash and cash equivalents $ 267,605     $ 242,219  
    Accounts receivable, net   58,525       52,631  
    Inventories   105,761       106,579  
    Other current assets   18,933       18,937  
    Total current assets   450,824       420,366  
           
    Long-term deferred tax assets   288       296  
    Long-term investment, net   2,640       2,530  
    Property, plant and equipment, net   158,779       157,689  
    Other assets   20,231       14,006  
           
    Total assets $ 632,762     $ 594,887  
           
    Liabilities and Equity      
           
    Current liabilities:      
    Accounts payable $ 15,724     $ 12,100  
    Accrued compensation and benefits   12,449       11,227  
    Accrued expenses   6,429       5,093  
    Accrued litigation   26,550       6,500  
    Sales allowances   2,640       3,482  
    Short-term lease liabilities   1,739       1,864  
    Income taxes payable   642       746  
    Short-term deferred revenue and customer prepayments   4,198       3,157  
           
    Total current liabilities   70,371       44,169  
           
    Long-term deferred revenue         1,020  
    Long-term income taxes payable   1,916       2,228  
    Long-term lease liabilities   5,605       6,364  
    Total liabilities   77,892       53,781  
           
    Equity:      
    Vicor Corporation stockholders’ equity:      
    Capital stock   402,687       384,395  
    Retained earnings   292,557       296,674  
    Accumulated other comprehensive loss   (1,198 )     (1,273
    Treasury stock   (139,424     (138,927
    Total Vicor Corporation stockholders’ equity   554,622       540,869  
    Noncontrolling interest   248       237  
    Total equity   554,870       541,106  
           
    Total liabilities and equity $ 632,762     $ 594,887  
           

    The MIL Network

  • MIL-OSI United Kingdom: Transport Secretary announces urgent action to get a grip on spiralling HS2 costs 

    Source: United Kingdom – Executive Government & Departments

    Today’s announcement marks the latest step in the Transport Secretary’s mission to overhaul the railways, ensuring infrastructure works for the whole country.

    • Transport Secretary announces tough measures to bring the cost and delivery of HS2 back under control 
    • follows the launch of an independent review into the oversight of HS2
    • forms part of the government’s mission to rebuild Britain and deliver infrastructure that works for the whole country    

    Action to control the cost of HS2 and bring the project back on track has been announced by the Transport Secretary today (20 October 2024) after years of failed delivery.

    Just months into the role, Louise Haigh has warned the extent of the challenge inherited on HS2 has become clear, with costs being allowed to spiral out of control and failure to deliver to budget.

    Over the years, the cost of Phase One has soared, due to poor project management, inflation and poor performance from the supply chain, without sufficient explanation of what is to be done to deliver to budget.

    In response, the Secretary of State has launched an independent review to ensure lessons are learned to support action and to ensure that the costs for HS2 are brought under control.

    The government has been clear it is not resurrecting Phase 2 of HS2, which was cancelled under the previous administration. The government recognises concerns about connectivity between Birmingham and Manchester, but its primary focus now is the safe delivery of HS2 between Birmingham and London at the lowest reasonable cost, and the Secretary of State has made this objective clear to HS2 Ltd.

    To achieve this, the government is also reinstating ministerial oversight of the project to ensure greater accountability. This will see regular meetings starting immediately, where both the Transport Secretary and Rail Minister, Lord Hendy, alongside the Chief Secretary to the Treasury, will challenge delivery and remove obstacles to securing the full benefits of the railway more cost effectively.   

    Transport Secretary Louise Haigh said:

    One of my first jobs as Transport Secretary has been to urgently review the position I have inherited on HS2.   

    It has long been clear that the costs of HS2 have been allowed to spiral out of control, but since becoming Transport Secretary I have seen up close the scale of failure in project delivery – and it’s dire.

    Taxpayers have a right to expect HS2 is delivered efficiently and I won’t stand for anything less.   

    I have promised to work fast and fix things and that’s exactly why I have announced urgent measures to get a grip on HS2’s costs and ensure taxpayers’ money is put to good use.  It’s high time we make sure lessons are learnt and the mistakes of HS2 are never repeated again.

    The Major Transport Projects Governance and Assurance Review will be led by senior infrastructure delivery adviser, James Stewart, and will present recommendations back to the government this winter.  

    It will investigate the oversight of major transport infrastructure projects, including the effectiveness of forecasting and reporting of cost, schedule and benefits, as well as actions to deliver cost efficiencies. The review will primarily draw on experiences of HS2 to date to ensure recommendations and learnings are applied to its delivery as well as to future projects. 

    Separately, the incentives of the main HS2 contractors are also being reviewed, which could lead to some contracts being renegotiated or amended.

    Today’s announcement comes as the Transport Secretary writes to the Chair of HS2 Ltd, recognising the collective responsibility in reaching the current position, stressing the need to focus immediately on action to turn things around and bring costs back under control.

    As part of this effort to get a grip on costs, the management of HS2 Ltd will shortly be taken over by a new Chief Executive, Mark Wild, who has an extensive background in delivering transport projects and will be responsible for resetting the project.

    On his arrival, the Transport Secretary will task him with assessing the current position on cost, schedule and culture, and providing an action plan to deliver the remaining work as cost effectively as possible, including at a realistic budget and schedule.

    The government will also continue to publish 6-monthly reports on the progress of HS2, ensuring complete accountability and transparency on the project’s progress.   

    Today’s announcement marks the latest step in the Transport Secretary’s mission to overhaul the railways, ensuring infrastructure works for the whole country.

    Rail media enquiries

    Media enquiries 0300 7777878

    Switchboard 0300 330 3000

    Updates to this page

    Published 20 October 2024

    MIL OSI United Kingdom

  • MIL-OSI USA: FACT SHEET: Biden-⁠ Harris Administration Proposes Rule to Expand Coverage of Affordable Contraception Under the Affordable Care  Act

    US Senate News:

    Source: The White House
    Biden-Harris Administration Announces Proposal for Most Significant Expansion of Contraception Coverage Under the Affordable Care Act in More Than a Decade
    President Biden and Vice President Harris have protected and built on the Affordable Care Act. Nearly 50 million people over the past decade have had coverage through the Affordable Care Act’s Marketplaces, and the law has protected more than 100 million people with preexisting medical conditions. Thanks to the Biden-Harris Administration, Affordable Care Act coverage is more affordable than ever with millions of families saving an average of $800 per year on Marketplace coverage.
    The Affordable Care Act has also helped millions of women save billions of dollars on contraception—an essential component of reproductive health care that has only become more important since the Supreme Court overturned Roe v. Wade. As part of President Biden and Vice President Harris’ steadfast commitment to reproductive rights, the Biden-Harris Administration has further strengthened contraception access and affordability under the Affordable Care Act, through Medicare and Medicaid, through the Title X Family Planning Program, through federally qualified health centers, and for federal employees, Service members, veterans, and college students.
    Today, the Biden-Harris Administration is proposing a rule that would significantly increase coverage of contraception without cost sharing for 52 million women of reproductive age with private health insurance. Building on the Affordable Care Act’s requirement that most private health plans must cover contraception without cost sharing, today’s proposed rule from the Departments of Health and Human Services (HHS), Labor, and the Treasury would:
    Expand coverage of over-the-counter contraception without cost sharing. Under the proposed rule, for the first time, women would be able to obtain over-the-counter (OTC) contraception without a prescription at no additional cost. As a result, more women would be able to access and afford critical OTC medications such as emergency contraception and the first-ever daily oral contraceptive approved by the Food and Drug Administration (FDA) for use without a prescription that is now widely available across the country.
    Make it easier to learn about coverage for OTC contraception. To help ensure that women understand this new benefit, most private health plans would be required to disclose that OTC contraception is covered without cost sharing and without a prescription—and take steps to help women learn more about their contraception coverage.
    Strengthen coverage of prescribed contraception without cost sharing. The proposed rule would make it easier for most women with private health insurance to obtain contraception without cost sharing that is prescribed by their health care provider. Health plans would be required to cover every FDA-approved contraceptive drug or drug-led combination product without cost sharing unless the plan also covers a therapeutic equivalent without cost sharing, eliminating barriers that some women continue to face in accessing contraception prescribed by their provider.
    This proposed rule, if finalized, would be the most significant expansion of contraception coverage under the Affordable Care Act since 2012, when contraception was first required to be covered. Also today, the Biden-Harris Administration is issuing new guidance to help ensure that patients can access other preventive services, such as cancer screenings, that must be covered without cost sharing under the Affordable Care Act.
    The Biden-Harris Administration is issuing this proposed rule at a time when reproductive rights are under attack, and Republican elected officials remain committed to repealing the Affordable Care Act. Following the Supreme Court’s decision to overturn Roe v. Wade, dangerous and extreme abortion bans are putting women’s health and lives at risk and disrupting access to critical health care services, including contraception, as health care providers are forced to close in states across the country. At the same time, Republican elected officials in some states have made clear they want to ban or restrict birth control in addition to abortion, and Republicans in Congress have attacked contraception access nationwide by proposing to defund the Title X Family Planning Program. In contrast, President Biden and Vice President Harris believe that women in every state must have the freedom to make deeply personal health care decisions, including the right to decide if and when to start or grow their family.
    Today’s announcements build on actions that the Biden-Harris Administration has already taken to expand access to affordable contraception, including to implement the President’s Executive Order on Strengthening Access to Affordable, High-Quality Contraception and Family Planning Services from June 2023. The Administration has taken action to:
    Expand contraception coverage and affordability under the Affordable Care Act. The Departments of HHS, Labor, and the Treasury proposed a rule to provide a new pathway under the Affordable Care Act for women to access coverage of contraceptives when their private health coverage is exempt from covering this benefit due to a religious objection. These agencies also issued new guidance to support expanded coverage of a broader range of FDA-approved, cleared, or granted contraceptives at no additional cost under the Affordable Care Act, building on guidance issued after Roe v. Wade was overturned to clarify protections for contraceptive coverage under the Affordable Care Act. Further, HHS strengthened the standard for inclusion of family planning providers in Marketplace plan provider networks and provided nearly $9 million in grant funding to support state efforts to enhance and expand coverage of, and access to, reproductive and maternal health services, including contraception. And the Internal Revenue Service issued new guidance affirming that high-deductible health plans can cover OTC contraception as preventive care.
    Bolster family planning services through Title X clinics. HHS continues to rebuild and grow the Title X Family Planning Program, which has played a critical role in ensuring access to a broad range of high-quality family planning and preventive health services for more than 50 years. During the prior administration, more than 1,000 service sites left the Title X Family Planning Program, leading to a significant decline in people served. The Biden-Harris Administration reversed the policy changes that led to those departures, strengthening the Title X Family Planning Program and helping ensure that the Program remains a critical part of the nation’s health safety net. In 2023, HHS provided about $287 million to nearly 4,000 Title X clinics across the country to provide free or low-cost voluntary, client-centered family planning and related preventive services for 2.8 million women and families—an 80 percent increase since 2020.
    Support family planning coverage through the Medicaid and Medicare programs. The Centers for Medicare & Medicaid Services (CMS) issued new guidance to state Medicaid programs and Children’s Health Insurance Programs (CHIP) to help ensure that enrollees can access family planning services. The new guidance outlined existing state obligations under federal law, highlighted strategies to enhance access to contraception, affirmed confidentiality requirements for those seeking family planning services, and shared recommendations on ways to measure quality in delivering family planning services. To help ensure that women with Medicare coverage have access to more covered types of contraception without unnecessary barriers, CMS updated its Medicare Part D formulary clinical review process for plan year 2024 and 2025 to include additional contraceptive types, such as long-acting contraceptives, and is increasing public awareness of contraceptive coverage options under Medicare Part B. The Secretary of HHS also issued a letter to state Medicaid and CHIP programs as well as private health insurers and Medicare plans about their existing obligations to cover contraception for those they serve.
    Increase contraception access through federal health centers. Federal health centers continue to be an important source of family planning services: in 2023, health centers provided nearly 3 million contraceptive services visits to patients, a 14 percent increase since 2020. To support health centers in providing high-quality family planning services, the Health Resources and Services Administration (HRSA) provided updated guidance on existing federal requirements for family planning and related services, which is a required primary health care service under federal law, as well as evidence-based recommendations and resources. HRSA also adopted new data measures for health centers that will help assess whether patients have been screened for contraception needs. Screening and data measures will help enhance the overall delivery of voluntary family planning and related services.
    Support contraception access for federal employees and their families. The Office of Personnel Management strengthened access to contraception for federal workers, retirees, and family members by issuing guidance to insurers participating in the Federal Employee Health Benefits Program to clarify standards and support expanded coverage of a broader range of FDA-approved, cleared, or granted contraceptives at no additional cost. The Office of Personnel Management also required insurers that participate in the Federal Employee Health Benefits Program to take additional steps to educate enrollees about their contraception benefits and launched a public education campaign to highlight contraception benefits available to federal employees and their families.
    Promote contraception access and affordability for Service members and their families and certain dependents of veterans. To improve access to contraception at military hospitals and clinics, the Department of Defense expanded walk-in contraceptive care services for active-duty Service members and other Military Health System beneficiaries and eliminated TRICARE copays for certain contraceptive services. And the Department of Veterans Affairs eliminated out-of-pocket costs for certain types of contraception through the Civilian Health and Medical Program of the Department of Veterans Affairs.
    Support access to affordable contraception for college students. To help increase access to contraception for college students, President Biden directed the Secretary of Education to convene institutions of higher education to share best practices and ways to help students understand their options for accessing contraception. In 2023, Vice President Harris joined a Department of Education convening of representatives from 68 colleges and universities across 32 states to discuss promising strategies for protecting and expanding access to contraception for their students. This convening followed Vice President Harris’s multiple conversations about reproductive health access with students on college campuses across the country.
    Enhance contraception access through technical assistance and public-private partnership. In June 2023, HHS announced a new five-year public-private partnership to expand access to contraception with Upstream, a national nonprofit organization that provides health centers with free patient-centered, evidence-based training and technical assistance to eliminate provider-level barriers to offering the full range of contraceptive options. To date, HHS has connected Upstream to more than 130 health care clinics, resulting in partnerships that will help Upstream accelerate their national expansion to reach 5 million women of reproductive age every year.
    Promote research and data analysis on contraception access. To document the gaps and disparities in contraception access as well as the benefits of comprehensive coverage, HHS convened leading experts to discuss the state of research, data collection, and data analysis on contraception access and family planning services. These convenings helped identify research gaps, opportunities for collaboration, and ways to bolster research efforts for both Federal agencies and external partners.
    In addition to strengthening access to affordable contraception, the Biden-Harris Administration continues to implement President Biden’s threeExecutiveOrders and a Presidential Memorandum directing federal agencies to protect access to reproductive health care issued since the Court overturned Roe v. Wade. To date, the Biden-Harris Administration has taken action to protect access to abortion, including FDA-approved medication abortion; defend access to emergency medical care; support the ability to travel for reproductive health care; safeguard the privacy of patients and health care providers; and ensure access to accurate information and legal resources.
    The Vice President has led the White House’s efforts to partner with leaders on the frontlines of protecting access to abortion, highlighting the harm of abortion bans to women’s health at more than 100 events in more than 20 states since Roe v. Wade was overturned, and meeting with hundreds of  state legislators, health care providers, and advocates. On what would have been the 51st anniversary of Roe v. Wade, the Vice President launched a nationwide Fight for Reproductive Freedoms tour to continue fighting back against extreme attacks throughout America.
    President Biden and Vice President Harris will continue to call on Congress to restore the protections of Roe v. Wade in federal law to ensure that women in every state are able to make their own decisions about reproductive health care.

    MIL OSI USA News

  • MIL-OSI United Kingdom: Bury director jailed after failing to produce accounts for company which owed more than £200,000 in tax

    Source: United Kingdom – Executive Government & Departments

    Director jailed for offences under the Insolvency and Companies Act

    • Vezubuhle Ndlovu was the director of VN Electrics Limited when it went into liquidation owing more than £200,000 in unpaid tax 

    • Ndlovu failed to deliver accounting records to the liquidator as he was required to do so under law 

    • This failure meant his company’s accounts could not be investigated, resulting in criminal investigations into the 41-year-old by the Insolvency Service 

    A Bury director who failed to produce accounting records and refused to co-operate with the Insolvency Service after his company went into liquidation owing more than £200,000 in unpaid tax has been jailed. 

    Vezubuhle Ndlovu was sentenced to 10 months in prison when he appeared at Manchester Crown Court on Tuesday 15 October. 

    The 41-year-old had previously pleaded guilty to offences under the Insolvency Act and Companies Act for his VN Electrics Limited business. 

    Ndlovu, of Spinney Crescent, Bury, failed to provide up-to-date records to the Insolvency Service when VN Electrics was liquidated in 2019, meaning the Official Receiver could not accurately assess the company’s position and liabilities. 

    David Snasdell, Chief Investigator at the Insolvency Service, said: 

    Vezubuhle Ndlovu’s offending was persistent and he has shown no insight into his criminal actions.  

    If a company fails to keep proper records it exposes creditors and trading partners to unacceptable levels of risk. A company that does not keep records is more likely to fail and the Official Receiver or insolvency practitioner will be unable to identify and take steps to recover the company’s assets. 

    Ndlovu failed in his statutory duties to deliver up-to-date accounting records and at no point engaged with the Official Receiver or our investigators when asked to do so. 

    VN Electrics was established in May 2017, with Ndlovu the sole director. The company’s business was described on Companies House as ‘non-specialised wholesale trade’. 

    The company was liquidated in December 2019 after a petition from HM Revenue and Customs, which was owed £221,600 by VN Electrics. 

    The Insolvency Service wrote to Ndlovu on three separate occasions after VN Electrics was wound-up, reminding him of his statutory duty to preserve the company’s books and records and to deliver them to the Official Receiver. 

    Ndlovu failed to respond and did not turn up to an interview at the Official Receiver’s Office. 

    Civil proceedings which resulted in a seven-year director disqualification for Ndlovu began in September 2020 and concluded in April 2022. At no point did Ndlovu engage with the investigation. 

    Just one month after Ndlovu’s director ban, criminal investigators from the Insolvency Service invited him in for interview. Again, Ndlovu failed to respond or attend the interview. 

    Ndlovu’s failure to deliver books and records meant the Official Receiver was unable to establish if sales and purchases of just more than £1 million were the true level of VN Electrics’ income and expenditure between August 2017 and February 2019. 

    The Official Receiver was also unable to determine if VN Electrics owned any assets at any time between incorporation and liquidation, and if so, what happened to them. 

    Further information 

    Updates to this page

    Published 22 October 2024

    MIL OSI United Kingdom

  • MIL-OSI United Kingdom: York taxi passengers to get safer, greener rides

    Source: City of York

    Published Tuesday, 22 October 2024

    New requirements for York taxis and private hire vehicles are set to make them among the safest in the UK.

    This will stem from a new policy which incorporates national guidance and will make them even safer, with fewer emissions and will offer greater choice, especially for disabled passengers.

    An extensive consultation carried out this summer has helped shape a new Taxi Licensing Policy for the city. Feedback was gathered over the course of 12 weeks, from taxi users and members of the trade, North Yorkshire Police, disabled residents and York Hospital.

    As a result, the new policy requires vehicles to meet the higher Euro 6 emission standards to help improve air quality across the city. To add confidence among passengers, especially more vulnerable people, the policy supports the supply of more wheelchair-accessible taxis and aims to increase awareness of and extend safeguarding standards among drivers and operators.

    To make them easier for passengers to identify, Hackney carriage taxis – which can be flagged down on the street – must be black, while private hire cars – which can only be pre-booked and not stopped in the street – can be any colour other than black. This change will be phased in over a number of years.

    Cllr Kate Ravilious, Executive Member for Transport at City of York Council, said:

    For many residents, taxis are a key form of transport and source of employment. It’s essential that they are properly and fairly regulated to ensure their safety and supply. Operators and drivers in York must be well-informed and highly qualified to deliver a great and safe service to their many, and often disabled or vulnerable, passengers.

    “The new standards we’re setting put us in line with national best practice guidance and raise the safety and cleanliness of the city’s taxis even higher, plus put greater emphasis on driving standards and road safety, to help protect all road users. I look forward to seeing the full and detailed report next month.”

    A report was presented to the Council’s Licensing and Regulatory Committee on 8 October, and you can read it here. A full and detailed report on these changes will be discussed at full Council on 21 November

    MIL OSI United Kingdom

  • MIL-OSI: RTI Joins the Common Vulnerabilities and Exposures (CVE®) Program as a CVE Numbering Authority (CNA)

    Source: GlobeNewswire (MIL-OSI)

    SUNNYVALE, Calif., Oct. 22, 2024 (GLOBE NEWSWIRE) — Real-Time Innovations (RTI), the infrastructure software company for smart-world systems, has become the first DDS vendor to be named as a CNA by the CVE® Program. This designation showcases RTI’s commitment to system integrity by identifying vulnerabilities early, offering enhanced protection for customers. RTI will continue to adopt best cybersecurity practices which includes a secure coding standard, static and dynamic analysis tools, and extended endurance testing to improve systems across industries such as defense, medical, and automotive.

    RTI Connext®, based on the Data Distribution Service (DDS™) standard, is the trusted industry solution that delivers reliability, security, and real-time performance essential for highly distributed autonomous systems. As a CNA, RTI has established a vulnerability management and notification process to monitor and notify customers of any known vulnerabilities that may affect systems using RTI software. The goal is to ensure that Connext users receive the information needed to properly assess their impact, through well established mechanisms, and that solutions are provided in a timely manner.

    “By enhancing our visibility and control over the CVE publication process, we reaffirm our commitment to delivering top-notch cybersecurity for our customers,” said David Barnett, VP of Products and Markets at RTI. “This initiative will streamline our disclosure process, making it easier for users to access crucial information about vulnerabilities through a trusted, recognized platform. Our priority is ensuring the security of our customers’ systems, and we are committed to providing the best solutions to protect them against evolving threats.”

    CVE is an international initiative that relies on the community to identify and catalog publicly disclosed cybersecurity vulnerabilities. Once discovered, vulnerabilities are assigned and published in the CVE List. CNAs are organizations responsible for the regular assignment of CVE IDs to vulnerabilities, and for creating and publishing information about the risk in the associated CVE Record.

    Securing autonomous and intelligent systems requires constant and careful architecting of the entire framework. RTI enables customers to design robust, reliable systems that safeguard without sacrificing real-time performance. Whether it is a large application running on powerful hardware or an embedded application running on a resource-constrained device, RTI has the industry-leading security solutions for intelligent distributed systems.

    For more information about RTI’s approach to vulnerability detection and management, please visit the policy page. To learn more about RTI’s security offerings, please visit our website.

    About RTI
    Real-Time Innovations (RTI) is the infrastructure software company for smart-world systems. RTI Connext® is the world’s leading software framework for intelligent distributed systems. Uniquely, Connext users can build systems that combine advanced sensing, fast control, and AI algorithms.

    With 2,000 customer designs, RTI excels at getting customers to production. RTI software runs over 250 autonomous vehicle programs, supports dozens of automotive ADAS and software-defined architectures, controls the largest power plants in North America, integrates over 400 major defense programs, drives a new generation of MedTech systems and robotics, and underlies Canada’s air traffic control and NASA’s launch control systems.

    RTI runs a smarter world.

    RTI is the market leader in products compliant with the Data Distribution Service (DDS™) standard. RTI is privately held and headquartered in Silicon Valley with regional offices in Colorado, Spain, and Singapore.

    Download a free trial of the latest, fully-functional Connext software today: http://www.rti.com/downloads

    The MIL Network

  • MIL-OSI: Abacus Life Provides Preliminary Third Quarter 2024 Results

    Source: GlobeNewswire (MIL-OSI)

    – Expects Total Revenue Between $26.0 and $28.0 Million; Grows 23-33% Year-over-Year –

    – Expects GAAP Net Income / (Loss) Between ($6.0) and ($6.75) Million Due to Non-Cash Increase in Warrant Liability of Between $8.0 and $9.0 Million –

    – Expects Adjusted EBITDA Between $14.0 and $16.0 Million; Grows 30-48% Year-over-Year –

    – Third Quarter 2024 Earnings Release and Conference Call to be Held Thursday, November 7, 2024 –

    ORLANDO, Fla., Oct. 22, 2024 (GLOBE NEWSWIRE) — Abacus Life, Inc. (“Abacus” or the “Company”) (NASDAQ: ABL), a leading global alternative asset manager focused on lifespan-based financial products, today announced preliminary unaudited financial results for the third quarter ended September 30, 2024.

    Preliminary Financial Results – Third Quarter 2024

    Based upon management’s current expectations, the Company anticipates Total Revenue, Net Income, and Adjusted EBITDA, for the third quarter as follows:

      3Q24
    Total Revenue Between $26.0 and $28.0 million
    GAAP Net Income / (Loss) Between ($6.0) and ($6.75) million
    Adjusted EBITDA Between $14.0 and $16.0 million

    “We are pleased to report another strong performance across our business, continuing to underscore the clear differentiation of our business model,” said Jay Jackson, Chief Executive Officer of Abacus. “During the quarter, we announced key acquisitions of Carlisle Management Company SCA and FCF Advisors. We are excited to welcome them to the Abacus family. In addition, we further strengthened our management team, welcoming Corey McLaren as Managing Director of Capital Markets and Robert F. Phillips as our new Senior Vice President of Investor Relations and Corporate Affairs. We also partnered with Lorisco to launch PREADISAN™, a revolutionary health prediction and actuarial technology tool, which is enabling us to offer unprecedented personalization in longevity forecasting, as well as highly tailored financial solutions for our clients. We remain committed to executing on our long-term growth initiatives and delivering value to our shareholders.”

    Earnings Release and Conference Call

    As previously noted, Abacus Life, Inc. will release its third quarter 2024 financial results after the market closes on Thursday, November 7, 2024. Management will hold a conference call to discuss the financial results at 5:00 pm Eastern Time on November 7, 2024. A live webcast of the conference call will be available on Abacus’ investor relations website at ir.abacuslife.com. The dial-in number for the conference call is (800) 267-6316 (toll-free) or (203) 518-9783 (international). Please dial the number 10 minutes prior to the scheduled start time.

    Preliminary Information

    The unaudited financial and operational information presented in this press release is preliminary and may change. Abacus’ financial closing procedures with respect to the estimated financial information provided in this press release are not yet complete, and as a result, the Company’s final results may vary materially from the preliminary results included in this press release. Abacus undertakes no obligation to update or supplement the information provided in this press release until the Company releases its financial statements for the three months ended September 30, 2024. The preliminary financial information included in this press release reflects the Company’s current estimates based on information available as of the date of this press release and has been prepared by Company management. This preliminary financial and operational information should not be viewed as a substitute for full financial statements prepared in accordance with GAAP and is not necessarily indicative of the results to be achieved for any future periods. This preliminary financial information could be impacted by the effects of financial closing procedures, final adjustments, and other developments.

    Non-GAAP Financial Information

    Adjusted EBITDA, a non-GAAP measure, is defined as net income (loss) attributable to Abacus adjusted for depreciation expense, amortization, interest expense, income tax and other non-cash and certain non-recurring items that in our judgement significantly impact the period-over-period assessment of performance and operating results that do not directly relate to business performance within Abacus’ control. A reconciliation of Adjusted EBITDA to Net income attributable to Abacus Life, the most directly comparable GAAP measure, appears below.

    Forward-Looking Statements

    All statements in this press release (and oral statements made regarding the subjects of this press release) other than historical facts are forward-looking statements within the meaning of Section 21E of the Securities Exchange Act of 1934, as amended. These forward-looking statements rely on a number of assumptions concerning future events and are subject to a number of uncertainties and factors that could cause actual results to differ materially from such statements, many of which are outside the control of Abacus. Forward-looking information includes but is not limited to statements regarding: Abacus’s financial and operational outlook; Abacus’s operational and financial strategies, including planned growth initiatives and the benefits thereof, Abacus’s ability to successfully effect those strategies, and the expected results therefrom. These forward-looking statements generally are identified by the words “believe,” “project,” “estimate,” “expect,” ‎‎”intend,” “anticipate,” “goals,” “prospects,” “will,” “would,” “will continue,” “will likely result,” and similar expressions (including the negative versions of such words or expressions).

    While Abacus believes that the assumptions concerning future events are reasonable, it cautions that there are inherent difficulties in predicting certain important factors that could impact the future performance or results of its business. The factors that could cause results to differ materially from those indicated by such forward-looking statements include, but are not limited to: the ‎fact that Abacus’s loss reserves are bases on estimates and may be inadequate to cover ‎its actual losses; the failure to properly price Abacus’s insurance policies; the ‎geographic concentration of Abacus’s business; the cyclical nature of Abacus’s industry; the ‎impact of regulation on Abacus’s business; the effects of competition on Abacus’s business; the failure of ‎Abacus’s relationships with independent agencies; the failure to meet Abacus’s investment ‎objectives; the inability to raise capital on favorable terms or at all; the ‎effects of acts of terrorism; and the effectiveness of Abacus’s control environment, including the identification of control deficiencies.

    These forward-looking statements are also affected by the risk factors, forward-looking statements and challenges and uncertainties set forth in documents filed by Abacus with ‎the U.S. Securities and Exchange Commission from time to time, including the Annual ‎Report on Form 10-K and Quarterly Reports on Form 10-Q and subsequent ‎periodic reports. These filings identify and address other important risks and uncertainties that could cause actual events and results to differ materially from those contained in the forward-looking statements. Abacus cautions you not to place undue reliance on the ‎forward-looking statements contained in this press release. Forward-looking statements speak only as of the date they are made. Readers are cautioned not to put undue reliance on forward-looking statements, and Abacus assumes no obligation and, except as required by law, does not intend to update or revise these forward-looking statements, whether as a result of new information, future events, or otherwise. Abacus does not give any assurance that it will achieve its expectations.

    About Abacus

    Abacus is a leading global alternative asset manager and market maker, specializing in use of advanced longevity and actuarial technology to purchase life insurance policies from consumers seeking liquidity while creating a high-returning asset class of insurance products, uncorrelated to market fluctuations, for institutional investors.

    With nearly $3 billion in assets under management, including pending acquisitions, Abacus is the only publicly traded global alternative asset manager focused on lifespan-based financial products traded on the Nasdaq exchange.

    Abacus has invested in two new verticals: ABL Wealth, which provides longevity-based wealth management services and investment offerings, and ABL Tech, which offers ground-breaking technology services for pension funds, governments, insurance companies, retirement associations and more that provides advanced real-time data tracking and analysis. With each new channel, we are revolutionizing the future of life insurance.

    http://www.Abacuslife.com

    Contacts:

    Investor Relations

    Robert Phillips – SVP Investor Relations
    rob@abacuslife.com
    (321) 290-1198

    David Jackson – IR/Capital Markets Associate
    djackson@abacuslife.com
    (321) 299-0716

    Abacus Life Public Relations
    press@abacuslife.com

    ABACUS LIFE, INC. Adjusted EBITDA

           
      Three Months Ended   Three Months Ended
      September 30, 2024   September 30, 2023
               
      Low   High   Actual
    GAAP Net income / (Loss) attributable to Abacus Life, Inc. $ (6,750,000 )   $ (6,000,000 )   $ 1,050,972  
               
    GAAP Net income / (Loss)   (6,750,000 )     (6,000,000 )     1,050,972  
    Depreciation and amortization expense   1,675,000       1,750,000       1,694,853  
    Income tax (benefit)   (550,000 )     (400,000 )     1,710,315  
    Stock-compensation   6,300,000       6,500,000       4,583,632  
    Due Diligence related to acquisitions   1,725,000       2,000,000        
    Other (expense)         25,000       (20,087 )
    Interest expense   3,900,000       4,125,000       2,679,237  
    Interest income   (600,000 )     (650,000 )     (63,826 )
    (Gain) Loss on change in fair value of debt         150,000       (2,088,797 )
    Change in fair value of warrant liability   8,750,000       8,900,000       943,400  
    Realized & Unrealized (gain) on investments   (450,000 )     (400,000 )     306,800  
    Adjusted EBITDA $ 14,000,000     $ 16,000,000     $ 10,796,499  
               

    The MIL Network

  • MIL-OSI: Auburn National Bancorporation, Inc. Reports Third Quarter Net Earnings

    Source: GlobeNewswire (MIL-OSI)

    Third Quarter 2024 Highlights:

    • Return on Assets (annualized) improved to 0.71%, compared to 0.58% in 3Q 2023
    • Net interest margin (tax-equivalent) of 3.05%, compared to 2.73% in 3Q 2023
    • Net interest income (tax-equivalent) was $6.8 million, an increase of 7% compared to 3Q 2023
    • Average loans were $571.7 million, an increase of 8% compared to 3Q 2023
    • Loan to deposit ratio increased to 62.7% at period end from 56.6% at September 30, 2023
    • Tangible common equity (“TCE”) to total assets improved to 8.52%, compared to 5.96% at September 30, 2023

    AUBURN, Ala., Oct. 22, 2024 (GLOBE NEWSWIRE) — Auburn National Bancorporation, Inc. (Nasdaq: AUBN) reported net earnings of $1.7 million, or $0.50 per share, for the third quarter of 2024, compared to $1.7 million, or $0.50 per share, for the second quarter of 2024, and $1.5 million, or $0.43 per share, for the third quarter of 2023. Net earnings were $4.8 million, or $1.38 per share, for the first nine months of 2024, compared to $5.4 million, or $1.54 per share, for the first nine months of 2023.

    “Our third quarter and year to date results benefited from the balance sheet repositioning we completed in the fourth quarter of 2023. This, combined with loan growth during 2024, have improved the Company’s net interest income and margin in the third quarter when compared to the same quarter last year,” said David A. Hedges, President and CEO. “Along with improvements in our balance sheet, we continue to look for opportunities to grow and increase our efficiency. After careful consideration of our customers and the close proximity to our other locations in Auburn, we are closing our Corner Village branch by year end, which should provide additional cost savings beginning in 2025,” continued Mr. Hedges.

    Net interest income (tax-equivalent) was $6.8 million in the third quarter of 2024, compared to $6.7 million in the second quarter of 2024, and $6.4 million in the third quarter of 2023.

    Net interest margin (tax-equivalent) was 3.05% in the third quarter of 2024, compared to 3.06% in the second quarter of 2024, and 2.73% in the third quarter of 2023. The increase compared to the third quarter of 2023 was primarily due to loan growth, a more favorable asset mix, and improvements in our yield on interest-earning assets, which outpaced increases in the cost of our interest-bearing deposits. Average loans for the third quarter of 2024 were $571.7 million, an increase of 8% from the third quarter of 2023.

    Mr. Hedges continued, “Although we experienced solid loan growth compared to the same time last year, we had approximately $14.9 million in loan payoffs during the latest quarter related to one borrowing relationship. The proceeds from the loan payoffs allowed us to repay $15.0 million of high-cost non-core funding.”

    Nonperforming assets were $0.8 million, or 0.08% of total assets, at September 30, 2024 and June 30, 2024, respectively, compared to $1.2 million, or 0.12% of total assets, at September 30, 2023.

    The Company recorded a negative provision for credit losses of $0.1 million in both the third and second quarters of 2024, compared to a provision for credit losses of $0.1 million in the third quarter of 2023. In the most recent quarter, the payoff of one loan relationship contributed to the negative provision.

    At September 30, 2024, the Company’s allowance for credit losses was $6.9 million, or 1.22% of total loans, compared to $7.1 million, or 1.24% of total loans, at June 30, 2024, and $6.8 million, or 1.24% of total loans, at September 30, 2023.

    Noninterest income was $0.8 million for the third quarter of 2024, compared to $0.9 million for the second quarter of 2024, and $0.9 million in the third quarter of 2023.

    Noninterest expense was $5.5 million for each of the third and second quarters of 2024, and $5.4 million the third quarter of 2023. The increase from the third quarter of 2023 was primarily related to an increase in salaries and benefits, partially offset by decreases in net occupancy and equipment expense and other noninterest expense.

    Total assets were $990.1 million at September 30, 2024, compared to $1.0 billion at June 30, 2024 and September 30, 2023, respectively. Loans, net of unearned income were $565.7 million at September 30, 2024, compared to $578.1 million at June 30, 2024 and $545.6 million at September 30, 2023. The decrease in loans, compared to June 30, 2024, was primarily related to the payoff of the $14.9 million relationship in the latest quarter. The increase in loans since September 30, 2023 primarily reflects growth in the commercial real estate and construction and land development loan categories. Total deposits were $901.7 million at September 30, 2024, compared to $946.4 million at June 30, 2024, and $964.6 million at September 30, 2023. The decrease in deposits compared to June 30, 2024 was primarily related to an increase in reciprocal customer deposits sold through Intrafi’s one-way sell program and the repayment of $15.0 million in time deposits held by the State of Alabama. At September 30, 2024 the Company sold $37.8 million of reciprocal deposits, compared to none at June 30, 2024 and September 30, 2023.

    At September 30, 2024, the Company’s consolidated stockholders’ equity (book value) was $84.3 million or $24.14 per share, compared to $75.2 million, or $21.53 per share, at June 30, 2024, and $61.5 million, or $17.59 per share, at September 30, 2023. The increase from June 30, 2024 was primarily driven by other comprehensive income of $8.3 million due to lower market interest rates that led to a decrease in unrealized losses on securities available-for-sale, net of tax, plus net earnings of $1.7 million. These increases in stockholders’ equity were partially offset by cash dividends paid of $0.9 million. Unrealized losses do not affect the Bank’s capital for regulatory capital purposes.

    The Company’s tangible common equity (“TCE”) ratio or total equity to total assets ratio was 8.52% at September 30, 2024, compared to 7.34% at June 30, 2024, and 5.96% at September 30, 2023. The TCE ratio increased compared to June 30, 2024 primarily due to increases in the fair value of the Company’s available-for-sale securities and a smaller balance sheet. All of the Company’s marketable securities are classified as available-for-sale. Therefore, any changes in the fair value of the Company’s securities portfolio are reflected in total equity, net of tax, under generally accepted accounting principles.

    The Company paid cash dividends of $0.27 per share in the third quarter of 2024. At September 30, 2024, the Bank’s regulatory capital ratios were well above the minimum amounts required to be “well capitalized” under current regulatory standards.

    About Auburn National Bancorporation, Inc.

    Auburn National Bancorporation, Inc. (the “Company”) is the parent company of AuburnBank (the “Bank”), with total assets of approximately $990.1 million. The Bank is an Alabama state-chartered bank that is a member of the Federal Reserve System, which has operated continuously since 1907. Both the Company and the Bank are headquartered in Auburn, Alabama. The Bank conducts its business in East Alabama, including Lee County and surrounding areas. The Bank currently operates eight full-service branches in Auburn, Opelika, Valley, and Notasulga, Alabama. The Bank also operates a loan production office in Phenix City, Alabama. Additional information about the Company and the Bank may be found by visiting http://www.auburnbank.com.

    Cautionary Notice Regarding Forward-Looking Statements

    This press release contains “forward-looking statements” within the meaning of the Securities Act of 1933 and the Securities Exchange Act of 1934, including, without limitation, statements about future financial and operating results, costs and revenues, the continuing effects of the COVID-19 pandemic and related government, Federal Reserve monetary and regulatory actions, including the remaining effects of pandemic-related economic stimulus and economic conditions generally and in our markets, loan demand, mortgage lending activity, changes in the mix of our earning assets (including those generating tax exempt income or tax credits) and our mix and cost of deposits and wholesale liabilities, net interest income and margin, yields on earning assets, the market values and performance of securities held, effects of inflation, including Federal Reserve monetary policies which were tightened in response to inflation beginning in 2022 through increases in the target federal funds rate and reductions in the Federal Reserve’s Treasury and mortgage-backed securities holdings, and more recent changes to increase reinvestment of maturing Treasury securities beginning in June 2024 and a mid-September 2024 reduction in the target federal funds rate by 50 basis points to 4.75-5.00%, interest rates (generally and those applicable to our assets and liabilities) and changes in our asset values, especially investment securities, as a result of monetary policies and interest rate changes, noninterest income, loan performance, loan deferrals and modifications, nonperforming assets, other real estate owned, provision for credit losses, including the continuing effects of the application of the new CECL accounting standard adopted on January 1, 2023 and our CECL models, including possible adjustments to the fair values of securities available for sale in lieu of other-than-temporary impairments, charge-offs, collateral values, credit quality, asset sales, insurance claims, and market trends, as well as statements with respect to our objectives, expectations and intentions and other statements that are not historical facts. Actual results may differ from those set forth in the forward-looking statements.

    Forward-looking statements, with respect to our beliefs, plans, objectives, goals, expectations, anticipations, estimates and intentions, involve known and unknown risks, uncertainties and other factors, which may be beyond our control, and which may cause the actual results, performance, achievements, or financial condition of the Company or the Bank to be materially different from future results, performance, achievements, or financial condition expressed or implied by such forward-looking statements. You should not expect us to update any forward-looking statements.

    All written or oral forward-looking statements attributable to us are expressly qualified in their entirety by this cautionary notice, together with those risks and uncertainties described in our annual report on Form 10-K for the year ended December 31, 2023 and otherwise in our other SEC reports and filings.

    Explanation of Certain Unaudited Non-GAAP Financial Measures

    This press release contains financial information determined by methods other than U.S. generally accepted accounting principles (“GAAP”). The attached financial highlights include certain designated net interest income amounts presented on a tax-equivalent basis, a non-GAAP financial measure, and the presentation and calculation of the efficiency ratio, a non-GAAP measure. Management uses these non-GAAP financial measures in its analysis of the Company’s performance and believes the presentation of net interest income on a tax-equivalent basis provides comparability of net interest income from both taxable and tax-exempt sources and facilitates comparability within the industry. Similarly, the efficiency ratio is a common measure that facilitates comparability with other financial institutions. Although the Company believes these non-GAAP financial measures enhance investors’ understanding of its business and performance, these non-GAAP financial measures should not be considered an alternative to GAAP. Along with the attached financial highlights, the Company provides reconciliations between the GAAP financial measures and these non-GAAP financial measures.

    For additional information, contact:
    David A. Hedges
    President and CEO
    (334) 821-9200

    Financial Highlights (unaudited)

                      
         Quarters Ended   Nine months ended
    (Dollars in thousands, except per share amounts)   September 30, 2024   June 30, 2024   September 30, 2023   September 30, 2024   September 30, 2023
    Results of Operations                                  
    Net interest income (a) $ 6,811     $ 6,728     $ 6,380     $ 20,216     $ 20,591  
    Less: tax-equivalent adjustment   21       19       108       60       322  
      Net interest income (GAAP)   6,790       6,709       6,272       20,156       20,269  
    Noninterest income   846       896       865       2,629       2,448  
      Total revenue   7,636       7,605       7,137       22,785       22,717  
    Provision for credit losses   (127 )     (123     105       84       (191 )
    Noninterest expense   5,500       5,519       5,362       16,694       16,791  
    Income tax expense   531       475       182       1,170       737  
    Net earnings $ 1,732     $ 1,734     $ 1,488     $ 4,837     $ 5,380  
                                             
    Per share data:                                  
    Basic and diluted net earnings: $ 0.50     $ 0.50     $ 0.43     $ 1.38     $ 1.54  
    Cash dividends declared $ 0.27     $ 0.27     $ 0.27     $ 0.81     $ 0.81  
    Weighted average shares outstanding:                                  
      Basic and diluted   3,493,699       3,493,699       3,496,411       3,493,687       3,499,518  
    Shares outstanding, at period end   3,493,699       3,493,699       3,493,614       3,493,699       3,493,614  
    Book value $ 24.14     $ 21.53     $ 17.59     $ 24.14     $ 17.59  
    Common stock price:                                  
      High $ 24.35     $ 19.25     $ 22.80     $ 24.35     $ 24.50  
      Low   17.50       16.63       20.85       16.63       18.80  
      Period-end:   22.90       18.29       21.50       22.90       21.50  
        To earnings ratio (c)   91.60  x     101.61 x     7.65 x     91.60 x     7.65  
        To book value   95  %     85 %     122 %     95 %     122  
    Performance ratios:                                  
    Return on average equity (annualized)   9.10  %     9.63 %     8.59 %     8.59 %     10.15  
    Return on average assets (annualized)   0.71  %     0.71 %     0.58 %     0.66 %     0.70  
    Dividend payout ratio   54.00  %     54.00 %     62.79 %     58.70 %     52.60  
    Other financial data:                                  
    Net interest margin (a)   3.05  %     3.06 %     2.73 %     3.05 %     2.97  
    Effective income tax rate   23.46  %     21.50 %     10.90 %     19.48 %     12.05  
    Efficiency ratio (b)   71.83  %     72.39 %     74.01 %     73.08 %     72.88  
    Asset Quality:                                  
    Nonperforming assets:                                  
      Nonperforming (nonaccrual) loans $ 775     $ 794     $ 1,213     $ 775     $ 1,213  
        Total nonperforming assets $ 775     $ 794     $ 1,213     $ 775     $ 1,213  
                                             
    Net charge-offs (recoveries) $ 60     $ 9     $ 14     $ 2     $ (127 )
                                             
    Allowance for credit losses as a % of:                                  
      Loans   1.22  %     1.24 %     1.24 %     1.22 %     1.24  
      Nonperforming loans   887  %     899 %     559 %     887 %     559  
    Nonperforming assets as a % of:                                  
      Loans and other real estate owned   0.14  %     0.14 %     0.22 %     0.14 %     0.22  
      Total assets   0.08  %     0.08 %     0.12 %     0.08 %     0.12  
    Nonperforming loans                                  
      as a % of total loans   0.14  %     0.14 %     0.22 %     0.14 %     0.22  
    Annualized net charge-offs (recoveries)                                  
       as a % of average loans   0.04  %     0.01 %     0.01 %     —  %     (0.03 )
    Selected average balances:                                  
    Securities $ 251,723     $ 258,228     $ 390,772     $ 259,158     $ 398,751  
    Loans, net of unearned income   571,651       573,443       529,382       568,628       514,635  
    Total assets   982,656       978,107       1,020,980       979,243       1,022,257  
    Total deposits   904,860       900,673       942,533       900,876       944,471  
    Total stockholders’ equity $ 76,113     $ 72,059     $ 69,269     $ 75,044     $ 70,659  
    Selected period end balances:                                  
    Securities $ 258,285     $ 254,359     $ 373,286     $ 258,285     $ 373,286  
    Loans, net of unearned income   565,699       578,068       545,610       565,699       545,610  
    Allowance for credit losses   6,876       7,142       6,778       6,876       6,778  
    Total assets   990,143       1,025,054       1,030,724       990,143       1,030,724  
    Total deposits   901,724       946,405       964,602       901,724       964,602  
    Total stockholders’ equity $ 84,336     $ 75,209     $ 61,451     $ 84,336     $ 61,451  
                                             
    (a) Tax equivalent. See “Explanation of Certain Unaudited Non-GAAP Financial Measures” and “Reconciliation of GAAP
      to non-GAAP Measures (unaudited).”
    (b) Efficiency ratio is the result of noninterest expense divided by the sum of noninterest income and tax-equivalent
      net interest income. See “Reconciliation of GAAP to non-GAAP Measures (unaudited)” below.
    (c) Calculated by dividing period end share price by earnings per share for the previous four quarters.


    Reconciliation of GAAP to non-GAAP Measures (unaudited):

                 
        Quarters Ended   Nine months ended
    (Dollars in thousands, except per share amounts)   September 30, 2024   June 30, 2024   September 30, 2023     September 30, 2024   September 30, 2023  
    Net interest income, as reported (GAAP) $ 6,790   $ 6,709   $ 6,272   $ 20,156   $ 20,269  
    Tax-equivalent adjustment   21     19     108     60     322  
    Net interest income (tax-equivalent) $ 6,811   $ 6,728   $ 6,380   $ 20,216   $ 20,591  

    The MIL Network

  • MIL-OSI Global: Colonialism’s legacy has left Caribbean nations much more vulnerable to hurricanes

    Source: The Conversation – USA – By Farah Nibbs, Assistant Professor of Emergency and Disaster Health Systems, University of Maryland, Baltimore County

    Hillside streets can quickly become muddy rivers during hurricane rains in the islands. Estailove St-Val/AFP via Getty Images

    Long before colonialism brought slavery to the Caribbean, the native islanders saw hurricanes and storms as part of the normal cycle of life.

    The Taino of the Greater Antilles and the Kalinago, or Caribs, of the Lesser Antilles developed systems that enabled them to live with storms and limit their exposure to damage.

    On the larger islands, such as Jamaica and Cuba, the Taino practiced crop selection with storms in mind, preferring to plant root crops such as cassava or yucca with high resistance to damage from hurricane and storm winds, as Stuart Schwartz describes in his 2016 book “Sea of Storms.”

    The Kalinago avoided building their settlements along the coast to limit storm surges and wind damage. The Calusa of southwest Florida used trees as windbreaks against storm winds.

    In fact, it was the Kalinago and Taino who first taught the Europeans – primarily the British, Dutch, French and Spanish – about hurricanes and storms. Even the word ‘hurricane’ comes from Huracán, a Taino and Mayan word denoting the god of wind.

    But then colonialism changed everything.

    A French advertising card from around 1900 depicts colonial power in Guadeloupe, with a trader sitting comfortably among sacks of cotton, cocoa and coffee while islanders work in the field.
    Universal History Archive/Universal Images Group via Getty Images

    I study natural disasters in the Caribbean, including how history molded responses to disasters today.

    The current disaster crisis that the Caribbean’s small islands are experiencing as hurricanes intensify did not start a few decades ago. Rather, the islands’ vulnerability is a direct result of the exploitative systems forced upon the region by colonialism, its legacies of slave-based land policies and ill-suited construction and development practices, and its environmental injustices.

    Forcing people into harm’s way

    The colonial powers changed how Caribbean people interacted with the land, where they lived and how they recovered from natural hazard events.

    Rather than growing crops that could sustain the local food supply, the Europeans who began arriving in the 1600s focused on exploitative extractive economic models and export cash crops through the plantation economy.

    They forced Indigenous people off their lands and built settlements along the coast, which made it easier to import enslaved peoples and goods and to export cash crops such as sugar and tobacco to Europe – and also left communities vulnerable to storms. They also developed settlements in low-lying areas, often near rivers and streams, which could provide transportation for agricultural produce but which became flood risks during heavy rains.

    Homes built to the water’s edge in Saint-Martin, an overseas collectivity of France, were devastated when Hurricane Irma hit in 2017.
    Helene Valenzuela/AFP via Getty Images

    Today, more than 70% of the Caribbean’s population lives along the coast, often less than a mile from the shore. These coastlines are not only highly exposed to hurricanes but also to sea-level rise fueled by climate change.

    Legacies of slave-based land policies

    Colonialism’s legacy of land policies has also made recovery from disasters much harder today.

    When colonial powers took over, a few landowners were given control of most of the land, while the majority of the population was forced onto marginal and small areas. The local population had no legal right to the land, as the people did not possess land certificate titles or deeds and were often forced to pay rent to landlords.

    After independence, most island governments tried to acquire land from former plantations or estates and to redistribute it to the working class. But these efforts, mainly in the 1960s and ’70s, largely failed to transform land ownership, improve economic development or reduce vulnerability.

    One colonial legacy perpetuating vulnerability to this day is known as crown land, or state land. In the English-speaking Caribbean, all land for which there was no land grant was considered property of the British crown. Crown land can be found in every English-speaking island to this day.

    How colonial powers controlled the Caribbean over time.

    For example, in Barbuda, all land is vested in the “crown in perpetuity” on behalf of Barbudans. This means that an individual born on the island of Barbuda cannot individually own land.

    Instead, land is communally owned, which limits access to the credit and development opportunities that were sorely needed to reconstruct the island after Hurricane Maria in 2017. Most Barbudans were unable to insure their homes because they had no title deeds to their property.

    This and other collective land tenure systems created by colonialism places Caribbean residents at greater risk from a variety of natural hazards and limits their ability to seek financial credit for disaster recovery today.

    The roots of poor construction

    Vulnerability to disasters in the Caribbean also has roots in post-slavery housing construction and subsequent failures to institute proper building codes.

    After emancipation from slavery, freed people had no right nor access to land. To build houses, they were forced to lease land from the former enslavers who at a whim could terminate their employment or kick them off the land.

    This led to the development of a particular type of housing structure known as chattel houses in countries such as Barbados. These houses are tiny and were constructed in a way in which they could be easily taken apart and loaded onto carts, should the residents be forced out by their former enslavers. Many Bajans still live in these houses today, although quite a few have been converted to restaurants or shops.

    Chattel houses are still used as homes in Barbados.
    Shardalow via Wikimedia, CC BY

    In Aruba, Bonaire and Curaçao, owned by the Dutch, slave huts were built along the coast, on land not suitable for agriculture and easily damaged by storms. These former slave huts are now tourist attractions, but the colonial patterns of settling along the coast has left many coastal communities exposed to hurricane damage and rising seas.

    The vulnerability of such houses is not only a result of their exposure to natural hazards but also the underlying social structures.

    Slave huts were built on the coast in Bonaire, where they were vulnerable to storm surge.
    Leslie Ket via Wikimedia, CC BY-SA

    In many islands today, poorer residents can’t afford protective measures, such as installing storm shutters or purchasing solar-powered generators.

    They often live in marginal and disaster-prone areas, such as steep hillsides, where housing tends to be cheaper. Houses in these areas are also often poorly constructed with low-grade materials, such as galvanized sheeting for roofs and walls.

    This situation is made worse by the informal and unregulated nature of residential housing construction in the region and the poor enforcement of building codes.

    Due to the legacy of colonialism, most housing or building standards or codes in the Commonwealth Caribbean are relics from the United Kingdom and in the French Antilles from France. Building standards across the region lack uniformity and are generally subjective and uncontrolled. Financial limitations and staffing constraints mean that codes and standards more often than not remain unenforced.

    Progress, but still a lot of work to do

    The Caribbean has made progress in developing wind-related building codes to try to increase resilience in recent years. And while damage from torrential rain is still not properly addressed in most Caribbean building standards, scientific guidance is available through the Caribbean Institute for Meteorology and Hydrology in Barbados.

    Individual islands, including Dominica and Saint Lucia, have new minimum building standards for recovery after disasters. The island of Grenada is hoping to guide new construction as it recovers from Hurricane Beryl. Trinidad and Tobago has developed a national land use strategy but has struggled to use it.

    Construction standards can help the islands build resilience. But work remains to be done to overcome the legacy of colonial-era land policies and development that have left island towns vulnerable to increasing storm risks.

    Farah Nibbs does not work for, consult, own shares in or receive funding from any company or organization that would benefit from this article, and has disclosed no relevant affiliations beyond their academic appointment.

    ref. Colonialism’s legacy has left Caribbean nations much more vulnerable to hurricanes – https://theconversation.com/colonialisms-legacy-has-left-caribbean-nations-much-more-vulnerable-to-hurricanes-231913

    MIL OSI – Global Reports

  • MIL-OSI Europe: Breaking the vicious circle between banks and sovereigns for good | Joint guest contribution by Joachim Nagel and Nicolas Véron, op-ed for Politicoby Politico

    Source: Deutsche Bundesbank in English

    Twelve years after its initiation, it is time to complete the banking union
    In the early hours of 29 June 2012, boldness and clarity came together. After a long night of negotiations, European leaders laid the foundations for the banking union project. They found strong and clear words on its purpose, stating it is imperative to break the vicious circle between banks and sovereigns.
    The decision was taken in the aftermath of a twin crisis that had shaken the euro area – a sovereign debt crisis coupled with a banking crisis. The close links between sovereigns and banks had created a “doom loop”: sovereigns bailed out teetering banks, straining public finances, and rising sovereign yields put pressure on banks’ home-biased sovereign exposures. Such loops emerged as a particular vulnerability of the euro area, with its unique institutional setup as a monetary union of otherwise sovereign states, increasing the pressure on the Eurosystem to save the day. The banking union was conceived as the sword that would sever the doom loop.
    Today’s banking union is primarily the result of intensive legislative efforts between 2012 and 2014. They established a complete framework for supervising European banks, and an incomplete one for dealing with banking crises. This helped to mitigate the vicious circle, in particular by creating the Single Supervisory Mechanism under the European Central Bank and the national supervisory authorities. That has proven its effectiveness, but the vicious circle has not yet been broken.
    Before the lessons of 2012 are forgotten, the new EU term offers an opportunity to finish the task and break the vicious circle between banks and sovereigns for good. Action must go both ways. First, block the direct contagion channel from banks to sovereigns. Taxpayers should not have to suffer when banks run into problems. Second, close the contagion channel from sovereigns to banks. A sovereign credit event cannot and should not be ruled out in a monetary union with sovereign fiscal policies at the national level. At the same time, it must not be permitted to drag down banks with it and thus further jeopardise financial stability.
    The first aim calls for strengthening the crisis intervention framework. Valuable progress has been made with the establishment of the Single Resolution Board and the Single Resolution Fund. The latter reached its target level, currently at €78 billion, after a decade of build-up. However, a more streamlined and predictable framework is needed. Specifically, resolution should be a credible and feasible option to manage more, if not all, failing banks under EU law, instead of the current confusing mix of European and national procedures that leaves too much scope for national state aid and moral hazard.
    The reform of the framework for crisis management is closely linked to deposit insurance. A common European deposit insurance mechanism would strengthen confidence in depositor protection and thus reduce the risk of bank runs. It is intended to weaken the link between banks and their national sovereigns and thus to contribute to making the euro area as a whole more resilient. The two of us have different views on how it should be structured, whether fully centralised or a hybrid involving national authorities. However, we share the firm conviction that deposit protection needs a European level. All banks in the euro area should participate in it. Its funding can and should be risk-based, taking into account arrangements such as the institutional protection schemes that play a significant role in Austria and Germany.
    Under that mechanism, certain risks would be shouldered jointly within the EU. Conversely, risks that are within the remit of the individual Member States must be appropriately limited. To reduce negative spillovers from sovereigns to banks – the second aim – it is crucial to avoid large and undiversified exposures of bank balance sheets to a single sovereign. Concentration limits and capital charges can serve as effective tools here. With adequate calibration and a transition phase, these tools could incentivise banks to diversify their sovereign exposures, thereby gradually overcoming home bias.
    As it turns out, the issues of crisis management, deposit insurance and banks’ sovereign exposures are intertwined. Attempts to make progress have so far failed, not least because they were not comprehensive enough. Part of why the European Commission’s 2015 legislative proposal on deposit insurance was shelved is because banks’ concentrated sovereign exposures were not tackled at the same time. It seems that Member States are unwilling to make concessions if the outcome is merely a halfway house. A comprehensive approach that addresses the interlinked issues holistically is worth considering. It could complete the work that began with a promise twelve years ago – to break the vicious circle between banks and sovereigns.
    Nicolas Véron is a French economist. He is a senior fellow at Bruegel in Brussels, which he co-founded in 2002–05, and at the Peterson Institute for International Economics in Washington DC.

    MIL OSI

    MIL OSI Europe News

  • MIL-OSI: Greene County Bancorp, Inc. Reports Net Income of $6.3 million for the Three Months Ended September 30, 2024 and Reaches New Milestone of $2.9 Billion in Assets

    Source: GlobeNewswire (MIL-OSI)

    CATSKILL, N.Y., Oct. 22, 2024 (GLOBE NEWSWIRE) — Greene County Bancorp, Inc. (the “Company”) (NASDAQ: GCBC), the holding company for The Bank of Greene County and its subsidiary Greene County Commercial Bank, today reported net income for the three months ended September 30, 2024, which is the first quarter of the Company’s fiscal year ending June 30, 2025. Net income for the three months ended September 30, 2024 was $6.3 million, or $0.37 per basic and diluted share, as compared to $6.5 million, or $0.38 per basic and diluted share, for the three months ended September 30, 2023. Net income decreased $208,000, or 3.2%, when comparing the three months ended September 30, 2024 and 2023.

    Highlights:

    • Net Income: $6.3 million for the three months ended September 30, 2024
    • Total Assets: $2.9 billion at September 30, 2024, a new record high
    • Net Loans: $1.5 billion at September 30, 2024, a new record high
    • Total Deposits $2.5 billion at September 30, 2024, a new record high
    • Return on Average Assets: 0.93% for the three months ended September 30, 2024
    • Return on Average Equity: 11.86% for the three months ended September 30, 2024

    Donald Gibson, President & CEO stated: “I am pleased to report another solid quarterly performance highlighted by record high levels in deposits, loans, and total assets. This achievement is a testament to our team’s strategy of providing innovative financial solutions and outstanding service to our customers, which combined, has provided steady long-term growth for our organization. We remain committed to being the leading provider of community-based banking services throughout the Hudson Valley and Capital Region of New York State.”

    Total consolidated assets for the Company were $2.9 billion at September 30, 2024, primarily consisting of $1.5 billion of net loans and $1.1 billion of total securities available-for-sale and held-to-maturity. Consolidated deposits totaled $2.5 billion at September 30, 2024, consisting of retail, business, municipal and private banking relationships.

    Pre-provision net income was $6.9 million for the three months ended September 30, 2024 as compared to pre-provision net income of $6.6 million for the three months ended June 30, 2024, an increase of $314,000, or 4.8%, and pre-provision net income of $6.9 million for the three months ended September 30, 2023. Pre-provision net income measures the Company’s net income less the provision for credit losses on loans. Management believes that this measure assists investors in comprehending the impact of the provision on the Company’s reported results, offering an alternative view of the Company’s performance and the Company’s ability to generate income in excess of its provision for credit losses on loans. During the September 30, 2024 quarter, the Company was able to reprice assets into the higher interest rate market faster than it had raised rates paid on deposits. This resulted in a higher net interest margin for the three months ended September 30, 2024 as compared to the three months end June 30, 2024. The Company will continue to monitor the monetary policy of the Federal Reserve and interest rates paid on deposits, while maintaining our long-term customer relationships.

    Selected highlights for the three months ended September 30, 2024 are as follows:

    Net Interest Income and Margin

    • Net interest income decreased $303,000 to $13.1 million for the three months ended September 30, 2024 from $13.4 million for the three months ended September 30, 2023. The decrease in net interest income was due to an increase in the average balance of interest-bearing liabilities, which increased $64.1 million when comparing the three months ended September 30, 2024 and 2023, and increases in rates paid on interest-bearing liabilities, which increased 53 basis points when comparing the three months ended September 30, 2024 and 2023. The decrease in net interest income was partially offset by the increase in the average balance of interest-earning assets, which increased $54.7 million when comparing the three months ended September 30, 2024 and 2023, and increases in interest rates on interest-earning assets, which increased 40 basis points when comparing the three months ended September 30, 2024 and 2023.

      Average loan balances increased $60.4 million and the yield on loans increased 36 basis points when comparing the three months ended September 30, 2024 and 2023. Average balance of securities increased $13.7 million and the yield on such securities increased 45 basis points when comparing the three months ended September 30, 2024 and 2023. Average interest-bearing bank balances and federal funds decreased $19.4 million, while the yield increased 43 basis points when comparing the three months ended September 30, 2024 and 2023.

      The cost of NOW deposits increased 54 basis points, the cost of certificates of deposit increased 49 basis points, and the cost of savings and money market deposits increased 19 basis points when comparing the three months ended September 30, 2024 and 2023. The increase in the cost of interest-bearing liabilities was partially due to growth in the average balances of interest-bearing liabilities of $64.1 million. This was due to an increase in NOW deposits of $47.7 million and an increase in average certificates of deposits of $31.0 million, partially offset by a decrease in average savings and money market deposits of $39.3 million when comparing the three months ended September 30, 2024 and 2023. Average borrowings increased $24.7 million when comparing the three months ended September 30, 2024 and 2023. Yields on interest-earning assets and costs of interest-bearing deposits increased for the three months ended September 30, 2024, as the Company repriced assets and deposits due to the higher interest rate environment. The Company determines interest rates offered on deposit accounts based on current and future economic conditions, competition, liquidity needs, the asset-liability position of the Company and growing the retention of relationships.

    • Net interest rate spread and margin both decreased when comparing the three months ended September 30, 2024 and 2023. Net interest rate spread decreased 13 basis points to 1.76% for the three months ended September 30, 2024 as compared to 1.89% for the three months ended September 30, 2023. Net interest margin decreased 9 basis points to 2.03%, for the three months ended September 30, 2024 as compared to 2.12% for the three months ended September 30, 2023. The decrease was due to the higher interest rate environment, which caused competitive pressure to increase rates paid on deposits, resulting in higher interest expense. This was partially offset by increases in interest income on securities and loans, as they reprice at higher yields and the interest rates earned on new balances were higher than the levels from the prior periods.
    • Net interest income on a taxable-equivalent basis includes the additional amount of interest income that would have been earned if the Company’s investment in tax-exempt securities and loans had been subject to federal and New York State income taxes yielding the same after-tax income. Tax equivalent net interest margin was 2.29% and 2.37% for the three months ended September 30, 2024 and 2023, respectively.

    Credit Quality and Provision for Credit Losses on Loans

    • Provision for credit losses on loans amounted to $634,000 for the three months ended September 30, 2024 compared to $457,000 for the three months ended September 30, 2023. The loan provision for the three months ended September 30, 2024, was primarily attributable to updated economic forecasts used in the quantitative modeling as of September 30, 2024. The allowance for credit losses on loans to total loans receivable was 1.32% at September 30, 2024 compared to 1.28% at June 30, 2024.
    • Loans classified as substandard and special mention totaled $59.0 million at September 30, 2024 and $48.6 million at June 30, 2024, an increase of $10.4 million. The increase in loans classified was primarily due to downgrades of commercial real estate loans during the period ended September 30, 2024, that were considered to be performing and paying in accordance with the terms of their loan agreements. Of the loans classified as substandard or special mention, $55.3 million were performing at September 30, 2024. There were no loans classified as doubtful or loss at September 30, 2024 or June 30, 2024.
    • Net charge-offs on loans amounted to $114,000 and $93,000 for the three months ended September 30, 2024 and 2023, respectively, an increase of $21,000. There were no material charge-offs in any loan segment during the three months ended September 30, 2024.
    • Nonperforming loans amounted to $3.6 million at September 30, 2024 and $3.7 million at June 30, 2024. The activity in nonperforming loans during the period included $410,000 in loan repayments, $57,000 in charge-offs or transfers to foreclosure, $56,000 in loans returning to performing status, and $441,000 of loans placed into nonperforming status. Nonperforming assets were 0.13% of total assets at September 30, 2024 and June 30, 2024, respectively. Nonperforming loans were 0.25% of net loans at September 30, 2024 and June 30, 2024, respectively.

    Noninterest Income and Noninterest Expense

    • Noninterest income increased $438,000, or 13.3%, to $3.7 million for the three months ended September 30, 2024 compared to $3.3 million for the three months ended September 30, 2023. The increase for the three-month period was primarily due to an increase in fee income earned on customer interest rate swap contracts, and income from bank owned life insurance (“BOLI”). During the quarter ended December 31, 2023, the Company restructured $23 million of BOLI contracts, by surrendering and simultaneously purchasing new higher-yielding policies.
    • Noninterest expense increased $705,000, or 8.0%, to $9.6 million for the three months ended September 30, 2024 compared to $8.8 million for the three months ended September 30, 2023. The increase during the three months ended September 30, 2024 was primarily due to an increase of $387,000 in salaries and employee benefits, due to new positions created during the period to support the Company’s continued growth, an increase of $176,000 in service and data processing fees due to vendor price negotiations in prior periods, and an increase of $285,000 in the reserve for credit losses on off-balance sheet unfunded commitments, due to the Company’s increased contractual obligations to extend credit. This was partially offset by a decrease of $156,000 in computer software and support fees, as compared to the three months ended September 30, 2023.

    Income Taxes

    • Provision for income taxes reflects the expected tax associated with the pre-tax income generated for the given period and certain regulatory requirements. The effective tax rate was 6.4% for the three months ended September 30, 2024 and 13.0% for the three months ended September 30, 2023. The statutory tax rate is impacted by the benefits derived from tax-exempt bond and loan income, the Company’s real estate investment trust subsidiary income, and income received on the bank owned life insurance, to arrive at the effective tax rate. The decrease in the current quarter’s effective tax rate primarily reflects a higher mix of tax-exempt income from municipal bonds, tax advantage loans and bank owned life insurance in proportion to pre-tax income.

    Balance Sheet Summary

    • Total assets of the Company were $2.9 billion at September 30, 2024 and $2.8 billion at June 30, 2024, an increase of $48.8 million, or 1.7%.
    • Total cash and cash equivalents for the Company were $213.5 million at September 30, 2024 and $190.4 million at June 30, 2024. The Company has continued to maintain strong capital and liquidity positions as of September 30, 2024.
    • Securities available-for-sale and held-to-maturity increased $26.1 million, or 2.5%, to $1.1 billion at September 30, 2024 as compared to $1.0 billion at June 30, 2024. Securities purchases totaled $115.2 million during the three months ended September 30, 2024, and consisted primarily of $77.4 million of state and political subdivision securities, $24.7 million of U.S. Treasury securities, $9.2 million of collateralized mortgage obligations and $3.9 million of mortgage-backed securities. Principal pay-downs and maturities during the three months ended September 30, 2024 amounted to $97.0 million, primarily consisting of $66.5 million of state and political subdivision securities, $25.0 million of U.S. Treasury securities, $4.5 million of mortgage-backed securities, and $683,000 of collateralized mortgage obligations.
    • Net loans receivable remained at $1.5 billion at September 30, 2024 and June 30, 2024. Loan growth experienced during the three months ended September 30, 2024, consisted primarily of $15.3 million in commercial real estate loans, partially offset by a decrease of $11.5 million in commercial loans.
    • Deposits totaled $2.5 billion at September 30, 2024 and $2.4 billion at June 30, 2024, an increase of $96.7 million, or 4.1%. The Company had zero brokered deposits at September 30, 2024 and June 30, 2024, respectively. NOW deposits increased $87.9 million, or 5.0%, certificates of deposits increased $17.9 million, or 12.9%, and noninterest-bearing deposits increased $7.4 million, or 5.9% when comparing September 30, 2024 and June 30, 2024. Savings deposits decreased $7.9 million, or 3.2%, and money market deposits decreased $8.6 million, or 7.6%, when comparing September 30, 2024 and June 30, 2024.
    • Borrowings amounted to $142.5 million at September 30, 2024 compared to $199.1 million at June 30, 2024, a decrease of $56.6 million. At September 30, 2024, borrowings included $63.0 million of overnight borrowings with the Federal Home Loan Bank of New York (“FHLB”), $49.7 million of Fixed-to-Floating Rate Subordinated Notes, $25.0 million in the Bank Term Funding Program with the Federal Reserve Bank, and $4.8 million of long-term borrowings with the FHLB.
    • Shareholders’ equity increased to $216.3 million at September 30, 2024 compared to $206.0 million at June 30, 2024, resulting primarily from net income of $6.3 million and a decrease in accumulated other comprehensive loss of $5.6 million, partially offset by dividends declared and paid of $1.5 million.

    Corporate Overview

    Greene County Bancorp, Inc. is the holding company for The Bank of Greene County, and its subsidiary Greene County Commercial Bank. The Company is the leading provider of community-based banking services throughout the Hudson Valley and Capital Region of New York State. Its customers include individuals, businesses, municipalities and other institutions. Greene County Bancorp, Inc. (GCBC) is publicly traded on the Nasdaq Capital Market and is dedicated to promoting economic development and a high quality of life in the communities it serves. For more information on Greene County Bancorp, Inc., visit http://www.tbogc.com.

    Forward-Looking Statements

    This earnings release contains statements about future events that constitute forward-looking statements, as defined in the Private Securities Litigation Reform Act of 1995. Forward-looking statements may be identified by references to a future period or periods or by the use of the words “believe,” “expect,” “anticipate,” “intend,” “estimate,” “assume,” “will,” “should,” “could,” “plan,” and other similar terms of expressions. Forward-looking statements should not be relied on because they involve known and unknown risks, uncertainties and other factors, many of which are beyond the Company’s control. These risks, uncertainties and other factors may cause the actual results, performance or achievements expressed in, or implied by, the forward-looking statements to differ materially from those contemplated by the forward-looking statements. Factors that may cause such a difference include, but are not limited to, local, regional, national and international general economic conditions, including actual or potential stress in the banking industry, financial and regulatory changes, changes in interest rates, regulatory considerations, competition, technological developments, retention and recruitment of qualified personnel, changes in customer deposit behavior, and market acceptance of the Company’s pricing, products and services.

    The Company cautions readers not to place undue reliance on any forward-looking statements, which speak only as of the date made, and advises readers that various factors, including, but not limited to, those described above and other factors discussed in the Company’s annual and quarterly reports previously filed with the Securities and Exchange Commission, could affect the Company’s financial performance and could cause the Company’s actual results or circumstances for future periods to differ materially from those anticipated or projected.

    Unless required by law, the Company does not undertake, and specifically disclaims any obligations to, publicly release any revisions that may be made to any forward-looking statements to reflect the occurrence of anticipated or unanticipated events or circumstances after the date of such statements.

    For more information, please see our reports filed with the United States Securities and Exchange Commission (“SEC”), including our most recent annual report on Form 10-K and quarterly reports on Form 10-Q.

    Non-GAAP Measures

    In addition to presenting information in conformity with accounting principles generally accepted in the United States of America (GAAP), this news release contains financial information determined by methods other than GAAP (non-GAAP). The following measures used in this release, which are commonly utilized by financial institutions, have not been specifically exempted by the Securities and Exchange Commission (“SEC”) and may constitute “non-GAAP financial measures” within the meaning of the SEC’s rules.

    The Company has provided in this news release supplemental disclosures for the calculation of net interest margin utilizing a fully taxable-equivalent adjustment and pre-provision net income. Management believes that the non-GAAP financial measures disclosed by the Company from time to time are useful in evaluating the Company’s performance and that such information should be considered as supplemental in nature and not as a substitute for or superior to the related financial information prepared in accordance with GAAP.  Our non-GAAP financial measures may differ from similar measures presented by other companies. Refer to the tables on page 8 for Non-GAAP to GAAP reconciliations.

    (END)

    Greene County Bancorp, Inc.
    Consolidated Statements of Income, and Selected Financial Ratios (Unaudited)

      At or for the Three Months
      Ended September 30,
    (Dollars in thousands, except share and per share data)   2024     2023  
    Interest income $ 27,769   $ 24,672  
    Interest expense   14,633     11,233  
    Net interest income   13,136     13,439  
    Provision for credit losses   634     457  
    Noninterest income   3,737     3,299  
    Noninterest expense   9,550     8,845  
    Income before taxes   6,689     7,436  
    Tax provision   428     967  
    Net Income $ 6,261   $ 6,469  
         
    Basic and diluted EPS $ 0.37   $ 0.38  
    Weighted average shares outstanding   17,026,828     17,026,828  
    Dividends declared per share(4) $ 0.09   $ 0.08  
         
    Selected Financial Ratios    
    Return on average assets(1)   0.93 %   0.99 %
    Return on average equity(1)   11.86 %   14.09 %
    Net interest rate spread(1)   1.76 %   1.89 %
    Net interest margin(1)   2.03 %   2.12 %
    Fully taxable-equivalent net interest margin(2)   2.29 %   2.37 %
    Efficiency ratio(3)   56.60 %   52.84 %
    Non-performing assets to total assets   0.13 %   0.22 %
    Non-performing loans to net loans   0.25 %   0.38 %
    Allowance for credit losses on loans to non-performing loans   542.39 %   369.10 %
    Allowance for credit losses on loans to total loans   1.32 %   1.40 %
    Shareholders’ equity to total assets   7.52 %   6.85 %
    Dividend payout ratio(4)   24.32 %   21.05 %
    Actual dividends paid to net income(5)   24.48 %   21.05 %
    Book value per share $ 12.70   $ 10.82  
                 

    (1) Ratios are annualized when necessary.
    (2) Interest income calculated on a taxable-equivalent basis (non-GAAP) includes the additional interest income that would have been earned if the Company’s investment in tax-exempt securities and loans had been subject to federal and New York State income taxes yielding the same after-tax income.
    (3) The efficiency ratio has been calculated as noninterest expense divided by the sum of net interest income and noninterest income.
    (4) The dividend payout ratio has been calculated based on the dividends declared per share divided by basic earnings per share. No adjustments have been made to account for dividends waived by Greene County Bancorp, MHC (“MHC”), the Company’s majority shareholder, owning 54.1% of the shares outstanding.
    (5) Dividends declared divided by net income. The MHC waived its right to receive dividends declared during the three months September 30, 2022, December 31, 2022, March 31, 2023, June 30, 2023, December 31, 2023, March 31, 2024 and June 30, 2024. Dividends declared during the three months ended September 30, 2023 and September 30, 2024 were paid to the MHC.

    Greene County Bancorp, Inc.
    Consolidated Statements of Financial Condition (Unaudited)

      At
    September 30, 2024
      At
    June 30, 2024
    (Dollars In thousands, except share data)      
    Assets      
    Cash and due from banks $ 24,824     $ 13,897  
    Interest-bearing deposits   188,645       176,498  
    Total cash and cash equivalents   213,469       190,395  
           
    Long term certificate of deposit   2,579       2,831  
    Securities available-for-sale, at fair value   364,526       350,001  
    Securities held-to-maturity, at amortized cost, net of allowance for credit losses of $466 and $483 at September 30, 2024 and June 30, 2024   701,919       690,354  
    Equity securities, at fair value   339       328  
    Federal Home Loan Bank stock, at cost   4,795       7,296  
           
    Loans receivable   1,501,212       1,499,473  
    Less: Allowance for credit losses on loans   (19,781 )     (19,244 )
    Net loans receivable   1,481,431       1,480,229  
           
    Premises and equipment, net   15,498       15,606  
    Bank owned life insurance   57,898       57,249  
    Accrued interest receivable   14,909       14,269  
    Prepaid expenses and other assets   17,258       17,230  
    Total assets $ 2,874,621     $ 2,825,788  
           
    Liabilities and shareholders’ equity      
    Noninterest bearing deposits $ 132,897     $ 125,442  
    Interest bearing deposits   2,352,977       2,263,780  
    Total deposits   2,485,874       2,389,222  
           
    Borrowings, short-term   63,000       115,300  
    Borrowings, long-term   29,781       34,156  
    Subordinated notes payable, net   49,727       49,681  
    Accrued expenses and other liabilities   29,941       31,429  
    Total liabilities   2,658,323       2,619,788  
    Total shareholders’ equity   216,298       206,000  
    Total liabilities and shareholders’ equity $ 2,874,621     $ 2,825,788  
    Common shares outstanding   17,026,828       17,026,828  
    Treasury shares   195,852       195,852  
           

    The above information is preliminary and based on the Company’s data available at the time of presentation.

    Non-GAAP to GAAP Reconciliations

    The following table summarizes the adjustments made to arrive at the fully taxable-equivalent net interest margins.

      For the three months ended September 30,
    (Dollars in thousands)   2024     2023  
    Net interest income (GAAP) $ 13,136   $ 13,439  
    Tax-equivalent adjustment(1)   1,713     1,563  
    Net interest income-fully taxable-equivalent basis (non-GAAP) $ 14,849   $ 15,002  
         
    Average interest-earning assets (GAAP) $ 2,589,580   $ 2,534,918  
    Net interest margin-fully taxable-equivalent basis (non-GAAP)   2.29 %   2.37 %
                 

    (1) Interest income calculated on a taxable-equivalent basis (non-GAAP) includes the additional interest income that would have been earned if the Company’s investment in tax-exempt securities and loans had been subject to federal and New York State income taxes yielding the same after-tax income. The rate used for this adjustment was 21% for federal income taxes for the three months ended September 30, 2024 and 2023, 4.44% for New York State income taxes for the three months ended September 30, 2024 and 2023.

    The following table summarizes the adjustments made to arrive at pre-provision net income.

      For the three months ended
    (Dollars in thousands) September 30, 2024   June 30, 2024   September 30, 2023  
    Net income (GAAP) $ 6,261   $ 6,732   $ 6,469  
    Provision for credit losses on loans   634     (151 )   457  
    Pre-provision net income (non-GAAP) $ 6,895   $ 6,581   $ 6,926  
                       

    The above information is preliminary and based on the Company’s data available at the time of presentation.

    For Further Information Contact:
    Donald E. Gibson
    President & CEO
    (518) 943-2600
    donaldg@tbogc.com

    Nick Barzee
    SVP & CFO
    (518) 943-2600
    nickb@tbogc.com

    The MIL Network

  • MIL-OSI USA: Rep. Gabe Vasquez Returns Over $1 Million to Constituents, Secures Millions to Strengthen Public Safety, Support the Economy

    Source: United States House of Representatives – Representative Gabe Vasquez’s (NM-02)

    LAS CRUCES, N.M. – Today, October 17, 2024, U.S. Representative Gabe Vasquez (NM-02) highlighted his ongoing commitment to helping New Mexicans navigate federal bureaucracy and securing funding for community projects. The event brought together constituents who have directly benefited from his office’s assistance with federal agencies as well as local leaders whose projects have received significant federal support through Community Project Funding (CPF).

    Since taking office, Vasquez has returned over $1 million to constituents, successfully resolving over 1,200 cases involving IRS disputes, Social Security benefits and VA assistance for veterans. Several constituents shared their stories of how Vasquez helped them overcome obstacles when dealing with federal agencies.

    “I’m excited to announce that my office has returned over $1 million to hard-working New Mexicans,” said Vasquez. “My office has helped seniors access hard-earned Social Security benefits, resolved IRS issues for families and helped countless veterans. I’m here to fight for everyone in southern New Mexico. Every success story shows the real impact we can have when we prioritize people over politics and ensure the federal government works for them.”

    “My husband was a Vietnam veteran. He was very, very sick, and he died in Texas because that’s where they sent him, and I waited and waited for my benefits. Every time I contacted the VA, they told me they’re working on it, but it never moved. I came here, filled out paperwork. Congressman Vasquez’s office sent it. On Thursday, your office sent me a letter saying that you heard from them, and on Saturday, I got my money. I can’t thank you enough for what you’ve done,” said Karen of Las Cruces.

    “My husband and I are both veterans. I started getting heart issues in 1998. Recently, I was told I needed a transplant, and they told me I needed to go to Utah. My husband and I are pretty close to retirement and by us having to temporarily move and lose our employment, would mean our house and our car would be gone. All of the things that we’ve worked for for retirement in a few years would be out the window. I called Congressman Vasquez and within the same week, the doctor called me back with an option to stay in state. It’s amazing how fast things worked for us. I really appreciate your intervention, because without that, I would have been dead within a week or two” said Cyprina of Alamogordo. 

    “Congressman Vasquez helped me with a Post Office issue,” said John of Las Cruces. “Our mailbox on our block got vandalized, and for months, we had to pick up our mail at the Post Office. I contacted the office and within days we got a new mailbox. It was crazy!” 

    In addition to casework success, Vasquez highlighted over $14.2 million he has secured for Community Project Funding. Vasquez’s submission of fifteen CPF projects for Fiscal Year 2024 marked the first time that New Mexico’s second congressional district has participated in the CPF process in recent years. Local leaders in attendance praised Vasquez’s leadership in bringing federal dollars back to New Mexico to fund essential community programs that will grow the economy and keep New Mexicans safe. 

    “Unlike my predecessor, I have secured millions of dollars in Community Project Funding for our district for the first time,” said Vasquez. “These investments are supporting critical infrastructure upgrades, public safety initiatives and strengthening New Mexico’s economy and families.”

    “I’ve been on the City Council while we’ve had a representative who was unresponsive to our community’s needs, and I don’t ever want to go back to that. Because of the impact that Representative Vasquez has talked about here today, I just couldn’t be more grateful for how you are representing us and for the support that you’re bringing, of course, to Las Cruces, but also to rural communities all across the southern part of our state. Thank you,” said Las Cruces City Councilor Johana Bencomo.

    “We’re here to work together at a local level, at a state level, at a federal level, and really here for our community and for our people. I think that just Congressman Vasquez being there to do that, it acknowledges that, and I can’t thank you enough for that. Our little community of Mesilla in the past has not actually gone after any type of federal dollars, but Congressman Vasquez really opened that door and that opportunity, and it’s been a breath of fresh air to see what’s available and out there. I can’t thank you more for that because it’s great for our community and the future of the town,” said Mesilla Mayor Russell Hernandez.

    Vasquez remains committed to helping constituents navigate federal agencies, securing federal funding for local projects and ensuring that the voices of southern New Mexico are heard in Washington. For assistance with federal agencies, please visit vasquez.house.gov/help. 

    ###

    MIL OSI USA News

  • MIL-OSI Security: Twelve Charged with Fentanyl Trafficking in Abilene

    Source: Federal Bureau of Investigation (FBI) State Crime Alerts (c)

    Twelve alleged fentanyl traffickers were arrested in a large-scale drug bust in Abilene, announced U.S. Attorney for the Northern District of Texas Leigha Simonton.

    The takedown – the second in an operation that previously resulted in the prosecution of 17 drug traffickers arrested during a large-scale bust in late February  – involved agents and officers from the Federal Bureau of Investigation’s Dallas Field Office –  Abilene Resident Office, the Taylor County Sheriff’s Office, the Abilene Police Department, and the Callahan County Sheriff’s Office. 

    Those charged in two separate indictments unsealed today include:

    • Christopher Thompson, charged with possession with intent to distribute fentanyl
    • Marquee Anthony Aboso, aka OC, charged with conspiracy to distribute and possess with intent to distribute fentanyl and possession with intent to distribute fentanyl
    • Kurtney Bernard Jones, aka KP, charged with conspiracy to distribute fentanyl and two counts of possession with intent to distribute fentanyl
    • Steven Lattimore, aka PNut, charged with conspiracy to distribute and possess with intent to distribute fentanyl and possession with intent to distribute fentanyl
    • Mckenzee Marie Lane, charged with conspiracy to distribute and possess with intent to distribute fentanyl and possession with intent to distribute fentanyl
    • Maxine Gonzales, charged with conspiracy to distribute and possess with intent to distribute fentanyl
    • Tylik Ojur Johnson, charged with conspiracy to distribute and possess with intent to distribute fentanyl and possession with intent to distribute fentanyl
    • Jeremiah Greene, aka Lil Mexico, charged with conspiracy to distribute and possess with intent to distribute fentanyl and possession with intent to distribute fentanyl
    • Paul Eli Snyder, charged with conspiracy to distribute and possess with intent to distribute fentanyl and possession with intent to distribute fentanyl
    • Robert Lee Mason, charged with conspiracy to distribute and possess with intent to distribute fentanyl and possession with intent to distribute fentanyl
    • Glen Edward Lee, Jr., charged with conspiracy to distribute and possess with intent to distribute fentanyl and possession with intent to distribute fentanyl
    • Christopher Anthony Glaze, charged with conspiracy to distribute and possess with intent to distribute fentanyl and possession with intent to distribute fentanyl

    Over the course of the operation into these individuals, agents seized more than 14,856 fentanyl pills, 45.4 grams of heroin, 2.56 grams of meth, and 15.56 grams of crack cocaine, as well as multiple firearms.

    An indictment is merely an allegation of criminal conduct, not evidence. All defendants are presumed innocent until proven guilty in a court of law.

    If convicted, some defendants named in these indictments face up to 20 years in federal prison.

    Sixteen of the 17 defendants arrested in February’s takedown have already been convicted. Fourteen have already been sentenced to a combined 187 years in federal prison; two pleaded guilty and await sentencing, and one is awaiting trial. The lead defendant, Diana Perez, deemed responsible for more than 109,221 kilograms of drugs, was sentenced Thursday to more than 24 years in federal prison.  

    The Federal Bureau of Investigation’s Dallas Field Office – Abilene Resident Agency, the Drug Enforcement Administration’s Dallas Field Division – Fort Worth Resident Agency, and the Taylor County Sheriff’s Office conducted the investigation with the assistance of Homeland Security Investigations, the Bureau of Alcohol, Tobacco, Firearms, & Explosives’ Dallas Field Division, and the IRS – Criminal Investigations. The cases are being prosecuted by the West Texas Branch of the U.S. Attorney’s Office for the Northern District of Texas.

    This prosecution stems from an Organized Crime Drug Enforcement Task Forces (OCDETF) instigation. OCDETF identifies, disrupts, and dismantles the highest-level drug traffickers, money launderers, gangs, and transitional criminal organizations that threaten the Untied States by using a prosecutor-led, intelligence-driven, multi-agency approach that leverages the strengths of federal, state, and local law enforcement agencies against criminal networks. Additional information about the OCDETF program can be found at https://www.justice.gov/OCDETF

    MIL Security OSI

  • MIL-OSI: Chino Commercial Bancorp Reports Quarterly Earnings

    Source: GlobeNewswire (MIL-OSI)

    CHINO, Calif., Oct. 18, 2024 (GLOBE NEWSWIRE) — The Board of Directors of Chino Commercial Bancorp (OTC: CCBC), the parent company of Chino Commercial Bank, N.A., announced the results of operations for the Bank and the consolidated holding company for the third quarter ended September 30, 2024.

    Net earnings year-to-date increased by 0.90% or by $33.2 thousand, to $3.74 million, as compared to $3.71 million for the same period last year. Year-to-date net earnings per share was $1.17 for the period ending September 30, 2024 and $1.16 for the same period last year. Net earnings for the third quarter of 2024, were $1.27 million, which represents a decrease of $7.6 thousand or 0.60% in comparison with the same quarter last year. Net earnings per basic and diluted share were $0.39 for the third quarter of 2024 and $0.40 for the same quarter in 2023, respectively.

    Dann H. Bowman, President and Chief Executive Officer, stated, “The Bank’s operating performance for the third quarter, and year-to-date continue to be strong. Total deposits reached an all time record at quarter-end, and we are optimistic about additional opportunities for growth and expansion. Loan quality also remains stable, with the Bank having only one delinquent loan at quarter-end, and year-to-date credit losses were a net recovery of $10,241, meaning that the Bank collected more bad debt than was charged-off.

    “In 2023 the Bank became a member of the Card Brand Association and began to offer Credit Card processing for its customers. Not only does this service provide an additional non-interest source of revenue, but the Bank has also been able to provide significant savings and transparency to its customers. For every business, efficient and cost effective processing of electronic payments has become a very important part of managing cash flow. In the future we can envision expanding this service outside of our immediate market; and the revenue from this service becoming an increasingly important part of the Bank’s business model.”

    Financial Condition

    At September 30, 2024, total assets were $464.4 million, an increase of $19.5 million or 11.68% over $446.4 million at December 31, 2023. Total deposits increased by $46.4 million or 14.52% to $366.2 million as of September 30, 2024, compared to $319.8 million as of December 31, 2023. At September 30, 2024, the Company’s core deposits represent 97.65% of the total deposits.

    Gross loans increased by $15.1 million or 8.4% to $194.4 million as of September 30, 2024, compared to $179.0 million as of December 31, 2023. The Bank had three non-performing loans for the quarter ended September 30, 2024, and as of December 31, 2023. OREO properties remained at zero as of September 30, 2024 and December 31, 2023 respectively.

    Earnings

    The Company posted net interest income of $3.4 million for the three months ended September 30, 2024 and $3.3 million for the same quarter last year. Average interest-earning assets were $442.1 million with average interest-bearing liabilities of $248.4 million, yielding a net interest margin of 3.08% for the third quarter of 2024, as compared to the average interest-earning assets of $442.9 million with average interest-bearing liabilities of $235.8 million, yielding a net interest margin of 2.98% for the third quarter of 2023.

    Non-interest income totaled $793.1 thousand for the third quarter of 2024, or an increase of 17.84% as compared with $673.1 thousand earned during the same quarter last year. The majority of the increase is attributed to the Company’s merchant services processing revenue that reached $129.2 thousand, representing an increase of $75.7 thousand during the third quarter as compared to $53.5 thousand for the same period last year.

    General and administrative expenses were $2.5 million for the three months ended September 30, 2024, and $2.2 million for the same period last year. The largest component of general and administrative expenses was salary and benefits expense of $1.5 million for the third quarter of 2024 and $1.4 million for the same period last year.

    Income tax expense was $500 thousand, which represents a decrease of $4 thousand or 0.77% for the three months ended September 30, 2024, as compared to $503 thousand for the same quarter last year. The effective income tax rate for the third quarter of 2024 and 2023 was approximately 28.3%.

    Forward-Looking Statements

    The statements contained in this press release that are not historical facts are forward-looking statements based on management’s current expectations and beliefs concerning future developments and their potential effects on the Company. Readers are cautioned not to unduly rely on forward-looking statements. Actual results may differ from those projected. These forward-looking statements involve risks and uncertainties, including but not limited to, the health of the national and California economies, the Company’s ability to attract and retain skilled employees, customers’ service expectations, the Company’s ability to successfully deploy new technology and gain efficiencies therefrom, and changes in interest rates, loan portfolio performance, and other factors.

    Contact: Dann H. Bowman, President and CEO or Melinda M. Milincu, Senior Vice President and CFO, Chino Commercial Bancorp and Chino Commercial Bank, N.A., 14245 Pipeline Avenue, Chino, CA. 91710, (909) 393-8880.

           
    Consolidated Statements of Financial Condition
    As of 9/30/2024      
      Sep-2024
    Ending Balance
      Dec-2023
    Ending Balance
    Assets      
    Cash and due from banks $56,235,795     $35,503,719  
    Cash and cash equivalents $56,235,795     $35,503,719  
           
    Fed Funds Sold $34,246     $25,218  
           
    Investment securities available for sale, net of zero allowance for credit losses $6,735,550     $6,736,976  
    Investment securities held to maturity, net of zero allowance for credit losses $187,751,860     $208,506,305  
    Total Investments $194,487,410     $215,243,281  
           
    Gross loans held for investments $194,405,145     $179,316,494  
    Allowance for Loan Losses ($4,460,580 )   ($4,465,622 )
    Net Loans $189,944,565     $174,850,872  
    Stock investments, restricted, at cost $3,576,000     $3,126,100  
    Fixed assets, net $7,204,530     $5,466,358  
    Accrued Interest Receivable $1,466,479     $1,439,178  
    Bank Owned Life Insurance $8,421,648     $8,247,174  
    Other Assets $3,583,393     $3,010,916  
           
    Total Assets $464,413,004     $446,414,238  
           
    Liabilities      
    Deposits      
    Noninterest-bearing $186,644,255     $167,131,411  
    Interest-bearing $179,588,806     $152,669,374  
    Total Deposits $366,233,061     $319,800,785  
           
    Federal Home Loan Bank advances $0     $15,000,000  
    Federal Reserve Bank borrowings $40,000,000     $57,000,000  
    Subordinated debt $10,000,000     $10,000,000  
    Subordinated notes payable to subsidiary trust $3,093,000     $3,093,000  
    Accrued interest payable $1,556,057     $2,156,153  
    Other Liabilities $2,145,941     $1,876,475  
    Total Liabilities $423,028,059     $408,926,413  
           
    Shareholder Equity      
    Common Stock ** $10,502,558     $10,502,558  
    Retained Earnings $32,664,661     $28,920,732  
    Unrealized Gain (Loss) AFS Securities ($1,782,273 )   ($1,935,465 )
    Total Shareholders’ Equity $41,384,946     $37,487,825  
           
    Total Liab & Shareholders’ Equity $464,413,004     $446,414,238  
           
    ** Common stock, no par value, 10,000,000 shares authorized and 3,211,970 shares issued and outstanding at 9/30/2024 and 12/31/2023
           
             
    Consolidated Statements of Net Income
    As of 9/30/2024        
      Sep-2024
    QTD Balance
    Sep-2023
    QTD Balance
    Sep-2024
    YTD Balance
    Sep-2023
    YTD Balance
    Interest Income        
    Interest & Fees On Loans $3,035,928   $2,467,400   $8,564,927   $7,245,563  
    Interest on Investment Securities $1,843,696   $1,166,387   $5,725,365   $3,444,135  
    Other Interest Income $661,305   $1,410,450   $2,181,584   $2,990,487  
    Total Interest Income $5,540,929   $5,044,237   $16,471,876   $13,680,185  
             
    Interest Expense        
    Interest on Deposits $1,168,014   $841,282   $3,255,683   $1,835,134  
    Interest on Borrowings $945,921   $877,179   $3,256,138   $2,112,955  
    Total Interest Expense $2,113,935   $1,718,461   $6,511,821   $3,948,089  
             
    Net Interest Income $3,426,994   $3,325,776   $9,960,055   $9,732,096  
             
    Provision For Loan Losses ($14,173 ) $6,578   ($15,312 ) ($81,806 )
             
    Net Interest Income After Provision for Loan Losses $3,441,167   $3,319,198   $9,975,367   $9,813,902  
             
    Noninterest Income        
    Service Charges and Fees on Deposit Accounts $445,176   $424,453   $1,345,691   $1,184,329  
    Interchange Fees $113,647   $106,418   $308,680   $314,803  
    Earnings from Bank-Owned Life Insurance $59,599   $48,677   $174,474   $142,799  
    Merchant Services Processing $129,184   $53,513   $410,722   $140,904  
    Other Miscellaneous Income $45,488   $39,989   $149,010   $130,747  
             
    Total Noninterest Income $793,094   $673,050   $2,388,577   $1,913,582  
             
    Noninterest Expense        
    Salaries and Employee Benefits $1,521,825   $1,381,721   $4,444,120   $4,101,388  
    Occupancy and Equipment $182,813   $164,092   $515,286   $485,502  
    Merchant Services Processing $77,452   $47,345   $222,055   $82,807  
    Other Expenses $684,102   $619,533   $1,964,230   $1,876,220  
             
    Total Noninterest Expense $2,466,192   $2,212,691   $7,145,691   $6,545,917  
             
    Income Before Income Tax Expense $1,768,070   $1,779,556   $5,218,253   $5,181,566  
    Provision For Income Tax $499,565   $503,424   $1,474,323   $1,470,859  
             
    Net Income $1,268,505   $1,276,132   $3,743,930   $3,710,707  
             
    Basic earnings per share $0.39   $0.40   $1.17   $1.16  
             
    Diluted earnings per share $0.39   $0.40   $1.17   $1.16  
             
    Effective Income Tax Rate   28.25 %   28.29 %   28.25 %   28.39 %
             
             
    Financial Highlights        
    As of 9/30/2024        
      Sep-2024
    QTD
    Sep-2023
    QTD
    Sep-2024
    YTD
    Sep-2023
    YTD
    Key Financial Ratios        
    Annualized Return on Average Equity   12.42 %   14.34 %   12.73 %   14.57 %
    Annualized Return on Average Assets   1.08 %   1.09 %   1.06 %   1.13 %
    Net Interest Margin   3.08 %   2.98 %   2.97 %   3.11 %
    Core Efficiency Ratio   58.44 %   55.33 %   57.87 %   56.21 %
    Net Chargeoffs/Recoveries to Average Loans   -0.01 %   0.00 %   -0.01 %   -0.02 %
             
             
    Average Balances        
    (thousands, unaudited)        
    Average assets $ 466,891   $ 463,977   $ 472,470   $ 439,669  
    Average interest-earning assets $ 442,078   $ 442,870   $ 447,855   $ 418,593  
    Average interest-bearing liabilities $ 248,448   $ 235,812   $ 255,169   $ 209,835  
    Average gross loans $ 192,243   $ 178,251   $ 187,406   $ 179,089  
    Average deposits $ 344,372   $ 340,261   $ 335,140   $ 333,225  
    Average equity $ 40,630   $ 35,312   $ 39,297   $ 34,046  
             
             
    Credit Quality        
    Non-performing loans $ 448,233   $ 492,242      
    Non-performing loans to total loans   0.23 %   0.27 %    
    Non-performing loans to total assets   0.10 %   0.11 %    
    Allowance for credit losses to total loans   2.29 %   2.49 %    
    Nonperforming assets as a percentage of total loans and OREO   0.23 %   0.27 %    
    Allowance for credit losses to non-performing loans   995.15 %   907.20 %    
             
    Other Period-end Statistics        
    Shareholders equity to total assets   8.91 %   8.40 %    
    Net Loans to Deposits   51.72 %   54.52 %    
    Non-interest bearing deposits to total deposits   50.96 %   52.26 %    
    Company Leverage Ratio   9.91 %   9.26 %    

    The MIL Network

  • MIL-OSI USA: Attorney General Bonta Issues Warning to Company Facilitating Illegal Robocalls

    Source: US State of California

    Continues work to protect consumers from annoying — and deceitful — robocalls

    OAKLAND — California Attorney General Rob Bonta today joined the Federal Communications Commission (FCC) and a coalition of 51 bipartisan attorneys general in issuing a warning letter to a telecom company responsible for transmitting suspected illegal robocall traffic, including robocalls that impersonated government officials and imitated a hotline used by the Illinois Attorney General’s office. 

    In the warning letter, Attorney General Bonta and the attorneys general on the nationwide Anti-Robocall Multistate Litigation Task Force warn iDentidad Advertising Development LLC dba iDentidad Telecom (iDentidad) that they need to cease transmitting any unlawful call traffic immediately. Originating and transmitting illegal robocalls violates the Telephone Consumer Protection Act, the Telemarketing Sales Rule, the Truth in Caller ID Act, and other state consumer protection laws.

    “Consumers deserve to know that the voice on the other end of the line is precisely who they claim to be. Robocalls aren’t just frustrating, they can result in serious financial harm and the impersonation of government officials,” said Attorney General Bonta. “I am proud to join in this national, bipartisan effort to protect consumers from unwanted robocalls and warn companies to stop illegal conduct immediately.”

    The Task Force notes that iDentidad is a gateway provider responsible for funneling high-volume robocall campaigns from outside the country into the U.S., including a large number of illegal or suspicious calls involving IRS/Social Security Administration government imposters, utility scams, and financial scams. The letter warns iDentidad that if they don’t stop routing suspicious or illegal robocall traffic, the attorneys general may take legal action including seeking damages, civil penalties, and injunctions. In addition to the warning letter, the FCC also sent a cease-and-desist to iDentidad today, demanding that it immediately stop supporting illegal robocall traffic on its network.

    The Anti-Robocall Multistate Litigation Task Force of 51 bipartisan attorneys general investigates and takes legal action against those responsible for routing significant volumes of illegal robocall traffic into and across the United States.

    Attorney General Bonta is committed to enforcing consumer protections in the state of California and speaking out for consumer protections nationwide, including working to put a stop to illegal robocalls. In February, Attorney General Bonta joined a coalition of 51 bipartisan attorneys general in issuing a warning letter to a company that allegedly sent New Hampshire residents scam election robocalls during the New Hampshire primary election. In January, Attorney General Bonta joined a coalition of 26 attorneys general in filing a comment letter responding to the Federal Communications Commission’s (FCC) notice of inquiry related to the potential impact of emerging artificial intelligence (AI) technology on efforts to protect consumers from illegal robocalls or robotexts. In May 2023, Attorney General Bonta, as part of a bipartisan coalition of 49 attorneys general, announced a lawsuit against Avid Telecom for allegedly initiating and facilitating billions of unlawful robocalls that included Social Security Administration scams, Medicare scams, and employment scams. 

    A copy of the letter is available here.

    MIL OSI USA News

  • MIL-OSI Russia: IMF Executive Board Completes the Fifth Review of the Extended Fund Facility Arrangement for Ukraine

    Source: IMF – News in Russian

    October 18, 2024

    • The IMF Board today completed the Fifth Review of the extended arrangement under the Extended Fund Facility (EFF) for Ukraine, enabling a disbursement of about US$1.1 billion (SDR 834.9 million) to Ukraine, which will be channeled for budget support.
    • Ukraine’s economy remains resilient, and performance remains strong under the EFF despite challenging conditions. The authorities met all end-June quantitative performance criteria and completed four structural benchmarks.
    • Sustained reform momentum, domestic revenue mobilization, and timely disbursement of external support are necessary to safeguard macroeconomic stability, restore fiscal and debt sustainability, and enhance institutional reforms.

    Washington, DC: The Executive Board of the International Monetary Fund (IMF) today completed the Fifth Review of the EFF arrangement for Ukraine, enabling the authorities to draw US$1.1 billion (SDR 834.9), which will be channeled for budget support. This will bring the total disbursements under the IMF-supported program to US$8.7 billion.

    Ukraine’s 48-month EFF arrangement, with access of SDR 11.6 billion (equivalent to US$15.5 billion, or about 577 percent of quota), was approved on March 31, 2023, and forms part of a US$151.4 billion support package for Ukraine. The authorities’ IMF-supported program helps anchor policies that sustain fiscal, external, and macro-financial stability at a time of exceptionally high uncertainty. The EFF aims to support the economic recovery, enhance governance, and strengthen institutions with the aim of promoting long-term growth in the context of reconstruction and Ukraine’s path to EU accession.

    All end-June and continuous quantitative performance criteria and indicative targets were met. The authorities have implemented prior action for the review, and completed structural benchmarks relating to tax privileges, public companies affected by the war, customs reform and public investment management, underscoring their continuing commitment to an ambitious reform agenda. Two structural benchmarks have been reset to allow more time for completion of the reform.

    The economy was more resilient than expected in the first half of 2024, with continued growth, moderate inflation, and adequate reserves bolstered by continued sizeable external support. Nevertheless, the outlook for the remainder of the year and 2025 has worsened since the Fourth Review, largely due to sustained Russian attacks on Ukrainian energy infrastructure and uncertainty about the war; overall, the outlook remains subject to exceptionally high uncertainty.

    Following the Executive Board discussion on Ukraine, Ms. Kristalina Georgieva, Managing Director of the IMF, issued the following statement[1]:

    1. Russia’s war in Ukraine continues to bring a devastating social and economic toll on Ukraine. Despite the war, macroeconomic and financial stability is being preserved through skillful policymaking by the Ukrainian authorities as well as substantial external support. The economy has remained resilient, despite significant damage to the energy infrastructure, reflecting the continued adaptability of households and firms.
    2. Ukraine’s performance and commitment under the program continues to be strong. All quantitative performance criteria for end-June were met, and those for end-September are expected to have been met. All but one structural benchmark through end-September were completed, while the missed structural benchmark has been reset to accommodate delays in the appointment process partly beyond the control of the authorities. Moreover, two structural benchmarks due later in the year and the prior action for the review was also implemented. The program remains fully financed with a cumulative external financing envelope of US$151 billion in the baseline and US$187 billion in the downside over the 4-year program period, including with new commitments from the Extraordinary Revenue Acceleration Loans for Ukraine (ERA) initiative.
    3. Looking ahead, the recovery is expected to slow amid headwinds from the impact of the attacks on energy infrastructure and the continuing war, while risks to the outlook remain exceptionally high. Preparedness is necessary to enable appropriate policy action should risks materialize.
    4. Ukraine’s financing needs remain large, driven by the continuing war. Timely and predictable external support—on terms consistent with debt sustainability—is essential to closing financing gaps and safeguarding stability. At the same time, decisive domestic revenue mobilization is critical for Ukraine to meet elevated spending needs, respond to shocks, and restore fiscal sustainability, which will require further tax policy measures as well as efforts to improve compliance and combat evasion, as envisioned under the National Revenue Strategy.

    Further strengthening medium-term budgeting, fiscal risk frameworks and transparency, and public investment management should advance in support of these goals.

    1. The Eurobond exchange in August was an important milestone in the authorities’ strategy to restore debt sustainability. Efforts to conclude the remaining steps in line with the authorities’ strategy and the program’s debt sustainability objectives should continue.
    2. Continued exchange rate flexibility under the managed exchange rate regime will help strengthen the resilience of the economy to external shocks. The recent uptick in inflation suggests limited room for further easing in the near term, though inflation remains well-anchored, and the FX cash market continues to show stability. A state-dependent and gradual approach to the easing of FX controls remains essential to safeguard FX reserves. The authorities’ efforts to avoid monetary financing should continue.
    3. The financial sector remains stable. Efforts should continue to strengthen bank resolution and supervision, governance, and contingency planning in view of risks to the outlook.
    4. Continuing the reform momentum in anticorruption and governance, including ensuring the effectiveness of anticorruption institutions and strengthening governance in the energy sector, remain essential to help contain fiscal risks, secure donor confidence and enhance growth, which would also support Ukraine’s path to EU accession.

    Table 1. Ukraine: Selected Economic and Social Indicators, 2021–33


    2021

    2022

    2023

    2024

    2025

    2026

    2027


    Act.

    Act.

    Act.

    Proj.

    Proj.

    Proj.

    Proj.


    Real economy (percent change, unless otherwise indicated)

    Nominal GDP (billions of Ukrainian hryvnias) 1/

    5,451

    5,239

    6,538

    7,542

    8,542

    9,715

    10,761

    Real GDP 1/

    3.4

    -28.8

    5.3

    3.0

    2.5-3.5

    5.3

    4.5

    Contributions:

    Domestic demand

    12.9

    -22.9

    13.9

    6.3

    5.1

    4.6

    4.3

    Private consumption

    4.7

    -16.8

    5.5

    3.1

    3.2

    3.8

    3.5

    Public consumption

    0.1

    12.5

    2.6

    -0.1

    -1.0

    -2.5

    -2.0

    Investment

    8.1

    -18.6

    5.8

    3.3

    2.9

    3.3

    2.7

    Net exports

    -9.5

    -5.9

    -8.6

    -3.3

    -2.6

    0.7

    0.2

    GDP deflator

    24.8

    34.9

    18.5

    12.0

    10.5

    8.0

    6.0

    Unemployment rate (ILO definition; period average, percent)

    9.8

    24.5

    19.1

    14.2

    12.7

    10.4

    9.4

    Consumer prices (period average)

    9.4

    20.2

    12.9

    5.8

    9.0

    7.7

    5.0

    Consumer prices (end of period)

    10.0

    26.6

    5.1

    9.0

    7.5

    6.6

    5.0

    Nominal wages (average)

    20.8

    1.0

    20.1

    16.6

    17.1

    14.1

    10.6

    Real wages (average)

    10.5

    -16.0

    6.4

    10.2

    7.5

    6.0

    5.3

    Savings (percent of GDP)

    12.5

    17.1

    9.7

    9.2

    5.2

    10.5

    16.4

    Private

    12.7

    30.2

    24.6

    25.5

    20.2

    15.7

    14.0

    Public

    -0.2

    -13.1

    -14.8

    -16.3

    -15.0

    -5.1

    2.5

    Investment (percent of GDP)

    14.5

    12.1

    15.1

    17.3

    19.5

    21.0

    22.3

    Private

    10.7

    9.6

    10.4

    14.8

    15.4

    16.6

    17.2

    Public

    3.8

    2.5

    4.8

    2.4

    4.1

    4.4

    5.1

    General Government (percent of GDP)

    Fiscal balance 2/

    -4.0

    -15.6

    -19.6

    -18.7

    -19.2

    -9.5

    -2.7

    Fiscal balance, excl. grants 2/

    -4.0

    -24.8

    -26.1

    -24.5

    -20.0

    -9.8

    -3.8

    External financing (net)

    2.4

    10.8

    16.5

    15.2

    18.2

    8.8

    3.3

    Domestic financing (net), of which:

    1.6

    5.0

    3.1

    3.5

    1.0

    0.8

    -0.6

    NBU

    -0.3

    7.3

    -0.2

    -0.2

    -0.2

    -0.1

    -0.1

    Commercial banks

    1.5

    -1.5

    2.5

    3.5

    1.0

    0.8

    -0.6

    Public and publicly-guaranteed debt

    50.5

    77.7

    82.3

    95.6

    106.6

    107.6

    102.6

    Money and credit (end of period, percent change)

    Base money

    11.2

    19.6

    23.3

    16.7

    13.2

    12.7

    12.4

    Broad money

    12.0

    20.8

    23.0

    15.4

    13.3

    11.9

    10.1

    Credit to nongovernment

    8.4

    -3.1

    -0.5

    9.0

    12.9

    21.5

    18.7

    Balance of payments (percent of GDP)

    Current account balance

    -1.9

    5.0

    -5.4

    -8.1

    -14.3

    -10.5

    -5.9

    Foreign direct investment

    3.8

    0.1

    2.6

    2.0

    2.1

    4.3

    4.9

    Gross reserves (end of period, billions of U.S. dollars)

    30.9

    28.5

    40.5

    42.6

    44.9

    49.1

    52.4

    Months of next year’s imports of goods and services

    4.5

    3.8

    5.1

    5.1

    5.4

    5.7

    6.0

    Percent of short-term debt (remaining maturity)

    67.5

    64.3

    89.5

    106.2

    106.3

    118.3

    124.5

    Percent of the IMF composite metric (float)

    104.4

    103.6

    124.3

    113.5

    104.7

    104.0

    106.9

    Goods exports (annual volume change in percent)

    35.1

    -43.7

    -15.4

    15.7

    6.2

    14.0

    6.3

    Goods imports (annual volume change in percent)

    17.0

    -24.1

    21.5

    14.1

    7.0

    8.8

    9.5

    Goods terms of trade (percent change)

    -8.4

    -11.6

    3.6

    0.3

    -1.8

    1.2

    1.4

    Exchange rate

    Hryvnia per U.S. dollar (end of period)

    27.3

    36.6

    38.0

    Hryvnia per U.S. dollar (period average)

    27.3

    32.3

    36.6

    Real effective rate (deflator-based, percent change)

    10.2

    27.5

    -1.5

    Memorandum items:

    Per capita GDP / Population (2017): US$2,640 / 44.8 million

    Literacy / Poverty rate (2022 est 3/): 100 percent / 25 percent

    Sources: Ukrainian authorities; World Bank, World Development Indicators; and IMF staff estimates.

    1/ GDP is compiled as per SNA 2008 and excludes territories that are or were in direct combat zones and temporarily occupied by Russia (consistent with the TMU).

    2/ The general government includes the central and local governments and the social funds.

    3/ Based on World Bank estimates.

    [1] At the conclusion of the discussion, the Managing Director, as Chairman of the Board, summarizes the views of Executive Directors, and this summary is transmitted to the country’s authorities. An explanation of any qualifiers used in summing up can be found here: http://www.IMF.org/external/np/sec/misc/qualifiers.htm.

    IMF Communications Department
    MEDIA RELATIONS

    PRESS OFFICER: Camila Perez

    Phone: +1 202 623-7100Email: MEDIA@IMF.org

    @IMFSpokesperson

    https://www.imf.org/en/News/Articles/2024/10/18/pr24381-ukraine-imf-executive-board-completes-fifth-rev-eff-arrangement

    MIL OSI

    MIL OSI Russia News

  • MIL-OSI Asia-Pac: RPF Seizes Gold, Silver, and Cash Worth ₹4.01 Crores in Major Operation at New Delhi Railway Station

    Source: Government of India (2)

    RPF Seizes Gold, Silver, and Cash Worth ₹4.01 Crores in Major Operation at New Delhi Railway Station

    RPF’s Vigilance Ensures Election Integrity in Haryana and Jammu & Kashmir, Seizing Illegal Goods Worth ₹12.86 Crores

    Posted On: 18 OCT 2024 7:16PM by PIB Delhi

    On September 5, 2024, a tip-off from a reliable informant led the Railway Protection Force (RPF) to launch a carefully coordinated operation at New Delhi Railway Station. The RPF Team was on high alert as they inspected several incoming trains. As they searched the coaches, they uncovered 24 suspicious packages from four different trains. What initially appeared to be routine parcels turned out to contain a surprising haul: 498 grams of gold bars, 365 kilograms of silver, and ₹85.72 lakhs in unaccounted cash. The total value of the seized goods was estimated at ₹4.01 crores. Working in collaboration with the Income Tax Department, the RPF team carefully documented and secured the items for further investigation, marking the operation as a major success in curbing illegal activities on the railways in the times of Assembly Elections in Haryana.

    This operation was just one of the broader efforts of the RPF to secure the Assembly Elections in Haryana and Jammu & Kashmir, which took place between August 16 and October 5. With 60 companies of the Force deployed across the two states, the RPF played a critical role in ensuring peace and safety during the election period. The vigilance of RPF throughout the election period resulted in the interception of illegal goods worth ₹12.86 crores and helped in enforcing the Model Code of Conduct in the recently concluded elections in Haryana and Jammu & Kashmir. Seizures included narcotics, smuggled liquor, unaccounted cash, and the items that could potentially be used to influence the voters. These efforts of the RPF were instrumental in maintaining the integrity of the elections and demonstrated the RPF’s commitment to ensuring the smooth functioning of the electoral process and curbing illicit activities that could have influenced the outcomes.

    Director General of the Railway Protection Force, Shri Manoj Yadava, commended his team for their dedication, stating, “Every election is a pivotal moment for our democracy. Through targeted contraband seizures and vigilant monitoring, we are here to protect that moment. I commend Team RPF for their unwavering dedication and hard work, ensuring the security of our railways and empowering every citizen to participate in the democratic process with confidence.”


    By safeguarding the railways and intercepting illegal goods, the RPF not only secured the transportation network but also contributed to the broader effort of ensuring free and fair elections, allowing citizens to vote with confidence.

    ****

    DT/SK

    (Release ID: 2066190) Visitor Counter : 25

    MIL OSI Asia Pacific News

  • MIL-OSI USA: Governor Polis and Department of Revenue to Announce Relief for Hurricanes Helene, Milton

    Source: US State of Colorado

    Colorado has also provided emergency management and response support to states impacted by both hurricanes

    DENVER – Today, Governor Jared Polis Colorado Department of Revenue announced today that taxpayers impacted by hurricanes Helene and Milton now have until May 1, 2025, to file various individual and business tax returns and make tax payments.

    This decision mirrors the IRS decision to provide similar relief at the federal level.

    “We want to ensure that Coloradans impacted by these terrible storms, who are part time Alabama, Florida, Georgia, North Carolina and South Carolina, and parts of Tennessee and Virginia residents or who have property or business there, have the support and relief they need during this challenging time. Tax deadlines should be the last thing that families impacted by these natural disasters are worried about. This relief will help allow families to prioritize their safety and recovery from these storms without being unnecessarily penalized for missing a deadline,” said Governor Polis.  

    Individuals and households affected by hurricanes Helene and Milton that reside or have a business anywhere in the state of Florida, Alabama, Georgia, North Carolina, South Carolina, and parts of Tennessee and Virginia qualify for tax relief. The decision permits the Colorado Department of Revenue to postpone certain tax-filing and tax-payment deadlines for taxpayers who reside or have a business in the disaster area. Deadlines falling on or after September 23, 2022, and before February 15, 2023, are postponed through May 1, 2025 for impacted taxpayers.

    Impacted individuals who had an automatic extension to file their 2023 return, due on October 15, 2024, will now have until May 1, 2025, to file. This extension does not relieve the taxpayer from penalties and interest, as tax payments related to the 2023 return were due on April 15, 2024.  

    Colorado agrees to honor any waiver of interest granted by Florida for affected International Fuel Tax Agreement (IFTA) motor carriers based in Florida if payments are received by the extension deadline.

    Affected Colorado sales tax licensees who file and pay by the extension deadline of May 1, 2025, will still be considered as “timely filing” and eligible for any vendor fee (discount) that applies.

    Department exemptions do not apply to home-rule jurisdictions who collect their own taxes. CDOR will not automatically apply this tax deadline waiver. Affected taxpayers who reside or have a business located in the covered disaster area must call the tax information hotline at 303-238-SERV (7378) Monday through Friday from 8 a.m. to 4:30 p.m. to request the extended deadline after they receive a bill.

    Colorado has contributed to disaster preparation and response in many ways. Governor Polis directed the state of Colorado and the National Guard to send a Chinook Helicopter (1CH47) and its eight crew members to Florida to assist with Hurricane Milton preparation and relief. DHSEM continues to coordinate Colorado’s emergency response to hurricane Helene and Milton, under the Emergency Management Assistance Compact (EMAC). DHSEM’s Incident Management Team (IMT) coordinator coordinated national IMT response to Florida in Tallahassee, FL at the State Emergency Operations Center (SEOC) and a four member IMT in Columbia, SC supported the South Carolina State Emergency Operations Center. DHSEM’s Strategic Communications Director was in Raleigh supporting the North Carolina SEOC’s Joint Information Center. The IMT coordinator and DHSEM Communications Director have returned home. A Voluntary Agency Liaison is deployed to Chesterfield, VA. FEMA has also deployed Colorado Urban Search and Rescue (USAR) Task Force One, which has approximately 200 highly trained members, that include firefighters, paramedics, physicians, structural engineers, hazardous materials technicians, heavy rigging specialists and canine handlers. These team members have completed their mission and are headed home. Additionally, two incident management teams completed deployments with a six member team at the Columbia County EOC in Lake City, FL and a five member team in Conover, NC.

    DHSEM mobilized a nine-person Emergency Management Assistance Team to Tallahassee, FL to support evacuations as well as  Colorado National Guard aviation resources. That team later became two Emergency Management Assistance Teams, one in Sarasota County and one in Hillsborough County. Coloradans can view this map to see resources deployed through the Emergency Management Conference.

    The Department of Agriculture’s Emergency Coordinator was deployed for 11 days as an EOC deputy manager for a Colorado Incident Management Team that responded to Columbia County, Florida. The team supported five shelters and seven distribution points for water, ice, food, and sanitation stations.

    ###
     

    MIL OSI USA News

  • MIL-OSI Asia-Pac: Ministries/Departments of Government of India Participated in the Special campaign 4.0 for Swachhata and Reducing Pendency in Government of India

    Source: Government of India

    Posted On: 18 OCT 2024 4:35PM by PIB Delhi

    With the Target of covering 3.19 lakh Office Spaces Cleanliness Campaigns made in 2.30 lakh (72%) by the mid of the campaign itself

    63.48 lakh square feet of space Freed for Productive Use; Rs. 53.61 crore Revenue Earned through Scrap Disposal and 2.95 lakh Public Grievances Redressed

    Large Scale Awareness Generation and Campaign Advocacy Resorted through Electronic, Print and Social Media With 7,587 Tweets, 32 Million Reach And 183 PIB Statements; #Specialcampaign4 has Gained a Lot of Traction on Social Media


    The Special Campaign 4.0 launched by the Government, with Department of Administrative Reforms & Public Grievances as the nodal department, is well on track to attain its stated objectives of institutionalization of cleanliness campaigns and reduction in pendency with a saturation approach. The preparatory phase (16th-30th September, 2024) for the Special Campaign 4.0 completed on 30th September, 2024 and Implementation Phase started from 2nd October, 2024.

    The progress of the campaign was reviewed by Secretary DARPG, in the sixth Meeting of Nodal Officers of Special Campaign 4.0 for Swachhata and Disposal of Pending Matters held on 18th October, 2024.  The meeting was attended by 187 senior officers, from 84 Ministries/Departments. All Ministries/Departments are participating in the Special Campaign 4.0.  Offices of all Ministries/ Departments across the country are participating in the campaign, with cleanliness campaigns made in 2.30 lakh office spaces (72%) by middle of the campaign, out of 3.19 lakh target.  63.48 lakh square feet of space has been freed for productive use; Rs. 53.61 crore revenue has been earned through scrap disposal and 2.95 lakh public grievances have been redressed.    

    By the middle of the Special Campaign 4.0, as on 18th October, 2024, the following progress has been achieved:


    S.No.

    Parameter

    Target

    SC 4.0

    Achievement upto 18th Oct 2024

    Target % completed upto 18th Oct 2024

    1.  

    Cleanliness Campaigns

    3,19,223

    2,30,189

    72%

    1.  

    Reference from MPs

    4,139

    1,173

    28%

    1.  

    Parliamentary Assurances

    1,157

    106

    9%

    1.  

    IMC References

    146

    75

    51%

    1.  

    State Government References

    749

    374

    50%

    1.  

    Public Grievances

    5,17,672

    2,95,115

    57%

    1.  

    Pubic Grievance Appeals

    15,841

    7,063

    45%

    1.  

    PMO References

    972

    570

    59%

    1.  

    Easing of Rules/Processes

    635

    308

    49%

    1.  

    Physical Files due for Review

    33,10,775

    19,07,229

    58%

    1.  

    e-Files put up for Review

    4,99,981

    2,15,383

    43%

    1.  

    Space freed

    (Sq ft)

    63.48 lakh


    1.  

    Revenue earned

    (Rs. )

    53.61 Crore


    The Special Campaign 4.0 has gained significant traction in social media with 7,587 tweets by Ministries/Departments on #SpecialCampaign4.0, 406 infographics, 32 million reach and issue of 183 PIB statements.

    Some of the best practices that emerged during the week are as follows:

    1. Exhibition by National Archives of India ‘Sushasan aur Abhilekh’ 1st -31st October, 2024
    2. Cleanliness drive at Nubra Valley; Ministry of Mines
    3. Record management & cleanliness drive at Area study & Rare book section, Central Secretariat Library; Ministry of Culture
    4. Office space renovated at Ajmer Railway station; Ministry of Railways
    5. “Rail chaupals” being organized for sensitization on Swachhata at Ajmeri gate, NDLS; Ministry of Railways.
    6. Beautification at KV Ernakulam; Department of School Education & Literacy
    7. Converted abandoned office space into creche & cafeteria; CBIC
    8. Cyber Swachhata National Cybersecurity workshop conducted by DARPG on 7th October, 2024 at CSOI, New Delhi
    9. Mobile science exhibition at District Science Center, Dharampur; Ministry of Culture
    10. Waste room converted in recreation room, BCCL, Dhanbad; Ministry of Coal

    *****

    NKR/AG

    (Release ID: 2066086) Visitor Counter : 64

    MIL OSI Asia Pacific News

  • MIL-OSI Russia: IMF Executive Board Completes the First Review under the Extended Credit Facility (ECF) Arrangement for Ethiopia

    Source: IMF – News in Russian

    October 18, 2024

    • The IMF Board completed the first review under the Extended Credit Facility (ECF) for Ethiopia, allowing the authorities to draw the equivalent of about US$340.7 million (SDR 255.6 million). The ECF was approved by IMF Board in July 2024 and forms part of a US$10.7 billion support package from development partners and creditors for Ethiopia.
    • The Ethiopian authorities have shown strong commitment to their homegrown economic reform program. Implementation of ECF-supported reforms is advancing well.

    Washington, DC: The Executive Board of the International Monetary Fund (IMF) completed today the first review of the 48-month Extended Credit Facility (ECF) for Ethiopia. The Board’s decision allows for an immediate disbursement of about US$340.7 million (SDR 255.6 million), which will help Ethiopia meet its balance of payments needs. The completion of the review brings total disbursements under the arrangement to about US$1.363 billion.

    Ethiopia’s ECF arrangement for a total of SDR 2.556 billion (850 percent of quota) or about US$3.4 billion at the time of program approval on July 29, 2024 (see Press Release 24/291) is aimed at supporting the authorities’ Homegrown Economic Reform Agenda (HGER) to address macroeconomic imbalances and lay the foundations for private sector led growth.

    All quantitative performance criteria and four out of five structural benchmarks for the first review have been met. The emergency liquidity assistance framework has been finalized prior to Board approval with a slight delay from end-September target date.

    The implementation of the authorities’ economic program, including the transition to the new exchange rate regime, has been commendable. The spread between the formal and parallel market exchange rates has narrowed to low levels, with little sign of disruption to the broader economy. The supply of foreign exchange is picking up, helping alleviate acute foreign exchange shortages. Nonetheless, some unmet foreign exchange demand persists as economic agents are still adjusting to the new FX regime.

    Steady implementation of the HGER reform plan will be key to macroeconomic stability and stronger economic growth. Continued tight monetary policy and elimination of monetary financing of the government will be key to durably reducing inflation. Expanding social safety nets is critical to mitigating the impact of reforms on vulnerable people. Maintaining momentum on domestic revenue mobilization and structural reforms in the SOE sector is essential to creating sufficient space for social and developmental capital spending.

    The authorities continue their efforts to restore debt sustainability. Financing assurances and adjustment efforts are consistent with IMF policy requirements and program parameters.

    Following the Executive Board discussion, Mr. Bo Li, Deputy Managing Director and Chairman of the Board, made the following statement:

    “Ethiopia’s program under the ECF has made a solid start, and the transition to a more flexible exchange rate has progressed well. Transitional one-off arrangements to address the foreign exchange (FX) backlog from past fuel imports are in place, relying principally on market participants with an additional contribution from the National Bank of Ethiopia (NBE). As economic agents adjust to the new FX regime, reform momentum and clear communication will need to continue to ensure a fully successful and sustained switch to a floating exchange rate.

    “Continuing to restrict NBE’s FX interventions and additional policy measures to support FX market development will be critical to enhance market efficiency and deepening. Prudent macroeconomic policies, including continued tight monetary policy and the elimination of monetary financing of government deficits are essential to reducing imbalances and shoring up macroeconomic stability.

    “Implementation of the early stages of the authorities’ monetary policy reforms and the shift to an interest-rate based regime has been encouraging, including the steady uptake of NBE open market operations. The authorities should step up efforts to improve monetary policy transmission, including by enhancing treasury bill market functioning. Close supervision and enforcement of net open position regulations for banks will help address financial sector vulnerabilities. 

    “The authorities have embarked on ambitious and comprehensive tax mobilization reforms, which will be guided by the recently approved National Medium-Term Revenue Strategy. The new VAT law further streamlines exemptions, expands the revenue base, and strengthens administration and compliance framework. Sustained tax revenue mobilization reforms are critical for creating sufficient space for social and development spending needs. The authorities are implementing plans to expand the targeted social safety net (PSNP), which will deliver cost-effective and efficient support to vulnerable people and mitigate the social impact of the FX reform. 

    “Amendments to the law governing the NBE tabled in Parliament include important improvements to the NBE’s mandate, functions, and powers. Robust lender-of-last resort provisions and legal safeguards to central bank autonomy and governance will also be important.

    Continued steps to secure debt treatment is crucial to restore debt sustainability. The progress made on debt restructuring negotiations under the Common Framework is welcome. The authorities are working to reach an agreement on debt treatment with official creditors by the time of the second program review. Negotiations with commercial creditors should follow on comparable terms. The authorities plan to develop a debt management strategy with Fund technical assistance.”

    Ethiopia Selected Economic Indicators, 2021/22-2028/29

    2021/22

    2022/23

    2023/24

    2024/25

    2025/26

    2026/27

    2027/28

    2028/29

    Proj.

    Proj.

    Proj.

    Proj.

    Proj.

    Proj.

    Output

    Real GDP growth (%)

    6.4

    7.2

    6.1

    6.5

    7.1

    7.7

    8.0

    7.8

    Prices

    Inflation – average (%)

    33.9

    32.5

    26.6

    25.0

    16.7

    12.2

    10.4

    9.6

    General government finances

    Revenue (% GDP)

    8.1

    7.9

    7.5

    8.4

    9.8

    10.9

    11.3

    11.5

    Expenditure (% GDP)

    12.7

    10.8

    9.9

    11.5

    12.4

    13.4

    13.7

    14.0

    Fiscal balance, including grants (% GDP)

    -4.2

    -2.6

    -2.0

    -1.7

    -2.1

    -2.0

    -2.0

    -2.0

    Public debt (% GDP)1

    48.9

    40.2

    34.7

    43.6

    39.1

    36.0

    33.6

    31.6

    Money and Credit

    Broad money (% change)

    27.2

    26.6

    14.1

    28.4

    28.3

    30.6

    22.1

    21.0

    Credit to private sector and state-owned enterprises (% change)

    18.9

    24.1

    9.7

    -14.3

    37.9

    40.1

    24.2

    21.1

    Balance of payments

    Current account (% GDP)

    -4.0

    -2.8

    -2.4

    -4.4

    -3.3

    -2.5

    -2.1

    -1.9

    FDI (%GDP)

    2.6

    2.1

    1.6

    2.7

    3.2

    2.9

    3.0

    3.0

    Reserves (in months of imports)

    0.8

    0.5

    0.7

    1.4

    2.1

    2.6

    3.5

    3.6

    External debt (% GDP)

    24.0

    18.1

    15.4

    28.9

    26.8

    24.5

    22.5

    19.7

    Exchange rate

    Real effective exchange rate (% change, end of period, depreciation –)

    10.1

    24.0

    1/Public and publicly guaranteed external debt, which includes long-term foreign liabilities of NBE and external debt of Ethio-Telecom. Does not include expected debt relief.

    For digital posting, please submit press release with an editable table (no images) already inserted in Microsoft Word file to ensure that the data in the SEI table is displayed as prepared.]

    IMF Communications Department
    MEDIA RELATIONS

    PRESS OFFICER: Tatiana Mossot

    Phone: +1 202 623-7100Email: MEDIA@IMF.org

    @IMFSpokesperson

    https://www.imf.org/en/News/Articles/2024/10/18/pr-24383-ethiopia-imf-completes-the-1st-review-under-the-ecf-arrangement

    MIL OSI

    MIL OSI Russia News

  • MIL-OSI USA: News 10/18/2024 Blackburn, Bennet Introduce Bipartisan Bill to Expand Employer Child Care Tax Credit

    US Senate News:

    Source: United States Senator Marsha Blackburn (R-Tenn)

    NASHVILLE, Tenn. – U.S. Senators Marsha Blackburn (R-Tenn.) and Michael Bennet (D-Colo.), members of the Senate Committee on Finance, introduced the bipartisan Child Care for American Families Act to strengthen the employer-provided child care credit and expand support for small and rural businesses: 

    “Many families across Tennessee and America are struggling to find reliable and affordable child care, and we need to incentivize businesses to invest in child-care services for their employees,” said Senator Blackburn. “Our Child Care for American Families Act would help alleviate the financial burden of child-care costs by expanding and modernizing the Employer-Provided Child Care Tax Credit.”

    “Child care costs are rising nationwide, and countless families lack access to affordable, high-quality child care. This makes things that much harder for working parents, strains families’ budgets, and adds undue stress for families with young children,” said Senator Bennet. “The Child Care for American Families Act will help increase our country’s child care supply and reduce the number of Americans in child care deserts.”

    BACKGROUND
    According to the Tennessee Department of Human Services, 48 percent of Tennessee residents live in a child care desert, with disproportionate impacts felt by rural and low-income communities.
    The Bipartisan Policy Center found that 31.7 percent of children below the age of six with working parents do not have access to child care, and in rural communities, that number arises to 35.1 percent.
    THE CHILD CARE FOR AMERICAN FAMILIES ACT:
    Expands the employer-provided child care credit to cover a greater percentage of child care expenses, equal to:
    60% for businesses in eligible rural and low-income areas, up to a maximum of $1.2 million annually;
    50% for small businesses, up to a maximum of $1 million annually; and
    40% for all other businesses, up to a maximum of $800,000 annually.
    Directs the U.S. Department of the Treasury to issue guidance on multi-employer facilities.  
    ENDORSEMENTS
    The Child Care for American Families Act is endorsed by Save the Children, Colorado Executives Partnering to Invest in Children (EPIC), Kindercare, and Early Care & Education Consortium (ECEC). 
     
    Click here for bill text.

    MIL OSI USA News

  • MIL-OSI USA: Investor Bulletin: Robo-Advisers

    Source: Securities and Exchange Commission

    Feb. 23, 2017

    The last few years have seen the growth in availability and popularity of automated digital investment advisory programs (often called “robo-advisers”).  These programs allow individual investors to create and manage their investment accounts through a web portal or mobile application, sometimes with little or no interaction with a human being with the potential benefit of lower costs than traditional investment advisory programs.  The SEC’s Office of Investor Education and Advocacy is issuing this Investor Bulletin to educate investors about these programs, and to help investors using robo-advisers to make informed decisions in meeting their investment goals.   

    What is a Robo-Adviser?

    The term “robo-adviser” generally refers to an automated digital investment advisory program.  In most cases, the robo-adviser collects information regarding your financial goals, investment horizon, income and other assets, and risk tolerance by asking you to complete an online questionnaire.  Based on that information, it creates and manages an investment portfolio for you.  Robo-advisers often seek to offer investment advice for lower costs and fees than traditional advisory programs, and in some cases require lower account minimums than traditional investment advisers.  The services provided, approaches to investing, and features of robo-advisers vary widely.  You can find information about these topics in the adviser’s Form ADV Part 1 and Part 2 brochure. 

    While robo-advisers have similarities to traditional investment advisory programs, there are also differences.  Before making a decision about whether to invest through a robo-adviser, or in deciding which robo-adviser might be best for you, you should do your own research.  Make sure the robo-adviser and the investment portfolio it puts together for you are a good match for your investment needs and goals, and that you understand the potential costs, risks, and benefits of using that particular robo-adviser.  Below we’ve highlighted some issues you may want to consider in making these important decisions.

    What Level of Interaction with a Person is Important to You?

    The amount of human interaction available to you may vary from one robo-adviser to another.  Some robo-advisers may offer the opportunity to contact an investment professional to discuss your investment needs (this hybrid of both automated and personal advice is sometimes referred to as “bionic” advice).  Other robo-advisers may only make technical support staff available, which will limit you to relying on the information on their websites or other sources you find to address your questions about investing. 

    If a robo-adviser does make an investment professional available to you, the format and amount of the interaction may also vary.  For example, a person may be available by email but not by phone, or available only for a limited number of in-person meetings.  In some cases, a robo-adviser may offer access to a person only for accounts that meet a certain minimum account size.  Still other robo-advisers may offer limited, if any, involvement of an investment professional in the creation and management of a client’s account.  

    Unlike a traditional investment adviser, there may be no initial or subsequent conversation with a person to gather information about you and your personal financial needs.  However, the robo-adviser may be able to offer you lower costs and fees by limiting the expense associated with a human adviser’s time. 

    As with any adviser, it is very important you take the time to learn about the robo-adviser’s services, including the level of interaction with a person, and find out answers to any questions you may have.  Here are a few questions to consider:

    • How much human interaction is important to you?  Would you like to be able to ask a person questions about your investments, the investment strategy being used, and potential risks? Would you like to be able to speak with a person during market events, such as periods of exceptional volatility or downturns?  Do you prefer being able to talk in person or on a phone, or is electronic communication fine with you?
    • What is your level of financial literacy, especially when it comes to investing?  Your ability to ask a person questions about investing (for example, about the robo-adviser’s investment strategy) may be limited and you may need to rely almost entirely on the robo-adviser’s online disclosures or other sources of information that you find on your own.  Are you comfortable using online resources?
    • As with a traditional adviser, you may be interested in how often you will have contact with the robo-adviser.  For example, how often does the robo-adviser follow-up with clients to confirm any changes that would affect their investment choices?  Would you have to contact the robo-adviser with any updates to your financial situation? 

    What Information is the Robo-Adviser Using to Create a Recommendation?

    A robo-adviser uses information you provide to create a recommendation.  As a result, a robo-adviser’s recommendation is limited by the information it requests and receives from you, typically through an online questionnaire.  It is important to keep in mind that some robo-advisers may obtain and consider only limited information about you.  In addition, as with traditional advisers, in many cases the burden to update this information will fall on you.  Here are a few questions to consider:

    • Would you use the robo-adviser for a specific financial goal (for example, retirement, buying a home, or investing for your children’s education), or to meet your overall financial needs more broadly?  Does the robo-adviser’s recommendation take into account your purpose in using the robo-adviser?   
    • Does the robo-adviser’s recommendation take into account relevant personal financial information, given your goal?  For example, does the robo-adviser ask for information about high interest credit card debt or student loans you may have? Does it take into account your bank and savings accounts? Does it take into account your real estate holdings, such as your home, or other investments such as retirement accounts? Does it take into account other assets that you have?
    • How does the robo-adviser take into account your tolerance for risk?  How you respond to the robo-adviser’s questions about risk can affect what portfolio the robo-adviser recommends. In addition to the initial makeup of your portfolio, how does your risk tolerance impact how the robo-adviser might rebalance your portfolio (for example, in the event of a market decline)?   

    What is the Robo-Adviser’s Approach to Investing?

    Different robo-advisers have different approaches to investing, including different investment styles and different products offered.  Some have several pre-determined portfolios of investments that they will recommend for you that you may or may not be able to customize.  Some robo-advisers focus solely on a limited range of investment products, such as broad-based exchange-traded funds, or ETFs. 

    Exchange-Traded Funds  
    Many robo-advisers utilize ETFs.  ETFs have unique characteristics that may make them more suitable for certain investors and less suitable for others.  To learn more about ETFs, including how they differ from mutual funds, read our Investor Bulletin: Exchange-Traded Funds (ETFs).  Also, certain robo-advisers may use hypothetical performance for newer ETFs in their marketing materials.  To learn more about performance claims, read our Investor Bulletin: Performance Claims

    Some robo-advisers may recommend emerging market funds or invest in smaller companies, which could be more volatile or potentially less liquid.  The investment style of the robo-adviser can make a big difference in the asset allocation of your portfolio.  In addition, some robo-advisers have additional features that can affect returns on your investment.  Also, in some cases robo-advisers may not have been tested under stressed market conditions. 

    You should take the time to understand how the robo-adviser develops a portfolio recommendation, and what pieces of information it uses – or does not use – in developing the portfolio.  Here a few questions to consider:

    • Does the robo-adviser offer a limited range of investment products, such as only ETFs?  Are the investment products utilized by the robo-adviser appropriate for your goals?  
    • Does the robo-adviser only offer certain limited portfolios within those investment products?  How many different portfolios could your money possibly be invested in?  What portfolio does the robo-adviser recommend for you and why? 
    • What type of accounts does the robo-adviser manage?  For example, does the robo-adviser manage individual retirement accounts (IRAs)? Taxable accounts? 401(k) accounts or college savings plans?
    • How does the robo-adviser handle volatility? For example, does the robo-adviser have the ability to freeze sales (not let you sell your investments for cash for a certain period of time)?
    • How often is your account rebalanced?  Rebalancing can have tax implications, depending on the type of account.  What would trigger a change in the asset allocation or investment categories of your portfolio?

    Tax Loss Harvesting
    Does the robo-adviser utilize tax loss harvesting? Tax loss harvesting involves selling investments that have experienced losses in your account, which may result in tax implications.  The value of tax loss harvesting can depend on your particular tax situation in a given year.  It also may implicate rules against wash sales.  Make sure you understand the tax implications of any sales, and consider whether you may wish to consult a tax adviser.  For more information about wash sales, read IRS Publication 550, Investment Income and Expenses (Including Capital Gains and Losses).

    What Fees and Costs Will the Robo-Adviser Charge?

    Fees and other costs can greatly impact your return on investment.  One of the main benefits of a robo-adviser can be lower fees and costs – so it is very important that you understand what you would be charged.  A robo-adviser may offer lower-cost investment advice, but if the robo-adviser utilizes investment products with high costs, your total overall costs could still be high.  It’s important to understand your total costs.

    Also, in some cases, a robo-adviser may offer services that are not significantly different from services you could obtain through a traditional investment advisory program or through investing in a product such as a target date retirement fund.  It is worth considering whether one product or service can offer what you need at a lower overall cost than another.  Here are a few questions to consider:

    • What fees would you be charged directly by the robo-adviser? Are there any other costs (e.g., brokerage fees, management fees for ETFs purchased for your account) that you would pay directly or indirectly?
    • How is the robo-adviser compensated?  Does the way it is compensated create any conflicts of interest with you, the investor?  For example, is the robo-adviser paid to offer particular products or does it offer only products with which it is affiliated (e.g., mutual funds sponsored by the robo-adviser or its affiliates)?
    • Are there penalties or fees if you want to withdraw your investment, or transfer or close your account? Liquidating an account may have tax implications for you as well.
    • Does the amount you are charged depend on how much money you invest?
    • Can the costs and fees change over time?
    • Does the robo-adviser pay a referral or marketing fee, or other incentives for finding new clients?  Robo-advisers may use different marketing techniques, such as paying money to others or providing discounted fees for making client referrals.  You should understand if a robo-adviser has that kind of feature, even if you are not paying a fee yourself.

    Licensing and Registration – How Do You Find More Information?

    Firms that provide advisory services in the U.S. are typically registered as investment advisers with either the SEC or one or more state securities authorities.  Although the services that they provide are automated, robo-advisers in the U.S. must comply with the securities laws applicable to SEC or state-registered investment advisers.  Use the SEC’s Investment Adviser Public Disclosure (IAPD) database, which is available on Investor.gov, to research the background, including registration or license status and disciplinary history, of any individual or firm recommending an investment.  In addition, a firm that provides robo-adviser services may be affiliated with a broker that can execute the robo-adviser’s recommendations by buying and selling specific securities for your account.  You can research that broker using the Investment Adviser Public Disclosure (IAPD) database as well, which is again available on Investor.gov. 

    Finally, like traditional investment advisers, robo-advisers are also required to file a Form ADV.  Robo-advisers may also offer certain information about their advisory business on their websites or in communications with clients.  Check the robo-adviser’s website regularly to see if there is any updated information.   

    Additional Information

    Investor Alert: Automated Investment Tools

    Ask a question or report a problem concerning your investments, your investment account or a financial professional.  Report possible securities fraud. 

    Visit Investor.gov, the SEC’s website for individual investors.

    Receive Investor Alerts and Bulletins from the Office of Investor Education and Advocacy (“OIEA”) by email or RSS feed.  Follow OIEA on Twitter @SEC_Investor_Ed.  Like OIEA on Facebook at facebook.com/secinvestoreducation.

    MIL OSI USA News

  • MIL-OSI USA: Investor Bulletin: Ten Things You Should Know About Investing

    Source: Securities and Exchange Commission

    The SEC’s Office of Investor Education and Advocacy is issuing this Investor Bulletin to provide investors basic information that may help them make informed financial decisions and avoid common scams.

    Whether you’re a first-time investor or have been investing for many years, there is some basic information you should know about investing.  Below is a list of ten investing-related pieces of information that may help you make sound financial decisions and avoid fraud. 

    Checking the background of an investment professional is easy and free.  Details on an investment professional’s background and qualifications are available through the SEC’s Investment Adviser Public Disclosure website and FINRA BrokerCheck.  If you have any questions on checking the background of an investment professional, call the SEC’s toll-free investor assistance line at (800) 732-0330.

    It can be costly to ignore the fees associated with buying, owning, and selling an investment product.  Expenses vary from product to product, and even small differences in these costs can translate into large differences in earnings over time.  An investment with high costs must perform better than a low-cost investment to generate the same returns for you.  In addition, some products are designed to be long-term investments.  If you need your money early, you may need to pay substantial surrender fees.

    Diversification can help reduce the overall risk of an investment portfolio.  By picking the right mix of investments, you may be able to limit your losses and reduce the fluctuations of your investment returns without sacrificing too much in potential gains.  Some investors achieve diversification through ownership of mutual funds or exchange-traded funds.

    Promises of high returns, with little or no associated risk, are classic warning signs for fraud.  Every investment carries some degree of risk and the potential for greater returns comes with greater risk.  Ignore so-called “can’t miss” investment opportunities or those promising “guaranteed returns” or, better yet, report them to the SEC.

    Any offer or sale of securities must be either registered with the SEC or exempt from registration.  Otherwise, it is illegal.  SEC registration is important because it provides investors access to key information about the company’s management, products, services, and finances.  While many companies that do not register or file reports with the SEC may be legitimate investments, you assume more risk when you invest in a company about which little or no information is publicly available.  Investors should always check whether an offering is registered with the SEC by using the SEC’s EDGAR database or contacting the SEC’s toll-free investor assistance line at (800) 732-0330.

    It can be risky to invest heavily in shares of any individual stock.  In particular, you should think twice before investing heavily in shares of your employer’s stock.  If the value of your employer’s shares declines significantly, or the company goes bankrupt, you may lose money and there’s a chance you might lose your job, too.

    Some investments provide tax advantages.  For example, employer-sponsored retirement plans and individual retirement accounts generally provide tax advantages for retirement savings, and 529 college savings plans also offer tax benefits.  Individuals who are interested in learning about the tax impact of their investment decisions should consult their tax adviser or visit the IRS website.

    Mutual funds, like other investments, are not guaranteed or insured by the FDIC or any other government agency.  This is true even if you buy a mutual fund through a bank and the fund carries the bank’s name.

    The key to avoiding investment fraud, including scams that target specific groups, is using independent information to evaluate financial opportunities. We see too many investors who might have avoided trouble and losses if they had asked questions from the start and verified the answers with sources outside of their family, community, or group.

    Examples of Common Persuasion Tactics Used In Investment Scams

    Research shows that con-artists are experts at the art of persuasion, often using a variety of influence tactics tailored to the vulnerabilities of their victims.  Common tactics include:

    • Phantom riches (dangling the prospect of wealth, enticing you with something you want but can’t have);
    • Source credibility (trying to build credibility by claiming to be with a reputable firm or to have a special credential or experience);
    • Social consensus (leading you to believe that other savvy investors have already invested);
    • Reciprocity (offering to do a small favor for you in return for a big favor); and
    • Scarcity (creating a false sense of urgency by claiming limited supply).

    Unbiased resources are available to help individuals make informed investing decisions.  Whether checking the background of an investment professional, researching an investment, or learning about new products or scams, unbiased information can be a significant advantage for investing wisely.  A good starting point for this information is the SEC’s Investor.gov website.

    RELATED INFORMATION

    We offer educational materials so that investors can develop an understanding of the securities industry and learn how to avoid costly mistakes and fraud.  Our educational materials also provide tips on how investors can invest wisely.  Investors can order our free publications by calling (800) SEC-0330, or access them on the Internet through the SEC’s Investor.gov website.  For additional educational information for investors, see the SEC’s Investor.gov website or the Office of Investor Education and Advocacy’s homepage.

    MIL OSI USA News

  • MIL-OSI Security: Federal Jury Convicts Imran Alrai in Connection with a Financial Scheme to Steal Approximately $6.7 Million From the United Way

    Source: Federal Bureau of Investigation (FBI) State Crime News

    CONCORD – After a 2-week trial, a Windham man was convicted by a federal petit jury, for wire fraud and money laundering in connection with his ownership of an information technology (IT) company that contracted with the United Way of Massachusetts Bay and Merrimack Valley (United Way) while being employed by United Way, United States Attorney Jane E. Young announces.

    Imran Alrai, 50, was convicted of 12 counts of wire fraud and 6 counts of money laundering. United States District Court Judge Joseph Laplante ordered Alrai detained pending sentencing, which is scheduled for January 17, 2025.

    “The jury’s swift verdicts in this case underscore the overwhelming evidence presented at trial of Mr. Alrai’s guilt,” said U.S. Attorney Jane E. Young. “Over the past two weeks, prosecutors skillfully untangled the web of the defendant’s deceit, highlighting for the jury how he used his position of trust to rig and maintain a major contract with United Way in favor of a company he owned and controlled. The United Way lost millions to the defendant – we hope the jury’s verdicts in this case is a step forward for their community.”

    “Imran Alrai abused his position of trust with the United Way of Massachusetts Bay and Merrimack Valley to steal millions of dollars to which he knew he wasn’t entitled, money that was intended to help the less fortunate in our area. Instead, he used it to pay off his house, and increase his personal wealth,” said Jodi Cohen, Special Agent in Charge of the FBI Boston Division. “The FBI is grateful for the jury’s swift verdict, and we will not hesitate to investigate and bring to justice anyone engaged in such egregious financial fraud.”

    Between 2012 and June 2018, Alrai, an IT professional at the United Way, obtained approximately $6.7 million in payments for IT services supposedly provided to United Way by an independent outside contractor, DigitalNet Technology Solutions, Inc. Alrai misrepresented material facts about DigitalNet and fraudulently concealed that he owned and controlled DigitalNet. In early 2013, Alrai rigged the bidding process for a major contract to provide managed IT services at the United Way so that DigitalNet was chosen. Alrai then gave fake references and false information about DigitalNet to United Way.

    For the next five years, while serving as United Way’s Vice President for IT Services, Alrai steered additional IT work to DigitalNet, so that his company soon became United Way’s second-largest outside vendor, receiving more than $1 million annually. Alrai concealed his connection with DigitalNet from his colleagues. He routinely sent emails with attached invoices from a fictitious person to himself at United Way.

    After the fraud came to light, in June 2018, officials at the United Way confronted Alrai and terminated him. Federal agents executed search and seizure warrants and seized incriminating documents and data from Alrai’s home office in Windham, as well as approximately $2.2 million in fraud proceeds in bank and investment accounts. During the scheme, Alrai wired $1.2 million in fraud proceeds to a DigitalNet bank account in Lahore, Pakistan. 

    According to expert testimony at the trial, United Way lost at least $3.5 million as a result of DigitalNet’s excessive billing, duplicate billing, and billing for services not delivered. 

    Homeland Security Investigations and the Federal Bureau of Investigation led the investigation. The Internal Revenue Service provided valuable assistance. Assistant U.S. Attorneys Charles L. Rombeau and John J. Kennedy are prosecuting the case.

    MIL Security OSI

  • MIL-OSI Security: Par Funding Principal and Former CFO Pleads Guilty to Racketeering Conspiracy

    Source: Federal Bureau of Investigation (FBI) State Crime Alerts (c)

    PHILADELPHIA – United States Attorney Jacqueline C. Romero announced that Joseph Cole Barleta (aka “Joe Cole”), 41, of Philadelphia, Pennsylvania, entered a plea of guilty today before United States District Court Judge Mark A. Kearney on one count of racketeering conspiracy, in connection with his role in the operation of a fraudulent investment vehicle known as Complete Business Solutions Group Inc. d/b/a Par Funding (“Par Funding”), which is alleged to have generated over $100 million in illegal proceeds for Barleta and its other principals, to the detriment of Par Funding’s numerous investors, many who live in the Philadelphia region.

    According to a second superseding indictment filed in February, Barleta and codefendants Joseph LaForte, James LaForte, and others, were part of an association-in-fact RICO enterprise that conspired to commit a number of predicate crimes, including crimes related to the fleecing of Par Funding’s many investors. Barleta’s admitted role in the conspiracy related to the securities and wire fraud components of the enterprise.

    Joe LaForte and James LaForte pleaded guilty last month to racketeering conspiracy, securities fraud, and related crimes.

    Joe LaForte is scheduled to be sentenced on January 13, 2025.

    James LaForte and Joseph Cole Barleta are both scheduled to be sentenced on February 20, 2025.

    Per the terms of Barleta’s plea agreement, the government is seeking a sentence of imprisonment of up to eight years, although the Court has discretion to impose a higher or lower sentence.

    This case was investigated by the FBI, IRS Criminal Investigation, the Federal Deposit Insurance Corporation Office of Inspector General, and Pennsylvania State Police and is being prosecuted by Assistant United States Attorneys Matthew T. Newcomer, Samuel S. Dalke, Eric D. Gill, and Patrick J. Murray, as well as former Assistant United States Attorney Alexandra M. Lastowski. The SEC in Florida investigated and litigated the civil securities fraud charges, which formed the basis of a portion of the criminal prosecution.

    MIL Security OSI

  • MIL-OSI Security: Virginia Man Sentenced to 66 Months in Prison for Stealing From Elderly Incapacitated Victims

    Source: Federal Bureau of Investigation (FBI) State Crime Alerts (c)

    PHILADELPHIA – United States Attorney Jacqueline C. Romero announced that Carlton Rembert, 70, of Hampton, Virginia, was sentenced on October 11, 2024, by United States District Judge Joel H. Slomsky to 66 months’ imprisonment, five years of supervised release, $534,335 in restitution to the victims, and a $400 special assessment for his role in a scheme to defraud elderly incapacitated people of over $1 million.

    Rembert’s late co-conspirator and sister, Gloria Byars, was a court-appointed guardian for over 100 incapacitated wards in Pennsylvania. Between 2012 and 2018, Byars, Rembert, and other co-conspirators stole the life savings from dozens of wards while Byars served as their court-appointed guardian. Byars pleaded guilty to conspiracy, wire fraud, money laundering, and tax fraud for her role in the fraud scheme. Rembert proceeded to trial in November 2023 and after a four-day trial, a jury found Rembert guilty of conspiracy, bank fraud, and wire fraud.

    As guardian, Byars had unfettered access to wards’ property including bank accounts, pensions, real estate, retirement accounts, and other assets. Byars stole money from the wards’ bank accounts by writing unauthorized checks to companies she controlled, or to shell companies controlled by her co-conspirators, Rembert and Alesha Mitchell. Rembert and Mitchell assisted Byars in the theft by opening bank accounts in their home state of Virginia in the names of shell companies purporting to be medical services companies. Byars made the checks payable to her co-conspirators’ fake medical services companies, to make it appear that the elderly incapacitated ward incurred a legitimate medical expense.

    After receiving dozens of checks from his sister, Rembert deposited over $695,000 in stolen ward checks into five separate shell business bank accounts he had opened. Rembert then withdrew over $388,000 in cash through 94 structured withdrawals. Rembert also obtained $217,082 in certified checks, sending the certified checks to Byars and keeping a share of the stolen ward money for himself. When confronted by law enforcement, Rembert lied to investigators, pretending that he provided services to the elderly and sick victims. Some of the victims’ families testified at Rembert’s trial, telling the court that they had never heard of Rembert’s sham medical companies, and that neither Rembert nor his companies provided any services for their loved ones.

    Rembert and Byars spent the stolen ward money on personal expenses, including vacations, clothing and other retail purchases, restaurants, vehicles, gifts, and parties. In all, Byers, Rembert, and Mitchell stole well over $1 million from at least 120 incapacitated people in the Eastern District of Pennsylvania.

    Alesha Mitchell is scheduled to be sentenced on October 24.

    “Rembert and his co-conspirators had no qualms about ripping off these incapacitated victims and living it up on their stolen money,” said U.S. Attorney Romero. “The greed and callousness here are off the charts. It’s vile that criminals target the elderly and infirm specifically to take advantage of their vulnerability. My office and our partners will continue to do all we can to hold these crooks responsible and protect our elders from such greed, fraud, and abuse.”

    “Elder fraud leaves a damaging impact on victims and our communities, and our office remains steadfast in pursuit of those who exploit this vulnerable population,” said Wayne A. Jacobs, Special Agent in Charge of FBI Philadelphia. “We encourage those who believe that they or a loved one are a victim of elder fraud to report it. Reporting elder fraud is not only a step towards justice, but it helps protect others from victimization.”

    “Carlton Rembert, together with his co-conspirator Gloria Byars, abused the trust of the most vulnerable among us – individuals who have been incapacitated by age, illness, or both. What they did was truly heinous – and truly criminal. I applaud United States Attorney Romero for prosecuting these individuals, in one of the first guardianship fraud cases to be prosecuted. Unfortunately, this type of fraud is increasing, and it is important for law enforcement to send a clear signal that it will not be tolerated,” said Delaware County District Attorney Jack Stollsteimer.

    “As a law enforcement community, it is our duty to hold individuals accountable who abuse their position of trust and steal from the people that are under their care,” said Amy MacNeely, Acting Special Agent in Charge of IRS Criminal Investigation. “We, along with our law enforcement partners and the Department of Justice, will continue to hold accountable those who exploit the most vulnerable among us.”

    The case was investigated by the FBI, the Delaware County District Attorney’s Office Criminal Investigation Division, and IRS Criminal Investigation and is being prosecuted by Assistant United States Attorneys Tiwana Wright and Samuel Dalke.

    MIL Security OSI