Embark on a transformative story-telling journey with the Animation Filmmakers Competition – “WAVES ORIGINALS: A platform where creativity meets opportunity From Vision to Reality: Students, amateurs and professionals to get a chance to showcase their projects to film and TV producers, investors, and industry leaders
Overwhelming response received with over 1,200 registrations & 400 creative submissions from more than 15 countries; Winning projects to get cash prizes of up to 5 lakhs
Advancing Talent: Over 75 storytellers shortlisted for Round 2 of AFC, set to Join WAVES 2025 with Masterclasses from Global Cinema Icons
Promoting Women in Animation: WAVES featuring talented women participants whose creative works are reshaping storytelling norms
WAVES – International Animation Filmmakers Competition (AFC) sets new benchmark in Global Animation Community Engagement
Posted On: 07 FEB 2025 7:06PM by PIB Delhi
The inaugural edition of the WAVES – International Animation Filmmakers Competition (AFC) has emerged as a groundbreaking initiative, offering a global platform for creators across animation, VFX, AR-VR, and virtual production.
Launched on September 8, 2024, as part of the World Audio Visual Entertainment Summit (WAVES), the competition has captivated participants and industry leaders alike, solidifying its reputation as a leading destination for creative storytelling and technological innovation.
The Ministry of Information & Broadcasting (I&B) has partnered with Dancing Atoms for Animation Filmmakers Competition, the flagship event of the upcoming World Audio Visual & Entertainment Summit (WAVES). This marks a historic collaboration, paving the way for a new era in India’s creative industry and heralding the beginning of Create in India Season 1.
Overwhelming participation
Since its launch, AFC has received overwhelming participation, with over 1,200 registrations and over 400 creative submissions from more than 15 countries.
Crafting Pathways for Creative Excellence and Opportunity
The true essence of this initiative is to empower participants by giving them exposure and the wings to bring their stories to life. AFC has created an ecosystem where creativity meets opportunity, enabling storytellers to craft compelling narratives and transform their visions into reality.
This is achieved through:
Online Masterclasses: Led by renowned industry experts like Pilar Alessandra, Sergio Pablos, and Saraswathi Buyyala.
In-Person and Hybrid Workshops: Conducted at premier institutions across India, covering essential skills such as creative pitching, personal development, effective networking, and understanding the evolving creative economy. In recent months, Saraswathi Buyyala, Writer, Creative Director, and Founder of Dancing Atoms, conducted storytelling sessions for students and professionals at premier institutions like IIT Hyderabad, JNAFAU Hyderabad, IIT Mumbai, IIMC Delhi, Jamia Millia Islamia Delhi, and NFDC Mumbai. These sessions covered essential skills such as creative pitching, personal development, effective networking, and understanding the evolving creative economy.
Hybrid events featured interactive workshops where participants learned how to navigate the global animation landscape, pitch their ideas confidently and explore transmedia storytelling — transforming stories into toys, games, comic books, and more. These initiatives underscore AFC’s commitment to nurturing well-rounded creators who can thrive across multiple entertainment formats.
Global Presence and Unparalleled Networking Opportunities: AFC’s active participation in prestigious events, both domestically and internationally, has further amplified its mission and provided invaluable networking opportunities for participants. . In India, AFC made its presence felt at Mela Mela in Delhi, Comic Con Hyderabad, the VFX Summit, IGDC, Cinematica, AGIF in Mumbai, and IFFI Goa.
On the global stage, AFC showcased its vision at the Writers Retreat and Producers Workshop in Spain, Lightbox Expo in Pasadena, Animation World Summit in Los Angeles, Unreal Fest 2024 in Seattle, Siggraph 2024 in Denver, the Ottawa International Film Festival 2024 in Canada, and MIPCOM & MIP.JR 2024 in Cannes. These events and roadshows led by the Ministry of Information and Broadcasting (MIB) in Los Angeles and San Francisco have positioned AFC as a pivotal initiative within the global media ecosystem.
Selection of Top Creators for WAVES Summit 2025
As the competition advances to Round 2, AFC proudly announces the selection of over 75 shortlisted candidates. These top storytellers will be further shortlisted and invited by the MIB to attend the physical WAVES Summit 2025.
All selected creators will gain access to an exclusive series of masterclasses featuring some of the world’s most renowned industry figures, including:
Peter Ramsey, Oscar-winning director
Guneet Monga, Oscar-winning producer
Shobu Yarlagadda, visionary producer of the Baahubali movies
Arnau Olle Lopez, Director of Character Animation from Skydance Animation Studios
Kris Pearn, director of acclaimed animated films
Anu Singh Chaudhary, celebrated writer and many more.
This phase aims to equip participants with invaluable insights and tools to refine and pitch their projects at the highly anticipated WAVES Summit 2025.
From IDEA to IMPACT – Bridging the Gap
Winners of the competition will present their creative concepts to top producers and leading OTT platforms in India and internationally. With the MIB team aggressively bridging the gap from IDEA to IMPACT and IDEA to INVESTMENT, AFC is creating unparalleled opportunities for creators to collaborate with global entertainment giants.
Empowering Women and Promoting Diversity
Dancing Atoms, led by Saraswathi Buyyala, has been at the forefront of promoting diversity and empowering women in the animation and AVGC sectors. Through targeted initiatives, the studio has supported women creators, providing them with platforms to showcase their talents and contribute meaningfully to the industry. The WAVES AFC competition proudly features numerous talented women participants whose creative works are reshaping storytelling norms.
Union Home Minister and Minister of Cooperation Shri Amit Shah posts on ‘X’ about a major breakthrough against drug syndicates of India, with NCB dismantling a significant drug network in Mumbai NCB Mumbai seizes 11.54 Kg of high-quality cocaine and 4.9 kg of hydroponic Ganja
Union Home Minister and Minister of Cooperation Shri Amit Shah terms it as a significant achievement, posts, “Bharat crushes drug cartel with zero tolerance”
It is a testament to the success of the top-to-bottom approach to investigation adopted to make PM Shri Narendra Modi Ji’s vision for a drug-free India a reality: Shri Amit Shah
NCB Mumbai also seizes 5.5 kg of cannabis gummies and recovers ₹ 1.6 Lakh in cash
Seizure was a direct outcome of sustained intelligence gathering and operational diligence following an earlier seizure of 200 grams of cocaine in January 2025
Preliminary investigations reveal operation being orchestrated by individuals based abroad, using sophisticated methods to smuggle narcotics
Union Home Minister Shri Amit Shah congratulates team NCB on this massive success
Posted On: 07 FEB 2025 5:59PM by PIB Delhi
Union Home Minister and Minister of Cooperation, Shri Amit Shah, has posted on X platform about a major breakthrough against drug syndicates of India, with the Narcotics Control Bureau (NCB) dismantling a significant drug network in Mumbai. He added that it is a testament to the success of the top-to-bottom approach to investigation adopted to make Prime Minister Shri Narendra Modi’s vision for a drug-free India (Nasha Mukt Bharat) a reality.
In a post on X, Union Home Minister Shri Amit Shah said, “Bharat crushes drug cartels with zero tolerance. A major breakthrough in Mumbai in seizing very high-grade cocaine, ganja, and cannabis gummies and arresting four people. It is a testament to the success of the top-to-bottom approach to investigation adopted to make PM Shri Narendra Modi Ji’s vision for a drug-free India a reality. Congratulations to team Narcotics Control Bureau on this massive success.”
Bharat crushes drug cartels with zero tolerance.
A major breakthrough in Mumbai in seizing very high-grade cocaine, ganja, and cannabis gummies and arresting four people. It is a testament to the success of the top-to-bottom approach to investigation adopted to make PM Shri…
This seizure was a result of concerted effort made by the team NCB Mumbai on the leads developed during a recent previous seizure of 200 gms Cocaine in the month of January, 2025. After working on the leads generated in this case and through technical and human intelligence, the Mumbai Zonal Unit (MZU) of NCB was finally able to reach at the source of the contraband and 11.540 kgs very high-grade Cocaine, 4.9 kgs hybrid strain Hydroponic Weed/Ganja and 200 packets (5.5 kgs) of Cannabis gummies & Rs.1,60,000/- were recovered from Navi Mumbai, Maharashtra on 31.01.2025.
In this case, the initial recovery, from an international courier agency in Mumbai, was from a parcel which was destined to Australia. NCB MZU was able to backtrack the supply to the bulk quantity, which was concealed at Navi Mumbai, Maharashtra.
Investigation conducted so far revealed that this syndicate is being operated by a group of people based abroad and some quantities of the seized contraband were sourced from USA to Mumbai and being sent to multiple receivers in India and abroad through courier/small cargo services and human carriers. The persons involved in this case are anonymous to each other, using pseudo-names for day-to-day conversations on drug dealing.
In this case, four persons have been arrested so far. Further, the investigations to identify the backward and forward linkages of the drug syndicate are underway.
Question for written answer E-000401/2025 to the Commission Rule 144 Miriam Lexmann (PPE)
Regulation (EU) 2024/573 on fluorinated greenhouse gases (F-gas Regulation) envisages a complete phaseout of F-gases in several industrial applications by 2035. As F-gases are important for numerous industries within global supply chains, this Regulation prompted concerns from several World Trade Organization (WTO) members, including the United States, Australia, Japan and Canada. These concerns highlighted the EU’s duty to avoid creating unnecessary trade barriers under the WTO’s Technical Barriers to Trade Agreement.
With the new Trump administration in the United States, the risk of protectionist policies, including retaliatory trade measures against the EU, is rising. New tariffs, for example on cars, would have a devastating impact on Europe’s automotive industry, including in Slovakia.
1.Is the Commission willing to remove full bans on F-gases for certain applications from Annex IV before these bans enter into force in the 2030s, respecting the principle of technological neutrality?
2.Regarding Article 35(5), will the Commission consider carrying out a review of F-gas restrictions earlier than 2030, maybe in 2025, in order to alleviate the concerns of WTO members?
3.Would the review consider the specific role of HFOs as an alternative to the previous generation of F-gases (HFCs), especially given their low global warming potential and the fact that no impact assessments on their full ban have previously been carried out?
A man has been arrested following a pursuit through the northern suburbs.
About 8pm on Friday 7 February, police attempted to stop a silver Holden sedan on Montague Road, Pooraka after officers noticed the number plates didn’t match the vehicle.
The driver refused to stop and immediately sped off. The Holden was last seen heading north on Bridge Road.
PolAir was up at the time and commenced tracking the vehicle as is drove through the backstreets of Salisbury East.
Police were able to spike the car’s tyres on Main North Road, but it continued driving on to Saints Road.
The tyres were successfully spiked a second time in Malinya Drive, Salisbury Park. The driver then abandoned the vehicle in Riversdale Drive, Salisbury Park and fled the scene.
He was quickly arrested after being found in a reserve adjacent to Smedley Place.
A 40-year-old man from Richmond was charged with driving dangerously to escape police pursuit, driving while disqualified and unassigned plates. He was bailed to appear in the Elizabeth Magistrates Court on 27 March.
The vehicle was impounded and towed from the scene.
Sadly, a male motorcyclist has died following a single vehicle crash near Warrane on Hobart’s eastern shore in the early hours of this morning. The crash occurred near the Warrane overpass on the Tasman Highway about 12.30am. Police had earlier attempted to intercept the motorcycle a short time earlier at the Shoreline Roundabout to Howrah. Upon police arrival, CPR was provided however sadly, the motorcyclist died at the scene. Our thoughts are with the man’s family and loved ones at this difficult time. As is normal practice in these circumstances, a Professional Standards investigation will be conducted into the incident to determine the circumstances surrounding the crash. While the investigation is in its early stages, evidence suggests that the police vehicle was not in the immediate vicinity of the motorcycle, or under lights and sirens, at the time of the crash. Police and emergency services remain on the scene, with the Tasman Highway between the Mornington Roundabout and the Rosny exit to remain closed for the next couple of hours to allow crash scene investigations to be conducted. Police are calling for witnesses to the crash to come forward. Anyone with dash cam footage or information should contact Police on 131444 or report anonymously to Crime Stoppers on 1800 333 000 or crimestopperstas.com.au A report will be prepared for the Coroner.
SEATTLE — Attorney General Nick Brown filed a multi-state federal lawsuit today to halt a presidential order that threatens to end federal funding to medical institutions providing gender-affirming care.
President Trump’s executive order – which Brown called clearly illegal and unusually cruel – also directs unconstitutional criminal enforcement against medical professionals and patients involved in such care. The lawsuit seeks to block federal agencies from acting on this order.
“This order is part of a larger political effort to strip away civil rights from entire communities. The president’s cruelty is on full display with this dehumanizing executive order, along with his disdain for the Constitution,” Brown said. “His actions are harming Washington’s youth, parents, and health care providers.”
The state is joined in the suit by the attorneys general of Minnesota and Oregon. Three individual doctors are joining as plaintiffs in the case, representing themselves as well as their minor patients for whom they care. The complaint was filed in the U.S. District Court for the Western District of Washington.
“President Trump’s attempt to withhold federal funds from states that offer health care to transgender Washingtonians is unlawful and cruel,” said Washington state Governor Bob Ferguson. “Washington is a place that supports every resident’s civil rights. My team is working closely with the Attorney General to ensure Washingtonians are protected from illegal federal actions.”
The states argue this order violates the 5th Amendment’s equal protection guarantee by singling out transgender individuals for mistreatment and discrimination. Additionally, Congress has already authorized research and education funding for medical institutions in Washington state, and the president cannot unilaterally overrule congressional intent.
The states also note the president cannot unilaterally regulate or criminalize medical practices in Washington state, which are protected by the 10th Amendment.
The executive order, issued on Jan. 28, directs agencies to cut off federal research and education grants to medical institutions, including hospitals and medical schools, that provide gender-affirming care to anyone under the age of 19. This would prevent hundreds of millions of dollars in federal grants from flowing to state medical schools and hospitals.
Providers tell the Attorney General’s Office they fear for the safety of patients and their families. One of the providers joining as a plaintiff wrote that if minors lose access to gender-affirming care, “I have no doubt that transgender adolescents will die. I am certain of it. There are going to be young people who are going to take their lives if they can no longer receive this care.”
In the motion for an emergency court order to block the executive action, Brown included examples of the harm that youth, parents, and medical providers are already enduring. A total of more than 100 witnesses provided declarations in support of the motion.
This action comes on the heels of an order by a federal court in Rhode Island that prohibits Trump from cutting off any funding to a group of 22 states, including Washington. Yet Trump continues to issue orders that cut off federal funding to a host of programs, including to institutions that provide gender affirming care.
Attorneys Cindy Alexander, Todd Bowers, May Che, Spencer Coates, Alexia Diorio, Lauryn Fraas, Teri Healy, Tera Heintz, Andrew Hughes, Neal Luna, William McGinty, Colleen Melody, Emily Nelson, Mitchell Riese, Cristina Sepe, Sarah Smith-Levy, Raina Wagner, Lucy Wolf; Paralegals Jessica Buswell, Ali Hollenbeck, Diane Hoosier, Connor Hopkins, Victoria Johnson, Tally Locke, Alicia Nicole Stensland, Christine Truong, Jennah Williams, Jamie Wuco, Logan Young; and Investigators Rebecca Pawul, Tony Perkins, Alma Poletti, Jennifer Sievert, and Jennifer Treppa assisted in bringing this case for Washington.
-30-
Washington’s Attorney General serves the people and the State of Washington. As the state’s largest law firm, the Attorney General’s Office provides legal representation to every state agency, board, and commission in Washington. Additionally, the Office serves the people directly by enforcing consumer protection, civil rights, and environmental protection laws. The Office also prosecutes elder abuse, Medicaid fraud, and handles sexually violent predator cases in 38 of Washington’s 39 counties. Visit www.atg.wa.gov to learn more.
Media Contact:
Email: press@atg.wa.gov
Phone: (360) 753-2727
General contacts: Click here
Media Resource Guide & Attorney General’s Office FAQ
Source: United Kingdom – Executive Government & Departments
Japan hosted a virtual seminar for British women entrepreneurs, investors, and business owners seeking to increase trade and investment with Japan
On 6 February 2025, with the support of the Department for Business and Trade, the Japanese Ministry of Foreign Affairs hosted a virtual seminar for UK women entrepreneurs, investors, and business owners seeking to increase trade and investment with Japan.
This continues an ongoing series of collaborative activities between the UK and Japan to uphold the commitments set out in the Women’s Economic Empowerment chapter of the UK-Japan Comprehensive Economic Partnership Agreement (CEPA). It supports the delivery of the joint commitment to enhancing women’s ability to fully access and benefit from the opportunities created by this Agreement, and to reduce the systemic barriers faced by women seeking to trade internationally.
During the seminar, participants heard from Japanese government and non-government led organisations about programmes and initiatives that support women in trade. These included the Japanese Cabinet Office, the Tokyo Metropolitan Government and the Japan External Trade Organization. They shared valuable information on the Japanese market and the support and tools available to British women entrepreneurs, business owners and investors interested in growing their businesses by expanding, exporting to and investing in the Japanese market.
The audience also heard from the British Chamber of Commerce in Japan on the support it can provide on navigating differences in business customs, as well as from two Japanese venture capital firms: ANRI, focused on seed stage investments, having a track record of supporting female-founded startups in IT and DeepTech, and NEXTBLUE, dedicated to empowering women founders in the field of women’s wellbeing. These venture capital firms offered their support for the expansion of UK female-led companies.
The audience also heard directly from two British women business owners and entrepreneurs. The CEOs of Celtic English Academy and Evolve Organic Beauty shared valuable insights on their experiences of entering and successfully trading in the education and retail markets in Japan.
Increasing women’s participation in the economy not only strengthens gender equality but also holds huge potential in boosting economic growth. Through the effective implementation of the women’s economic empowerment provisions in the UK’s trade agreement with Japan, we seek to uphold gender equality by ensuring that women business owners and entrepreneurs interested in expanding their business by entering new markets have sufficient knowledge of the opportunities and benefits on offer to them.
The UK has successfully included trade and gender equality provisions in newly negotiated Free Trade Agreements including with Japan, Australia and New Zealand, and will continue working with trading partners to explore and develop the best strategies and practices to break down barriers to trade for women, support the fair and open trade and benefit the wider UK economy.
In the lead up to the Expo 2025 Osaka, Kansai, Japan, the UK will continue a programme of engagement with Japan. Further, the UK will be showcasing its work on diversity and inclusion at the UK Pavilion, including the work we are doing on gender equality and women’s economic empowerment.
For more information on the first UK-Japan Women’s Economic Empowerment seminar, please follow this link.
For more information on the UK-Japan Comprehensive Economic Partnership, please follow this link.
On the 7th February 2025 at approximately 9:50PM, Smithton Police were tasked with a report of a vessel in danger.It was reported that there was an aluminium dinghy approximately 10 feet in length which had found itself in difficulty approximately 2-3 kilometres North of the Western Inlet near Stanley. The vessel had departed from Anthony Beach in the Circular Head area.The vessel and two males aboard found themselves in difficulty after escalating winds found the vessel and occupants unable to power its way back to shore.A local fishing vessel deployed from Stanley and went to the aid of the vessel and its two occupants. A swift recovery and rescue of the vessel was undertaken with both males returned safely to the Stanley Wharf. Neither of the males required any medical intervention.This comes as a timely reminder for any members of the public who undertake boating activities to check that the vessel and occupants have all the required safety equipment for safe boating.For further information regarding safe boating visit the Marine and Safety Tasmania website at mast.tas.gov.au for current minimum safety requirements for boaters.
January 2025 was the hottest on record – a whole 1.7°C above pre-industrial levels. If many climate-watchers expected the world to cool slightly this year thanks to the natural “La Niña” phenomena, the climate itself didn’t seem to get the memo. In fact, January 2025’s record heat highlights how human-driven ocean warming is increasingly overwhelming these natural climate patterns.
La Niña is a part of the El Niño southern oscillation, a climate fluctuation that slowly sloshes vast bodies of water and heat between different ocean basins and disrupts weather patterns around the world. El Niño was first identified and christened by Peruvian fishermen who noticed a dismal drop in their catch of sardines that coincided with much warmer than usual coastal waters.
El Niño is now well known to be part of a grander climate reorganisation that also has a reverse cool phase, La Niña. As vast swathes of the eastern Pacific cool down during La Niña, this has knock on effects for atmospheric weather patterns, shifting the most vigorous storms from the central Pacific to the west and disrupting the prevailing winds across the globe.
This atmospheric reaction also helps to amplify the sea surface temperature changes. Typically, La Niña will lower the global temperature by a couple of tenths of a degree Celsius.
In 2024 the Pacific swung from moderate El Niño conditions to a weak La Niña. However, this time around, it’s apparently not enough to stop the world warming – even temporarily. So what’s different this time?
Each La Niña cycle is unique
Scientists aren’t entirely surprised. Each El Niño and La Niña cycle is unique. Following an surprisingly lengthy “triple dip” La Niña starting in 2020, the El Niño that developed in 2023 was also unusual, struggling to stand out against globally warm seas. The switch to a weak La Niña has only slightly cooled a narrow band along the equatorial Pacific, while surrounding waters have remained unusually hot.
Recent research shows human caused warming of the ocean is accelerating – so a year on year rise in temperature is itself getting bigger – and this is dominating to an ever greater extent over El Niño and other natural oscillations in the climate. This means that even during La Niña – when equatorial eastern Pacific waters are cooler than normal – the rest of the world’s oceans have remained remarkably warm.
More carbon, less reflection
There is also a sense of inevitability as greenhouse gas levels continue to grow, even despite the demise of El Niño. During El Niño years, the land tends to absorb less carbon from the atmosphere as large continental areas, such as parts of South America, temporarily dry out causing less plant growth and more carbon-emitting plant decay.
La Niña tends to have the opposite effect. In the strong La Niña of 2011, so much extra rain fell on the normally dry lands of Australia and parts of South America and southeast Asia that sea levels dropped as the land held on to this excess moisture borrowed temporarily from the ocean. This meant more carbon was taken from the atmosphere to feed extra plant growth. But despite the switch to La Niña, the rate of rise in atmospheric carbon in 2024 and January 2025 remains above the already high levels of previous years.
To this we can also add the diminishing effects of particle pollution from industry, big ships and other sources of “aerosols”, which in some regions had added a reflective haze in the atmosphere meaning the world absorbed less sunlight. Clean air policies introduced over time have made the world less smoggy, but they also seem to have caused clouds to reflect less sunlight back to space, adding to global heating.
As industrial activity continues to spew greenhouse gases into the air, while air cleansed of particle pollution causes more sunlight to reach the ground, this growing heating effect is beginning to drown out natural fluctuations, tipping the balance toward record warmth and worsening hot, dry and wet extremes.
The long-term trend is clear
But, just as one swallow doesn’t make a summer, a single month is not reflective of the overall trajectory of climate change. Changing weather patterns from week to week can rapidly shift temperatures especially over big landmasses, which warm up and cool down more quickly than the oceans (it takes a long time to boil up water for your vegetables but not long to super heat an empty pan).
Large areas of Europe, Canada and Siberia experienced much less cold weather than is normal for January (by up to about 7°C). Parts of South America, Africa, Australia and Antarctica also experienced above average temperatures. Along with the balmy oceans, this all contributed to an unexpectedly warm start to 2025.
While this particular warm January isn’t necessarily cause for immediate alarm, it suggests natural cooling phases may become less effective at temporarily offsetting the impact of rising greenhouse gas levels on global temperatures. And to limit the scale of the inevitable, ensuing climate change, there is a clear, urgent need to rapidly and massively cut greenhouse gas emissions and to properly account for the true cost of our lifestyles on societies and the ecosystems that underpin them.
Don’t have time to read about climate change as much as you’d like?
Richard P. Allan does not work for, consult, own shares in or receive funding from any company or organisation that would benefit from this article, and has disclosed no relevant affiliations beyond their academic appointment.
Source: United States Senator for Nevada Cortez Masto
Washington, D.C. – U.S. Senator Catherine Cortez Masto (D-Nev.) joined Senator Mazie Hirono (D-Hawaii) in reintroducing the bipartisan Filipino Veterans Family Reunification Act, a bill that would speed up the visa process for the children of Filipino veterans who served in the United States military during World War II.
“The Filipino veterans who fought for our country in World War II deserve our gratitude and respect, and that should extend to their families as well,” said Senator Cortez Masto. “Our bipartisan legislation would provide certainty to the hundreds of Filipino veterans whose children have been caught up in the complicated, drawn-out process of receiving their green cards.”
During World War II, more than 260,000 Filipinos served in the United States Armed Forces. In 1990, President George H. W. Bush granted U.S. citizenship to 26,000 of those Filipino veterans, but not their children. As a result, those children have had to apply for green cards in a lengthy, delayed process that has left them in limbo for years. The Filipino Veterans Family Reunification Act would amend the Immigration and Nationality Act to exempt the sons and daughters of those Filipino veterans and allow them to receive their green cards on an expedited timeline.
Senator Cortez Masto has been a consistent advocate for the Filipino veteran community. Last year, she successfully included a provision in the National Defense Authorization Act ensuring Filipino veterans who fought alongside U.S. troops in World War II and the Vietnam War can be buried in state veterans’ cemeteries. Through her Brian Neuman Act, Senator Cortez Masto was able to remove roadblocks for disabled veterans accessing their benefits. She also helped pass the PACTAct to ensure veterans suffering from toxic exposure in the line of duty get the medical care they need and worked across the aisle to get legislation helping veterans exposed to Agent Orange and expanding benefits for women veterans signed into law.
US Drug Enforcement Administration images accompanying a warning about the emergence of nitazenes in Washington DC, June 2022USDEA
In the early hours of September 14 2021, three men parked in a quiet car park in the southern English market town of Abingdon-on-Thames. The men, returning from a night out, had pulled over to smoke heroin.
Unknown to them, the drug had been fortified with a nitazene compound called isotonitazene, a highly potent new synthetic opioid. Two of the men, Peter Haslam and Adrian Davies, overdosed and went into cardiac arrest. The third, Michael Parsons, tried to save them and himself by injecting naloxone, an opioid overdose antidote. Despite paramedics also trying to resuscitate Haslam and Davies, both died at the scene.
Their deaths were among at least 27 fatalities linked to nitazenes that year in the UK. Since then, nitazenes – otherwise known as 2-benzylbenzimidazole opioids – have become more prevalent in the UK’s illegal drug supply, leading some experts to warn that they are a major new threat because of their extreme potency.
In June 2023, the UK’s most recent outbreak of deaths linked to synthetic opioids emerged in the West Midlands when drug dealers used nitazenes to fortify low-purity heroin. By August, there were 21 nitazene-related fatalities in Birmingham alone. In some cases, dealers also added xylazine (colloquially known as “tranq”), a non-opioid sedative used by vets.
The increasing availability of these and other synthetic drugs led the UK’s National Crime Agency (NCA) to warn in August 2024 that “there has never been a more dangerous time to take drugs”. Like Haslam and Davies, many heroin users are unaware they might also be consuming nitazenes, which significantly increase the risk of overdose.
Given their potency, only a small amount of nitazene is required to produce a fatal dose. While some studies have concluded that nitazenes are even more potent than the synthetic opioid fentanyl, which causes many thousands of deaths in the US, the NCA judges it a “realistic possibility” that the potency of both substances are “broadly equivalent” – making them roughly 50 times more potent than heroin.
Illicit drug use is damaging large parts of the world socially, politically and environmentally. Patterns of supply and demand are changing rapidly. In our new longform series Addicted, leading drug experts bring you the latest insights on drug use and production as we ask: is it time to declare a planetary emergency?
Officially, more than 400 deaths plus many non-fatal overdoses were linked to nitazenes in the UK between June 2023 and January 2025. But this is likely to be an underestimate because of gaps within forensic and toxicology reporting. These figures come amid record levels of drug-related deaths in England and Wales. In 2023, there were 5,448 deaths related to drug poisoning, an 11% increase on the previous year and the highest total since records began in 1993.
This is of particular concern given that the UK has the largest heroin market in Europe, comprising around 300,000 users in England alone. While nitazene-related deaths are still relatively low (although by no means insignificant) compared with those from heroin and other opioids, these new synthetic opioids are cheap and easy to buy, and offer dealers multiple advantages over traditional plant-based drugs.
Unlike opium, nitazenes and other synthetic opioids can be produced anywhere in the world using precursor chemicals that are often uncontrolled and widely available. Producer countries including China and India have not yet banned all nitazene compounds, meaning they are sold legally – mostly online. Chemical manufacturing companies in these countries can synthesise nitazenes at scale using a comparatively easy three or four-step process.
Opioid use death rates around the world:
Estimated deaths from opioid use disorders per 100,000 people in 2021. Our World In Data, CC BY
For the past 15 years, I have researched and advised on the international narcotics industry, especially the Afghan drug trade, as an academic, UK Home Office official and consultant. I’ve observed many shifts within global drug markets, and I believe the increasing availability of synthetic drugs in the UK and Europe may represent a new chapter in illicit drug use here – with the emergence of nitazenes only adding to these concerns.
A brief history of synthetic opioids
New synthetic opioids (NSOs) are one of the fastest-growing groups of new psychoactive substances around the world. The EU Drugs Agency (EUDA) currently monitors 81 NSOs – the fourth-largest group of drugs under observation.
NSOs largely fall into two broad groups: fentanyl and its analogues, and non-fentanyl-structured compounds – these include nitazenes, among many other substances.
Many of these “new” synthetic opioids have, in fact, existed for decades. Nitazenes were first synthesised in the 1950s by the Swiss pharmaceutical company, Ciba Aktiengesellschaft, as pain-relieving analgesics, although they were never approved for medical use.
Prior to 2019, there had only been limited reports of nitazenes in the illegal drug supply – including a “brownish looking powder” found in Italy in 1966; the discovery of a lab in Germany in 1987; several nitazene-related deaths in Moscow in 1998; and a US chemist illegally producing the drug for personal use in 2003. But since nitazenes re-emerged at the end of the last decade, over 20 variants have been discovered.
Paul Janssen, the Belgian chemist who first made fentanyl. Johnson & Johnson
The most common NSO in the illegal drug market, fentanyl, was first synthesised by Belgian chemist Paul Janssen in 1960. Fentanyl, which is roughly 100 times more potent than morphine, was approved in the US in 1968 for pharmaceutical use as an analgesic.
Over the next four decades, however, illegally produced fentanyl resulted in three relatively small outbreaks of deaths in the US. A fourth, larger fentanyl outbreak in Chicago, Detroit and Philadelphia resulted in about 1,000 deaths between 2005 and 2007.
The current US fentanyl crisis started in 2013, expanding to affect much of the country. Between 2014 and 2019, Chinese companies were the main manufacturers of finished fentanyl substances in the US – to combat this, both the Obama and Trump administrations lobbied Beijing to curtail the fentanyl industry.
The Chinese government responded by controlling specific fentanyl analogues. However, every time an analogue was banned, chemists there would slightly adjust the formula to produce a new compound that mirrored the banned substance.
China finally banned all fentanyl-related substances in May 2019, prompting two significant changes in the drug’s supply: a slowdown in the development of new fentanyl analogues, and a reduction in their direct sale to the US from China. Instead, Chinese companies increasingly sent fentanyl precursors to Mexican drug cartels who would synthesise fentanyl (or counterfeit medication) in clandestine labs, before smuggling it across the US border. Consequently, Mexico is now the primary source of fentanyl in the US.
But these supply changes led to another shift in the global drugs arena, as China’s chemical and pharmaceutical businesses – keen to develop new markets – adjusted their focus to producing uncontrolled synthetic substances, including nitazenes. At the same time, they expanded their geographical focus from North America to include Europe and the UK.
The nitazene supply chain
Producing nitazenes is a relatively low-cost exercise. They are largely manufactured in laboratories – both legal and illegal – in China, before being smuggled to the UK and Europe via fast parcel and post networks.
Nitazenes’ high potency means only small quantities are required, making them easier to transport and harder for border officials to detect. Some Chinese vendors have reportedly been offering to hide nitazenes in legitimate goods such as dog food and catering supplies, to circumvent custom controls. All of this decreases the risk to sellers, and lessens the price of doing business.
In March 2024, two China-based sellers operating on the dark web were selling a kilo of nitazene for between €10,000 and €17,000 (£12,000-£20,000). During roughly the same period, a kilo of heroin at the wholesale level in the UK was selling for between £23,000 and £26,000. Once bought, nitazenes are largely used to fortify low-purity heroin, although the drug can also be made into pills.
Video by The Guardian.
Nitazenes are not limited to the dark web. They are widely and openly advertised on the internet, social media and music streaming platforms. In February 2024, one China-based e-commerce site displayed 85 advertisements for nitazenes. Such sites also sell a range of other synthetic drugs, including fentanyl analogues and precursors, xylazines, cannabinoids and methamphetamine.
This means drug dealers in the UK and across the world no longer need to have established connections to underworld figures to source illegal drugs. With a click of a mouse, they can have them delivered to their home address. In this sense, the internet has democratised the drug trade by widening access beyond “traditional” criminals.
In the UK, while the supply of nitazenes is currently assessed as “low”, a number of smaller-scale organised crime groups are importing them to fortify low-purity heroin, before largely dealing it at the “county lines” level. This involves organised crime groups moving drugs – primarily heroin and crack cocaine – across towns, cities and county borders within the UK, using mobile phones or another form of “deal line” to sell to customers.
In November 2023, Leon Brown from West Bromwich was imprisoned for seven years for dealing drugs containing nitazenes – a verdict described as “a great result in our ongoing efforts to tackle county lines drug dealing” by detective sergeant Luke Papps of the South Worcestershire county lines team.
A few larger UK criminal networks have also been involved in nitazene distribution. In October 2023, the police and Border Force conducted raids across north London, arresting 11 people. They dismantled a drug processing site and seized 150,000 tablets containing nitazene – the UK’s largest ever seizure of synthetic opioids – as well as a pill-pressing machine, a firearm, more than £60,000 in cash and £8,000 in cryptocurrency. The police suspected the group had been selling the tablets on the dark web.
Anecdotal reports suggest there have been mixed reactions to the introduction of nitazenes into the illegal drug supply. Richard, a recovering heroin user from Bristol, told Vice magazine that, given their potency, some “people are scared of [nitazenes]” while others are “actively seeking” them.
As has been the case with fentanyl in the US, users build up tolerance and therefore seek stronger doses. Manny, a heroin user from Bristol, told Vice: “I smoked [heroin cut with nitazenes] and it felt like the first time I’d ever taken drugs.”
Video by Vice.
UK-based criminals also use the dark web to export nitazenes abroad. In October 2023, the Australian Border Force identified 22 nitazene discoveries in packages shipped to the country via mail cargo from the UK. British criminals have also trafficked counterfeit medicines containing nitazenes to Ireland and Norway.
Use of nitazenes is now being detected all over the world. Within Europe, Ireland experienced several nitazene outbreaks in 2023-24 while in Estonia, nitazenes now account for a large share of overdose deaths – a trend also seen (to a lesser extent) in Latvia. Preliminary data suggests at least 150 deaths were linked to nitazenes in Europe in 2023.
Nitazenes have also been discovered in fake pain medication such as benzodiazepines, oxycodone and diazepam, which widens the number of people at risk to include those with no opioid tolerance. The death in July 2023 of Alex Harpum, a 23-year-old British student who was preparing for a career as an opera singer, was a stark reminder of the danger of buying fake medicine online that may have been contaminated with nitazenes.
The nitazene ‘boom’ and the global heroin trade
For decades, Afghanistan was the world’s largest opium producer and the source of most of Europe’s heroin. Then in April 2022, the ruling Taliban announced a comprehensive prohibition on the use, trade, transport, production, import and export of all drugs. As a result, poppy cultivation has fallen to historically low levels for a second consecutive year.
While this has not, as yet, translated into a shortage of heroin on European streets, including in the UK and Germany, some indicators suggest a slowdown in heroin supplies to the UK. In the year March 2023-24, the quantity of heroin seized in the UK fell by 54%, from 950kg to 441kg. This is the lowest quantity of heroin seized since 1989, when about 350kg was intercepted.
The NCA assesses that the Taliban ban has created market “uncertainty”. The wholesale price of heroin has increased from roughly £16,000 per kilo prior to the COVID-19 pandemic to about £26,000, while anecdotal reports suggest average heroin purity for users dropped to under 30% (often to 10-20%) in 2024, compared with around 35% in 2023 and 45% in 2022.
Video by UN Story.
Even without the Taliban’s ban, heroin is not easy to produce and supply. Cultivating opium poppy is labour-intensive, taking five or six months. The static nature of opium fields means they are visible and susceptible to eradication; poppy crops can also be negatively affected by blight or drought.
Converting opium into heroin base is also a labour-intensive process that can involve (depending on the production method) at least 17 steps. Acetic anhydride, the main chemical used to convert morphine into heroin, is relatively expensive compared with synthetic precursors. Moreover, heroin is a bulky product, which means it is harder to move in large volumes.
While the relationship between events in opiate-producer countries and the introduction of synthetic opioids to consumer markets should not be overstated, this new type of drug offers economic advantages to criminals whose “sole motivation is greed”.
For decades, Turkish, Kurdish and Pakistani criminal networks have been responsible for importing heroin into the UK. Once in the UK, both Turkish and British groups largely control its wholesale supply, with some participation of Albanian gangs.
To date, there is little evidence to suggest these groups have transitioned to supplying NSOs, including nitazenes. The shifting dynamics in the global drug supply chain, however, could upend traditional markets and the gangs who profit from them.
America’s synthetic drug crisis
The synthetic opioid fentanyl has devastated the US, having been linked to about 75,000 deaths in 2023 alone. It is the primary cause of death for Americans aged 18-49. Canada, too, has experienced a wave of deaths: between January 2016 and June 2024, there were 49,105 apparent opioid deaths there, with fentanyl implicated in a large proportion.
More than 4,300 reports of nitazenes have reached the US National Forensic Laboratory Information System since 2019. They are typically used to fortify fentanyl and other opioids, which can produce a fatal concoction.
Efforts to stem the flow of NSOs, including nitazenes, from China to the US and elsewhere will prove challenging. And even if China does implement stricter controls, other countries could step in to fill the void. According to the Commission on Combating Synthetic Opioid Trafficking:
The overall sizes of these industries, limited oversight efforts and political incentives contribute to an atmosphere of impunity among firms and individuals associated with those industries.
While US and Chinese counter-narcotics cooperation ended in 2022 amid increasing geopolitical tensions, the following November’s summit in Woodside, California, between presidents Joe Biden and Xi Jinping saw them agree to recommence collaboration.
As a result, China recently closed several chemical companies that were shipping fentanyl precursors and nitazenes to the US. These vendors used encrypted platforms and cryptocurrency to conduct the deals, and mislabelled the consignments to try to ensure the substances evaded border controls. China has also outlawed more chemicals and substances, including several nitazene variants.
But President Trump’s imposition of tariffs on imports from China – which sit alongside proposed taxes on imports from Canada and Mexico, in part for supposedly not doing enough to curb the trafficking of fentanyl and its precursors to the US – threatens this counter-narcotics cooperation.
While nitazenes are not yet widely available in the US, their presence within some fentanyl batches is complicating the US opioid crisis – and according to some experts, has the potential to further increase the already shocking number of synthetic opioid-related deaths.
The UK response to nitazenes
Successive UK governments have made tackling NSOs a high priority. Shortly after the most recent nitazene-related deaths were discovered in the UK in summer 2023, the NCA launched Project Housebuilder to lead and coordinate the law enforcement and public health response.
This was soon followed by the establishment of a government-wide Synthetic Opioids Taskforce “to improve…understanding, preparedness and mitigation against this evolving threat”. Chris Philp, then the UK’s combatting drugs minister, stated that “synthetic opioids are at the top of [this government’s] list because of the harm they cause”.
The taskforce has taken a range of measures, such as controlling more NSOs as class A drugs, conducting more intelligence operations at UK borders, widening access to naloxone, and enhancing the UK’s real-time, multi-source drug surveillance system. The government also worked with the US and Canada to learn from their experiences.
Recently, the current UK government banned a further six synthetic opioids and introduced a generic definition of nitazenes as class A drugs. And the UK’s current government, unlike its Conservative predecessor, has also indicated its willingness to consider evidence from the UK’s first drug consumption facility, which recently opened in Glasgow.
Other policy measures worthy of consideration include expanding drug checking services whereby drug users submit drugs to a lab to test what is in them, then are provided with information about the sample. These services offer vital information to the public and authorities about current drug trends.
While there is high uncertainty about what is going to happen next in the UK regarding illicit drug trends, the evolution of the US drug landscape over generations provides some important lessons.
Lessons from the US
The US fentanyl crisis shows drug markets can change quickly with long-lasting consequences. Most heroin on US streets contains – or has been replaced by – fentanyl. According to DEA seizure data, US heroin seizures declined by nearly 70% between 2019 and 2023, whereas fentanyl seizures have increased by 451%.
However, illegal drug markets evolve in different ways and at different paces. In May 1989, Douglas Hogg, a UK Home Office minister, travelled to the US and the Bahamas on a fact-finding mission about crack cocaine, a drug that was predicted to spread from the US to the UK. Upon his return, Hogg noted:
The ethnic, social and economic characters of many of our big cities are very similar to those in the US. If they have a crack problem, why should not we? … The use of crack in Great Britain is likely to develop very substantially over the next few years.
But this “crack invasion”, as some called it, did not materialise in the UK to the extent it had in the US – and the same was true about a predicted wave of methamphetamine use in the UK, which remains low compared with the US.
It is also unlikely the UK and Europe will experience a synthetic opioid crisis on the same scale as the US. The first wave of the US crisis was driven by extensive overprescription of opioids for pain relief. This increased the number of people addicted to opioids, some of whom later turned to heroin, before transitioning to fentanyl. In contrast, large-scale opioid prescriptions have not been a major issue in the UK or Europe, although there is some diversion of legal fentanyl into the illegal drug market in Europe.
Video by The Brookings Institution.
According to Alex Stevens, professor of criminology at the University of Sheffield, another factor differentiating the US and Europe is the provision of drug treatment and harm reduction programmes. Opioid users in Europe, and to a lesser extent in the UK, are much more likely to be in medication-assisted treatment than their US counterparts, thus reducing the number of people at risk. These interventions are reinforced by different socioeconomic factors in much of Europe, such as lower economic inequality, stronger social protections, and better healthcare systems.
None of this, though, means the nitazene threat in the UK and Europe should be underestimated, nor that use and supply of these drugs (and other NSOs) will not increase from its current relatively low base. As the NCA recently warned:
While a zero-tolerance approach from law enforcement, plus advice to users on the heightened dangers, may contain or slow the current uptake, we must prepare for these substances to become widely available, both unadvertised in fortified mixes and in response to user demand as a more potent high.
The future of new synthetic opioids
Predicting the future of NSO use and trafficking is a challenging task. Projections for Europe range from existing opiate stockpiles ensuring that heroin consumer markets remain serviced (assuming the Taliban ban is short-lived), to a heroin shortage which results in more drug dealers turning to NSOs to plug the shortfall, which in turn could lead to lasting changes in European drug markets (as happened in a few countries following the Taliban’s first opium ban in 2000-01).
In such a scenario, it is possible that Turkish criminal networks may exploit their links with Mexico’s Sinaloa cartel to source NSOs. Mexican criminal gangs also operate in Europe, which may increase the likelihood of them trying to open a new NSO market on the continent.
There is also evidence that some Italian criminal organisations have entered the NSO marketplace. In November 2023, Italian authorities announced the seizure of 100,000 doses of synthetic drugs, including fentanyl, as part of operation Painkiller, a joint Italian-American initiative.
Given the many advantages for criminal groups of NSOs, it seems likely they are here to stay. A key question is whether nitazenes (or other NSOs) will supplant traditional heroin as the opioid of choice, as they have done in the US, or remain at relatively low levels in Europe, co-existing with or mixed into the heroin supply.
In December 2023, Paul Griffiths, the EUDA’s scientific director, told Vice: “We’re not seeing much new initiation of heroin use in Europe. So in five to ten years … as heroin users get older and more vulnerable, we’re not going to have much of an opiate problem left.”
But he warned that if heroin use does dry up: “You might then see opioids appearing in other forms and preparations, such as pills, that could potentially become popular among younger age groups who currently do not appear attracted to injecting heroin.”
While previous NSO outbreaks in the UK were relatively short-lived and limited in scale, the most recent nitazene outbreak, which started in summer of 2023, has been more sustained, covered more parts of the UK, and involved more fatalities. The broader trend in Europe also suggests the prevalence and variations of NSOs are increasing at a faster pace than in previous years.
Notwithstanding, nitazene use and supply in the UK currently remains relatively low. In fact, the rate of nitazene-linked deaths – at least those officially reported – decreased between spring 2024 and the end of the year.
In the short term, then, it seems unlikely there will be a nitazene “explosion”. Rather, criminal groups will probably try to increasingly embed nitazenes into the UK drug market at a similar pace to the last 18 months.
However, this situation could change rapidly in future, especially if larger criminal networks involved in heroin importation switch to smuggling NSOs, and there is a genuine shortage of Afghan heroin. This problem would be compounded if drug users start seeking nitazenes, thus creating demand for them.
Either way, the UK government, along with its European partners, should continue to reinforce the whole drug system, to prepare for the worst-case scenario.
To hear about new Insights articles, join the hundreds of thousands of people who value The Conversation’s evidence-based news. Subscribe to our newsletter.
Philip A. Berry does not work for, consult, own shares in or receive funding from any company or organisation that would benefit from this article, and has disclosed no relevant affiliations beyond their academic appointment.
We are pleased to advise that the section of road on the A926 from Rattray to Alyth at Pictfield which was closed for emergency gas repairs has now reopened to traffic.
Temporary traffic signals will be in operation while SGN repair works are ongoing, so some delays should be expected.
Stagecoach East Scotland have confirmed that with the road reopening, they will resume normal operation of their bus services from 2pm today. School transport contracts will also revert to their normal arrangements.
Thank you for your patience while the repairs continue.
Source: The Conversation – Africa – By Rebecca Ackermann, Professor, Department of Archaeology and Human Evolution Research Institute, University of Cape Town
Here’s how the story of the Taung Child is usually told:
In 1924 an Australian anthropologist and anatomist, Raymond Dart, acquired a block of calcified sediment from a limestone quarry in South Africa. He painstakingly removed a fossil skull from this material.
A year later, on 7 February 1925, he published his description of what he argued was a new hominin species, Australopithecus africanus, in the journal Nature. It was nicknamed the Taung Child, a reference to the discovery site and its young age.
The international scientific community rebuffed this hypothesis. They were looking outside Africa for human origins and argued that the skull more likely belonged to a non-human primate. Dart was vindicated decades later after subsequent similar fossil discoveries elsewhere in Africa.
Dart is portrayed as prescient in most retellings. He’s hailed for elevating the importance of Africa in the narrative of human origins.
But is this a biased and simplified narrative? The discovery played out during a period marked by colonialism, racism and racial segregation and apartheid in South Africa. The history of human origins research is, therefore, intertwined with inequality, exclusion and scientifically unsound ideas.
Viewed against this backdrop, and with a contemporary lens, the figure of Dart, and palaeoanthropology on the African continent more broadly, is complex and worthy of reflection.
The South African Journal of Science has published a special issue to mark the centenary of Dart’s original paper.
A group of African researchers and international collaborators, ourselves among them, contributed papers offering perspectives on the science, history and legacy of palaeoanthropology in South Africa and beyond.
We were particularly interested in exploring how the history of the discovery of early hominins in South Africa influenced the scientific field of palaeoanthropology. Did it promote or limit scientific enquiry? In what ways? What were its cultural effects? And how do they play out now, a century later?
The papers in the special issue unpack a number of issues and highlight ongoing debates in the field of human evolution research in Africa and beyond.
Our goal is to celebrate the remarkable science that the discovery of A. africanus enabled. At the same time we are probing disciplinary legacies through a critical lens that challenges researchers to do science better.
The marginalisation and erasure of voices
Several key themes run through the contributions in the special issue.
One is the unheard voices. The colonial framework in which most palaeoanthropological research in South Africa took place excluded all but a few groups. This is particularly true for Indigenous voices. As a legacy, few African researchers in palaeoanthropology are first authors on prominent research or leading international research teams.
Too often, African palaeoanthropological heritage is the domain of international teams that conduct research on the continent with little meaningful collaboration from local African researchers. This is “helicopter science”. More diverse teams will produce better future work and those of us in the discipline must actively drive this process.
The dominance of western male viewpoints is part of the colonial framework. This theme, too, threads through most of the work in the special issue.
In a bid to redress some of the imbalances, a majority of the authors in the special issue were women, especially African women, and Black Africans more broadly. Many of the papers call for a more considered and equitable approach to the inclusion of African researchers, technicians and excavators in the future: in workshops and seminars, on professional bodies, as collaborators and knowledge creators, and in authorship practices.
Community and practice
Colonial legacies also manifest in a lack of social responsiveness – the use of professional expertise for a public purpose or benefit. This is another theme in the special edition. For example, Gaokgatlhe Mirriam Tawane, Dipuo Kgotleng and Bando Baven consider the broader effects of the Taung Child discovery on the Taung community.
A map showing where the skull was discovered.HERI, Author provided (no reuse)
Tawane is a palaeoanthropologist and grew up in the Taung municipality. She and her co-authors argue that, a century after the discovery of the fossil, there is little (if any) reason for the local community to celebrate it. They argue that more must be done not only to give back to the community, which is beset by socio-economic struggles, but also to build trust in science and between communities and scientists.
Researchers need to understand that there is value in engaging with people beyond academia. This is not merely to disseminate scientific knowledge. It can also enrich communities and co-create a scholarship that is more nuanced, ethical and relevant. Researchers must become more socially responsive and institutions must hold researchers to higher standards of practice.
Resourcing
Another theme which emerges from this special issue is the value of and the need for excellent local laboratory facilities in which to undertake research based on the fossils and depositsassociated with them.
Increased investment in local laboratory facilities and capacity development can create a shift towards local work on the content being led by Africans. It can also increase pan-African collaboration, dismantling the currently common practice of African researchers being drawn into separate international networks.
It is important for international funding bodies to increase investment within African palaeoanthropology. This will facilitate internal growth and local collaborative networks. International and South African investment is also needed to grow local research capacity. Fossil heritage is a national asset.
This is an edited version of an article in the South African Journal of Science. Yonatan Sahle (Department of Archaeology, University of Cape Town, South Africa and Department of History and Heritage Management, Arba Minch University, Ethiopia) co-authored the academic article.
– The fossil skull that rocked the world – 100 years later scientists are grappling with the Taung find’s complex colonial legacy – https://theconversation.com/the-fossil-skull-that-rocked-the-world-100-years-later-scientists-are-grappling-with-the-taung-finds-complex-colonial-legacy-248605
Royal Air Force aviators have joined counterparts from the United States, Canada and Australia on Exercise Red Flag Nellis 25-1, considered one of the world’s toughest air combat training environments, to hone their war-fighting skills.
RAF personnel, including Rivet Joint aircrew from 51 Squadron, Air Operations Controllers from 19 Squadron and 20 Squadron, along with eight Typhoons and a Voyager aircraft are participating in the exercise, running 27th January to 14th February at Nellis Air Force Base in Nevada, United States.
Exercise Red Flag was established by United States Air Force in 1975, after the Vietnam War revealed the first 10 combat missions to be the most dangerous for aircrews. The first 10 missions of a modern air campaign are recreated in Red Flag to provide an invaluable experience for all participants.
Generations of RAF aviators have attended this exercise, and it continues to evolve and reflect the threats and challenges faced on modern operations. Missions are conducted to the nearby Nevada Test and Training Range, and further to the southwest of the United States where there is integration with maritime units.
This year’s exercise involves approximately 3,000 personnel and up to 150 aircraft over 15 different locations, conducting large force employment missions in a range of scenarios.
The exercise is renowned for its use of ‘aggressor’ forces including simulated enemy fighter aircraft, ground-based radars and simulated surface-to-air missiles – and even cyber and space-based elements that simulate threats for each mission.
The Tactical Command and Control team’s role is to manage and control all of those aircraft, alongside other elements and units working in the ground, maritime, cyber and space-based domains, to accomplish the mission. The scale and complexity of Exercise Red Flag Nellis cannot be replicated elsewhere, which makes it an outstanding place to build experience and reinforce a close working relationship with the United States, Australia and Canada.
Source: The Conversation – Africa – By Rebecca Ackermann, Professor, Department of Archaeology and Human Evolution Research Institute, University of Cape Town
Here’s how the story of the Taung Child is usually told:
In 1924 an Australian anthropologist and anatomist, Raymond Dart, acquired a block of calcified sediment from a limestone quarry in South Africa. He painstakingly removed a fossil skull from this material.
A year later, on 7 February 1925, he published his description of what he argued was a new hominin species, Australopithecus africanus, in the journal Nature. It was nicknamed the Taung Child, a reference to the discovery site and its young age.
The international scientific community rebuffed this hypothesis. They were looking outside Africa for human origins and argued that the skull more likely belonged to a non-human primate. Dart was vindicated decades later after subsequent similar fossil discoveries elsewhere in Africa.
Dart is portrayed as prescient in most retellings. He’s hailed for elevating the importance of Africa in the narrative of human origins.
But is this a biased and simplified narrative? The discovery played out during a period marked by colonialism, racism and racial segregation and apartheid in South Africa. The history of human origins research is, therefore, intertwined with inequality, exclusion and scientifically unsound ideas.
Viewed against this backdrop, and with a contemporary lens, the figure of Dart, and palaeoanthropology on the African continent more broadly, is complex and worthy of reflection.
The South African Journal of Science has published a special issue to mark the centenary of Dart’s original paper.
A group of African researchers and international collaborators, ourselves among them, contributed papers offering perspectives on the science, history and legacy of palaeoanthropology in South Africa and beyond.
We were particularly interested in exploring how the history of the discovery of early hominins in South Africa influenced the scientific field of palaeoanthropology. Did it promote or limit scientific enquiry? In what ways? What were its cultural effects? And how do they play out now, a century later?
The papers in the special issue unpack a number of issues and highlight ongoing debates in the field of human evolution research in Africa and beyond.
Our goal is to celebrate the remarkable science that the discovery of A. africanus enabled. At the same time we are probing disciplinary legacies through a critical lens that challenges researchers to do science better.
The marginalisation and erasure of voices
Several key themes run through the contributions in the special issue.
One is the unheard voices. The colonial framework in which most palaeoanthropological research in South Africa took place excluded all but a few groups. This is particularly true for Indigenous voices. As a legacy, few African researchers in palaeoanthropology are first authors on prominent research or leading international research teams.
Too often, African palaeoanthropological heritage is the domain of international teams that conduct research on the continent with little meaningful collaboration from local African researchers. This is “helicopter science”. More diverse teams will produce better future work and those of us in the discipline must actively drive this process.
The dominance of western male viewpoints is part of the colonial framework. This theme, too, threads through most of the work in the special issue.
In a bid to redress some of the imbalances, a majority of the authors in the special issue were women, especially African women, and Black Africans more broadly. Many of the papers call for a more considered and equitable approach to the inclusion of African researchers, technicians and excavators in the future: in workshops and seminars, on professional bodies, as collaborators and knowledge creators, and in authorship practices.
Community and practice
Colonial legacies also manifest in a lack of social responsiveness – the use of professional expertise for a public purpose or benefit. This is another theme in the special edition. For example, Gaokgatlhe Mirriam Tawane, Dipuo Kgotleng and Bando Baven consider the broader effects of the Taung Child discovery on the Taung community.
Tawane is a palaeoanthropologist and grew up in the Taung municipality. She and her co-authors argue that, a century after the discovery of the fossil, there is little (if any) reason for the local community to celebrate it. They argue that more must be done not only to give back to the community, which is beset by socio-economic struggles, but also to build trust in science and between communities and scientists.
Researchers need to understand that there is value in engaging with people beyond academia. This is not merely to disseminate scientific knowledge. It can also enrich communities and co-create a scholarship that is more nuanced, ethical and relevant. Researchers must become more socially responsive and institutions must hold researchers to higher standards of practice.
Resourcing
Another theme which emerges from this special issue is the value of and the need for excellent local laboratory facilities in which to undertake research based on the fossils and depositsassociated with them.
Increased investment in local laboratory facilities and capacity development can create a shift towards local work on the content being led by Africans. It can also increase pan-African collaboration, dismantling the currently common practice of African researchers being drawn into separate international networks.
It is important for international funding bodies to increase investment within African palaeoanthropology. This will facilitate internal growth and local collaborative networks. International and South African investment is also needed to grow local research capacity. Fossil heritage is a national asset.
This is an edited version of an article in the South African Journal of Science. Yonatan Sahle (Department of Archaeology, University of Cape Town, South Africa and Department of History and Heritage Management, Arba Minch University, Ethiopia) co-authored the academic article.
Rebecca Ackermann receives funding from the National Science Foundation African Origins Platform (AOP240509218040) and the Wenner-Gren Foundation.
Lauren Schroeder receives funding from the Natural Sciences and Engineering Research Council of Canada (RGPIN-2020-04159)
Robyn Pickering receives funding from the NRF African Origins Platform (AOP240509218076) and the DST-NRF Centre of Excellence in Palaeosciences (COE2024-RP)
Source: United Nations Economic Commission for Europe
This session explores the global context in which policies requiring value-chain traceability and data disclosure are increasing across the globe, and it is not clear how textile brand and retailers best meet their new needs. Many garment and footwear industry actors realise these require a step-change in practices and see significant challenges ahead. In parallel, Individual sustainability goals in textile and other sectors may imply traceability fatigue for the supply chain if practices are not aligned. Interoperability of systems appears key, and achievable, for successfully meeting brand and retailer challenges.
Agenda(time indicated in CET)
12:15-12:30: Opening and Welcome
Christian Hudson, Chair of the ToS
Maria Teresa Pisani, Chief ad Interim, Trade Facilitation Section, ECTD, UNECE
12:30-13:15: Traceability needs and challenges, and way ahead on harmonizing approaches to value chain traceability in the garment and footwear sector
Matthias Altmann, UNECE-UN/CEFACT Expert
Open discussion with ToS members (tour de table)
13:15-13:30: Reflections on next steps and G7 ACT actions on traceability
Christian Hudson, Chair of the ToS
Maria Teresa Pisani, Chief ad Interim, Trade Facilitation Section, ECTD, UNECE
Harvey Mudd College’s mission is to educate STEM students – short for science, technology, engineering and math – so they have a “clear understanding of the impact of their work on society.” But the “impact” part of our mission has been the most challenging to realize.
When our college revised its “Core Curriculum” in 2020, our faculty decided we should create a new required impact course for all students.
What does the course explore?
The course is taught by a team of eight instructors who share their own disciplinary perspectives and help students critically analyze proposed interventions for increasing wildfire risks.
The course focuses on California wildfires so students can think critically about the ways STEM and social values shape each other.
For example, in 1911, U.S. Forest Service deputy F. E. Olmsted applied the Social Darwinist idea of “survival of the fittest” to forest management. Reflecting the prevailing views of his era, he believed that competition was the driving force behind biology, economics and human progress – where the strong thrive and the weak fail.
Olmsted said it was good forestry and good economics to let the forests grow unchecked. This policy would yield straight and tall “merchantable timber” suitable for sale and the needs of industry.
He also rejected “light burning,” which Native Americans had used for centuries to manage forest ecosystems and reduce the flammable undergrowth.
Climate change is arguably the most pressing concern of our time. And wildfires are particularly relevant to those of us in fire-prone areas like Southern California.
Public distrust of science is increasing. Consequently, society needs skilled STEM practitioners who can understand and communicate how scientific interventions will have different consequences and appeal to different stakeholders.
The course’s focus on writing, critical thinking and climate change science prepares students to participate in public discussions about such interventions.
By making students consider the impact of their future work, we also hope they will be proactive about the careers they want to pursue, whether it involves climate change or not.
What’s a critical lesson from the course?
Not everyone benefits in the same way from a single innovation.
For example, low-income and rural Americans are less likely to benefit from the lower operating costs and lower pollution of electric vehicles. That’s because inadequate investment in public charging infrastructure makes owning them less practical.
The course’s interdisciplinary approach helps to expose these kinds of structural inequities. We want students to get in the habit of asking questions about any technological solution.
They include questions like: Who is likely to benefit, and how? Who has historically wielded power in this situation? Whose voices are being included? What assumptions have been made? Which values are being prioritized?
The 2018 Camp Fire caused an estimated $US12.5 billion in damages. AP Photo/Noah Berger
They analyze wildfire data using the Pandas library, an open-source data manipulation library for the Python computer programming language.
They also read a Union of Concerned Scientists report examining fossil fuel companies’ culpability for increased risk of wildfires. And they analyze the environmental historian William Cronon’s classic indictment of the environmentalist movement for romanticizing an idea of a pristine “wilderness” while absolving themselves of the responsibility to protect the rest of nature – humans, cities, farms, industries.
The final assignment for the course asks students to critically analyze a proposed intervention dealing with growing California wildfire risk using the disciplinary tools they have learned.
Darryl Yong is a professor at Harvey Mudd College and co-directs Math for America Los Angeles. His work has been funded by the National Science Foundation.
Erika Dyson does not work for, consult, own shares in or receive funding from any company or organization that would benefit from this article, and has disclosed no relevant affiliations beyond their academic appointment.
The renovation and restoration of three 19th Century summerhouses in Coventry is well underway.
The Grade II listed summer houses are within the Grade II* Registered Park and Garden at Stoney Road Allotments in Cheylesmore.
The summerhouses had fallen into disrepair and are the last remaining plots of the Park Gardens, established 200 years ago.
It is one of only four remaining detached Victorian town gardens that are listed on Historic England’s Register of Parks and Gardens of Special Historic Interest.
Historic England has provided a £250k grant for the restoration of the buildings. Railway Heritage Trust has also made a contribution, while support has also been provided by Network Rail.
Cllr Naeem Akhtar, Cabinet Member with responsibility for heritage said:
“It’s wonderful to see the work that is being done and I am really looking forward to returning once the restoration is completed.
“We are really grateful to Historic England for their generous support. We also value the support of the Railway Heritage Trust and Network Rail.
“There has been a lot of interest in this project, and it highlights the value we have for a wide range of heritage buildings in the city.”
The site is still actively used as allotments and sub-tenanted by the Stoney Road Gardens Association (SRGA).
Louise Brennan, Historic England Regional Director (Midlands) said:
“It is amazing to see the original features of the gardens restored.
“The Heritage at Risk funding has meant that three of the grade II listed Summerhouses have received complete repairs to the building structures, including replacement roofs, new windows and doors, reconstruction of walls with lime mortar and original bricks, timber frame restoration, and other internal repairs.
“And it’s brilliant that it’s all been achieved using traditional methods and materials, restoring the summerhouses to their original form.”
The renovation is expected to be completed by the spring.
HOUSTON, Feb. 07, 2025 (GLOBE NEWSWIRE) — Plains All American Pipeline, L.P. (Nasdaq: PAA) and Plains GP Holdings (Nasdaq: PAGP) today reported fourth-quarter and full-year 2024 results, announced 2025 guidance and provided the following highlights:
2024 Results
Fourth-quarter and full-year 2024 Net income attributable to PAA of $36 million and $772 million, respectively, and 2024 Net cash provided by operating activities of $726 million and $2.49 billion, respectively
Delivered strong fourth-quarter and full-year 2024 Adjusted EBITDA attributable to PAA above the top-end of guidance with $729 million and $2.78 billion, respectively
Generated full-year 2024 Adjusted Free Cash Flow (excluding changes in Assets & Liabilities; including impact from legal settlements) of $1.17 billion and exited the year with leverage at 3.0x
Net income for the quarter includes the impact of a $225 million charge resulting from the write-off of a receivable for Line 901 insurance proceeds and $140 million of non-cash charges related to the write-down of two U.S. NGL terminals
Efficient Growth Initiatives
Closed all three previously announced bolt-on acquisitions for approximately $670 million net to PAA, including the acquisition of Ironwood Midstream Energy
Closed on previously announced purchase of approximately 12.7 million units, or 18%, of its Series A Preferred Units for a purchase price of approximately $330 million
Continue pursuing a long runway of synergistic and strong return bolt-on opportunities across the asset footprint
2025 Outlook
Expect full-year 2025 Adjusted EBITDA attributable to PAA of $2.80 – $2.95 billion
Announced distribution increase of $0.25 per unit payable February 14, 2025, representing a 20% aggregate increase in the annualized distribution versus 2024 levels (new annual distribution of $1.52 per unit)
In January, successfully raised $1 billion in aggregate senior unsecured notes at 5.95% due 2035
Anticipate leverage ratio to be at or below the low-end of leverage target range of 3.25x to 3.75x, continuing to provide significant balance sheet optionality and flexibility
Expect to generate approximately $1.15 billion of Adjusted Free Cash Flow (excluding changes in Assets & Liabilities), which is reduced by approximately $580 million for previously announced bolt-on transactions closed in the first quarter
Remain focused on disciplined capital investments, anticipating full-year 2025 Growth Capital of +/- $400 million and Maintenance Capital of +/- $240 million net to PAA
“We continue delivering strong financial and operating results and increasing return of capital to unitholders. As evidenced by our recently announced acquisitions, we have the ability to leverage our integrated asset base and financial strength to drive accretive transactions and deliver value to our customers and unitholders,” said Plains Chairman and CEO Willie Chiang. “We remain confident entering 2025, with strong operational momentum and focus on executing our efficient growth strategy. Our strong performance and positive outlook combined with the contribution from recent bolt-on acquisitions continues driving meaningful cash flow and underpins increasing returns to unitholders all while maintaining capital discipline and financial flexibility.”
Plains All American Pipeline
Summary Financial Information (unaudited) (in millions, except per unit data)
Three Months Ended December 31,
%
Twelve Months Ended December 31,
%
GAAP Results
2024
2023
Change
2024
2023
Change
Net income attributable to PAA
$
36
$
312
(88
)%
$
772
$
1,230
(37
)%
Diluted net income/(loss) per common unit
$
(0.04
)
$
0.35
(111
)%
$
0.73
$
1.40
(48
)%
Diluted weighted average common units outstanding
704
701
—
%
702
699
—
%
Net cash provided by operating activities
$
726
$
1,011
(28
)%
$
2,490
$
2,727
(9
)%
Distribution per common unit declared for the period
$
0.3800
$
0.3175
20
%
$
1.3325
$
1.1200
19
%
Three Months Ended December 31,
%
Twelve Months Ended December 31,
%
Non-GAAP Results(1)
2024
2023
Change
2024
2023
Change
Adjusted net income attributable to PAA
$
357
$
355
1
%
$
1,318
$
1,250
5
%
Diluted adjusted net income per common unit
$
0.42
$
0.42
—
%
$
1.51
$
1.42
6
%
Adjusted EBITDA
$
867
$
875
(1
)%
$
3,326
$
3,167
5
%
Adjusted EBITDA attributable to PAA (2)
$
729
$
737
(1
)%
$
2,779
$
2,711
3
%
Implied DCF per common unit and common unit equivalent
Adjusted Free Cash Flow after Distributions (Excluding Changes in Assets & Liabilities) (3)
$
(152
)
$
150
**
$
28
$
615
(95
)%
**
Indicates that variance as a percentage is not meaningful.
(1)
See the section of this release entitled “Non-GAAP Financial Measures and Selected Items Impacting Comparability” and the tables attached hereto for information regarding our Non-GAAP financial measures, including their reconciliation to the most directly comparable measures as reported in accordance with GAAP, and certain selected items that PAA believes impact comparability of financial results between reporting periods.
(2)
Excludes amounts attributable to noncontrolling interests in the Plains Oryx Permian Basin LLC joint venture, Cactus II Pipeline LLC and Red River Pipeline LLC.
(3)
Fourth-quarter and full-year 2024 Adjusted Free Cash Flow (Excluding Changes in Assets & Liabilities) includes the negative impact of a $225 million charge resulting from the write-off of a receivable for Line 901 insurance proceeds.
Summary of Selected Financial Data by Segment (unaudited) (in millions)
Segment Adjusted EBITDA
Crude Oil
NGL
Three Months Ended December 31, 2024
$
569
$
154
Three Months Ended December 31, 2023
$
563
$
169
Percentage change in Segment Adjusted EBITDA versus 2023 period
1
%
(9
)%
Segment Adjusted EBITDA
Crude Oil
NGL
Twelve Months Ended December 31, 2024
$
2,276
$
480
Twelve Months Ended December 31, 2023
$
2,163
$
522
Percentage change in Segment Adjusted EBITDA versus 2023 period
5
%
(8
)%
Fourth-quarter 2024 Crude Oil Segment Adjusted EBITDA increased 1% versus comparable 2023 results primarily due to higher tariff volumes on our pipelines, tariff escalations and contributions from acquisitions. These items were partially offset by fewer market-based opportunities, as well as an increase in estimated costs for long-term environmental remediation obligations.
Fourth-quarter 2024 NGL Segment Adjusted EBITDA decreased 9% versus comparable 2023 results primarily due to lower weighted average frac spreads in the fourth quarter of 2024.
Plains GP Holdings
PAGP owns an indirect non-economic controlling interest in PAA’s general partner and an indirect limited partner interest in PAA. As the control entity of PAA, PAGP consolidates PAA’s results into its financial statements, which is reflected in the condensed consolidating balance sheet and income statement tables attached hereto.
Conference Call and Webcast Instructions
PAA and PAGP will hold a joint conference call at 9:00 a.m. CT on Friday, February 7, 2025 to discuss fourth-quarter performance and related items.
To access the internet webcast, please go to https://edge.media-server.com/mmc/p/xp2zqt6q/.
Alternatively, the webcast can be accessed on our website at https://ir.plains.com/news-events/events-presentations. Following the live webcast, an audio replay will be available on our website and will be accessible for a period of 365 days. Slides will be posted prior to the call at the above referenced website.
Non-GAAP Financial Measures and Selected Items Impacting Comparability
To supplement our financial information presented in accordance with GAAP, management uses additional measures known as “non-GAAP financial measures” in its evaluation of past performance and prospects for the future and to assess the amount of cash that is available for distributions, debt repayments, common equity repurchases and other general partnership purposes. The primary additional measures used by management are Adjusted EBITDA, Adjusted EBITDA attributable to PAA, Implied Distributable Cash Flow (“DCF”), Adjusted Free Cash Flow and Adjusted Free Cash Flow after Distributions.
Our definition and calculation of certain non-GAAP financial measures may not be comparable to similarly-titled measures of other companies. Adjusted EBITDA, Adjusted EBITDA attributable to PAA, Implied DCF and certain other non-GAAP financial performance measures are reconciled to Net Income, and Adjusted Free Cash Flow, Adjusted Free Cash Flow after Distributions and certain other non-GAAP financial liquidity measures are reconciled to Net Cash Provided by Operating Activities (the most directly comparable measures as reported in accordance with GAAP) for the historical periods presented in the tables attached to this release, and should be viewed in addition to, and not in lieu of, our Consolidated Financial Statements and accompanying notes. In addition, we encourage you to visit our website at www.plains.com (in particular the section under “Financial Information” entitled “Non-GAAP Reconciliations” within the Investor Relations tab), which presents a reconciliation of our commonly used non-GAAP and supplemental financial measures. We do not reconcile non-GAAP financial measures on a forward-looking basis as it is impractical to do so without unreasonable effort.
Non-GAAP Financial Performance Measures
Adjusted EBITDA is defined as earnings before (i) interest expense, (ii) income tax (expense)/benefit, (iii) depreciation and amortization (including our proportionate share of depreciation and amortization, including write-downs related to cancelled projects and impairments, of unconsolidated entities), (iv) gains and losses on asset sales, asset impairments and other, net, (v) gains and losses on investments in unconsolidated entities and (vi) interest income on promissory notes by and among PAA and certain Plains entities, and (vii) adjusted for certain selected items impacting comparability. Adjusted EBITDA attributable to PAA excludes the portion of Adjusted EBITDA that is attributable to noncontrolling interests.
Management believes that the presentation of Adjusted EBITDA, Adjusted EBITDA attributable to PAA and Implied DCF provides useful information to investors regarding our performance and results of operations because these measures, when used to supplement related GAAP financial measures, (i) provide additional information about our core operating performance and ability to fund distributions to our unitholders through cash generated by our operations and (ii) provide investors with the same financial analytical framework upon which management bases financial, operational, compensation and planning/budgeting decisions. We also present these and additional non-GAAP financial measures, including adjusted net income attributable to PAA and basic and diluted adjusted net income per common unit, as they are measures that investors, rating agencies and debt holders have indicated are useful in assessing us and our results of operations. These non-GAAP financial performance measures may exclude, for example, (i) charges for obligations that are expected to be settled with the issuance of equity instruments, (ii) gains and losses on derivative instruments that are related to underlying activities in another period (or the reversal of such adjustments from a prior period), gains and losses on derivatives that are either related to investing activities (such as the purchase of linefill) or purchases of long-term inventory, and inventory valuation adjustments, as applicable, (iii) long-term inventory costing adjustments, (iv) items that are not indicative of our core operating results and/or (v) other items that we believe should be excluded in understanding our core operating performance. These measures may be further adjusted to include amounts related to deficiencies associated with minimum volume commitments whereby we have billed the counterparties for their deficiency obligation and such amounts are recognized as deferred revenue in “Other current liabilities” in our Consolidated Financial Statements. We also adjust for amounts billed by our equity method investees related to deficiencies under minimum volume commitments. Such amounts are presented net of applicable amounts subsequently recognized into revenue. Furthermore, the calculation of these measures contemplates tax effects as a separate reconciling item, where applicable. We have defined all such items as “selected items impacting comparability.” Due to the nature of the selected items, certain selected items impacting comparability may impact certain non-GAAP financial measures, referred to as adjusted results, but not impact other non-GAAP financial measures. We do not necessarily consider all of our selected items impacting comparability to be non-recurring, infrequent or unusual, but we believe that an understanding of these selected items impacting comparability is material to the evaluation of our operating results and prospects.
Although we present selected items impacting comparability that management considers in evaluating our performance, you should also be aware that the items presented do not represent all items that affect comparability between the periods presented. Variations in our operating results are also caused by changes in volumes, prices, exchange rates, mechanical interruptions, acquisitions, divestitures, investment capital projects and numerous other factors. These types of variations may not be separately identified in this release, but will be discussed, as applicable, in management’s discussion and analysis of operating results in our Annual Report on Form 10-K.
Non-GAAP Financial Liquidity Measures
Management uses the non-GAAP financial liquidity measures Adjusted Free Cash Flow and Adjusted Free Cash Flow after Distributions to assess the amount of cash that is available for distributions, debt repayments, common equity repurchases and other general partnership purposes. Adjusted Free Cash Flow is defined as Net Cash Provided by Operating Activities, less Net Cash Provided by/(Used in) Investing Activities, which primarily includes acquisition, investment and maintenance capital expenditures, investments in unconsolidated entities and the impact from the purchase and sale of linefill, net of proceeds from the sales of assets and further impacted by distributions to and contributions from noncontrolling interests and proceeds from the issuance of related party notes. Adjusted Free Cash Flow is further reduced by cash distributions paid to our preferred and common unitholders to arrive at Adjusted Free Cash Flow after Distributions.
We also present these measures and additional non-GAAP financial liquidity measures as they are measures that investors have indicated are useful. We present the Adjusted Free Cash Flow (Excluding Changes in Assets & Liabilities) for use in assessing our underlying business liquidity and cash flow generating capacity excluding fluctuations caused by timing of when amounts earned or incurred were collected, received or paid from period to period. Adjusted Free Cash Flow (Excluding Changes in Assets & Liabilities) is defined as Adjusted Free Cash Flow excluding the impact of “Changes in assets and liabilities, net of acquisitions” on our Condensed Consolidated Statements of Cash Flows. Adjusted Free Cash Flow (Excluding Changes in Assets & Liabilities) is further reduced by cash distributions paid to our preferred and common unitholders to arrive at Adjusted Free Cash Flow after Distributions (Excluding Changes in Assets & Liabilities).
PLAINS ALL AMERICAN PIPELINE, L.P. AND SUBSIDIARIES FINANCIAL SUMMARY (unaudited)
CONDENSED CONSOLIDATED STATEMENTS OF OPERATIONS (in millions, except per unit data)
Three Months Ended December 31,
Twelve Months Ended December 31,
2024
2023
2024
2023
REVENUES
$
12,402
$
12,698
$
50,073
$
48,712
COSTS AND EXPENSES
Purchases and related costs
11,227
11,558
45,560
44,531
Field operating costs (1)
578
363
1,768
1,425
General and administrative expenses
93
87
381
350
Depreciation and amortization
258
273
1,026
1,048
(Gains)/losses on asset sales, asset impairments and other, net
159
(9
)
160
(152
)
Total costs and expenses
12,315
12,272
48,895
47,202
OPERATING INCOME
87
426
1,178
1,510
OTHER INCOME/(EXPENSE)
Equity earnings in unconsolidated entities
154
92
452
369
Gain on investments in unconsolidated entities, net
15
—
15
28
Interest expense, net (2)
(112
)
(97
)
(430
)
(386
)
Other income, net (2)
20
17
65
102
INCOME BEFORE TAX
164
438
1,280
1,623
Current income tax expense (3)
(52
)
(41
)
(195
)
(145
)
Deferred income tax benefit
7
2
28
24
NET INCOME
119
399
1,113
1,502
Net income attributable to noncontrolling interests
(83
)
(87
)
(341
)
(272
)
NET INCOME ATTRIBUTABLE TO PAA
$
36
$
312
$
772
$
1,230
NET INCOME/(LOSS) PER COMMON UNIT:
Net income/(loss) allocated to common unitholders — Basic and Diluted
$
(27
)
$
248
$
514
$
976
Basic and diluted weighted average common units outstanding
704
701
702
699
Basic and diluted net income/(loss) per common unit
$
(0.04
)
$
0.35
$
0.73
$
1.40
(1)
Field operating costs include $225 million and $345 million for the three and twelve months ended December 31, 2024, respectively, resulting from adjustments related to the Line 901 incident that occurred in May 2015, including the write-off of a receivable for Line 901 insurance proceeds in the fourth quarter of 2024 and settlements in the third quarter of 2024.
(2)
PAA and certain Plains entities have issued promissory notes by and among such entities to facilitate financing. “Interest expense, net” and “Other income, net” each include $17 million and $48 million for the three and twelve months ended December 31, 2024, respectively, related to interest on such notes. These amounts offset and do not impact Net Income or Non-GAAP metrics such as Adjusted EBITDA, Implied DCF and Adjusted Free Cash Flow.
(3)
The increase in current income tax expense for the 2024 periods was largely associated with Canadian withholding tax on dividends from our Canadian entities to other Plains entities driven by timing of dividend payments.
PLAINS ALL AMERICAN PIPELINE, L.P. AND SUBSIDIARIES FINANCIAL SUMMARY (unaudited)
CONDENSED CONSOLIDATED BALANCE SHEET DATA (in millions)
December 31, 2024
December 31, 2023
ASSETS
Current assets (including Cash and cash equivalents of $348 and $450, respectively)
$
4,802
$
4,913
Property and equipment, net
15,424
15,782
Investments in unconsolidated entities
2,811
2,820
Intangible assets, net
1,677
1,875
Linefill
968
976
Long-term operating lease right-of-use assets, net
332
313
Long-term inventory
280
265
Other long-term assets, net
268
411
Total assets
$
26,562
$
27,355
LIABILITIES AND PARTNERS’ CAPITAL
Current liabilities
$
4,950
$
5,003
Senior notes, net
7,141
7,242
Other long-term debt, net
72
63
Long-term operating lease liabilities
313
274
Other long-term liabilities and deferred credits
990
1,041
Total liabilities
13,466
13,623
Partners’ capital excluding noncontrolling interests
9,813
10,422
Noncontrolling interests
3,283
3,310
Total partners’ capital
13,096
13,732
Total liabilities and partners’ capital
$
26,562
$
27,355
DEBT CAPITALIZATION RATIOS (in millions)
December 31, 2024
December 31, 2023
Short-term debt
$
408
$
446
Long-term debt
7,213
7,305
Total debt
$
7,621
$
7,751
Long-term debt
$
7,213
$
7,305
Partners’ capital excluding noncontrolling interests
9,813
10,422
Total book capitalization excluding noncontrolling interests (“Total book capitalization”)
$
17,026
$
17,727
Total book capitalization, including short-term debt
$
17,434
$
18,173
Long-term debt-to-total book capitalization
42
%
41
%
Total debt-to-total book capitalization, including short-term debt
44
%
43
%
PLAINS ALL AMERICAN PIPELINE, L.P. AND SUBSIDIARIES FINANCIAL SUMMARY (unaudited)
COMPUTATION OF BASIC AND DILUTED NET INCOME/(LOSS) PER COMMON UNIT(1) (in millions, except per unit data)
Three Months Ended December 31,
Twelve Months Ended December 31,
2024
2023
2024
2023
Basic and Diluted Net Income/(Loss) per Common Unit
Net income attributable to PAA
$
36
$
312
$
772
$
1,230
Distributions to Series A preferred unitholders
(44
)
(44
)
(175
)
(173
)
Distributions to Series B preferred unitholders
(19
)
(20
)
(78
)
(76
)
Amounts allocated to participating securities
(1
)
(1
)
(10
)
(10
)
Other
1
1
5
5
Net income/(loss) allocated to common unitholders
$
(27
)
$
248
$
514
$
976
Basic and diluted weighted average common units outstanding (2) (3)
704
701
702
699
Basic and diluted net income/(loss) per common unit
$
(0.04
)
$
0.35
$
0.73
$
1.40
(1)
We calculate net income/(loss) allocated to common unitholders based on the distributions pertaining to the current period’s net income. After adjusting for the appropriate period’s distributions, the remaining undistributed earnings or excess distributions over earnings, if any, are allocated to common unitholders and participating securities in accordance with the contractual terms of our partnership agreement in effect for the period and as further prescribed under the two-class method.
(2)
The possible conversion of our Series A preferred units was excluded from the calculation of diluted net income/(loss) per common unit for each of the three and twelve months ended December 31, 2024 and 2023 as the effect was antidilutive.
(3)
Our equity-indexed compensation plan awards that contemplate the issuance of common units are considered potentially dilutive unless (i) they become vested only upon the satisfaction of a performance condition and (ii) that performance condition has yet to be satisfied. Equity-indexed compensation plan awards that are deemed to be dilutive are reduced by a hypothetical common unit repurchase based on the remaining unamortized fair value, as prescribed by the treasury stock method in guidance issued by the FASB.
PLAINS ALL AMERICAN PIPELINE, L.P. AND SUBSIDIARIES FINANCIAL SUMMARY (unaudited)
CONDENSED CONSOLIDATED CASH FLOW DATA (in millions)
Twelve Months Ended December 31, 2024
2024
2023
CASH FLOWS FROM OPERATING ACTIVITIES
Net income
$
1,113
$
1,502
Reconciliation of net income to net cash provided by operating activities:
Depreciation and amortization
1,026
1,048
(Gains)/losses on asset sales, asset impairments and other, net
160
(152
)
Deferred income tax benefit
(28
)
(24
)
Change in fair value of Preferred Distribution Rate Reset Option
—
(58
)
Equity earnings in unconsolidated entities
(452
)
(369
)
Distributions on earnings from unconsolidated entities
505
458
Gain on investments in unconsolidated entities, net
(15
)
(28
)
Other
107
156
Changes in assets and liabilities, net of acquisitions
74
194
Net cash provided by operating activities
2,490
2,727
CASH FLOWS FROM INVESTING ACTIVITIES
Net cash used in investing activities (1)
(1,504
)
(702
)
CASH FLOWS FROM FINANCING ACTIVITIES
Net cash used in financing activities (1)
(1,077
)
(1,976
)
Effect of translation adjustment
(11
)
—
Net increase/(decrease) in cash and cash equivalents and restricted cash
(102
)
49
Cash and cash equivalents and restricted cash, beginning of period
450
401
Cash and cash equivalents and restricted cash, end of period
$
348
$
450
(1)
PAA and certain Plains entities have issued promissory notes by and among such entities to facilitate financing. For the twelve months ended December 31, 2024, “Net cash used in investing activities” includes a cash outflow of $629 million associated with our investment in related party notes. An equal and offsetting cash inflow associated with our issuance of related party notes is included in “Net cash used in financing activities.”
CAPITAL EXPENDITURES (in millions)
Net to PAA(1)
Consolidated
Three Months Ended December 31,
Twelve Months Ended December 31,
Three Months Ended December 31,
Twelve Months Ended December 31,
2024
2023
2024
2023
2024
2023
2024
2023
Investment capital expenditures:
Crude Oil
$
55
$
75
$
214
$
245
$
80
$
100
$
300
$
334
NGL
41
14
115
65
41
14
115
65
Total Investment capital expenditures
96
89
329
310
121
114
415
399
Maintenance capital expenditures
68
58
242
214
73
63
261
231
$
164
$
147
$
571
$
524
$
194
$
177
$
676
$
630
(1)
Excludes expenditures attributable to noncontrolling interests.
PLAINS ALL AMERICAN PIPELINE, L.P. AND SUBSIDIARIES FINANCIAL SUMMARY (unaudited)
NON-GAAP RECONCILIATIONS (in millions, except per unit and ratio data)
Computation of Basic and Diluted Adjusted Net Income Per Common Unit(1):
Three Months Ended December 31,
Twelve Months Ended December 31,
2024
2023
2024
2023
Basic and Diluted Adjusted Net Income per Common Unit
Net income attributable to PAA
$
36
$
312
$
772
$
1,230
Selected items impacting comparability – Adjusted net income attributable to PAA (2)
321
43
546
20
Adjusted net income attributable to PAA
$
357
$
355
$
1,318
$
1,250
Distributions to Series A preferred unitholders
(44
)
(44
)
(175
)
(173
)
Distributions to Series B preferred unitholders
(19
)
(20
)
(78
)
(76
)
Amounts allocated to participating securities
(1
)
(1
)
(11
)
(10
)
Other
1
1
5
5
Adjusted net income allocated to common unitholders
$
294
$
291
$
1,059
$
996
Basic and diluted weighted average common units outstanding (3) (4)
704
701
702
699
Basic and diluted adjusted net income per common unit
$
0.42
$
0.42
$
1.51
$
1.42
(1)
We calculate adjusted net income allocated to common unitholders based on the distributions pertaining to the current period’s net income. After adjusting for the appropriate period’s distributions, the remaining undistributed earnings or excess distributions over earnings, if any, are allocated to the common unitholders and participating securities in accordance with the contractual terms of our partnership agreement in effect for the period and as further prescribed under the two-class method.
(2)
See the “Selected Items Impacting Comparability” table for additional information.
(3)
The possible conversion of our Series A preferred units was excluded from the calculation of diluted adjusted net income per common unit for each of the three and twelve months ended December 31, 2024 and 2023 as the effect was antidilutive.
(4)
Our equity-indexed compensation plan awards that contemplate the issuance of common units are considered potentially dilutive unless (i) they become vested only upon the satisfaction of a performance condition and (ii) that performance condition has yet to be satisfied. Equity-indexed compensation plan awards that are deemed to be dilutive are reduced by a hypothetical common unit repurchase based on the remaining unamortized fair value, as prescribed by the treasury stock method in guidance issued by the FASB.
Net Income/(Loss) Per Common Unit to Adjusted Net Income Per Common Unit Reconciliation:
Three Months Ended December 31,
Twelve Months Ended December 31,
2024
2023
2024
2023
Basic and diluted net income/(loss) per common unit
$
(0.04
)
$
0.35
$
0.73
$
1.40
Selected items impacting comparability per common unit (1)
0.46
0.07
0.78
0.02
Basic and diluted adjusted net income per common unit
$
0.42
$
0.42
$
1.51
$
1.42
(1)
See the “Selected Items Impacting Comparability” and the “Computation of Basic and Diluted Adjusted Net Income/(Loss) Per Common Unit” tables for additional information.
PLAINS ALL AMERICAN PIPELINE, L.P. AND SUBSIDIARIES FINANCIAL SUMMARY (unaudited)
Net Income to Adjusted EBITDA attributable to PAA and Implied DCF Reconciliation:
Three Months Ended December 31,
Twelve Months Ended December 31,
2024
2023
2024
2023
Net Income
$
119
$
399
$
1,113
$
1,502
Interest expense, net of certain items (1)
95
97
382
386
Income tax expense
45
39
167
121
Depreciation and amortization
258
273
1,026
1,048
(Gains)/losses on asset sales, asset impairments and other, net
159
(9
)
160
(152
)
Gain on investments in unconsolidated entities, net
(15
)
—
(15
)
(28
)
Depreciation and amortization of unconsolidated entities (2)
Adjusted EBITDA attributable to noncontrolling interests
(138
)
(138
)
(547
)
(456
)
Adjusted EBITDA attributable to PAA
$
729
$
737
$
2,779
$
2,711
Adjusted EBITDA
$
867
$
875
$
3,326
$
3,167
Interest expense, net of certain non-cash items (4)
(92
)
(92
)
(365
)
(367
)
Maintenance capital
(73
)
(63
)
(261
)
(231
)
Investment capital of noncontrolling interests (5)
(24
)
(24
)
(86
)
(87
)
Current income tax expense
(52
)
(41
)
(195
)
(145
)
Distributions from unconsolidated entities in excess of/(less than) adjusted equity earnings (6)
—
(15
)
11
(37
)
Distributions to noncontrolling interests (7)
(114
)
(97
)
(425
)
(333
)
Implied DCF
$
512
$
543
$
2,005
$
1,967
Preferred unit cash distributions paid (7)
(63
)
(64
)
(254
)
(241
)
Implied DCF Available to Common Unitholders
$
449
$
479
$
1,751
$
1,726
Weighted Average Common Units Outstanding
704
701
702
699
Weighted Average Common Units and Common Unit Equivalents
775
772
773
770
Implied DCF per Common Unit (8)
$
0.64
$
0.68
$
2.49
$
2.47
Implied DCF per Common Unit and Common Unit Equivalent (9)
$
0.64
$
0.68
$
2.49
$
2.46
Cash Distribution Paid per Common Unit
$
0.3175
$
0.2675
$
1.2700
$
1.0700
Common Unit Cash Distributions (7)
$
223
$
188
$
891
$
748
Common Unit Distribution Coverage Ratio
2.01x
2.55x
1.97x
2.31x
Implied DCF Excess
$
226
$
291
$
860
$
978
(1)
Represents “Interest expense, net” as reported on our Condensed Consolidated Statements of Operations, net of interest income associated with promissory notes by and among PAA and certain Plains entities.
(2)
Adjustment to exclude our proportionate share of depreciation and amortization expense (including write-downs related to cancelled projects and impairments) of unconsolidated entities.
(3)
See the “Selected Items Impacting Comparability” table for additional information.
(4)
Amount excludes certain non-cash items impacting interest expense such as amortization of debt issuance costs and terminated interest rate swaps.
(5)
Investment capital expenditures attributable to noncontrolling interests that reduce Implied DCF available to PAA common unitholders.
(6)
Comprised of cash distributions received from unconsolidated entities less equity earnings in unconsolidated entities (adjusted for our proportionate share of depreciation and amortization, including write-downs related to cancelled projects and impairments, and selected items impacting comparability of unconsolidated entities).
(7)
Cash distributions paid during the period presented.
(8)
Implied DCF Available to Common Unitholders for the period divided by the weighted average common units outstanding for the period.
(9)
Implied DCF Available to Common Unitholders for the period, adjusted for Series A preferred unit cash distributions paid, divided by the weighted average common units and common unit equivalents outstanding for the period. Our Series A preferred units are convertible into common units, generally on a one-for-one basis and subject to customary anti-dilution adjustments, in whole or in part, subject to certain minimum conversion amounts.
PLAINS ALL AMERICAN PIPELINE, L.P. AND SUBSIDIARIES FINANCIAL SUMMARY (unaudited)
Net Income Per Common Unit to Implied DCF Per Common Unit and Common Unit Equivalent Reconciliation:
Three Months Ended December 31,
Twelve Months Ended December 31,
2024
2023
2024
2023
Basic net income/(loss) per common unit
$
(0.04
)
$
0.35
$
0.73
$
1.40
Reconciling items per common unit (1) (2)
0.68
0.33
1.76
1.07
Implied DCF per common unit
$
0.64
$
0.68
$
2.49
$
2.47
Basic net income/(loss) per common unit
$
(0.04
)
$
0.35
$
0.73
$
1.40
Reconciling items per common unit and common unit equivalent (1) (3)
0.68
0.33
1.76
1.06
Implied DCF per common unit and common unit equivalent
$
0.64
$
0.68
$
2.49
$
2.46
(1)
Represents adjustments to Net Income to calculate Implied DCF Available to Common Unitholders. See the “Net Income to Adjusted EBITDA attributable to PAA and Implied DCF Reconciliation” table for additional information.
(2)
Based on weighted average common units outstanding for the period of 704 million, 701 million, 702 million and 699 million, respectively.
(3)
Based on weighted average common units outstanding for the period, as well as weighted average Series A preferred units outstanding of 71 million for each of the periods presented.
PLAINS ALL AMERICAN PIPELINE, L.P. AND SUBSIDIARIES FINANCIAL SUMMARY (unaudited)
Net Cash Provided by Operating Activities to Non-GAAP Financial Liquidity Measures Reconciliation:
Three Months Ended December 31,
Twelve Months Ended December 31,
2024
2023
2024
2023
Net cash provided by operating activities
$
726
$
1,011
$
2,490
$
2,727
Adjustments to reconcile Net cash provided by operating activities to Adjusted Free Cash Flow:
Net cash used in investing activities (1)
(264
)
(257
)
(1,504
)
(702
)
Cash contributions from noncontrolling interests
17
53
57
106
Cash distributions paid to noncontrolling interests (2)
(114
)
(97
)
(425
)
(333
)
Proceeds from the issuance of related party notes (1)
—
—
629
—
Adjusted Free Cash Flow (3)
$
365
$
710
$
1,247
$
1,798
Cash distributions (4)
(286
)
(252
)
(1,145
)
(989
)
Adjusted Free Cash Flow after Distributions (3)(5)
$
79
$
458
$
102
$
809
Three Months Ended December 31,
Twelve Months Ended December 31,
2024
2023
2024
2023
Adjusted Free Cash Flow (3)
$
365
$
710
$
1,247
$
1,798
Changes in assets and liabilities, net of acquisitions (6)
Adjusted Free Cash Flow after Distributions (Excluding Changes in Assets & Liabilities) (7)(8)
$
(152
)
$
150
$
28
$
615
(1)
PAA and certain Plains entities have issued promissory notes by and among such entities to facilitate financing. “Proceeds from the issuance of related party notes” has an equal and offsetting cash outflow associated with our investment in related party notes, which is included as a component of “Net cash used in investing activities.”
(2)
Cash distributions paid during the period presented.
(3)
Management uses the non-GAAP financial liquidity measures Adjusted Free Cash Flow and Adjusted Free Cash Flow after Distributions to assess the amount of cash that is available for distributions, debt repayments, common equity repurchases and other general partnership purposes. Adjusted Free Cash Flow after Distributions shortages, if any, may be funded from previously established reserves, cash on hand or from borrowings under our credit facilities or commercial paper program.
(4)
Cash distributions paid to preferred and common unitholders during the period.
(5)
Excess Adjusted Free Cash Flow after Distributions is retained to establish reserves for future distributions, capital expenditures, debt reduction and other partnership purposes. Adjusted Free Cash Flow after Distributions shortages may be funded from previously established reserves, cash on hand or from borrowings under our credit facilities or commercial paper program.
(6)
See the “Condensed Consolidated Cash Flow Data” table.
(7)
Management uses the non-GAAP financial liquidity measures Adjusted Free Cash Flow (Excluding Changes in Assets & Liabilities) and Adjusted Free Cash Flow after Distributions (Excluding Changes in Assets & Liabilities) to assess the underlying business liquidity and cash flow generating capacity excluding fluctuations caused by timing of when amounts earned or incurred were collected, received or paid from period to period.
(8)
Fourth-quarter and full-year 2024 Adjusted Free Cash Flow (Excluding Changes in Assets & Liabilities) includes the negative impact of a $225 million charge resulting from the write-off of a receivable for Line 901 insurance proceeds.
PLAINS ALL AMERICAN PIPELINE, L.P. AND SUBSIDIARIES FINANCIAL SUMMARY (unaudited)
SELECTED ITEMS IMPACTING COMPARABILITY (in millions)
Three Months Ended December 31,
Twelve Months Ended December 31,
2024
2023
2024
2023
Selected Items Impacting Comparability:(1)
Derivative activities and inventory valuation adjustments (2)
$
(6
)
$
43
$
(85
)
$
(101
)
Long-term inventory costing adjustments (3)
17
(62
)
9
(35
)
Deficiencies under minimum volume commitments, net (4)
Selected items impacting comparability – Adjusted net income attributable to PAA
$
(321
)
$
(43
)
$
(546
)
$
(20
)
(1)
Certain of our non-GAAP financial measures may not be impacted by each of the selected items impacting comparability. See the “Net Income to Adjusted EBITDA attributable to PAA and Implied DCF Reconciliation” and “Computation of Basic and Diluted Adjusted Net Income Per Common Unit” table for additional details on how these selected items impacting comparability affect such measures.
(2)
We use derivative instruments for risk management purposes and our related processes include specific identification of hedging instruments to an underlying hedged transaction. Although we identify an underlying transaction for each derivative instrument we enter into, there may not be an accounting hedge relationship between the instrument and the underlying transaction. In the course of evaluating our results, we identify differences in the timing of earnings from the derivative instruments and the underlying transactions and exclude the related gains and losses in determining adjusted results such that the earnings from the derivative instruments and the underlying transactions impact adjusted results in the same period. In addition, we exclude gains and losses on derivatives that are related to (i) investing activities, such as the purchase of linefill, and (ii) purchases of long-term inventory. We also exclude the impact of corresponding inventory valuation adjustments, as applicable. For applicable periods, we excluded gains and losses from the mark-to-market of the embedded derivative associated with the Preferred Distribution Rate Reset Option of our Series A preferred units.
(3)
We carry crude oil and NGL inventory that is comprised of minimum working inventory requirements in third-party assets and other working inventory that is needed for our commercial operations. We consider this inventory necessary to conduct our operations and we intend to carry this inventory for the foreseeable future. Therefore, we classify this inventory as long-term on our balance sheet and do not hedge the inventory with derivative instruments (similar to linefill in our own assets). We treat the impact of changes in the average cost of the long-term inventory (that result from fluctuations in market prices) and write-downs of such inventory that result from price declines as a selected item impacting comparability.
(4)
We, and certain of our equity method investees, have certain agreements that require counterparties to deliver, transport or throughput a minimum volume over an agreed upon period. Substantially all of such agreements were entered into with counterparties to economically support the return on capital expenditure necessary to construct the related asset. Some of these agreements include make-up rights if the minimum volume is not met. We record a receivable from the counterparty in the period that services are provided or when the transaction occurs, including amounts for deficiency obligations from counterparties associated with minimum volume commitments. If a counterparty has a make-up right associated with a deficiency, we defer the revenue attributable to the counterparty’s make-up right and subsequently recognize the revenue at the earlier of when the deficiency volume is delivered or shipped, when the make-up right expires or when it is determined that the counterparty’s ability to utilize the make-up right is remote. We include the impact of amounts billed to counterparties for their deficiency obligation, net of applicable amounts subsequently recognized into revenue or equity earnings, as a selected item impacting comparability. We believe the inclusion of the contractually committed revenues associated with that period is meaningful to investors as the related asset has been constructed, is standing ready to provide the committed service and the fixed operating costs are included in the current period results.
(5)
Our total equity-indexed compensation expense includes expense associated with awards that will be settled in units and awards that will be settled in cash. The awards that will be settled in units are included in our diluted net income per unit calculation when the applicable performance criteria have been met. We consider the compensation expense associated with these awards as a selected item impacting comparability as the dilutive impact of the outstanding awards is included in our diluted net income per unit calculation, as applicable. The portion of compensation expense associated with awards that will be settled in cash is not considered a selected item impacting comparability.
(6)
During the periods presented, there were fluctuations in the value of the Canadian dollar to the U.S. dollar, resulting in the realization of foreign exchange gains and losses on the settlement of foreign currency transactions as well as the revaluation of monetary assets and liabilities denominated in a foreign currency. The associated gains and losses are not integral to our results and were thus classified as a selected item impacting comparability.
(7)
Includes costs recognized during the period related to the Line 901 incident that occurred in May 2015. For the 2024 periods, includes the write-off of a receivable for Line 901 insurance proceeds in the fourth quarter of 2024 and the impact of settlements in the third quarter of 2024.
(8)
Includes expenses associated with the Rattler Permian Transaction.
(9)
For the 2024 periods, primarily includes non-cash charges related to the write-down of two U.S. NGL terminals. For the twelve months ended December 31, 2023 primarily includes gains related to the sale of our Keyera Fort Saskatchewan facility.
PLAINS ALL AMERICAN PIPELINE, L.P. AND SUBSIDIARIES FINANCIAL SUMMARY (unaudited)
SELECTED FINANCIAL DATA BY SEGMENT (in millions)
Three Months Ended December 31, 2024
Three Months Ended December 31, 2023
Crude Oil
NGL
Crude Oil
NGL
Revenues (1)
$
11,959
$
535
$
12,187
$
623
Purchases and related costs (1)
(11,019
)
(300
)
(11,306
)
(364
)
Field operating costs (2)(3)
(503
)
(75
)
(274
)
(89
)
Segment general and administrative expenses (2) (4)
(74
)
(19
)
(68
)
(19
)
Equity earnings in unconsolidated entities
154
—
92
—
Other segment items: (5)
Depreciation and amortization of unconsolidated entities
26
—
20
—
Derivative activities and inventory valuation adjustments
(16
)
22
(52
)
9
Long-term inventory costing adjustments
(9
)
(8
)
58
4
Deficiencies under minimum volume commitments, net
(41
)
—
8
—
Equity-indexed compensation expense
8
—
8
—
Foreign currency revaluation
(4
)
(1
)
18
5
Line 901 incident
225
—
10
—
Segment amounts attributable to noncontrolling interests (6)
(137
)
—
(138
)
—
Segment Adjusted EBITDA
$
569
$
154
$
563
$
169
Maintenance capital expenditures
$
48
$
25
$
39
$
24
(1)
Includes intersegment amounts.
(2)
Field operating costs and Segment general and administrative expenses include equity-indexed compensation expense.
(3)
Field operating costs for the three months ended December 31, 2024 include higher expenses related to (i) $225 million resulting from the write-off of a receivable for Line 901 insurance proceeds and (ii) an increase in estimated costs for long-term environmental remediation obligations.
(4)
Segment general and administrative expenses reflect direct costs attributable to each segment and an allocation of other expenses to the segments. The proportional allocations by segment require judgment by management and are based on the business activities that exist during each period.
(5)
Represents adjustments utilized by our CODM in the evaluation of segment results. Many of these adjustments are also considered selected items impacting comparability when calculating consolidated non-GAAP financial measures such as Adjusted EBITDA. See the “Selected Items Impacting Comparability” table for additional discussion.
(6)
Reflects amounts attributable to noncontrolling interests in the Permian JV, Cactus II Pipeline LLC and Red River Pipeline LLC.
PLAINS ALL AMERICAN PIPELINE, L.P. AND SUBSIDIARIES FINANCIAL SUMMARY (unaudited)
SELECTED FINANCIAL DATA BY SEGMENT (in millions)
Twelve Months Ended December 31, 2024
Twelve Months Ended December 31, 2023
Crude Oil
NGL
Crude Oil
NGL
Revenues (1)
$
48,720
$
1,724
$
47,174
$
1,935
Purchases and related costs (1)
(45,033
)
(898
)
(43,805
)
(1,123
)
Field operating costs (2)(3)
(1,440
)
(328
)
(1,053
)
(372
)
Segment general and administrative expenses (2) (4)
(298
)
(83
)
(271
)
(79
)
Equity earnings in unconsolidated entities
452
—
369
—
Other segment items: (5)
Depreciation and amortization of unconsolidated entities
84
—
87
—
Derivative activities and inventory valuation adjustments
5
80
17
142
Long-term inventory costing adjustments
1
(10
)
22
13
Deficiencies under minimum volume commitments, net
(31
)
—
12
—
Equity-indexed compensation expense
36
—
35
1
Foreign currency revaluation
(22
)
(5
)
19
5
Line 901 incident
345
—
10
—
Transaction-related expenses
—
—
1
—
Segment amounts attributable to noncontrolling interests (6)
(543
)
—
(454
)
—
Segment Adjusted EBITDA
$
2,276
$
480
$
2,163
$
522
Maintenance capital expenditures
$
183
$
78
$
145
$
86
(1)
Includes intersegment amounts.
(2)
Field operating costs and Segment general and administrative expenses include equity-indexed compensation expense.
(3)
Field operating costs for the twelve months ended December 31, 2024 include higher expenses related to (i) $225 million resulting from the write-off of a receivable for Line 901 insurance proceeds, (ii) $120 million associated with settlements related to the Line 901 incident that occurred in May 2015 and (iii) an increase in estimated costs for long-term environmental remediation obligations.
(4)
Segment general and administrative expenses reflect direct costs attributable to each segment and an allocation of other expenses to the segments. The proportional allocations by segment require judgment by management and are based on the business activities that exist during each period.
(5)
Represents adjustments utilized by our CODM in the evaluation of segment results. Many of these adjustments are also considered selected items impacting comparability when calculating consolidated non-GAAP financial measures such as Adjusted EBITDA. See the “Selected Items Impacting Comparability” table for additional discussion.
(6)
Reflects amounts attributable to noncontrolling interests in the Permian JV, Cactus II Pipeline LLC and Red River Pipeline LLC.
PLAINS ALL AMERICAN PIPELINE, L.P. AND SUBSIDIARIES FINANCIAL SUMMARY (unaudited)
OPERATING DATA BY SEGMENT
Three Months Ended December 31,
Twelve Months Ended December 31,
2024
2023
2024
2023
Crude Oil Segment Volumes
Crude oil pipeline tariff (by region) (1)
Permian Basin (2)
6,846
6,710
6,731
6,356
South Texas / Eagle Ford (2)
421
411
403
410
Mid-Continent (2)
478
503
506
507
Gulf Coast (2)
214
250
218
260
Rocky Mountain (2)
461
452
474
372
Western
259
237
256
214
Canada
349
340
346
341
Total crude oil pipeline tariff (1) (2)
9,028
8,903
8,934
8,460
Commercial crude oil storage capacity (2) (3)
72
72
72
72
Crude oil lease gathering purchases (1)
1,661
1,518
1,586
1,452
NGL Segment Volumes(1)
NGL fractionation
138
127
132
115
NGL pipeline tariff
224
188
213
180
Propane and butane sales
127
125
92
86
(1)
Average volumes in thousands of barrels per day calculated as the total volumes (attributable to our interest for assets owned by unconsolidated entities or through undivided joint interests) for the period divided by the number of days in the period. Volumes associated with assets acquired during the period represent total volumes for the number of days we actually owned the assets divided by the number of days in the period.
(2)
Includes volumes (attributable to our interest) from assets owned by unconsolidated entities.
(3)
Average monthly capacity in millions of barrels calculated as total volumes for the period divided by the number of months in the period.
PLAINS ALL AMERICAN PIPELINE, L.P. AND SUBSIDIARIES FINANCIAL SUMMARY (unaudited)
NON-GAAP SEGMENT RECONCILIATIONS (in millions)
Supplemental Adjusted EBITDA attributable to PAA Reconciliation:
Three Months Ended December 31,
Twelve Months Ended December 31,
2024
2023
2024
2023
Crude Oil Segment Adjusted EBITDA
$
569
$
563
$
2,276
$
2,163
NGL Segment Adjusted EBITDA
154
169
480
522
Adjusted other income, net (1)
6
5
23
26
Adjusted EBITDA attributable to PAA (2)
$
729
$
737
$
2,779
$
2,711
(1)
Represents “Other income, net” as reported on our Condensed Consolidated Statements of Operations, excluding interest income on promissory notes by and among PAA and certain Plains entities, as well as other income, net attributable to noncontrolling interests, adjusted for selected items impacting comparability. See the “Selected Items Impacting Comparability” table for additional information.
(2)
See the “Net Income to Adjusted EBITDA attributable to PAA and Implied DCF Reconciliation” table for reconciliation to Net Income.
PLAINS GP HOLDINGS AND SUBSIDIARIES FINANCIAL SUMMARY (unaudited)
CONDENSED CONSOLIDATING STATEMENTS OF OPERATIONS (in millions, except per share data)
Three Months Ended December 31, 2024
Three Months Ended December 31, 2023
Consolidating
Consolidating
PAA
Adjustments(1)
PAGP
PAA
Adjustments(1)
PAGP
REVENUES
$
12,402
$
—
$
12,402
$
12,698
$
—
$
12,698
COSTS AND EXPENSES
Purchases and related costs
11,227
—
11,227
11,558
—
11,558
Field operating costs
578
—
578
363
—
363
General and administrative expenses
93
1
94
87
1
88
Depreciation and amortization
258
—
258
273
—
273
(Gains)/losses on asset sales, asset impairments and other, net
159
—
159
(9
)
—
(9
)
Total costs and expenses
12,315
1
12,316
12,272
1
12,273
OPERATING INCOME
87
(1
)
86
426
(1
)
425
OTHER INCOME/(EXPENSE)
Equity earnings in unconsolidated entities
154
—
154
92
—
92
Gain on investments in unconsolidated entities, net
15
—
15
—
—
—
Interest expense, net
(112
)
17
(95
)
(97
)
—
(97
)
Other income, net
20
(17
)
3
17
—
17
INCOME BEFORE TAX
164
(1
)
163
438
(1
)
437
Current income tax expense
(52
)
—
(52
)
(41
)
—
(41
)
Deferred income tax (expense)/benefit
7
(2
)
5
2
(16
)
(14
)
NET INCOME
119
(3
)
116
399
(17
)
382
Net income attributable to noncontrolling interests
(83
)
(44
)
(127
)
(87
)
(243
)
(330
)
NET INCOME/(LOSS) ATTRIBUTABLE TO PAGP
$
36
$
(47
)
$
(11
)
$
312
$
(260
)
$
52
Basic and diluted weighted average Class A shares outstanding
197
196
Basic and diluted net income/(loss) per Class A share
$
(0.05
)
$
0.27
(1)
Represents the aggregate consolidating adjustments necessary to produce consolidated financial statements for PAGP.
PLAINS GP HOLDINGS AND SUBSIDIARIES FINANCIAL SUMMARY (unaudited)
CONDENSED CONSOLIDATING STATEMENTS OF OPERATIONS (in millions, except per share data)
Twelve Months Ended December 31, 2024
Twelve Months Ended December 31, 2023
Consolidating
Consolidating
PAA
Adjustments(1)
PAGP
PAA
Adjustments(1)
PAGP
REVENUES
$
50,073
$
—
$
50,073
$
48,712
$
—
$
48,712
COSTS AND EXPENSES
Purchases and related costs
45,560
—
45,560
44,531
—
44,531
Field operating costs
1,768
—
1,768
1,425
—
1,425
General and administrative expenses
381
6
387
350
6
356
Depreciation and amortization
1,026
—
1,026
1,048
3
1,051
(Gains)/losses on asset sales, asset impairments and other, net
160
—
160
(152
)
—
(152
)
Total costs and expenses
48,895
6
48,901
47,202
9
47,211
OPERATING INCOME
1,178
(6
)
1,172
1,510
(9
)
1,501
OTHER INCOME/(EXPENSE)
Equity earnings in unconsolidated entities
452
—
452
369
—
369
Gain on investments in unconsolidated entities, net
15
—
15
28
—
28
Interest expense, net
(430
)
48
(382
)
(386
)
—
(386
)
Other income, net
65
(48
)
17
102
—
102
INCOME BEFORE TAX
1,280
(6
)
1,274
1,623
(9
)
1,614
Current income tax expense
(195
)
—
(195
)
(145
)
—
(145
)
Deferred income tax (expense)/benefit
28
(37
)
(9
)
24
(68
)
(44
)
NET INCOME
1,113
(43
)
1,070
1,502
(77
)
1,425
Net income attributable to noncontrolling interests
(341
)
(626
)
(967
)
(272
)
(955
)
(1,227
)
NET INCOME ATTRIBUTABLE TO PAGP
$
772
$
(669
)
$
103
$
1,230
$
(1,032
)
$
198
Basic and diluted weighted average Class A shares outstanding
197
195
Basic and diluted net income per Class A share
$
0.52
$
1.01
(1)
Represents the aggregate consolidating adjustments necessary to produce consolidated financial statements for PAGP.
PLAINS GP HOLDINGS AND SUBSIDIARIES FINANCIAL SUMMARY (unaudited)
CONDENSED CONSOLIDATING BALANCE SHEET DATA (in millions)
December 31, 2024
December 31, 2023
Consolidating
Consolidating
PAA
Adjustments(1)
PAGP
PAA
Adjustments(1)
PAGP
ASSETS
Current assets
$
4,802
$
(26
)
$
4,776
$
4,913
$
3
$
4,916
Property and equipment, net
15,424
—
15,424
15,782
—
15,782
Investments in unconsolidated entities
2,811
—
2,811
2,820
—
2,820
Intangible assets, net
1,677
—
1,677
1,875
—
1,875
Deferred tax asset
—
1,220
1,220
—
1,239
1,239
Linefill
968
—
968
976
—
976
Long-term operating lease right-of-use assets, net
332
—
332
313
—
313
Long-term inventory
280
—
280
265
—
265
Other long-term assets, net
268
—
268
411
—
411
Total assets
$
26,562
$
1,194
$
27,756
$
27,355
$
1,242
$
28,597
LIABILITIES AND PARTNERS’ CAPITAL
Current liabilities
$
4,950
$
(26
)
$
4,924
$
5,003
$
2
$
5,005
Senior notes, net
7,141
—
7,141
7,242
—
7,242
Other long-term debt, net
72
—
72
63
—
63
Long-term operating lease liabilities
313
—
313
274
—
274
Other long-term liabilities and deferred credits
990
—
990
1,041
—
1,041
Total liabilities
13,466
(26
)
13,440
13,623
2
13,625
Partners’ capital excluding noncontrolling interests
9,813
(8,462
)
1,351
10,422
(8,874
)
1,548
Noncontrolling interests
3,283
9,682
12,965
3,310
10,114
13,424
Total partners’ capital
13,096
1,220
14,316
13,732
1,240
14,972
Total liabilities and partners’ capital
$
26,562
$
1,194
$
27,756
$
27,355
$
1,242
$
28,597
(1)
Represents the aggregate consolidating adjustments necessary to produce consolidated financial statements for PAGP.
PLAINS GP HOLDINGS AND SUBSIDIARIES FINANCIAL SUMMARY (unaudited)
COMPUTATION OF BASIC AND DILUTED NET INCOME/(LOSS) PER CLASS A SHARE (in millions, except per share data)
Three Months Ended December 31,
Twelve Months Ended December 31,
2024
2023
2024
2023
Basic and Diluted Net Income/(Loss) per Class A Share
Net income/(loss) attributable to PAGP
$
(11
)
$
52
$
103
$
198
Basic and diluted weighted average Class A shares outstanding
197
196
197
195
Basic and diluted net income/(loss) per Class A share
$
(0.05
)
$
0.27
$
0.52
$
1.01
Forward-Looking Statements
Except for the historical information contained herein, the matters discussed in this release consist of forward-looking statements that involve certain risks and uncertainties that could cause actual results or outcomes to differ materially from results or outcomes anticipated in the forward-looking statements. These risks and uncertainties include, among other things, the following:
general economic, market or business conditions in the United States and elsewhere (including the potential for a recession or significant slowdown in economic activity levels, the risk of persistently high inflation and supply chain issues, the impact of global public health events, such as pandemics, on demand and growth, and the timing, pace and extent of economic recovery) that impact (i) demand for crude oil, drilling and production activities and therefore the demand for the midstream services we provide and (ii) commercial opportunities available to us;
declines in global crude oil demand and/or crude oil prices or other factors that correspondingly lead to a significant reduction of North American crude oil and NGL production (whether due to reduced producer cash flow to fund drilling activities or the inability of producers to access capital, or both, the unavailability of pipeline and/or storage capacity, the shutting-in of production by producers, government-mandated pro-ration orders, or other factors), which in turn could result in significant declines in the actual or expected volume of crude oil and NGL shipped, processed, purchased, stored, fractionated and/or gathered at or through the use of our assets and/or the reduction of the margins we can earn or the commercial opportunities that might otherwise be available to us;
fluctuations in refinery capacity and other factors affecting demand for various grades of crude oil and NGL and resulting changes in pricing conditions or transportation throughput requirements;
unanticipated changes in crude oil and NGL market structure, grade differentials and volatility (or lack thereof);
the effects of competition and capacity overbuild in areas where we operate, including downward pressure on rates, volumes and margins, contract renewal risk and the risk of loss of business to other midstream operators who are willing or under pressure to aggressively reduce transportation rates in order to capture or preserve customers;
the successful operation of joint ventures and joint operating arrangements we enter into from time to time, whether relating to assets operated by us or by third parties, and the successful integration and future performance of acquired assets or businesses;
the availability of, and our ability to consummate, acquisitions, divestitures, joint ventures or other strategic opportunities and realize benefits therefrom;
environmental liabilities, litigation or other events that are not covered by an indemnity, insurance or existing reserves;
negative societal sentiment regarding the hydrocarbon energy industry and the continued development and consumption of hydrocarbons, which could influence consumer preferences and governmental or regulatory actions that adversely impact our business;
the occurrence of a natural disaster, catastrophe, terrorist attack (including eco-terrorist attacks) or other event that materially impacts our operations, including cyber or other attacks on our or our service providers’ electronic and computer systems;
weather interference with business operations or project construction, including the impact of extreme weather events or conditions (including wildfires and drought);
the impact of current and future laws, rulings, legislation, governmental regulations, executive orders, trade policies, tariffs, accounting standards and statements, and related interpretations that (i) prohibit, restrict or regulate the development of oil and gas resources and the related infrastructure on lands dedicated to or served by our pipelines, (ii) negatively impact our ability to develop, operate or repair midstream assets, or (iii) otherwise negatively impact our business or increase our exposure to risk;
negative impacts on production levels in the Permian Basin or elsewhere due to issues associated with (or laws, rules or regulations relating to) hydraulic fracturing and related activities (including wastewater injection or disposal), including earthquakes, subsidence, expansion or other issues;
the pace of development of natural gas or other infrastructure and its impact on expected crude oil production growth in the Permian Basin;
the refusal or inability of our customers or counterparties to perform their obligations under their contracts with us (including commercial contracts, asset sale agreements and other agreements), whether justified or not and whether due to financial constraints (such as reduced creditworthiness, liquidity issues or insolvency), market constraints, legal constraints (including governmental orders or guidance), the exercise of contractual or common law rights that allegedly excuse their performance (such as force majeure or similar claims) or other factors;
loss of key personnel and inability to attract and retain new talent;
disruptions to futures markets for crude oil, NGL and other petroleum products, which may impair our ability to execute our commercial or hedging strategies;
the effectiveness of our risk management activities;
shortages or cost increases of supplies, materials or labor;
maintenance of our credit ratings and ability to receive open credit from our suppliers and trade counterparties;
our inability to perform our obligations under our contracts, whether due to non-performance by third parties, including our customers or counterparties, market constraints, third-party constraints, supply chain issues, legal constraints (including governmental orders or guidance), or other factors or events;
the incurrence of costs and expenses related to unexpected or unplanned capital or maintenance expenditures, third-party claims or other factors;
failure to implement or capitalize, or delays in implementing or capitalizing, on investment capital projects, whether due to permitting delays, permitting withdrawals or other factors;
tightened capital markets or other factors that increase our cost of capital or limit our ability to obtain debt or equity financing on satisfactory terms to fund additional acquisitions, investment capital projects, working capital requirements and the repayment or refinancing of indebtedness;
the amplification of other risks caused by volatile or closed financial markets, capital constraints, liquidity concerns and inflation;
the use or availability of third-party assets upon which our operations depend and over which we have little or no control;
the currency exchange rate of the Canadian dollar to the United States dollar;
inability to recognize current revenue attributable to deficiency payments received from customers who fail to ship or move more than minimum contracted volumes until the related credits expire or are used;
significant under-utilization of our assets and facilities;
increased costs, or lack of availability, of insurance;
fluctuations in the debt and equity markets, including the price of our units at the time of vesting under our long-term incentive plans;
risks related to the development and operation of our assets; and
other factors and uncertainties inherent in the transportation, storage, terminalling and marketing of crude oil, as well as in the processing, transportation, fractionation, storage and marketing of NGL as discussed in the Partnerships’ filings with the Securities and Exchange Commission.
About Plains:
PAA is a publicly traded master limited partnership that owns and operates midstream energy infrastructure and provides logistics services for crude oil and natural gas liquids (“NGL”). PAA owns an extensive network of pipeline gathering and transportation systems, in addition to terminalling, storage, processing, fractionation and other infrastructure assets serving key producing basins, transportation corridors and major market hubs and export outlets in the United States and Canada. On average, PAA handles over 8 million barrels per day of crude oil and NGL.
PAGP is a publicly traded entity that owns an indirect, non-economic controlling general partner interest in PAA and an indirect limited partner interest in PAA, one of the largest energy infrastructure and logistics companies in North America.
PAA and PAGP are headquartered in Houston, Texas. For more information, please visit www.plains.com.
Economy, Culture and Skills Committee – Chamber, City Hall, Kamal Chunchie Way, 2pm
Analysis from 2021 by London & Partners found that the total economic value generated by the 305 major sporting events held in London between 2017 and 2020 was £1.03 billion.
The Economy, Culture and Skills Committee will meet to discuss the economic impact of major sporting events in London, looking at the role of the Mayor in bringing more sporting events to the city.
The guests are:
Panel 1: 2:00pm-3:30pm:
Nick Bitel, Chief Executive Officer, London Marathon Group
Mark Camley, Executive Director of Park and Venues, London Legacy Development Corporation
Esther Britten MBE, Head of Events and External Affairs, UK Sport
Councillor Muhammed Butt, Leader, London Borough of Brent
Panel 2: 3:35pm-5:00pm:
Howard Dawber, Deputy Mayor for Business and Growth
Planning and Regeneration Committee – Chamber, City Hall, Kamal Chunchie Way, 10am
A lot of work looking at the experiences of residents in tall buildings originated in the 1960s and 1970s and focused on social housing. In recent decades, there has been a shift in the types of homes being delivered by tall buildings towards private accommodation.
The Planning and Regeneration Committee will ask the Deputy Mayor for Planning, and guests from the Greater London Authority (GLA) and London Boroughs about how they set policies and take decisions around the delivery of tall buildings in London.
The guests are:
Panel 1: 10am – 11.15am:
Michael Ritchie, Place Shaping Manager, London Borough of Tower Hamlets
Michael Forrester, Head of Development Management, London Borough of Lewisham
Panel 2: 11.30am – 12.30pm:
Jules Pipe CBE, Deputy Mayor for Planning, Regeneration and the Fire Service
Police and Crime Committee – Chamber, City Hall, Kamal Chunchie Way, 10am
In the Met Police Commissioner’s December report for the London Policing Board, it was highlighted that a series of “tough choices” may have to be implemented to meet the expected budget gap of £450m in the Met’s 2025-26 budget.
The Police and Crime Committee will question the Met Police Commissioner on these “tough choices”, whether they will save the amount of money required, and how the Met will secure further funding to minimise these cuts. The Committee will also explore grooming gangs and stop and search.
The guests are:
Sir Mark Rowley, Commissioner of the Metropolitan Police
Kaya Comer-Shwartz, Deputy Mayor for Policing and Crime
All Assembly meeting – Chamber, City Hall, Kamal Chunchie Way, 10am
What are the key priorities for the London Fire Brigade this year?
Assembly Members will ask questions about building safety, Lithium-ion battery powered E-bikes and E-scooters, EV buses fire risk, home fire safety visits and more.
The guests are:
Jules Pipe CBE, Deputy Mayor for Planning, Regeneration and the Fire Service
Innofactor Plc Stock Exchange Release – Changes in Board/Management/Auditing February 7, 2025, at 9:30 Finnish time
Innofactor’s Board of Directors has appointed Aki Rahunen as the CFO for Innofactor Group, and he will assume the position no later than May 8, 2025. Rahunen is currently serving as the CFO of Avidly. Previously, Rahunen has held the position of CFO at Fluido, among others. M.Sc. (Econ.) Rahunen will become a member of Innofactor’s Executive Board in his role as the CFO and will report to the Group’s CEO Sami Ensio.
“I am excited about my new role at Innofactor. It is great to join this journey. I believe that with my broad experience, I can support Innofactor’s business and help Innofactor continue on the path of profitable growth,” says Aki Rahunen.
“I am very pleased that we have Aki joining our team. He has exactly the right kind of practical expertise for Innofactor’s new strategic phase. I am convinced that in his role as CFO, Aki will further develop Innofactor’s financial management and support our business leadership in achieving our business goals,” says CEO Sami Ensio.
Espoo, February 7, 2025
INNOFACTOR PLC
Sami Ensio, CEO
Additional information: Sami Ensio, CEO Innofactor Plc Tel. +358 50 584 2029 sami.ensio@innofactor.com
Innofactor Innofactor is the leading driver of the modern digital organization in the Nordic Countries for its about 1,000 customers in commercial and public sector. Innofactor has the widest solution offering and leading know-how in the Microsoft ecosystem in the Nordics. Innofactor has about 600 enthusiastic and motivated top specialists in Finland, Sweden, Denmark and Norway. The Innofactor Plc share is listed in the technology section of the main list of NASDAQ Helsinki Oy. www.innofactor.com #AIDriven #PeopleFirst #CreatingSmiles #BeTheRealYou
Source: United States Senator for Massachusetts Ed Markey
WATCH: Senator Markey’s Remarks at EPA Headquarters
Washington (February 6, 2025) – Earlier today at Environmental Protection Agency (EPA) headquarters, Senator Edward J. Markey (D-Mass.), a member of the Senate Environment and Public Works Committee, Yassamin Ansari (AZ-03), and Paul Tonko (NY-20) were denied a meeting with EPA Administrator Lee Zeldin and DOGE representatives, where the lawmakers planned to ask why funding to critical EPA programs for clean air, clean water and climate action have been unconstitutionally cut off to communities and to demand that the funding that has already been authorized and appropriated by Congress be rightfully unfrozen.
Despite multiple court orders requiring the restart of funding, Trump administration officials have failed to release billions of dollars at the EPA that were authorized and appropriated for Inflation Reduction Act (IRA) and clean school bus programs as required by law—leaving communities without resources to combat the effects of dangerous pollution.
“Donald Trump, Elon Musk, and their unqualified, unelected, unwanted henchmen want to dismantle the government services that keep our communities thriving, healthy, and safe from polluters,” said Senator Markey. “I went to the headquarters of the EPA to demand answers from Administrator Zeldin and the DOGE representatives who are illegally withholding funding that would keep air and water clean and help save families save money. After being denied access and a meeting, I left with more questions than answers. I will not stop fighting on behalf of the American people—their clean air, clean water, lower energy bills, and livable future–until I get those answers and funding gets restored. No business as usual. No votes for nominees. No illegal funding freeze. And no workers left behind.”
Congressmembers Jerrold Nadler (NY-12), Luz Rivas (CA-29), Maxine Dexter (OR-03), Melanie Stansbury (NM-01), and leaders and advocates from several environmental groups and unions including Climate Action Campaign, American Federation of Government Employees, Green New Deal Network, WE ACT for Environmental Justice, Hip Hop Caucus, Union of Concerned Scientists, Natural Resources Defense Council, National Council of Churches, and Moms Clean Air Force joined the lawmakers for a press conference outside the EPA headquarters following the attempt to meet with EPA Administrator Zeldin and DOGE representatives.
07 February 2025 – Falcon Oil & Gas Ltd. (TSXV: FO, AIM: FOG) is pleased to announce the completion the Shenandoah S2-2H ST1 (“SS-2H ST1”) stimulation in the Beetaloo Sub-basin, Northern Territory, Australia with Falcon Oil & Gas Australia Limited’s joint venture partner, Tamboran (B2) Pty Limited.
Key Highlights
Successfully completed 35 stages across the 1,671-metre (5,483-feet) horizontal section of the Amungee Member B-shale with the Liberty Energy (NYSE: LBRT) modern stimulation equipment.
Stimulation activities achieved five stages over a 24-hour period on multiple days.
The average proppant intensity was 2,706 pounds per foot (lb/ft) and achieved wellhead injection rates above 100 barrels per minute.
The average stage spacing is 48-metres (~157-feet).
The SS-2H ST1 well will be completed ahead of clean out activities and the commencement of initial flow back and extended production testing.
Further updates on the completion of the Shenandoah South 4H (SS-4H) well will be provided in due course.
Philip O’Quigley, CEO of Falcon commented:
“We are extremely encouraged about the potential of the current stimulation program based on strong gas shows and other data observed whilst drilling. In addition, the experienced US operator, Liberty Energy, have shown the efficiencies they can achieve which will provide us with the greatest opportunity for the best possible outcomes from this stimulation program. We look forward to updating the market on the IP30 flow test results as soon as they become available.” Ends.
CONTACT DETAILS:
Falcon Oil & Gas Ltd.
+353 1 676 8702
Philip O’Quigley, CEO
+353 87 814 7042
Anne Flynn, CFO
+353 1 676 9162
Cavendish Capital Markets Limited(NOMAD & Broker)
Neil McDonald / Adam Rae
+44 131 220 9771
This announcement has been reviewed by Dr. Gábor Bada, Falcon Oil & Gas Ltd’s Technical Advisor. Dr. Bada obtained his geology degree at the Eötvös L. University in Budapest, Hungary and his PhD at the Vrije Universiteit Amsterdam, the Netherlands. He is a member of AAPG.
About Falcon Oil & Gas Ltd.
Falcon Oil & Gas Ltd is an international oil & gas company engaged in the exploration and development of unconventional oil and gas assets, with the current portfolio focused in Australia. Falcon Oil & Gas Ltd is incorporated in British Columbia, Canada and headquartered in Dublin, Ireland.
Falcon Oil & Gas Australia Limited is a c. 98% subsidiary of Falcon Oil & Gas Ltd.
For further information on Falcon Oil & Gas Ltd. Please visit www.falconoilandgas.com
About Beetaloo Joint Venture (EP 76, 98 and 117)
Company
Interest
Falcon Oil & Gas Australia Limited (Falcon Australia)
22.5%
Tamboran (B2) Pty Limited
77.5%
Total
100.0%
Shenandoah South Pilot Project -2 Drilling Space Units – 46,080 acres1
Company
Interest
Falcon Oil & Gas Australia Limited (Falcon Australia)
5.0%
Tamboran (B2) Pty Limited
95.0%
Total
100.0%
1Subject to the completion of the SS2HST1and SS4H wells on the Shenandoah South pad 2.
About Tamboran (B2) Pty Limited Tamboran (B1) Pty Limited (“Tamboran B1”) is the 100% holder of Tamboran (B2) Pty Limited, with Tamboran B1 being a 50:50 joint venture between Tamboran Resources Corporation and Daly Waters Energy, LP.
Tamboran Resources Corporation, is a natural gas company listed on the NYSE (TBN) and ASX (TBN). Tamboran is focused on playing a constructive role in the global energy transition towards a lower carbon future, by developing the significant low CO2 gas resource within the Beetaloo Basin through cutting-edge drilling and completion design technology as well as management’s experience in successfully commercialising unconventional shale in North America.
Bryan Sheffield of Daly Waters Energy, LP is a highly successful investor and has made significant returns in the US unconventional energy sector in the past. He was Founder of Parsley Energy Inc. (“PE”), an independent unconventional oil and gas producer in the Permian Basin, Texas and previously served as its Chairman and CEO. PE was acquired for over US$7 billion by Pioneer Natural Resources Company.
Advisory regarding forward-looking statements Certain information in this press release may constitute forward-looking information. Any statements that are contained in this news release that are not statements of historical fact may be deemed to be forward-looking information. Forward-looking information typically contains statements with words such as “may”, “will”, “should”, “expect”, “intend”, “plan”, “anticipate”, “believe”, “estimate”, “projects”, “dependent”, “consider” “potential”, “scheduled”, “forecast”, “outlook”, “budget”, “hope”, “suggest”, “support” “planned”, “approximately”, “potential” or the negative of those terms or similar words suggesting future outcomes. In particular, forward-looking information in this press release includes, details on the completion of the stimulation of SS-2H ST1; Liberty Energy conducting the stimulation campaign; and commencement of initial flow back and extended production testing and updates on SS-4H.
This information is based on current expectations that are subject to significant risks and uncertainties that are difficult to predict. The risks, assumptions and other factors that could influence actual results include risks associated with fluctuations in market prices for shale gas; risks related to the exploration, development and production of shale gas reserves; general economic, market and business conditions; substantial capital requirements; uncertainties inherent in estimating quantities of reserves and resources; extent of, and cost of compliance with, government laws and regulations and the effect of changes in such laws and regulations; the need to obtain regulatory approvals before development commences; environmental risks and hazards and the cost of compliance with environmental regulations; aboriginal claims; inherent risks and hazards with operations such as mechanical or pipe failure, cratering and other dangerous conditions; potential cost overruns, drilling wells is speculative, often involving significant costs that may be more than estimated and may not result in any discoveries; variations in foreign exchange rates; competition for capital, equipment, new leases, pipeline capacity and skilled personnel; the failure of the holder of licenses, leases and permits to meet requirements of such; changes in royalty regimes; failure to accurately estimate abandonment and reclamation costs; inaccurate estimates and assumptions by management and their joint venture partners; effectiveness of internal controls; the potential lack of available drilling equipment; failure to obtain or keep key personnel; title deficiencies; geo-political risks; and risk of litigation.
Readers are cautioned that the foregoing list of important factors is not exhaustive and that these factors and risks are difficult to predict. Actual results might differ materially from results suggested in any forward-looking statements. Falcon assumes no obligation to update the forward-looking statements, or to update the reasons why actual results could differ from those reflected in the forward-looking statements unless and until required by securities laws applicable to Falcon. Additional information identifying risks and uncertainties is contained in Falcon’s filings with the Canadian securities regulators, which filings are available at www.sedarplus.com, including under “Risk Factors” in the Annual Information Form.
Any references in this news release to initial production rates are useful in confirming the presence of hydrocarbons; however, such rates are not determinative of the rates at which such wells will continue production and decline thereafter and are not necessarily indicative of long-term performance or ultimate recovery. While encouraging, readers are cautioned not to place reliance on such rates in calculating the aggregate production for Falcon. Such rates are based on field estimates and may be based on limited data available at this time.
Neither the TSX Venture Exchange nor its Regulation Services Provider (as that term is defined in the policies of the TSX Venture Exchange) accepts responsibility for the adequacy or accuracy of this release.
A 22 year old Berriedale man has been charged with firearms offences following an incident in Rosetta last night between two people known to one another.Police allege the man went to an address in Marys Hope Road, Rosetta, where a firearm was discharged, about 9pm.Another man at the address received a non-life threatening injury to the hand and attended hospital for treatment.Police attended the scene and commenced an investigation.Later that night police, along with specialist resources, attended an address in Berriedale where a man was arrested in relation to the incident.The man was charged with wounding, destroy property, breach of bail, attempt to breach family violence order, unlawfully set fire to property and numerous firearm offences.He has been detained to appear in the Hobart Magistrates Court tomorrow.
Two men have been charged with drug and firearm offences following a search at their property in Southern Tasmania today.During the search at an address in Kellevie, officers from Southern Drugs & Firearms, Southern Traffic, Southeast CIB, Sorell, Nubeena and Dunalley Police seized two pistols, one being a replica and over 190 cannabis plants.The cannabis plants had a potential street value of $200,000.A 53 year old man was charged and will appear in the Hobart Magistrates Court at a later day, while a 31 year old man was charged and detained to appear in the Hobart Magistrates Court tomorrow morning. He will also be issued with a police family violence order,Detective Acting Inspector Richard Penney stated, “This is another example of police proactively seeking out those in our community who continue to flout our laws. Tasmania Police remains committed to ensuring those who deal in illicit drugs and firearms are brought to justice.”Anyone with information about illegal drug and firearm activity is urged to contact police on 131 444 or Crime Stoppers anonymously at 1800 333 000 or online at crimestopperstas.com.au.
Source: Australian Ministers for Regional Development
The Albanese Government has appointed Ms Georgina Somerset AM as Deputy Chairperson of the Australian Broadcasting Corporation (ABC) Board for a period of six months. Ms Somerset has served on the Board as a non-executive Director since 2017 and brings considerable experience to the role, including across the not-for-profit and regional development sectors. Her appointment as Deputy Chair for a six-month term will provide stability and certainty to the Board, as the ABC continues to deliver on its Charter to provide services and programs that inform and entertain Australians. Ms Somerset’s appointment fills the vacant Deputy Chair position created by the resignation of non‑executive Director and Deputy Chair Mr Peter Tonagh in December 2024. Mr Tonagh served on the ABC Board as a non-executive Director from May 2021, and was appointed Deputy Chair in November of that year. The Government thanks Mr Tonagh for his service throughout his time on the Board and wishes him well for his future endeavours. The independent Nomination panel for ABC Board appointments will conduct a merit-based selection process to fill the non-executive Director vacancy on the Board, in line with requirements under theAustralian Broadcasting Corporation Act 1983. Following this process, the Government will select a non-executive Director from the ABC Board to perform the Deputy Chair role in the longer term. Quotes attributable to the Minister for Communications, the Hon Michelle Rowland MP: “The Board performs a crucial role in guiding the ABC, including maintaining its independence and integrity, and ensuring the accuracy and impartiality of news.
“Ms Somerset has been an asset to the Board during her term and will continue to make a strong contribution in the role of Deputy Chair for the next six months. “On behalf of the Government, I wish Mr Tonagh the best for his next chapter, and thank him for his service to public broadcasting.”
Topics:NDIS; NDIS fraud; Investment in Saver Plus.
JACQUI FELGATE, HOST: I do want to touch base now, though, on the NDIS, because I think it’s a really important issue and it’s one that a lot of victims in this case and a lot of people with disabilities and special needs that needed help under the last system didn’t get it. It’s now in the hands of Amanda Rishworth, who’s the new Minister for the NDIS following the retirement of Labor MP Bill Shorten. So, for the first time on 3AW, she joins me now. Minister, really appreciate your time.
AMANDA RISHWORTH, MINISTER FOR SOCIAL SERVICES: Great to be with you.
AMANDA RISHWORTH: Well, what it means in practical terms is that if someone has a permanent and significant disability, what they can do is go to see a planner at the NDIS and they will make an assessment and give you funding to buy in a whole range of individualised supports. So, that might be therapy supports like physiotherapy, it might be personal care or nursing. It might be equipment like a wheelchair. Previously to the NDIS, people just used to get allocated a wheelchair or told to go to a certain place and that’s where they could get their physiotherapy. When the NDIS came in, you got funding in which the person with the disability could go and then find a provider and spend the money they were allocated to get that service. So, it provided a lot more control for people with disability. It has changed so many people’s lives, but it’s very individualistic, so it is what you need as an individual. And so it is quite complex at times and can be difficult to navigate, but it really has changed so many people’s lives because it’s provided an individualised support for people that need it.
JACQUI FELGATE: So, when you say complex, we do know the system has been fraught with problems to the point of alleged fraud as well. Last year, when we spoke to a lot of, particularly parents of young children, they felt like their funding had been reduced or cut unnecessarily. Are you going through all of those cases on an individual basis and can you reassure people that those who really need it are going to get the funding?
AMANDA RISHWORTH: Firstly, I would say that as Minister, the NDIS review process happens independently for me. But I can say and give your listeners reassurance, there haven’t been any changes around the rules in which young children are assessed. What there has been a change to is a list of what’s in and can be funded by the NDIS and what’s out of that list. And that was about making sure that the NDIS funds were actually used appropriately. There are a lot of things that were on that list that, you know, salt therapy was one of these things. There’s no evidence for that. But when it comes to children, there have been no changes around access and what can be funded under the scheme. There’s an individualised assessment to that and that’s really important. But there haven’t been any changes to what can be funded.
JACQUI FELGATE: And what about the rorts and the fraud? How can you guarantee that that won’t happen in the future?
AMANDA RISHWORTH: Look, some of the cases, particularly service providers that have been acting appallingly, was really shocking. So, we have, as under the previous Minister, set up what was called the Fraud Fusion Task Force, which actually brought together intel from a range of agencies, the AFP, the NDIA and a whole range of structures to deal with fraud. And so that continues do its work to make sure it’s identifying dodgy actors in this and hold them to account. And we have a number of ongoing investigations and referrals for prosecution. But some of the other work that’s been really important to make sure that this money gets used wisely is making sure people understand what can be funded and what can’t be, particularly service providers. They need to understand and give the right advice. So, the other element I’m really keen on is driving up quality. So, this isn’t just bad actors in the scheme, this is actually making sure that every participant, when they spend their NDIS money, get a high quality service, that there’s appropriate safeguards and protections in place as well.
JACQUI FELGATE: So, how do you think it got to that point, though, where we heard the most ridiculous examples and we heard the most desperate examples of people who really needed help but couldn’t get it? And then the rorts, like how did it allow over all these years, how did that get to that point, Minister?
AMANDA RISHWORTH: Well, people just weren’t paying attention. I mean, ultimately you heard stories the…
JACQUI FELGATE: The former Minister wasn’t paying attention?
AMANDA RISHWORTH: The former government wasn’t paying attention. I mean, when Minister Shorten came into this portfolio, he identified very quickly that there had been no checks and balances, that there hadn’t been proper oversight over this scheme. It had been left just to meander and there hadn’t been the appropriate protections put in place. So, Minister Shorten himself identified this very quickly and has stood up a whole range of oversight mechanisms to look at this. So, it really was the previous government…
JACQUI FELGATE: You can’t always blame the previous government, though, you have been in power for nearly four years.
AMANDA RISHWORTH: Well, you know about the challenges because we’ve identified them. You know about these cases that have happened over the last two years because they haven’t got away with it. I mean, that’s ultimately why, you know about these circumstances, why we’ve seen some of the articles in the paper, is because we have now got the oversight mechanisms to identify them and take them to court. So, we do need to maintain vigilance on this. It is critically important, but it’s also important that people don’t get dodgy service and there is quality services out there as well.
JACQUI FELGATE: Okay, so what’s the Saver Plus program and how’s that going to make a difference?
AMANDA RISHWORTH: The Saver Plus program is separate from the NDIS. This is a really important program where people that may be wanting to get a bit more financial capability to have matched savings with the ANZ Bank. We have just funded this program. It’s been going for 21 years. We’ve now extended their funding for another five years. It’s funded through the Brotherhood of St Laurence and really does support people become financially resilient and support them for really good saving habits. So, it’s a really good program. And I’m really pleased that today we’ve announced extra funding for that.
JACQUI FELGATE: Amanda Rishworth is the Minister for Social Services and the NDIS. Really appreciate your time, Minister.
Source: Australian Ministers for Regional Development
A project that will transform Sebastopol and become a vital part of community life has reached a major construction milestone.
The concrete slab of the Sebastopol Community Hub is about to be poured, as significant progress continues to be made towards the community-shaping project.
It is expected the structural steel framing will be complete in autumn as the designs start to become reality.
The community hub will provide a vital facility for Sebastopol and surrounding suburbs and has extensive financial support from all three tiers of government.
The collaborative project is jointly funded by the City of Ballarat (up to $5 million), the Federal Government ($4.5 million) via the Investing in Our Communities program and the State Government ($4.5 million) via the Building Blocks Capacity program.
The Sebastopol Community Hub will include:
Three 22-place kindergarten rooms
A main hall with a 150-person capacity
Three meeting rooms with varying capacities ranging from 12-50 people
Maternal child health consulting rooms
A community kitchen
A kindergarten play space and an undercover play area
On-site carparking
City of Ballarat Mayor, Cr Tracey Hargreaves joined Federal Member for Ballarat Catherine King and Member for Wendouree Juliana Addison for an inspection of the early stages of the works on Friday.
Significant progress has been made since the previous site tour in June 2024, with the project on track for completion in early 2026.
Cr Hargreaves said it was an exciting stage for the project at the corner of Vickers and Beverin streets.
“We are extremely proud to have both Federal and State support for this project and to see it starting to come to life is incredible,” she said.
“This is going to be a transformational project for the Sebastopol area that will provide an enormous boost to community life for a wide range of people.”
Federal Member for Ballarat Catherine King said the facility would provide a boost for a range of generations.
“It’s so exciting to see this important project taking shape,” she said.
“The new Sebastopol Community Hub will be a place of learning and social connection for both kinder kids and senior citizens.
“It will be a special, multi-generational facility and that will serve our community for generations to come.”
Member for Wendouree Juliana Addison said the facility would benefit the entire community.
“By investing $4.5 million into the Sebastopol Community Hub through our Building Blocks Capacity program, we are not only creating new kindergarten rooms and places – but contributing funds for a much-needed purpose built space for the whole community,” she said.
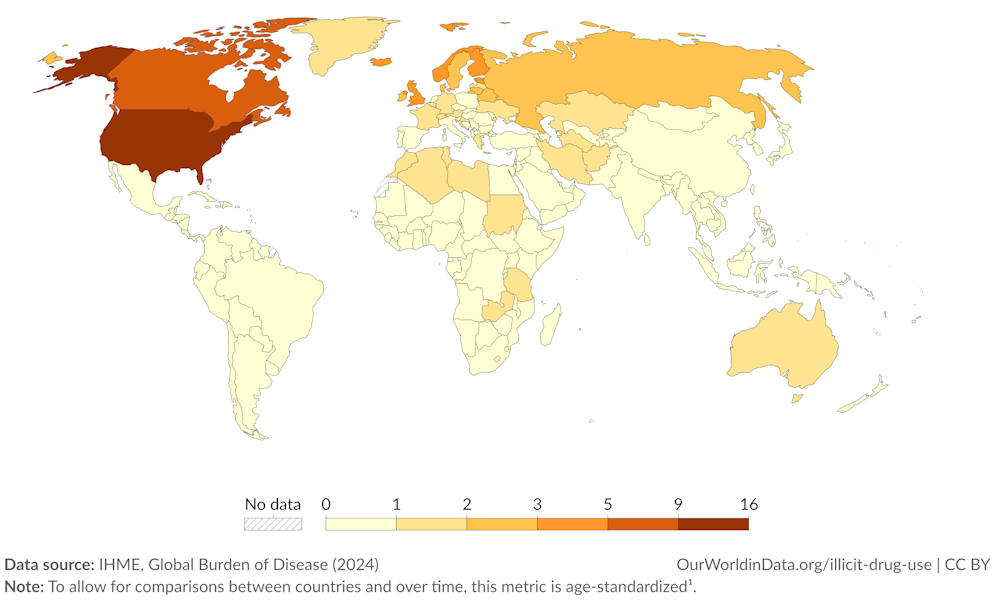