Source: World Trade Organization – WTO (video statements)
Director-General Ngozi Okonjo-Iweala welcomed Mary Ng, Canada’s Minister of Export Promotion, International Trade and Economic Development, to the WTO on 7 February. During their meeting, they discussed Canada’s strong commitment to multilateral trade and the importance of a rules-based trading system in supporting businesses and workers.
Download this video from the WTO website:
https://www.wto.org/english/res_e/webcas_e/webcas_e.htm
January 2025 was the hottest on record – a whole 1.7°C above pre-industrial levels. If many climate-watchers expected the world to cool slightly this year thanks to the natural “La Niña” phenomena, the climate itself didn’t seem to get the memo. In fact, January 2025’s record heat highlights how human-driven ocean warming is increasingly overwhelming these natural climate patterns.
La Niña is a part of the El Niño southern oscillation, a climate fluctuation that slowly sloshes vast bodies of water and heat between different ocean basins and disrupts weather patterns around the world. El Niño was first identified and christened by Peruvian fishermen who noticed a dismal drop in their catch of sardines that coincided with much warmer than usual coastal waters.
El Niño is now well known to be part of a grander climate reorganisation that also has a reverse cool phase, La Niña. As vast swathes of the eastern Pacific cool down during La Niña, this has knock on effects for atmospheric weather patterns, shifting the most vigorous storms from the central Pacific to the west and disrupting the prevailing winds across the globe.
This atmospheric reaction also helps to amplify the sea surface temperature changes. Typically, La Niña will lower the global temperature by a couple of tenths of a degree Celsius.
In 2024 the Pacific swung from moderate El Niño conditions to a weak La Niña. However, this time around, it’s apparently not enough to stop the world warming – even temporarily. So what’s different this time?
Each La Niña cycle is unique
Scientists aren’t entirely surprised. Each El Niño and La Niña cycle is unique. Following an surprisingly lengthy “triple dip” La Niña starting in 2020, the El Niño that developed in 2023 was also unusual, struggling to stand out against globally warm seas. The switch to a weak La Niña has only slightly cooled a narrow band along the equatorial Pacific, while surrounding waters have remained unusually hot.
Recent research shows human caused warming of the ocean is accelerating – so a year on year rise in temperature is itself getting bigger – and this is dominating to an ever greater extent over El Niño and other natural oscillations in the climate. This means that even during La Niña – when equatorial eastern Pacific waters are cooler than normal – the rest of the world’s oceans have remained remarkably warm.
More carbon, less reflection
There is also a sense of inevitability as greenhouse gas levels continue to grow, even despite the demise of El Niño. During El Niño years, the land tends to absorb less carbon from the atmosphere as large continental areas, such as parts of South America, temporarily dry out causing less plant growth and more carbon-emitting plant decay.
La Niña tends to have the opposite effect. In the strong La Niña of 2011, so much extra rain fell on the normally dry lands of Australia and parts of South America and southeast Asia that sea levels dropped as the land held on to this excess moisture borrowed temporarily from the ocean. This meant more carbon was taken from the atmosphere to feed extra plant growth. But despite the switch to La Niña, the rate of rise in atmospheric carbon in 2024 and January 2025 remains above the already high levels of previous years.
To this we can also add the diminishing effects of particle pollution from industry, big ships and other sources of “aerosols”, which in some regions had added a reflective haze in the atmosphere meaning the world absorbed less sunlight. Clean air policies introduced over time have made the world less smoggy, but they also seem to have caused clouds to reflect less sunlight back to space, adding to global heating.
As industrial activity continues to spew greenhouse gases into the air, while air cleansed of particle pollution causes more sunlight to reach the ground, this growing heating effect is beginning to drown out natural fluctuations, tipping the balance toward record warmth and worsening hot, dry and wet extremes.
The long-term trend is clear
But, just as one swallow doesn’t make a summer, a single month is not reflective of the overall trajectory of climate change. Changing weather patterns from week to week can rapidly shift temperatures especially over big landmasses, which warm up and cool down more quickly than the oceans (it takes a long time to boil up water for your vegetables but not long to super heat an empty pan).
Large areas of Europe, Canada and Siberia experienced much less cold weather than is normal for January (by up to about 7°C). Parts of South America, Africa, Australia and Antarctica also experienced above average temperatures. Along with the balmy oceans, this all contributed to an unexpectedly warm start to 2025.
While this particular warm January isn’t necessarily cause for immediate alarm, it suggests natural cooling phases may become less effective at temporarily offsetting the impact of rising greenhouse gas levels on global temperatures. And to limit the scale of the inevitable, ensuing climate change, there is a clear, urgent need to rapidly and massively cut greenhouse gas emissions and to properly account for the true cost of our lifestyles on societies and the ecosystems that underpin them.
Don’t have time to read about climate change as much as you’d like?
Richard P. Allan does not work for, consult, own shares in or receive funding from any company or organisation that would benefit from this article, and has disclosed no relevant affiliations beyond their academic appointment.
Drivers are reminded of traffic-pattern changes on Highway 99 at Steveston Highway over three weekends, beginning tonight, Friday, Feb. 7, 2025.
These changes are necessary as crews dismantle and remove the old Steveston Highway crossing.
Highway 99 will be closed in both directions overnight Friday, Saturday and Sunday from 9 p.m. until 8 a.m. (until 5 a.m. on Monday). During these overnight closures, Highway 99 travellers will detour using the highway on/off ramps.
From 8 a.m. until 9 p.m. Saturday and Sunday, Highway 99 will be open with two lanes in each direction. However, lanes may be shifted to allow crews and heavy equipment to dismantle and remove the old structure. Drivers are asked to use caution through any detours and obey the construction zone speed limit.
The traffic-pattern changes will also be in effect over the weekends of Feb. 21-24 and Feb. 28-March 3. There will be no impact to traffic during the week or over the Family Day long weekend.
During these weekend overnight lane closures and daytime traffic-pattern changes, drivers can expect delays and should consider an alternative route. Check DriveBC for updates: https://www.drivebc.ca/
Details about the traffic-pattern changes can be found here: https://www.highway99tunnel.ca/current-work/
The Lucy Letby case is the latest in a number of UK criminal medical cases that, beyond the rights and wrongs of each verdict, raise serious questions around how such cases are tried – especially when the evidence is limited, complex, and circumstantial. These cases often rely heavily on expert witnesses, whose testimony is crucial yet can be open to interpretation.
As an expert in the intersection of criminal and medical law, I am particularly concerned with how prosecution teams gather expert evidence in such cases – and how it is then communicated to juries through expert witnesses.
Generally speaking, in complex medical cases, police and prosecutors may risk becoming overly reliant on a small pool of experts when dealing with highly technical issues beyond their expertise. This dependence can inadvertently lead to “cherry-picking” – selectively presenting evidence that supports a particular narrative, while overlooking alternative perspectives that could provide a more comprehensive or balanced view.
In the Letby case, the prosecution’s selection and interpretation of evidence has now been challenged by an independent panel of 14 neonatal and paediatric experts. Letby is serving 15 whole-life prison terms after being convicted of murdering seven babies and attempting to kill another seven at the Countess of Chester hospital in north-west England. The chair of the panel, retired Canadian neonatologist Dr Shoo Lee, was co-author of a 1989 academic paper on air embolism in babies that was used in the prosecution’s case, but now says this evidence was misinterpreted by the prosecution.
In complex medical cases, I’m concerned that prosecutors – who may lack the medical expertise needed to fully grasp these complexities – may gravitate toward experts whose opinions align with a prosecutorial narrative, whether consciously or not. This can result in a narrowing of expert perspectives which might tend to focus only on those that bolster the case for conviction, while alternative views that could provide a more balanced assessment are excluded or marginalised.
In trials where juries hear only a limited number of expert voices, there’s a risk they may not receive a sufficiently balanced understanding of the case. In addition, rare diagnoses may lack the robust scientific literature typically needed to validate medical opinions in court.
Medical experts, like professionals in any field, can have differing opinions, especially in cases involving judgment calls or grey areas in medical practice. Without exposure to a range of viewpoints, jurors may miss alternative interpretations of the same evidence, which could be crucial for fair deliberation.
Of course, the defence also has the opportunity to call its own experts, potentially offering counter-arguments to prosecution evidence. But decisions by a defence team not to call certain experts may be based on legal strategy, resource constraints, or concerns about how the testimony will withstand cross-examination. When this happens, it can amplify the weight of the prosecution’s selected experts, potentially skewing the jury’s understanding.
Jurors naturally place a high level of trust in experts, assuming their testimony is both accurate and confined to their area of expertise. So, when experts venture beyond their remit, jurors may accept these statements uncritically, unaware that such testimony may lack the depth required in such complex medical cases. This issue is particularly concerning in circumstantial prosecutions where the case often hinges more on expert interpretation than on direct evidence, increasing the risk of misunderstanding or misjudgment.
Expert overreach
Testimony from experts unfamiliar with the practical pressures of certain clinical settings may lead to distorted interpretations of what a “reasonable” course of action would have been under the circumstances. This can result in unfair judgments, particularly when the nuances of clinical decision-making aren’t fully explored.
Experts also sometimes “overreach” their duties in court, offering opinions that extend beyond their remit. In the case of surgeon David Sellu, who was jailed for gross negligence manslaughter in November 2013 before being freed three years later, having spent 15 months in prison, the court of appeal noted that expert witnesses had repeatedly expressed opinions on whether Sellu’s conduct amounted to gross negligence – an assessment the court said should have been left to the jury.
In that case, the experts directly addressed the “ultimate issue” of whether Sellu’s actions were grossly negligent. But that was for the jury to decide, not the experts, and I believe the trial judge should have intervened. A key change needed by the UK legal system, in my view, is to establish clearer guidelines to ensure experts do not exceed their role – whether in a complex financial fraud or criminal medical trial.
Incidentally, while the judge in the Sellu trial didn’t give the jury correct direction (this was a key finding by the court of appeal that made the conviction unsafe), I don’t think it was entirely the judge’s fault. The law surrounding gross negligence manslaughter, particularly when applied to doctors unintentionally causing a patient’s death, is fraught with ambiguity. The lack of clear guidelines on what constitutes “gross” negligence, coupled with inconsistent application of the law, has sparked widespread concerns about its fairness and appropriateness in the medical context..
Make-up of a jury
Letby’s trial also highlights the limitations of the current jury system in such complex medical cases. The original trial was one of the longest in UK legal history, lasting ten months. The idea of jury trials is you’re tried by your peers, but if you’re a healthcare professional, you’re arguably not really being tried by your peers.
In England, jury service is compulsory and jurors are chosen randomly from the electoral register, but there are some exemptions and deferrals available in specific circumstances, such as serious illness, disability, or full-time caregiving. Additionally, people can apply for deferral if serving would cause significant hardship due to work commitments, including shift work or conflicts with important public duties. This is particularly relevant for professionals who cannot easily take extended time away from their roles.
This adds to the question of whether a jury, composed of 12 lay people with no specialised medical knowledge, can effectively assess intricate, often conflicting medical evidence. As Rebecca Helm highlights in her book How Juries Work (2024), while expert testimony aims to enhance jury understanding of complex evidence, jurors often lack the necessary background knowledge to fully grasp or critically assess it. This can lead to challenges in properly weighing competing expert opinions, especially in adversarial systems where experts present differing views.
In the Letby case, the vast amount of medical evidence presented for each baby likely made it challenging for a lay jury to fully comprehend. Additionally, they may have felt intimidated or hesitant to ask the judge questions, further complicating their ability to critically engage with the evidence.
Of course, it’s important to understand the backdrop for cases like this. I’m very aware of how overstretched, understaffed and under-resourced our hospitals are. And in the Letby case, we know that severely premature babies who are born on the cusp of viability often have a lot of comorbidities. It’s vital that jurors have a clear understanding of such specific context – which is outside the normal experience of most of us – when they come to make their decisions.
The jury’s role is to assess expert evidence independently, yet this can be difficult without clear guidance. In the Sellu trial, the absence of a “route to verdict” document was another significant issue. While not always mandatory, such a document is often used in complex cases to help jurors separate medical facts from legal conclusions.
Without it, the jury was left without clear guidance, increasing the risk of confusion and misapplication of the law. While the court of appeal did not say a route to verdict was strictly required, it strongly indicated that its omission contributed to an unfair trial process.
Expert advisors for juries
In complex criminal cases, like fraud or medical trials, where a large amount of expert evidence is presented, it can be challenging for lay jurors to fully understand and assess the evidence. Elsewhere in Europe – including in Italy, Spain and France – expert judges or advisers are often involved in complex cases to help guide the jury and clarify professional standards relevant to the case.
Given the complexity of cases like Sellu and Letby, it’s worth considering whether jury reform is needed in the UK to ensure fair trials. A potential solution is the inclusion of an expert, such as a medico-legal advisor, who can assist juries in understanding and weighing medical evidence. This would provide clarity on complex issues and help jurors navigate the case more effectively. It would be a practical, cost-effective step that maintains the integrity of jury trials, while addressing challenges specific to complex medical manslaughter and murder cases.
This medico-legal expert would serve solely to assist the jury in understanding complex issues presented during the trial, and would have no role in the deliberation or decision-making process. They are separate to the judge who oversees the trial, and their precise expertise would be dependent on the particular nature of the case.
Of course, everything would have to be confidential in accordance with jury rules – their introduction would simply be to facilitate decision-making and explain complex matters to the jury.
I believe it’s in the interests of both parties, the defendant and the prosecution, that the jury fully understands the evidence presented in court. An impartial medico-legal expert could help ensure this understanding, without influencing the case’s outcome. Their role would be beneficial for clarity, helping both parties ensure the jury comprehends the complex evidence before them.
Further, it may also be worth considering specialist medical juries for certain complex criminal cases, such as the Letby trial, where the evidence is highly technical. The sheer volume of complex medical information presented for each baby in this case suggests that a jury without specialised medical knowledge could struggle to fully grasp the evidence.
Appeals process
One of the Letby appeal grounds involved an application to admit fresh evidence from Lee, challenging the conclusions reached from the 1989 study he co-authored. The court of appeal denied this, noting it did not meet the standards for fresh evidence. Refusals such as this highlights an essential aspect of public debate: the need for transparency about how the court of appeal evaluates new evidence, especially in cases that receive significant media attention.
While it remains to be seen whether the court grants a new appeal for Letby, after the criminal cases review commission reviews the latest evidence provided by Lee’s panel, the Thirlwall inquiry has been sitting since September 2023, looking at events at the Countess of Chester Hospital on the basis that Letby is guilty. It will ultimately make recommendations about different aspects of this wider medical ecosystem, but it’s got no legal authority. Inquiries can make valuable recommendations, but they are advisory in nature and cannot enforce legal changes or compel action.
There are numerous other examples where criminal trials have not led to the systemic-level changes that they highlight are urgently needed, beyond the individual verdict. During the trial of Hadiza Bawa-Garba – a junior doctor found guilty of manslaughter in November 2015 on the grounds of gross negligence manslaughter following the death of a six-year-old boy in her care – it was revealed that the Leicester NHS trust’s serious incident report had identified 93 failures, only six of which were attributable to the doctor herself.
Ultimately, while holding individuals accountable is essential, we must also shift our focus towards long-term, systemic reform. Only by addressing the root causes and strengthening oversight within healthcare institutions can we ensure that tragedies are never repeated. The criminal justice system, though necessary in cases of clear criminal conduct, should be complemented by proactive, preventative measures that foster a culture of safety, accountability and transparency in healthcare.
To hear about new Insights articles, join the hundreds of thousands of people who value The Conversation’s evidence-based news. Subscribe to our newsletter.
Amel Alghrani does not work for, consult, own shares in or receive funding from any company or organisation that would benefit from this article, and has disclosed no relevant affiliations beyond their academic appointment.
US Drug Enforcement Administration images accompanying a warning about the emergence of nitazenes in Washington DC, June 2022USDEA
In the early hours of September 14 2021, three men parked in a quiet car park in the southern English market town of Abingdon-on-Thames. The men, returning from a night out, had pulled over to smoke heroin.
Unknown to them, the drug had been fortified with a nitazene compound called isotonitazene, a highly potent new synthetic opioid. Two of the men, Peter Haslam and Adrian Davies, overdosed and went into cardiac arrest. The third, Michael Parsons, tried to save them and himself by injecting naloxone, an opioid overdose antidote. Despite paramedics also trying to resuscitate Haslam and Davies, both died at the scene.
Their deaths were among at least 27 fatalities linked to nitazenes that year in the UK. Since then, nitazenes – otherwise known as 2-benzylbenzimidazole opioids – have become more prevalent in the UK’s illegal drug supply, leading some experts to warn that they are a major new threat because of their extreme potency.
In June 2023, the UK’s most recent outbreak of deaths linked to synthetic opioids emerged in the West Midlands when drug dealers used nitazenes to fortify low-purity heroin. By August, there were 21 nitazene-related fatalities in Birmingham alone. In some cases, dealers also added xylazine (colloquially known as “tranq”), a non-opioid sedative used by vets.
The increasing availability of these and other synthetic drugs led the UK’s National Crime Agency (NCA) to warn in August 2024 that “there has never been a more dangerous time to take drugs”. Like Haslam and Davies, many heroin users are unaware they might also be consuming nitazenes, which significantly increase the risk of overdose.
Given their potency, only a small amount of nitazene is required to produce a fatal dose. While some studies have concluded that nitazenes are even more potent than the synthetic opioid fentanyl, which causes many thousands of deaths in the US, the NCA judges it a “realistic possibility” that the potency of both substances are “broadly equivalent” – making them roughly 50 times more potent than heroin.
Illicit drug use is damaging large parts of the world socially, politically and environmentally. Patterns of supply and demand are changing rapidly. In our new longform series Addicted, leading drug experts bring you the latest insights on drug use and production as we ask: is it time to declare a planetary emergency?
Officially, more than 400 deaths plus many non-fatal overdoses were linked to nitazenes in the UK between June 2023 and January 2025. But this is likely to be an underestimate because of gaps within forensic and toxicology reporting. These figures come amid record levels of drug-related deaths in England and Wales. In 2023, there were 5,448 deaths related to drug poisoning, an 11% increase on the previous year and the highest total since records began in 1993.
This is of particular concern given that the UK has the largest heroin market in Europe, comprising around 300,000 users in England alone. While nitazene-related deaths are still relatively low (although by no means insignificant) compared with those from heroin and other opioids, these new synthetic opioids are cheap and easy to buy, and offer dealers multiple advantages over traditional plant-based drugs.
Unlike opium, nitazenes and other synthetic opioids can be produced anywhere in the world using precursor chemicals that are often uncontrolled and widely available. Producer countries including China and India have not yet banned all nitazene compounds, meaning they are sold legally – mostly online. Chemical manufacturing companies in these countries can synthesise nitazenes at scale using a comparatively easy three or four-step process.
Opioid use death rates around the world:
Estimated deaths from opioid use disorders per 100,000 people in 2021. Our World In Data, CC BY
For the past 15 years, I have researched and advised on the international narcotics industry, especially the Afghan drug trade, as an academic, UK Home Office official and consultant. I’ve observed many shifts within global drug markets, and I believe the increasing availability of synthetic drugs in the UK and Europe may represent a new chapter in illicit drug use here – with the emergence of nitazenes only adding to these concerns.
A brief history of synthetic opioids
New synthetic opioids (NSOs) are one of the fastest-growing groups of new psychoactive substances around the world. The EU Drugs Agency (EUDA) currently monitors 81 NSOs – the fourth-largest group of drugs under observation.
NSOs largely fall into two broad groups: fentanyl and its analogues, and non-fentanyl-structured compounds – these include nitazenes, among many other substances.
Many of these “new” synthetic opioids have, in fact, existed for decades. Nitazenes were first synthesised in the 1950s by the Swiss pharmaceutical company, Ciba Aktiengesellschaft, as pain-relieving analgesics, although they were never approved for medical use.
Prior to 2019, there had only been limited reports of nitazenes in the illegal drug supply – including a “brownish looking powder” found in Italy in 1966; the discovery of a lab in Germany in 1987; several nitazene-related deaths in Moscow in 1998; and a US chemist illegally producing the drug for personal use in 2003. But since nitazenes re-emerged at the end of the last decade, over 20 variants have been discovered.
Paul Janssen, the Belgian chemist who first made fentanyl. Johnson & Johnson
The most common NSO in the illegal drug market, fentanyl, was first synthesised by Belgian chemist Paul Janssen in 1960. Fentanyl, which is roughly 100 times more potent than morphine, was approved in the US in 1968 for pharmaceutical use as an analgesic.
Over the next four decades, however, illegally produced fentanyl resulted in three relatively small outbreaks of deaths in the US. A fourth, larger fentanyl outbreak in Chicago, Detroit and Philadelphia resulted in about 1,000 deaths between 2005 and 2007.
The current US fentanyl crisis started in 2013, expanding to affect much of the country. Between 2014 and 2019, Chinese companies were the main manufacturers of finished fentanyl substances in the US – to combat this, both the Obama and Trump administrations lobbied Beijing to curtail the fentanyl industry.
The Chinese government responded by controlling specific fentanyl analogues. However, every time an analogue was banned, chemists there would slightly adjust the formula to produce a new compound that mirrored the banned substance.
China finally banned all fentanyl-related substances in May 2019, prompting two significant changes in the drug’s supply: a slowdown in the development of new fentanyl analogues, and a reduction in their direct sale to the US from China. Instead, Chinese companies increasingly sent fentanyl precursors to Mexican drug cartels who would synthesise fentanyl (or counterfeit medication) in clandestine labs, before smuggling it across the US border. Consequently, Mexico is now the primary source of fentanyl in the US.
But these supply changes led to another shift in the global drugs arena, as China’s chemical and pharmaceutical businesses – keen to develop new markets – adjusted their focus to producing uncontrolled synthetic substances, including nitazenes. At the same time, they expanded their geographical focus from North America to include Europe and the UK.
The nitazene supply chain
Producing nitazenes is a relatively low-cost exercise. They are largely manufactured in laboratories – both legal and illegal – in China, before being smuggled to the UK and Europe via fast parcel and post networks.
Nitazenes’ high potency means only small quantities are required, making them easier to transport and harder for border officials to detect. Some Chinese vendors have reportedly been offering to hide nitazenes in legitimate goods such as dog food and catering supplies, to circumvent custom controls. All of this decreases the risk to sellers, and lessens the price of doing business.
In March 2024, two China-based sellers operating on the dark web were selling a kilo of nitazene for between €10,000 and €17,000 (£12,000-£20,000). During roughly the same period, a kilo of heroin at the wholesale level in the UK was selling for between £23,000 and £26,000. Once bought, nitazenes are largely used to fortify low-purity heroin, although the drug can also be made into pills.
Video by The Guardian.
Nitazenes are not limited to the dark web. They are widely and openly advertised on the internet, social media and music streaming platforms. In February 2024, one China-based e-commerce site displayed 85 advertisements for nitazenes. Such sites also sell a range of other synthetic drugs, including fentanyl analogues and precursors, xylazines, cannabinoids and methamphetamine.
This means drug dealers in the UK and across the world no longer need to have established connections to underworld figures to source illegal drugs. With a click of a mouse, they can have them delivered to their home address. In this sense, the internet has democratised the drug trade by widening access beyond “traditional” criminals.
In the UK, while the supply of nitazenes is currently assessed as “low”, a number of smaller-scale organised crime groups are importing them to fortify low-purity heroin, before largely dealing it at the “county lines” level. This involves organised crime groups moving drugs – primarily heroin and crack cocaine – across towns, cities and county borders within the UK, using mobile phones or another form of “deal line” to sell to customers.
In November 2023, Leon Brown from West Bromwich was imprisoned for seven years for dealing drugs containing nitazenes – a verdict described as “a great result in our ongoing efforts to tackle county lines drug dealing” by detective sergeant Luke Papps of the South Worcestershire county lines team.
A few larger UK criminal networks have also been involved in nitazene distribution. In October 2023, the police and Border Force conducted raids across north London, arresting 11 people. They dismantled a drug processing site and seized 150,000 tablets containing nitazene – the UK’s largest ever seizure of synthetic opioids – as well as a pill-pressing machine, a firearm, more than £60,000 in cash and £8,000 in cryptocurrency. The police suspected the group had been selling the tablets on the dark web.
Anecdotal reports suggest there have been mixed reactions to the introduction of nitazenes into the illegal drug supply. Richard, a recovering heroin user from Bristol, told Vice magazine that, given their potency, some “people are scared of [nitazenes]” while others are “actively seeking” them.
As has been the case with fentanyl in the US, users build up tolerance and therefore seek stronger doses. Manny, a heroin user from Bristol, told Vice: “I smoked [heroin cut with nitazenes] and it felt like the first time I’d ever taken drugs.”
Video by Vice.
UK-based criminals also use the dark web to export nitazenes abroad. In October 2023, the Australian Border Force identified 22 nitazene discoveries in packages shipped to the country via mail cargo from the UK. British criminals have also trafficked counterfeit medicines containing nitazenes to Ireland and Norway.
Use of nitazenes is now being detected all over the world. Within Europe, Ireland experienced several nitazene outbreaks in 2023-24 while in Estonia, nitazenes now account for a large share of overdose deaths – a trend also seen (to a lesser extent) in Latvia. Preliminary data suggests at least 150 deaths were linked to nitazenes in Europe in 2023.
Nitazenes have also been discovered in fake pain medication such as benzodiazepines, oxycodone and diazepam, which widens the number of people at risk to include those with no opioid tolerance. The death in July 2023 of Alex Harpum, a 23-year-old British student who was preparing for a career as an opera singer, was a stark reminder of the danger of buying fake medicine online that may have been contaminated with nitazenes.
The nitazene ‘boom’ and the global heroin trade
For decades, Afghanistan was the world’s largest opium producer and the source of most of Europe’s heroin. Then in April 2022, the ruling Taliban announced a comprehensive prohibition on the use, trade, transport, production, import and export of all drugs. As a result, poppy cultivation has fallen to historically low levels for a second consecutive year.
While this has not, as yet, translated into a shortage of heroin on European streets, including in the UK and Germany, some indicators suggest a slowdown in heroin supplies to the UK. In the year March 2023-24, the quantity of heroin seized in the UK fell by 54%, from 950kg to 441kg. This is the lowest quantity of heroin seized since 1989, when about 350kg was intercepted.
The NCA assesses that the Taliban ban has created market “uncertainty”. The wholesale price of heroin has increased from roughly £16,000 per kilo prior to the COVID-19 pandemic to about £26,000, while anecdotal reports suggest average heroin purity for users dropped to under 30% (often to 10-20%) in 2024, compared with around 35% in 2023 and 45% in 2022.
Video by UN Story.
Even without the Taliban’s ban, heroin is not easy to produce and supply. Cultivating opium poppy is labour-intensive, taking five or six months. The static nature of opium fields means they are visible and susceptible to eradication; poppy crops can also be negatively affected by blight or drought.
Converting opium into heroin base is also a labour-intensive process that can involve (depending on the production method) at least 17 steps. Acetic anhydride, the main chemical used to convert morphine into heroin, is relatively expensive compared with synthetic precursors. Moreover, heroin is a bulky product, which means it is harder to move in large volumes.
While the relationship between events in opiate-producer countries and the introduction of synthetic opioids to consumer markets should not be overstated, this new type of drug offers economic advantages to criminals whose “sole motivation is greed”.
For decades, Turkish, Kurdish and Pakistani criminal networks have been responsible for importing heroin into the UK. Once in the UK, both Turkish and British groups largely control its wholesale supply, with some participation of Albanian gangs.
To date, there is little evidence to suggest these groups have transitioned to supplying NSOs, including nitazenes. The shifting dynamics in the global drug supply chain, however, could upend traditional markets and the gangs who profit from them.
America’s synthetic drug crisis
The synthetic opioid fentanyl has devastated the US, having been linked to about 75,000 deaths in 2023 alone. It is the primary cause of death for Americans aged 18-49. Canada, too, has experienced a wave of deaths: between January 2016 and June 2024, there were 49,105 apparent opioid deaths there, with fentanyl implicated in a large proportion.
More than 4,300 reports of nitazenes have reached the US National Forensic Laboratory Information System since 2019. They are typically used to fortify fentanyl and other opioids, which can produce a fatal concoction.
Efforts to stem the flow of NSOs, including nitazenes, from China to the US and elsewhere will prove challenging. And even if China does implement stricter controls, other countries could step in to fill the void. According to the Commission on Combating Synthetic Opioid Trafficking:
The overall sizes of these industries, limited oversight efforts and political incentives contribute to an atmosphere of impunity among firms and individuals associated with those industries.
While US and Chinese counter-narcotics cooperation ended in 2022 amid increasing geopolitical tensions, the following November’s summit in Woodside, California, between presidents Joe Biden and Xi Jinping saw them agree to recommence collaboration.
As a result, China recently closed several chemical companies that were shipping fentanyl precursors and nitazenes to the US. These vendors used encrypted platforms and cryptocurrency to conduct the deals, and mislabelled the consignments to try to ensure the substances evaded border controls. China has also outlawed more chemicals and substances, including several nitazene variants.
But President Trump’s imposition of tariffs on imports from China – which sit alongside proposed taxes on imports from Canada and Mexico, in part for supposedly not doing enough to curb the trafficking of fentanyl and its precursors to the US – threatens this counter-narcotics cooperation.
While nitazenes are not yet widely available in the US, their presence within some fentanyl batches is complicating the US opioid crisis – and according to some experts, has the potential to further increase the already shocking number of synthetic opioid-related deaths.
The UK response to nitazenes
Successive UK governments have made tackling NSOs a high priority. Shortly after the most recent nitazene-related deaths were discovered in the UK in summer 2023, the NCA launched Project Housebuilder to lead and coordinate the law enforcement and public health response.
This was soon followed by the establishment of a government-wide Synthetic Opioids Taskforce “to improve…understanding, preparedness and mitigation against this evolving threat”. Chris Philp, then the UK’s combatting drugs minister, stated that “synthetic opioids are at the top of [this government’s] list because of the harm they cause”.
The taskforce has taken a range of measures, such as controlling more NSOs as class A drugs, conducting more intelligence operations at UK borders, widening access to naloxone, and enhancing the UK’s real-time, multi-source drug surveillance system. The government also worked with the US and Canada to learn from their experiences.
Recently, the current UK government banned a further six synthetic opioids and introduced a generic definition of nitazenes as class A drugs. And the UK’s current government, unlike its Conservative predecessor, has also indicated its willingness to consider evidence from the UK’s first drug consumption facility, which recently opened in Glasgow.
Other policy measures worthy of consideration include expanding drug checking services whereby drug users submit drugs to a lab to test what is in them, then are provided with information about the sample. These services offer vital information to the public and authorities about current drug trends.
While there is high uncertainty about what is going to happen next in the UK regarding illicit drug trends, the evolution of the US drug landscape over generations provides some important lessons.
Lessons from the US
The US fentanyl crisis shows drug markets can change quickly with long-lasting consequences. Most heroin on US streets contains – or has been replaced by – fentanyl. According to DEA seizure data, US heroin seizures declined by nearly 70% between 2019 and 2023, whereas fentanyl seizures have increased by 451%.
However, illegal drug markets evolve in different ways and at different paces. In May 1989, Douglas Hogg, a UK Home Office minister, travelled to the US and the Bahamas on a fact-finding mission about crack cocaine, a drug that was predicted to spread from the US to the UK. Upon his return, Hogg noted:
The ethnic, social and economic characters of many of our big cities are very similar to those in the US. If they have a crack problem, why should not we? … The use of crack in Great Britain is likely to develop very substantially over the next few years.
But this “crack invasion”, as some called it, did not materialise in the UK to the extent it had in the US – and the same was true about a predicted wave of methamphetamine use in the UK, which remains low compared with the US.
It is also unlikely the UK and Europe will experience a synthetic opioid crisis on the same scale as the US. The first wave of the US crisis was driven by extensive overprescription of opioids for pain relief. This increased the number of people addicted to opioids, some of whom later turned to heroin, before transitioning to fentanyl. In contrast, large-scale opioid prescriptions have not been a major issue in the UK or Europe, although there is some diversion of legal fentanyl into the illegal drug market in Europe.
Video by The Brookings Institution.
According to Alex Stevens, professor of criminology at the University of Sheffield, another factor differentiating the US and Europe is the provision of drug treatment and harm reduction programmes. Opioid users in Europe, and to a lesser extent in the UK, are much more likely to be in medication-assisted treatment than their US counterparts, thus reducing the number of people at risk. These interventions are reinforced by different socioeconomic factors in much of Europe, such as lower economic inequality, stronger social protections, and better healthcare systems.
None of this, though, means the nitazene threat in the UK and Europe should be underestimated, nor that use and supply of these drugs (and other NSOs) will not increase from its current relatively low base. As the NCA recently warned:
While a zero-tolerance approach from law enforcement, plus advice to users on the heightened dangers, may contain or slow the current uptake, we must prepare for these substances to become widely available, both unadvertised in fortified mixes and in response to user demand as a more potent high.
The future of new synthetic opioids
Predicting the future of NSO use and trafficking is a challenging task. Projections for Europe range from existing opiate stockpiles ensuring that heroin consumer markets remain serviced (assuming the Taliban ban is short-lived), to a heroin shortage which results in more drug dealers turning to NSOs to plug the shortfall, which in turn could lead to lasting changes in European drug markets (as happened in a few countries following the Taliban’s first opium ban in 2000-01).
In such a scenario, it is possible that Turkish criminal networks may exploit their links with Mexico’s Sinaloa cartel to source NSOs. Mexican criminal gangs also operate in Europe, which may increase the likelihood of them trying to open a new NSO market on the continent.
There is also evidence that some Italian criminal organisations have entered the NSO marketplace. In November 2023, Italian authorities announced the seizure of 100,000 doses of synthetic drugs, including fentanyl, as part of operation Painkiller, a joint Italian-American initiative.
Given the many advantages for criminal groups of NSOs, it seems likely they are here to stay. A key question is whether nitazenes (or other NSOs) will supplant traditional heroin as the opioid of choice, as they have done in the US, or remain at relatively low levels in Europe, co-existing with or mixed into the heroin supply.
In December 2023, Paul Griffiths, the EUDA’s scientific director, told Vice: “We’re not seeing much new initiation of heroin use in Europe. So in five to ten years … as heroin users get older and more vulnerable, we’re not going to have much of an opiate problem left.”
But he warned that if heroin use does dry up: “You might then see opioids appearing in other forms and preparations, such as pills, that could potentially become popular among younger age groups who currently do not appear attracted to injecting heroin.”
While previous NSO outbreaks in the UK were relatively short-lived and limited in scale, the most recent nitazene outbreak, which started in summer of 2023, has been more sustained, covered more parts of the UK, and involved more fatalities. The broader trend in Europe also suggests the prevalence and variations of NSOs are increasing at a faster pace than in previous years.
Notwithstanding, nitazene use and supply in the UK currently remains relatively low. In fact, the rate of nitazene-linked deaths – at least those officially reported – decreased between spring 2024 and the end of the year.
In the short term, then, it seems unlikely there will be a nitazene “explosion”. Rather, criminal groups will probably try to increasingly embed nitazenes into the UK drug market at a similar pace to the last 18 months.
However, this situation could change rapidly in future, especially if larger criminal networks involved in heroin importation switch to smuggling NSOs, and there is a genuine shortage of Afghan heroin. This problem would be compounded if drug users start seeking nitazenes, thus creating demand for them.
Either way, the UK government, along with its European partners, should continue to reinforce the whole drug system, to prepare for the worst-case scenario.
To hear about new Insights articles, join the hundreds of thousands of people who value The Conversation’s evidence-based news. Subscribe to our newsletter.
Philip A. Berry does not work for, consult, own shares in or receive funding from any company or organisation that would benefit from this article, and has disclosed no relevant affiliations beyond their academic appointment.
Donald Trump has hit the 30-day pause button on imposing 25% tariffs on Canada and Mexico, but is proceeding with slapping 10% tariffs on Chinese imports, and tariffs on the EU are still on his agenda.
Trump has declared that “tariff” is “the most beautiful word in the dictionary”. Yet as the president weighs up the sweeping consequences of his tariff fixation, he may want to throw out the dictionary and pick up a history book.
The magnitude and scale of the proposed tariffs hark back to the US Smoot-Hawley Tariff Act enacted in 1930.
For example, Nobel Laureate economist Paul Krugman told Bloomberg that “we’re really talking about tariffs on a scale that we … have not seen,” adding that “we’re talking about a reversal of really 90 years of US policy”.
The Smoot-Hawley tariffs were initially intended to provide support to the deeply indebted US agricultural sector at the end of the 1920s, and protect them from foreign competition – all familiar themes to the anti-free-trade rhetoric peddled by Trumpists today.
The advent of the Great Depression had generated widespread, albeit not universal, demands for protection from imports, and Smoot-Hawley increased already significant tariffs on overseas goods. Members of Congress were eager to provide protection, trading votes in exchange for support for their constituents’ industries.
Although at the time more than 1,000 economists implored President Herbert Hoover to veto Smoot-Hawley, the bill was signed into law. The resulting tariff act led to taxes averaging nearly 40% on 20,000 or so different types of imported goods.
The history of trade tariffs in the US.
The culmination led to a dramatic decline in US trade with other countries, particularly among those that retaliated, and is widely acknowledge as severely worsening the Great Depression. According to one estimate, the sum of US imports plummeted by nearly half.
What’s more, the impacts were felt globally. Protectionist policies are believed to have accounted for about half of the 25% decline in world trade, and indirectly helped create economic factors that led to the second world war.
The blowback against Capitol Hill was immense as well: the optics of vote trading over the tariff act resulted in Congress delegating control over trade policy to the president just four years later because the behaviour was regarded as so reckless.
All of this came against the backdrop of diplomatic American isolationism in the 1930s, which were not unlike many of Trump’s current efforts to retreat from – or even attack – multilateral institutions.
Despite President Woodrow Wilson winning the Nobel Peace Prize in 1919 for his work initiating the League of Nations (a forerunner of the United Nations), for example, the US never became a member. The term “America first” was also used widely in this period to refer to a focus on domestic policy and high tariffs.
Fast forward to present day
Trump has said that his tariffs will cause “some pain” but are “worth the price that must be paid.” Based on recent estimates from the non-partisan Peterson Institute for International Economics, Trump’s tariffs could drive up costs for the average US household more than US$1,200 (£963) per year.
Whether US voters will still stand behind Trump when actual prices begin to rise is still to be determined.
However, many Republicans on Capitol Hill have rushed to Trump’s defence. Congresswoman Claudia Tenney of New York told Fox News that she’s glad the US is “projecting strength for once on the world stage”. Senator Eric Schmitt of Missouri insisted that tariffs were “not a surprise,” emphasising that Trump had relentlessly campaigned on “improving our standing in the world.”
Perhaps the sharpest Republican rebuke came from Sen. Mitch McConnell of Kentucky, who labelled the tariffs simply a “bad idea”.
Public opinion data show that tariffs are hotly contested, with partisanship shaping both general views toward tariffs and views on specific national targets.
According to a January 2025 Harvard CAPS/Harris poll, 52% of Americans overall approve of placing new tariffs on China, with 74% of Republicans in favour, but just 34% of Democrats.
Support is more modest for imposing tariffs on America’s neighbours. Only 40% of voters think tariffs on Canada and Mexico are a good idea, including 59% of Republicans and 24% of Democrats.
Tariffs rank low on a list of national priorities. A mere 3% of Americans think tariffs on Canada and Mexico should be a top priority for Trump in his first 100 days, while just 11% rank tariffs on China as a top priority.
Prospect of a broader trade war
What seems clear is that Trump’s proposed tariffs against Canada, Mexico, and China could be just the opening salvos in a broader tit-for-tat that may extend to Europe, and beyond.
At home, the political challenge for Trump is to keep intact what increasingly looks like a fragile coalition – balancing the interests of hardline Maga supporters who reject free trade and tech titans who see tariffs as disrupting vital supply chains, especially to Asia.
After Trump’s election, former adviser and populist nationalist Steve Bannon warned that America would no longer be “abused” by “unbalanced trade deals.” “Yes, tariffs are coming,” he said. “You will have to pay to have access to the US market. It is no longer free, the free market is over.”
Meanwhile, Silicon Valley has been mostly silent on the tariffs. While tech moguls are doubtlessly trying to curry favour for tariff exemptions or the reduction of tariffs altogether, it’s possible that they have been assured that the tariffs are about leverage and will be gone soon enough.
Regardless, Trump is showing that tariffs are a crucial part of his “America first” foreign policy, a kind of belligerent unilateralism that treats allies and adversaries alike as pieces to be moved around a chessboard.
Under Trump, the “art of the deal” means throwing America’s weight around as the world’s economic superpower, and waiting for the leaders of other nations to fold. Whether American voters will endure the economic costs necessary for his plans could determine his resolve.
Trump may think that tariff is a beautiful word now. But if even a glimmer of the 1930s repeats itself, its economic shadow could soon look grim.
The authors do not work for, consult, own shares in or receive funding from any company or organisation that would benefit from this article, and have disclosed no relevant affiliations beyond their academic appointment.
Source: United Kingdom – Executive Government & Departments
Scientists comment on the Public Accounts Committee (PAC) report on Carbon Capture, Usage and Storage (CCUS) technologies.
Prof Hannah Chalmers, Personal Chair of Sustainable Energy Systems, Institute for Energy Systems, School of Engineering, University of Edinburgh, said:
“CCUS technologies can play a unique role in tackling carbon dioxide emissions. They can be used at large industrial sites to ensure that most of the carbon dioxide produced by activities like iron and steel production is not emitted to the atmosphere. Instead, the carbon dioxide is permanently stored in geological formations (rocks). In the UK, CCUS projects are developing plans to store carbon dioxide in layers of rock that are deep underneath the sea.
“There is also ongoing work to develop and deploy cost-effective approaches to remove carbon dioxide directly from the air. This provides an important option to respond to the widely reported increases in carbon dioxide levels in the atmosphere that are causing significant concern.
“There is significant evidence that including CCUS in a mix of technologies to reduce carbon dioxide emissions will be the most cost-effective way to address climate change. Several large-scale projects have been operating in other countries for many years. Experience from these projects is being used to ensure that the CCUS projects that are being developed in the UK are designed to be reliable and cost-effective.”
Dr Stuart Gilfillan, Reader in Geochemistry, University of Edinburgh, said:
What is CCUS technology, how does it work, does it have limitations?
“CCUS stands for Carbon Capture, Utilisation, and Storage, which is a developing technology which reduces the amount of carbon dioxide (CO2) released into the atmosphere. It works by capturing CO2 at the point source, transporting it and then burying it for safe storage in rocks over a kilometre below the ground surface. Like any technology, it has pros and cons, and costs more than simply releasing the CO2 directly to the atmosphere, which is currently free. CCUS is the only currently available technology that can directly reduce CO2 emissions from sources like power plants and industrial processes. Given that global temperature records are now being broken on an almost daily basis and yesterday’s announcement of the hottest January on record, it is essential tool in the urgent fight against runaway climate change.
What is the existing evidence around the efficacy of CCUS?
“CO2 capture technology has proven successful in capturing up to 90-95% of CO2 emissions from point of sources from power stations and industrial facilities. Successful examples include the Boundary Dam power station in Saskatchewan, Canada, where a large-scale CCUS unit has been operational since 2014, capturing about 1 million tonnes of CO2 per year.
“The long-term storage of CO2 is proven by natural CO2 reservoirs around the world and engineered projects like Sleipner in the North Sea, which have been injecting CO2 beneath the seabed since 1996 without significant issues. Research over the past two decades has developed monitoring technologies that can detect and mitigate potential leakage and to ensure that CO2 remains securely buried in rocks deep underground.
What more evidence may be needed to be confident in its applications?
“No more evidence is required, as exemplified by the UK’s Climate Change Committee (CCC), which is an independent body established under the Climate Change Act who advise the government on emissions targets and report to Parliament on progress made in reducing greenhouse gas emissions. The CCC is clear that CCUS is a critical technology for the decarbonisation of the UK economy, particularly in sectors that are hard to decarbonize directly, such as heavy industry (steel, cement, chemicals) and power generation.
“CCUS is not only as a standalone technology but is an essential part of a broader strategy to reach net-zero emissions by 2050. It compliments energy efficiency, renewable energy deployment, and electrification. CCUS is a clear driver for regional economic development, particularly in regions with suitable geological storage sites and industrial bases, such as the East Coast of Scotland, the Humber region, and North East England, areas that have been ‘left behind’ in recent times.”
Dr Tim Dixon, IEA Greenhouse Gas, Director and General Manager, said:
“Carbon Capture and Storage (CCS) is a necessary technology for the UK and other countries to achieve net-zero, and we need all low-carbon energy technologies. The science case for the role of CCS is provided by the UK’s Climate Change Committee, the Intergovernmental Panel on Climate Change (IPCC) and the International Energy Agency (IEA) and cannot be disputed if climate change is to be taken seriously. The key aspect of CCS is the secure long-term retention of CO2 in deep geological formations, and we have decades of experience in this from around the world. With over 40 large scale projects in operation injecting millions of tonnes every year and many pilot-scale projects, this has allowed us to test the science, the monitoring and the practicalities of geological storage of CO2. Hence CO2 geological storage is a proven technology and the regulations to enable and to ensure that it is safe and secure are based upon this sound science and experience. ”
Professor Paul Fennell FIchemE, Professor of Clean Energy, Imperial College London, said:
“The idea that Carbon Capture and Storage is an unproven technology is simply untrue. There are projects ongoing around the world, and millions of tonnes of CO2 have been safely stored over the last couple of decades. This has not happened in the U.K. because of our sclerotic inability to develop public infrastructure, not because the technology is unproven.”
Dr Greg Mutch, Researcher in Carbon Capture and Storage, Newcastle University, said:
“Carbon capture and storage is a technology that prevents carbon dioxide from entering the atmosphere, by capturing it and storing it underground in ‘empty’ oil & gas reservoirs or saline aquifers. According to the world’s foremost experts on the subject, gathered to contribute the International Panel on Climate Change, carbon capture and storage processes are necessary to achieve climate change mitigation goals at lowest cost. Without scalable CCS technologies by the end of the century, climate change mitigation will cost between 29 and 297% (mean value 138%) more.[1] Moreover, CCS is predicted to provide tens of thousands of jobs in the UK, add several billion pounds in terms of gross value added per year by 2050,[2] and enable other important technologies (hydrogen production etc) that will come with further jobs and economic value.”
[1] IPCC, 2018: Global Warming of 1.5 °C. An IPCC Special Report on the impacts of global warming of 1.5 °C above pre-industrial levels and related global greenhouse gas emission pathways, in the context of strengthening the global response to the threat of climate change, sustainable development, and efforts to eradicate poverty, ed. V. Masson-Delmotte, P. Zhai, H.-O. Portner, D. Roberts, J. Skea, P. R. Shukla, A. Pirani, W. Moufouma-Okia, C. Pean, R. Pidcock, S. Connors, J. B. R. Matthews, Y. Chen, X. Zhou, M. I. Gomis, E. Lonnoy, T. Maycock, M. Tignor and T. Waterfield, Cambridge University Press, 2018.
[2] Energy Innovation Needs Assessment Sub-theme report: Carbon capture, utilisation, and storage, Vivid Economics, Carbon Trust, E4tech, Imperial College London, Frazer-Nash Consultancy, Energy Systems Catapult. Commissioned by the Department for Business, Energy & Industrial Strategy, 2019.
Professor Peter Styring, Director of the UK Centre for Carbon Dioxide Utilization, Professor of Chemical Engineering & Chemistry, University of Sheffield, said:
What is CCUS technology, how does it work, does it have limitations?
“CCUS is carbon capture and storage. This has been primarily focused on CCS as the main driver. It aims to capture carbon dioxide from emitters such as power stations and industries. The current technology temperature swing absorption (TSA) using a chemical reaction with an aqueous amine solvent to capture the CO2 from the mixed waste gas and then to release it in a purified form by increased temperature chemical desorption and then further drying and purification to get a gas that can be in theory transported to a site where the gas can be stored underground. It works but at a high energy cost and the production of amine decomposition products that need to be removed and more amine added. It costs a lot!
“Limitations are the energy and financial costs, permitting regulations on solvent disclosure and the large physical footprint. Full system lifecycle analysis is required but this is not always reported.”
What is the existing evidence around the efficacy of CCUS?
“This is not proven using current technologies. The problem is that the current government funded projects use old technologies to achieve CCS and what is actually needed is a step change to new, lower cost more efficient processes such as solid based pressure swing adsorption (PSA). The whole system tends to be simpler and the energy costs and land use is significantly reduced.”
What more evidence may be needed to be confident in its applications?
“Full evaluation of new technologies and rapid acceleration from proof of concept to capture at scale. The Innovate UK funded Flue2Chem project is a good example of how this is being addressed using mid-TRL technologies. The UK also needs to move away from a single minded storage approach to adding value through the use of CO2 in the production of chemicals that would otherwise be sourced from virgin fossil carbon. SUSTAIN project is making synthetic fuels from captured CO2 and Flue2Chem is making FMCG components, including surfactants and precursors from the CO2.”
Dr Stuart Jenkins, Net Zero Fossil Fuel Fellow, University of Oxford, said:
“The Public Accounts Committee are wrong to have labelled CCUS as ‘unproven’, there are many commercial scale projects around the world, but they are right to question the current model for funding it. We need to make sure the CCUS industry becomes self-sustaining, without the need for major taxpayer funding. One option — asking fossil fuel suppliers to contribute to these costs via a carbon storage mandate — is a fair and responsible approach going forward.
In a recent report we published working with researchers at the University of Oxford and Carbon Balance Initiative [1] we looked at the use of Carbon Storage Mandates, which place an obligation on fossil fuel producers to capture and store a rising fraction of the CO2 they produce, to support the UK’s CCUS industry.
Carbon storage mandates, in tandem with carbon pricing and other mechanisms, could deliver subsidy-free CCUS to the UK and provide investment certainty for companies.”
Dr Stuart Jenkins Our report was funded by the Carbon Capture and Storage Association, and consulted regulators, fossil fuel companies, capture and storage entities, UK Government, and academics on models for CCUS sector support packages.
Professor Paul Fennell: No conflicts other than being involved in CCs research.
Dr Tim Dixon: “Tim is a Director of IEA Environmental Projects Ltd (UK), a Non-Executive Director on the Board for The International CCS Knowledge Centre (Canada). He is also proud to be an Honorary Senior Research Fellow at the Bureau of Economic Geology, University of Texas in Austin, and an Honorary Lecturer at the School of Geosciences at University of Edinburgh. He was an original Board Member of the UK CCS Research Centre. Previously he worked in CCS, emissions trading, clean energy technologies and related areas for AEA Technology (ETSU), for the UK Government‘s Department of Trade and Industry (DTI) and for the Global CCS Institute. He was the EU’s Lead Negotiator for getting CCS in the CDM in UNFCCC in 2011, and a UK negotiator for getting CCS in the London Convention 2004-7, in OSPAR 2006-7, in the EU Emission Trading Scheme 2004-8, and inputting to the EU CCS Directive 2007-8. He gives talks on climate and CCS to schools and public organisations and supported the start of Oxford Climate Society at the University of Oxford. He is a Fellow of the UK Energy Institute, and member of the UK Institute of Physics and the UK Environmental Law Association.”
Dr Stuart Gilfillan “I have received funding from TotalEnergies in the past, for research related to CO2 origins in the subsurface and reservoir connectivity and Equinor on CO2 dissolution in natural CO2 reservoirs. I currently receive funding from the Natural Environment Research Council and Carbfix on CO2 mineralisation.”
Prof Hannah Chalmers “I work collaboratively with industrial partners who are developing CCUS projects in the UK (e.g. as a member of the Advisory Board for the Industrial Decarbonisation Research and Innovation Centre). I currently receive no funding from industry, but have received funding from industrial partners who are actively developing CCUS projects in the UK in the past (e.g. SSE plc).”
Professor Peter Styring: Peter is Professor of Chemical Engineering and Chemistry at the University of Sheffield (an investigator on Flue2Chem and SUSTAIN) and a Co-founder and Director of CCU International.
For all other experts, no response to our request for DOIs was received.
Premier Scott Moe will travel to Washington D.C. this week for meetings with U.S. elected representatives, industry organizations and to participate in the premier’s Council of the Federation (COF) joint-mission to Washington.
Prior to the COF mission, Premier Moe will meet with U.S. elected representatives and businesses to emphasize the strong trade relationship between Canada and the U.S, and the role Saskatchewan plays in supplying the continent with energy and food security.
“It’s important in the current economic environment that we engage with our counterparts in the United States to emphasize the shared benefit of trade between our two countries and turn the conversation toward building on those strengths rather than jeopardizing them with tariffs,” said Moe.
The U.S. is Saskatchewan’s largest and most important trading partner. About $40 billion worth of imports and exports cross the border every year. The current tariff-free border allows businesses to add value to products and economies, whether flowing from north to south or vice versa.
Premier Moe’s meetings will focus on maintaining strong Canada-U.S. relations by addressing shared issues such as the economy, energy, supply chains and the impacts of the Trump Administration’s proposed tariffs.
Premier Moe will also express Saskatchewan’s support for strong measures to secure the Canada-U.S. border.
“Strengthening border security and preventing the flow of illicit drugs like Fentanyl is a concern that has been identified by the U.S. and one that I share,” Moe added. “We are already taking action as a province through our Border Security Plan to ensure we have more officers and law enforcement presence at the Saskatchewan-U.S. border.”
The Council of the Federation’s joint-mission to Washington will allow all thirteen premiers to present a united voice on the important benefits that free-trade brings to Canada and the U.S. and the concern over the negative impact of tariffs to consumers and businesses on both sides of the border.
The COF program will take place on Feb 12 and will include meetings with U.S. elected representatives, business leaders and the Canada American Business Council.
Following the COF mission Premier Moe will travel to Mexico to engage with business and elected officials to advance relationships with this key trading partner.
Over the course of the next few weeks, Premier Moe and multiple cabinet Ministers will be travelling within Canada and beyond to advocate for Saskatchewan’s interests. These engagement efforts will focus on promoting the province as a global supplier of food and energy security, while strengthening relationships with our key international trading partners.
CALGARY, Alberta, Feb. 07, 2025 (GLOBE NEWSWIRE) — Canoe Financial LP (“Canoe Financial”) is recognized with three 2024 FundGrade A+® Awards for outstanding performance.
Canoe Financial 2024 FundGrade A+ Award winning funds:
FundGrade calculation date 12/31/2024.
The FundGrade A+® rating recognizes the best performing funds that deliver the most consistent risk-adjusted returns. It is a yearly award that honours the “best of the best” among Canadian investment funds that have maintained a high FundGrade rating throughout a calendar year.
“These awards are a testament to the strength of our investment philosophy and the dedication of our team. At Canoe Financial, we’re committed to helping Canadians build lasting wealth through disciplined, active management and a focus on delivering consistent, long-term performance,” said Darcy Hulston, President and Chief Executive Officer, Canoe Financial.
About Canoe Financial Canoe Financial is one of Canada’s fastest growing independent mutual fund companies managing $20 billion in assets across a diversified range of award-winning investment solutions. Founded in 2008, Canoe Financial is an employee-owned investment management firm focused on building financial wealth for Canadians. Canoe Financial has a significant presence across Canada, including offices in Calgary, Toronto and Montreal.
About FundGrade A+ Awards FundGrade A+® is used with permission from Fundata Canada Inc., all rights reserved. The annual FundGrade A+® Awards are presented by Fundata Canada Inc. to recognize the “best of the best” among Canadian investment funds. The FundGrade A+® calculation is supplemental to the monthly FundGrade ratings and is calculated at the end of each calendar year. The FundGrade rating system evaluates funds based on their risk-adjusted performance, measured by Sharpe Ratio, Sortino Ratio, and Information Ratio. The score for each ratio is calculated individually, covering all time periods from 2 to 10 years. The scores are then weighted equally in calculating a monthly FundGrade. The top 10% of funds earn an A Grade; the next 20% of funds earn a B Grade; the next 40% of funds earn a C Grade; the next 20% of funds receive a D Grade; and the lowest 10% of funds receive an E Grade. To be eligible, a fund must have received a FundGrade rating every month in the previous year. The FundGrade A+® uses a GPA-style calculation, where each monthly FundGrade from “A” to “E” receives a score from 4 to 0, respectively. A fund’s average score for the year determines its GPA. Any fund with a GPA of 3.5 or greater is awarded a FundGrade A+® Award. For more information, see www.FundGradeAwards.com. Although Fundata makes every effort to ensure the accuracy and reliability of the data contained herein, the accuracy is not guaranteed by Fundata.
Canoe Equity Portfolio Class Series, Canadian Focused Equity category out of a total of 70 funds: 20.20% (1 year), 9.46% (3 years), 14.48% (5 years), 10.16% (10 years) and 8.02% (since inception-February 2011); Canoe Asset Allocation Portfolio Class, Tactical Balanced category out of a total of 56 funds: 14.65% (1 year), 6.35% (3 years), 10.46% (5 years), 7.36% (10 years) and 5.85% (since inception-February 2011); Canoe North American Monthly Income Portfolio Class, Global Neutral Balanced category out of a total of 224 funds: 13.40% (1 year), 6.22% (3 years), 8.25% (5 years), 6.47% (10 years) and 7.25% (since inception- December 2012).
Further information Investor Relations Canoe Financial LP 1–877–434–2796 info@canoefinancial.com
Commissions, trailing commissions, management fees and expenses all may be associated with mutual fund investments. Please read the prospectus before investing. The indicated rates of return are the historical annual compounded total returns including changes in unit value and reinvestment of all distributions and do not take into account sales, redemption, distribution or optional charges or income taxes payable by any unitholder that would have reduced returns. Mutual funds are not guaranteed, their values change frequently, and past performance may not be repeated.
The Department of Finance and the Bank of Canada, in its role as the Government of Canada’s fiscal agent, are announcing the launch of securities lending of the government’s Canada Mortgage Bond (CMB) holdings, to support market well-functioning.
The government is making its CMB holdings available to borrow via CIBC Mellon/BNY’s pre-existing securities lending services, which uses a market-based pricing structure. CIBC Mellon/BNY was selected as agent based on a detailed evaluation of short-listed securities lending agents in the Canadian fixed-income market.
CMBs will be made available to borrow beginning Monday, February 10, 2025. The government is making its full holdings of CMBs available, and the daily average amounts on loan over the prior month for each security will be published on the Bank’s website by the fifth business day of the following month.
For further details, including terms and conditions, loan pricing, eligible collateral and to register as an eligible counterparty, please contact CIBC Mellon/BNY directly.
Note that as previously announced, the government will participate in all fixed-rate CMB syndications proposed for 2025 and will continue to target a total purchase amount of 50% of fixed-rate CMB primary issuances. The Bank of Canada will continue to conduct CMB purchases on the government’s behalf.
For further information, please contact:
Director Funds Management Division Department of Finance Canada 343‑549‑3651
Director Financial Markets Department Bank of Canada
Premier Tim Houston will join other Canadian premiers as part of the Council of the Federation mission to Washington, D.C., next week.
The delegation of 13 premiers will meet with U.S. political and business leaders to remind them of how both countries significantly benefit from free trade.
“I’m proud to stand in solidarity with my provincial and territorial colleagues and remind our American friends and allies that our economies thrive when we work together,” said Premier Houston. “We know the stakes are high – not just for Canadians and Nova Scotians but also for Americans who will also pay the price if tariffs are imposed.”
Premier Houston has a full schedule of meetings and events February 11-12. In addition to discussing the importance of stabilizing North America’s partnership, the premiers will also continue discussions on removing interprovincial trade barriers, improving labour mobility and diversifying markets.
Quick Facts:
Canada is the top export destination for more than half of all goods produced in the United States
motor vehicles, machinery, metals, minerals and agri-food made up more than 50 per cent of U.S. exports to Canada in 2023
in 2023, Nova Scotia exports to the U.S. were worth $4.4 billion and imports were $682.7 million
the goods with the largest volume shipped to the U.S. were tires, fish and prepared seafood, forest products and plastics
mission delegates are Premier Houston; Nicole LaFosse Parker, Chief of Staff and General Counsel; and Executive Deputy Minister Tracey Taweel
Baie Verte RCMP is investigating a fire that occurred yesterday, February 6, 2025, in Seal Cove that damaged a number of residential structures.
Shortly after 1:00 p.m. on Thursday, Baie Verte RCMP received a report of a residential fire on Newtown Road in Seal Cove. The fire, which is believed to have started in a residential shed, spread onto a number of other structures, including two other sheds and four houses. Two of these homes and three of the sheds were destroyed by fire. The remaining two homes were damaged. No one was injured.
The cause of the fire remains under investigation at this time.
Green MP and party co-leader Adrian Ramsay has urged the government to divert planned new subsidies for the privately owned wood-burning Drax power station to a national home insulation scheme.
Adrian Ramsay said:
“Drax is a green energy scam, burning trees – some imported from ancient forests from as far away as Canada – subsidised by the taxpayer.
“The billions of pounds worth of subsidies run out in 2027, but the government is expected to try to renew them next week, turning taxpayer money into profits for a private company, instead of using the money to fuel a green energy revolution.
“Drax has benefitted from over £6 billion in subsidies since 2012 and neither taxpayers nor the environment can afford a penny more.
“The money should be used to help fund a national scheme of home insulation that would cut people’s energy bills and help to reduce energy use.
“Green MPs and Peers will be pressing the government to end this subsidy scandal and invest people’s money where it will make a real difference to them.”
SINGAPORE, Feb. 07, 2025 (GLOBE NEWSWIRE) — With the price of bitcoin once again trading below $100,000, many analysts believe it will enter a long period of high volatility. Holding spot positions may not continue to generate profits in the short term. BexBack Exchange is stepping up its efforts to provide traders with irresistible preferential packages. The platform now offers a 100% deposit bonus, a $50 welcome bonus for new users, and a 100x leverage on cryptocurrency trading, creating unparalleled opportunities for investors.
What Is 100x Leverage and How Does It Work?
Simply put, 100x leverage allows you to open larger trading positions with less capital. For example:
Suppose the Bitcoin price is $100,000 that day, and you open a long contract with 1 BTC. After using 100x leverage, the transaction amount is equivalent to 100 BTC.
One day later, if the price rises to $105,000, your profit will be (105,000 – 100,000) * 100 BTC / 100,000 = 5 BTC, a yield of up to 500%.
With BexBack’s deposit bonus
BexBack offers a 100% deposit bonus. If the initial investment is 2 BTC, the profit will increase to 10 BTC, and the return on investment will double to 1000%.
Note: Although leveraged trading can magnify profits, you also need to be wary of liquidation risks.
How Does the 100% Deposit Bonus Work? The deposit bonus from BexBack cannot be directly withdrawn but can be used to open larger positions and increase potential profits. Additionally, during significant market fluctuations, the bonus can serve as extra margin, effectively reducing the risk of liquidation.
About BexBack?
BexBack is a leading cryptocurrency derivatives platform that offers 100x leverage on BTC, ETH, ADA, SOL, and XRP futures contracts. It is headquartered in Singapore with offices in Hong Kong, Japan, the United States, the United Kingdom, and Argentina. It holds a US MSB (Money Services Business) license and is trusted by more than 200,000 traders worldwide. Accepts users from the United States, Canada, and Europe. There are no deposit fees, and traders can get the most thoughtful service, including 24/7 customer support.
Why recommend BexBack?
No KYC Required: Start trading immediately without complex identity verification.
High-Leverage Trading: Offers up to 100x leverage, maximizing investors’ capital efficiency.
Demo Account: Comes with 10 BTC in virtual funds, ideal for beginners to practice risk-free trading.
Comprehensive Trading Options: Feature-rich trading available via Web and mobile applications.
Convenient Operation: No slippage, no spread, and fast, precise trade execution.
Global User Support: Enjoy 24/7 customer service, no matter where you are.
Lucrative Affiliate Rewards: Earn up to 50% commission, perfect for promoters.
Take Action Now—Don’t Miss Another Opportunity!
If you missed the previous crypto bull run, this could be your chance. With BexBack’s 100x leverage and 100% deposit bonus and $50 bonus for new users (complete one trade within one week of registration), you can be a winner in the new bull run.
Sign up on BexBack now, claim your exclusive bonus and start accumulating more BTC today!
Disclaimer: This content is provided by BexBack. The statements, views and opinions expressed in this column are solely those of the content provider. The information provided in this press release is not a solicitation for investment, nor is it intended as investment advice, financial advice, or trading advice. It is strongly recommended you practice due diligence, including consultation with a professional financial advisor, before investing in or trading cryptocurrency and securities. Please conduct your own research and invest at your own risk.
Royal Air Force aviators have joined counterparts from the United States, Canada and Australia on Exercise Red Flag Nellis 25-1, considered one of the world’s toughest air combat training environments, to hone their war-fighting skills.
RAF personnel, including Rivet Joint aircrew from 51 Squadron, Air Operations Controllers from 19 Squadron and 20 Squadron, along with eight Typhoons and a Voyager aircraft are participating in the exercise, running 27th January to 14th February at Nellis Air Force Base in Nevada, United States.
Exercise Red Flag was established by United States Air Force in 1975, after the Vietnam War revealed the first 10 combat missions to be the most dangerous for aircrews. The first 10 missions of a modern air campaign are recreated in Red Flag to provide an invaluable experience for all participants.
Generations of RAF aviators have attended this exercise, and it continues to evolve and reflect the threats and challenges faced on modern operations. Missions are conducted to the nearby Nevada Test and Training Range, and further to the southwest of the United States where there is integration with maritime units.
This year’s exercise involves approximately 3,000 personnel and up to 150 aircraft over 15 different locations, conducting large force employment missions in a range of scenarios.
The exercise is renowned for its use of ‘aggressor’ forces including simulated enemy fighter aircraft, ground-based radars and simulated surface-to-air missiles – and even cyber and space-based elements that simulate threats for each mission.
The Tactical Command and Control team’s role is to manage and control all of those aircraft, alongside other elements and units working in the ground, maritime, cyber and space-based domains, to accomplish the mission. The scale and complexity of Exercise Red Flag Nellis cannot be replicated elsewhere, which makes it an outstanding place to build experience and reinforce a close working relationship with the United States, Australia and Canada.
TORONTO, Feb. 07, 2025 (GLOBE NEWSWIRE) — Portland Investment Counsel Inc. (Portland) is pleased to announce that the Portland Life Sciences Alternative Fund, managed by Michael Lee-Chin, Executive Chairman and Portfolio Manager and Dragos Berbecel, Portfolio Manager of Portland, was awarded a 2024 FundGrade A+® Award in the Alternative Equity Focused category for the 12-month period ending December 31, 2024, out of a total of 58 funds.
“We are deeply honored that Portland Life Sciences Alternative Fund has been recognized with a FundGrade A+® Award, a noteworthy achievement in Canada’s wealth management industry. This award reinforces our unwavering commitment to creating wealth for our investors and demonstrates our thesis that improved patient outcomes can lead to stronger investor outcomes. We extend our congratulations to all fellow recipients. Most importantly, we thank advisors and investors for their continued trust and confidence in our investment framework ” said Michael Lee-Chin.
The annual FundGrade A+® Awards are presented by Fundata Canada Inc. to recognize Canadian investment funds that have consistently received a FundGrade rating every month in the previous year.
About Portland Investment Counsel Inc. Portland is an Investment Fund Manager, Portfolio Manager and Exempt Market Dealer. We have a reputation for being Owners and Operators thus we are insightful Investors. Portland provides portfolio management and exempt market dealer services as well as investment products. Our investor roots date back to 1987. www.portlandic.com
About Fundata Canada Inc.’s FundGrade A+®rating FundGrade A+® is used with permission from Fundata Canada Inc., all rights reserved. The annual FundGrade A+® Awards are presented by Fundata Canada Inc. to recognize the “best of the best” among Canadian investment funds. The FundGrade A+® calculation is supplemental to the monthly FundGrade ratings and is calculated at the end of each calendar year. The FundGrade rating system evaluates funds based on their risk-adjusted performance, measured by Sharpe Ratio, Sortino Ratio, and Information Ratio. The score for each ratio is calculated individually, covering all time periods from 2 to 10 years. The scores are then weighted equally in calculating a monthly FundGrade. The top 10% of funds earn an A Grade; the next 20% of funds earn a B Grade; the next 40% of funds earn a C Grade; the next 20% of funds receive a D Grade; and the lowest 10% of funds receive an E Grade. To be eligible, a fund must have received a FundGrade rating every month in the previous year. The FundGrade A+® uses a GPA-style calculation, where each monthly FundGrade from “A” to “E” receives a score from 4 to 0, respectively. A fund’s average score for the year determines its GPA. Any fund with a GPA of 3.5 or greater is awarded a FundGrade A+® Award. For more information, see www.FundGradeAwards.com. Although Fundata makes every effort to ensure the accuracy and reliability of the data contained herein, the accuracy is not guaranteed by Fundata.
Portland Investment Counsel Inc. Diana N. Oddi, Director, Communications and Marketing 905.331.4250
TORONTO, Feb. 07, 2025 (GLOBE NEWSWIRE) — Ninepoint Partners LP (“Ninepoint”) is pleased to announce its Ninepoint Energy Fund (the “Fund”) has received a FundGrade A+ Award at Fundata’s 2024 Evening of Excellence event recently held in Toronto. The FundGrade A+ award has been accepted and embraced by the financial services industry as an objective, independent mark of distinction for those funds and fund managers who receive the award. This award acknowledges Canadian investment funds that have maintained an exceptional performance rating over the entire previous calendar year.
CIFSC Category
Fund Count
FundGrade Start Date
FundGrade Calculation Date
Ninepoint Energy Fund
Energy Equity
18
12/31/2014
12/31/2024
Fund Objective
The Ninepoint Energy Fund seeks to achieve long-term capital growth. The Fund invests primarily in equity and equity-related securities of companies that are involved directly or indirectly in the exploration, development, production and distribution of oil, gas, coal, or uranium and other related activities in the energy and resource sector.
Compounded Returns (as of December 31, 2024) | Inception date: April 15, 2004 (Series F)
1 YR
3 YR
5 YR
10 YR
15 YR
Since Inception
Ninepoint Energy Fund, Series F
13.2%
17.8%
29.5%
7.8%
6.1%
7.2%
All returns and fund details are a) based on Series F units; b) net of fees; c) annualized if period is greater than one year
FundGrade A+® is used with permission from Fundata Canada Inc., all rights reserved. The annual FundGrade A+® Awards are presented by Fundata Canada Inc. to recognize the “best of the best” among Canadian investment funds. The FundGrade A+® calculation is supplemental to the monthly FundGrade ratings and is calculated at the end of each calendar year. The FundGrade rating system evaluates funds based on their risk-adjusted performance, measured by Sharpe Ratio, Sortino Ratio, and Information Ratio. The score for each ratio is calculated individually, covering all time periods from 2 to 10 years. The scores are then weighted equally in calculating a monthly FundGrade. The top 10% of funds earn an A Grade; the next 20% of funds earn a B Grade; the next 40% of funds earn a C Grade; the next 20% of funds receive a D Grade; and the lowest 10% of funds receive an E Grade. To be eligible, a fund must have received a FundGrade rating every month in the previous year. The FundGrade A+® uses a GPA-style calculation, where each monthly FundGrade from “A” to “E” receives a score from 4 to 0, respectively. A fund’s average score for the year determines its GPA. Any fund with a GPA of 3.5 or greater is awarded a FundGrade A+® Award. For more information, see www.FundGradeAwards.com. Although Fundata makes every effort to ensure the accuracy and reliability of the data contained herein, the accuracy is not guaranteed by Fundata.
About Ninepoint Partners LP
Based in Toronto, Ninepoint Partners LP is one of Canada’s leading alternative investment management firms overseeing approximately $7 billion in assets under management and institutional contracts. Committed to helping investors explore innovative investment solutions that have the potential to enhance returns and manage portfolio risk, Ninepoint offers a diverse set of alternative strategies spanning Equities, Fixed Income, Alternative Income, Real Assets, F/X and Digital Assets.
For more information on Ninepoint Partners LP, please visit www.ninepoint.com or for inquiries regarding the offering, please contact us at (416) 943-6707 or (866) 299-9906 or invest@ninepoint.com.
For more information, please contact:
Sales Inquiries:
Neil Ross Ninepoint Partners 416.945.6227 nross@ninepoint.com
Ninepoint Partners LP is the investment manager to the Ninepoint Funds (collectively, the “Funds”).
The Fund is generally exposed to the following risks. See the prospectus of the Fund for a description of these risks: concentration risk; credit risk; currency risk; cybersecurity risk; derivatives risk; energy risk; exchange traded funds risk; foreign investment risk; inflation risk; interest rate risk; liquidity risk; market risk; performance fee risk; regulatory risk; Rule 144A and other exempted securities risk; securities lending, repurchase and reverse repurchase transactions risk; series risk; short selling risk; small capitalization natural resource company risk; specific issuer risk; tax risk; Absence of an active market for ETF Series risk; Halted trading of ETF Series risk; Trading price of ETF Series risk.
Commissions, trailing commissions, management fees, performance fees (if any), and other expenses all may be associated with investing in the Funds. Please read the prospectus carefully before investing. The indicated rate of return for series F units of the Funds for the period ended December 31, 2024 is based on the historical annual compounded total return including changes in unit value and reinvestment of all distributions and do not take into account sales, redemption, distribution or optional charges or income taxes payable by any unitholder that would have reduced returns. Mutual funds are not guaranteed, their values change frequently and past performance may not be repeated. This communication does not constitute an offer to sell or solicitation to purchase securities of the Funds.
The information contained herein does not constitute an offer or solicitation by anyone in the United States or in any other jurisdiction in which such an offer or solicitation is not authorized or to any person to whom it is unlawful to make such an offer or solicitation. Prospective investors who are not resident in Canada should contact their financial advisor to determine whether securities of the Funds may be lawfully sold in their jurisdiction.
Source: The Conversation – Africa – By Rebecca Ackermann, Professor, Department of Archaeology and Human Evolution Research Institute, University of Cape Town
Here’s how the story of the Taung Child is usually told:
In 1924 an Australian anthropologist and anatomist, Raymond Dart, acquired a block of calcified sediment from a limestone quarry in South Africa. He painstakingly removed a fossil skull from this material.
A year later, on 7 February 1925, he published his description of what he argued was a new hominin species, Australopithecus africanus, in the journal Nature. It was nicknamed the Taung Child, a reference to the discovery site and its young age.
The international scientific community rebuffed this hypothesis. They were looking outside Africa for human origins and argued that the skull more likely belonged to a non-human primate. Dart was vindicated decades later after subsequent similar fossil discoveries elsewhere in Africa.
Dart is portrayed as prescient in most retellings. He’s hailed for elevating the importance of Africa in the narrative of human origins.
But is this a biased and simplified narrative? The discovery played out during a period marked by colonialism, racism and racial segregation and apartheid in South Africa. The history of human origins research is, therefore, intertwined with inequality, exclusion and scientifically unsound ideas.
Viewed against this backdrop, and with a contemporary lens, the figure of Dart, and palaeoanthropology on the African continent more broadly, is complex and worthy of reflection.
The South African Journal of Science has published a special issue to mark the centenary of Dart’s original paper.
A group of African researchers and international collaborators, ourselves among them, contributed papers offering perspectives on the science, history and legacy of palaeoanthropology in South Africa and beyond.
We were particularly interested in exploring how the history of the discovery of early hominins in South Africa influenced the scientific field of palaeoanthropology. Did it promote or limit scientific enquiry? In what ways? What were its cultural effects? And how do they play out now, a century later?
The papers in the special issue unpack a number of issues and highlight ongoing debates in the field of human evolution research in Africa and beyond.
Our goal is to celebrate the remarkable science that the discovery of A. africanus enabled. At the same time we are probing disciplinary legacies through a critical lens that challenges researchers to do science better.
The marginalisation and erasure of voices
Several key themes run through the contributions in the special issue.
One is the unheard voices. The colonial framework in which most palaeoanthropological research in South Africa took place excluded all but a few groups. This is particularly true for Indigenous voices. As a legacy, few African researchers in palaeoanthropology are first authors on prominent research or leading international research teams.
Too often, African palaeoanthropological heritage is the domain of international teams that conduct research on the continent with little meaningful collaboration from local African researchers. This is “helicopter science”. More diverse teams will produce better future work and those of us in the discipline must actively drive this process.
The dominance of western male viewpoints is part of the colonial framework. This theme, too, threads through most of the work in the special issue.
In a bid to redress some of the imbalances, a majority of the authors in the special issue were women, especially African women, and Black Africans more broadly. Many of the papers call for a more considered and equitable approach to the inclusion of African researchers, technicians and excavators in the future: in workshops and seminars, on professional bodies, as collaborators and knowledge creators, and in authorship practices.
Community and practice
Colonial legacies also manifest in a lack of social responsiveness – the use of professional expertise for a public purpose or benefit. This is another theme in the special edition. For example, Gaokgatlhe Mirriam Tawane, Dipuo Kgotleng and Bando Baven consider the broader effects of the Taung Child discovery on the Taung community.
Tawane is a palaeoanthropologist and grew up in the Taung municipality. She and her co-authors argue that, a century after the discovery of the fossil, there is little (if any) reason for the local community to celebrate it. They argue that more must be done not only to give back to the community, which is beset by socio-economic struggles, but also to build trust in science and between communities and scientists.
Researchers need to understand that there is value in engaging with people beyond academia. This is not merely to disseminate scientific knowledge. It can also enrich communities and co-create a scholarship that is more nuanced, ethical and relevant. Researchers must become more socially responsive and institutions must hold researchers to higher standards of practice.
Resourcing
Another theme which emerges from this special issue is the value of and the need for excellent local laboratory facilities in which to undertake research based on the fossils and depositsassociated with them.
Increased investment in local laboratory facilities and capacity development can create a shift towards local work on the content being led by Africans. It can also increase pan-African collaboration, dismantling the currently common practice of African researchers being drawn into separate international networks.
It is important for international funding bodies to increase investment within African palaeoanthropology. This will facilitate internal growth and local collaborative networks. International and South African investment is also needed to grow local research capacity. Fossil heritage is a national asset.
This is an edited version of an article in the South African Journal of Science. Yonatan Sahle (Department of Archaeology, University of Cape Town, South Africa and Department of History and Heritage Management, Arba Minch University, Ethiopia) co-authored the academic article.
Rebecca Ackermann receives funding from the National Science Foundation African Origins Platform (AOP240509218040) and the Wenner-Gren Foundation.
Lauren Schroeder receives funding from the Natural Sciences and Engineering Research Council of Canada (RGPIN-2020-04159)
Robyn Pickering receives funding from the NRF African Origins Platform (AOP240509218076) and the DST-NRF Centre of Excellence in Palaeosciences (COE2024-RP)
Following a recent seizure of counterfeit currency, Bay Roberts RCMP is sharing images of the bills seized to display some of the things to watch out for.
Earlier this week, Bay Roberts RCMP received reports from two separate business indicating that counterfeit currency had been used. In both cases, an individual wearing baggy clothes, who is described as a tall Caucasian man with a scruffy beard, entered the store and purchased merchandise using counterfeit currency in denominations of $100 and $50 bills.
Upon close examination, a number of discrepancies between legitimate currency and counterfeit currency are noted on these bills. The bills seized by police are smaller in size and faded in color when compared to legitimate currency. The bills have the appearance and feel of a paper bill and are without a plastic coating. The clear window of the bill is made of tape and the image contained within the clear window of the bill was printed and applied to the bill.
Please see the attached images. The investigation is continuing.
Anyone having information that could assist police in identifying the individual involved in using counterfeit currency is asked to contact Bay Roberts RCMP at 709-786-2118. To remain anonymous, contact Crime Stoppers: #SayItHere 1-800-222-TIPS (8477), visitwww.nlcrimestoppers.comor use the P3Tips app.
If you feel you are in possession of counterfeit currency, please contact your local police. As a retailer, you have the right to refuse suspected counterfeit currency. More information on counterfeit currency can be found here: https://www.bankofcanada.ca/banknotes/counterfeit-prevention/
NEW YORK and TORONTO, Feb. 07, 2025 (GLOBE NEWSWIRE) — iAnthus Capital Holdings, Inc. (“iAnthus” or the “Company”) (CSE: IAN, OTCQB: ITHUF), which owns, operates and partners with regulated cannabis operations across the United States, today announced that certain iAnthus subsidiaries entered into definitive agreements (the “Purchase Agreements”) with a leading Arizona cannabis operator, Pitchfork Enterprises, LLC d/b/a Sonoran Roots and its affiliates (“Sonoran Roots”), to sell three dispensaries and two processing/cultivation facilities in Arizona for aggregate consideration of approximately $36.5 million (the “Transaction”). This strategic transaction is part of the Company’s ongoing efforts to optimize its portfolio, strengthen its balance sheet, and focus on key markets with the greatest growth potential.
The Transaction includes two dispensaries, a processing facility and a cultivation/processing facility located in Mesa, Arizona, as well as one dispensary located in Phoenix, Arizona (collectively, the “Facilities”). These Facilities have consistently delivered high-quality cannabis products and experiences to their surrounding communities. The Transaction will allow iAnthus to redirect resources to its growth initiatives in Florida, Maryland, New Jersey, Massachusetts and New York while still maintaining a retail presence in Arizona with one dispensary in Mesa, Arizona.
“This transaction aligns with our ‘smart growth, strong margins’ strategy by enabling us to double down on markets where we can deliver the most value to our customers and long-term business interests,” said Richard Proud, CEO of iAnthus. “By streamlining our Arizona operations, we are laying the foundation for a future defined by operational excellence, unmatched customer loyalty, and enhanced profitability. Our continued presence in Arizona through our Health for Life dispensary in Crismon, AZ, and our trusted MPX brand underscores our commitment to delivering exceptional products and experiences in every market we serve.”
The Transaction represents a strategic milestone for iAnthus, allowing it to align resources with its long-term objectives. For iAnthus, the Transaction not only reinforces its commitment to smart growth by simplifying the Company’s operations but also provides significant capital to invest in its core markets and reduces the Company’s debt.
“We are thrilled to announce the acquisition of select iAnthus Arizona assets, a transformational step for us in Arizona. This transaction is highly accretive and strategically enhances our market position, increasing our Ponderosa Dispensary footprint to seven retail locations with broad geographical coverage,” said Michael O’Brien, CEO of Sonoran Roots. “We are excited to continue providing exceptional cannabis products and experiences to customers in these locations.”
Transaction Details
Pursuant to the Purchase Agreements, iAnthus will sell and Sonoran Roots will acquire, substantially all of the assets related to or used in connection with the Facilities, including but not limited to all cannabis licenses associated with such businesses and related real property (collectively, the “Assets”), together with certain assumed liabilities related to the Assets.
The purchase price (“Purchase Price”) for the Assets is approximately $36.5 million and will consist of approximately $20 million of cash payable at closing, subject to certain adjustments, and a secured promissory note to be issued by Sonoran Roots in the principal amount of $16.5 million (the “Note”). The Note will bear interest at a rate of six percent (6%) per annum compounded annually, with a term of sixty-six (66) months. The proceeds of the Transaction, net of related fees, costs and expenses, are expected to be used for working capital and general corporate purposes, together with the repayment of a portion of the Company’s various secured debt obligations.
The Transaction is expected to close in 1Q2025, subject to customary conditions precedent including the receipt of applicable consents and regulatory approvals.
Ducera Securities, LLC served as the financial advisor to the Company in connection with the Transaction. The Hawkeye Capital Markets team of Beech Hill Securities, Inc. acted as the financial advisor to Sonoran Roots in connection with the Transaction.
All references to currency in this news release are in U.S. dollars.
About iAnthus
iAnthus owns and operates licensed cannabis cultivation, processing and dispensary facilities throughout the United States. For more information, visit www.iAnthus.com.
About Sonoran Roots
Sonoran Roots is a locally owned and operated, vertically integrated cannabis company based in Tempe, AZ. Upon closing the Transaction, the company will operate seven Ponderosa Dispensary retail locations serving Chandler, Flagstaff, Glendale, Mesa, Phoenix, Queen Creek, and Tucson. Production operations include indoor cultivation, processing & extraction, focused on its premium quality Sonoran Roots flower and Canamo Concentrates lines, as well as sales & distribution. For more information, visit www.sonoranroots.com.
Forward Looking Statements Statements in this news release contain forward-looking statements. These forward-looking statements are made on the basis of the current beliefs, expectations and assumptions of management, are not guarantees of performance and are subject to significant risks and uncertainty. These forward-looking statements should, therefore, be considered in light of various important factors, including those set forth in Company’s reports that it files from time to time with the SEC and the Canadian securities regulators which you should review including, but not limited to, the Company’s Annual Report on Form 10-K filed with the SEC. When used in this news release, words such as “will”, “could”, “plan”, “estimate”, “expect”, “intend”, “may”, “potential”, “believe”, “should” and similar expressions, are forward-looking statements. Forward-looking statements may include, without limitation, statements relating to the Transaction, including the anticipated closing date thereof, the receipt of regulatory approvals thereto, the payment of the Purchase Price and use of proceeds, and other statements relating to the Company’s financial performance, business plans and development and results of operations.
These forward-looking statements should not be relied upon as predictions of future events, and the Company cannot assure you that the events or circumstances discussed or reflected in these statements will be achieved or will occur. If such forward- looking statements prove to be inaccurate, the inaccuracy may be material. You should not regard these statements as a representation or warranty by the Company or any other person that it will achieve its objectives and plans in any specified timeframe, or at all. You are cautioned not to place undue reliance on these forward-looking statements, which speak only as of the date of this news release. The Company disclaims any obligation to publicly update or release any revisions to these forward-looking statements, whether as a result of new information, future events or otherwise, after the date of this news release or to reflect the occurrence of unanticipated events, except as required by law.
Neither the Canadian Securities Exchange nor the United States Securities and Exchange Commission has reviewed, approved or disapproved the content of this news release.
Corporate/Media/Investors: Justin Vu, Chief Financial Officer iAnthus Capital Holdings, Inc. 1-646-518-9418 investors@ianthuscapital.com
Over the past few weeks the new US president, Donald Trump, has repeatedly claimed that the United States should “take back” the Panama Canal and that it should assume control of Greenland – one way or another. He has talked of Canada becoming America’s 51st state and now he even wants to “take over” the Gaza Strip to convert it into a “Riviera” on the eastern Mediterranean.
It’s as if the US president believes that his country should be an empire. In this Trump seems to be emulating China’s Xi Jinping and Vladimir Putin of Russia, leaders he has said he admires and who have themselves shown some clear imperial tendencies in recent years.
Under Putin, Russia has supported secessionist regions, such as Transnistria and Abkhazia, fought wars in Georgia and Ukraine and actively interfered in the affairs of Syria and assorted African countries. In 2022 Russia even launched a full-scale invasion of Ukraine, claiming that Ukraine was historically inseparable from Russia, but that hostile western influences were trying to destroy that unity.
China, meanwhile, has militarised a number of small uninhabited islands in the South China Sea. It has built 27 installations on disputed islands in the Spratly and Paracel island group that are also claimed by other countries including Vietnam, Taiwan, the Philippines and Malaysia. This has prompted a flurry of development, as other countries in the region have raced to establish their own footholds in the disputed, but very resource-rich, region.
Beijing also maintains its claim over Taiwan, which it says is an inalienable part of China which it wants to “come home”.
Empires and nation states
Most people assumed that the age of empires had been relegated to the dustbin of history. But this is by no means a straightforward proposition. Until relatively recently, the rise and fall of empires had dominated much of recorded history. Nation-states only appeared at the end of the 18th century. And as those states rose to prominence many too displayed imperial inclinations.
So the US, fresh from throwing off the yoke of the British empire, wasted little time in expanding its borders westward, acquiring – whether by conquest or purchase – large swaths of new territory in what effectively turned a small group of east coast states into a continental empire.
Meanwhile other newly minted nation-states such as Italy and Germany also aspired to acquire overseas empires and involved themselves, with varying success, building what turned out to be relatively shortlived colonial empires in Africa and elsewhere.
Most traditional dynastic empires, meanwhile, began to adopt various aspects of the nation-state model, such as conscription, legal equality and political participation. The decades following the second world war are often seen by historians as a period of decolonisation by traditional imperial powers such as Britain and France. But the transition from empire to nation-states was far from smooth. Most imperial governments hoped to transform their empires into more egalitarian commonwealths, while retaining a degree of influence.
This they did with varying degrees of success and often under extreme duress, as with France in Algeria and Vietnam, or under great economic pressure, such as with Britain and India. The real age of the nation-state didn’t begin until the 1960s.
The return of empire?
Today, the world consists of about 200 independent countries, the overwhelming majority nation-states. Nonetheless, one could argue that empires – or at least imperial tendencies – have never totally disappeared. France, for instance, frequently interfered in many of its former colonies in Africa. However, these military interventions were not meant to permanently occupy new territories.
Today, imperial tendencies seem to resurface around the world. The past, however, tends not to repeat itself. Massive wars of conquest or attempts to create new overseas empires are unlikely in the immediate future. Most imperial expansions are currently sought close to home.
What is striking is that Putin, Xi and Trump all use fierce nationalist rhetoric to justify their imperialist designs. Putin, as we have seen, claims the indivisibility of Ukraine and Russia and blames “Nazis” for trying to turn Russia’s sister state towards the west. He used it as a justification for invading Ukraine in February 2022.
Xi, in turn, often maintains that Communist China has finally overcome the century of humiliation, in which the country was the plaything of foreign powers. They both seem to yearn for past imperial greatness. The Russian Federation aims to undo the dissolution of the Soviet Union, communist China looks back to the Qing empire. Interestingly, under its increasingly authoritarian leader Recep Tayyip Erdoğan, Turkey – another regional power with imperial inclinations – similarly finds inspiration in the Ottoman Empire.
The US case seems to be more complex, but in fact is very similar. Thus, Trump argues that the Panama Canal, which has long been administered by the US, was foolishly returned to Panama by Jimmy Carter and claims that it is now controlled by China. He will, he says, return it to the US.
Trump also refers to America’s “Manifest Destiny”, the 19th-century belief that American settlers were destined to expand to the Pacific coast. These days his aspirations are northwards rather than to the west. The president also wants to plant the US flag on Mars, taking his imperial dreams into outer space.
If the US joins China and Russia in violating recognised borders, the international, rights-based order could be in danger. The signs are not very positive. Taking steps to illegally annex territories could blow up the entire international edifice.
Eric Storm does not work for, consult, own shares in or receive funding from any company or organisation that would benefit from this article, and has disclosed no relevant affiliations beyond their academic appointment.
TORONTO, Feb. 07, 2025 (GLOBE NEWSWIRE) — Middlefield is pleased to announce that two of its core ETFs—Middlefield Real Estate Dividend ETF (MREL) and Middlefield Sustainable Global Dividend ETF (MDIV)—have been awarded the Fundata FundGrade A+® rating for 2024. This prestigious distinction is given to Canadian investment funds that have consistently delivered the best risk-adjusted returns over an entire calendar year.
“Receiving the FundGrade A+® award for both MREL and MDIV reflects our disciplined investment approach and commitment to delivering consistent, risk-adjusted returns for our investors,” said Dean Orrico, President and CEO of Middlefield. “Real estate and dividend-focused equities help create more resilient portfolios by providing reliable income streams, managing risk, and enhancing stability. In light of the current uncertain market backdrop, we believe these strategies are excellent diversifiers for investor portfolios, and we look forward to building on this success in 2025.”
About the Award-Winning Funds
Middlefield Real Estate Dividend ETF (MREL) MREL is designed to provide investors with stable monthly income and long-term capital appreciation by investing in a diversified portfolio of high-quality global real estate companies. Since its launch in 2011, the fund has taken an actively managed approach, leveraging the expertise of Middlefield’s investment team to identify leading real estate businesses with growing cash flows and increasing dividends. For the second consecutive year, MREL has earned the FundGrade A+® rating, reinforcing its consistent performance and ability to navigate various market cycles.
Middlefield Sustainable Global Dividend ETF (MDIV) MDIV is a high-conviction portfolio of global companies diversified across geographies and industries, with a focus on businesses that pay and grow dividends. Since its inception in 2013, the fund has prioritized large capitalization, high quality companies with durable business models and a strong track record of earnings growth.
Additionally, Middlefield’s flagship North American fund, Income Plus Class, finished 2024 with a Fundata FundGrade A® rating, which is awarded to funds that substantially outperform their peers, ranking in the top 10% of their category.
For any questions or media requests, please contact Cassandra Coleman at ccoleman@middlefield.com.
Founded in 1979, Middlefield is a Toronto-based asset manager specializing in innovative investment solutions. Over the past 45 years, we have developed a disciplined investment process across six core equity income mandates: Real Estate, Healthcare, Innovation, Infrastructure, Energy, and Diversified Income. We focus on high-quality companies with strong cash flow and dividend growth potential.
Our investment solutions include award-winning ETFs and Mutual Funds, designed to meet the needs of advisors, institutional investors, and individual investors. Backed by a dedicated team, we strive to deliver superior returns through expertise and disciplined portfolio management.
Disclosure: FundGrade A+® is used with permission from Fundata Canada Inc., all rights reserved. The annual FundGrade A+® Awards are presented by Fundata Canada Inc. to recognize the “best of the best” among Canadian investment funds. The FundGrade A+® calculation is supplemental to the monthly FundGrade ratings and is calculated at the end of each calendar year. The FundGrade rating system evaluates funds based on their risk-adjusted performance, measured by Sharpe Ratio, Sortino Ratio, and Information Ratio. The score for each ratio is calculated individually, covering all time periods from 2 to 10 years. The scores are then weighted equally in calculating a monthly FundGrade. The top 10% of funds earn an A Grade; the next 20% of funds earn a B Grade; the next 40% of funds earn a C Grade; the next 20% of funds receive a D Grade; and the lowest 10% of funds receive an E Grade. To be eligible, a fund must have received a FundGrade rating every month in the previous year. The FundGrade A+® uses a GPA-style calculation, where each monthly FundGrade from “A” to “E” receives a score from 4 to 0, respectively. A fund’s average score for the year determines its GPA. Any fund with a GPA of 3.5 or greater is awarded a FundGrade A+® Award. For more information, see www.FundGradeAwards.com. Although Fundata makes every effort to ensure the accuracy and reliability of the data contained herein, the accuracy is not guaranteed by Fundata.
Performance for Funds: Middlefield Real Estate Dividend ETF (MREL) won the 2024 FundGrade A+® in the Real Estate Equity Category, out of 29 funds. The FundGrade A+® performance start date was 12/31/2014 and the FundGrade A+® performance end date was 12/31/2024. Performance for the fund for the period ended December 31, 2024 is as follows: 7.0% (1 year), -3.4% (3 years), 3.4% (5 years), 6.3% (10 years) and since inception 7.2% (since inception – April 20, 2011). Middlefield Sustainable Global Dividend ETF (MDIV) won the 2024 FundGrade A+® in the Global Dividend & Income Equity Category, out of 39 funds. The FundGrade A+® performance start date was 12/31/2014 and the FundGrade A+® performance end date was 12/31/2024. Performance for the fund for the period ended December 31, 2024 is as follows: 43.7% (1 year), 13.1% (3 years), 14.0% (5 years), 11.8% (10 years) and since inception 12.6% (since inception – March 22, 2013).
Disclaimer: Please consult your advisor and read the prospectus document before investing. There may be commissions, trailing commissions, management fees and expenses associated with ETF investments. The indicated rates of return are the historical annual compounded total returns including changes in unit value and reinvestment of all distributions and does not take into account sales, redemption, distribution or optional charges or income taxes payable by any securityholder that would have reduced returns. ETFs are not guaranteed, their values change frequently and past performance may not be repeated.
HOUSTON, Feb. 07, 2025 (GLOBE NEWSWIRE) — Plains All American Pipeline, L.P. (Nasdaq: PAA) and Plains GP Holdings (Nasdaq: PAGP) today reported fourth-quarter and full-year 2024 results, announced 2025 guidance and provided the following highlights:
2024 Results
Fourth-quarter and full-year 2024 Net income attributable to PAA of $36 million and $772 million, respectively, and 2024 Net cash provided by operating activities of $726 million and $2.49 billion, respectively
Delivered strong fourth-quarter and full-year 2024 Adjusted EBITDA attributable to PAA above the top-end of guidance with $729 million and $2.78 billion, respectively
Generated full-year 2024 Adjusted Free Cash Flow (excluding changes in Assets & Liabilities; including impact from legal settlements) of $1.17 billion and exited the year with leverage at 3.0x
Net income for the quarter includes the impact of a $225 million charge resulting from the write-off of a receivable for Line 901 insurance proceeds and $140 million of non-cash charges related to the write-down of two U.S. NGL terminals
Efficient Growth Initiatives
Closed all three previously announced bolt-on acquisitions for approximately $670 million net to PAA, including the acquisition of Ironwood Midstream Energy
Closed on previously announced purchase of approximately 12.7 million units, or 18%, of its Series A Preferred Units for a purchase price of approximately $330 million
Continue pursuing a long runway of synergistic and strong return bolt-on opportunities across the asset footprint
2025 Outlook
Expect full-year 2025 Adjusted EBITDA attributable to PAA of $2.80 – $2.95 billion
Announced distribution increase of $0.25 per unit payable February 14, 2025, representing a 20% aggregate increase in the annualized distribution versus 2024 levels (new annual distribution of $1.52 per unit)
In January, successfully raised $1 billion in aggregate senior unsecured notes at 5.95% due 2035
Anticipate leverage ratio to be at or below the low-end of leverage target range of 3.25x to 3.75x, continuing to provide significant balance sheet optionality and flexibility
Expect to generate approximately $1.15 billion of Adjusted Free Cash Flow (excluding changes in Assets & Liabilities), which is reduced by approximately $580 million for previously announced bolt-on transactions closed in the first quarter
Remain focused on disciplined capital investments, anticipating full-year 2025 Growth Capital of +/- $400 million and Maintenance Capital of +/- $240 million net to PAA
“We continue delivering strong financial and operating results and increasing return of capital to unitholders. As evidenced by our recently announced acquisitions, we have the ability to leverage our integrated asset base and financial strength to drive accretive transactions and deliver value to our customers and unitholders,” said Plains Chairman and CEO Willie Chiang. “We remain confident entering 2025, with strong operational momentum and focus on executing our efficient growth strategy. Our strong performance and positive outlook combined with the contribution from recent bolt-on acquisitions continues driving meaningful cash flow and underpins increasing returns to unitholders all while maintaining capital discipline and financial flexibility.”
Plains All American Pipeline
Summary Financial Information (unaudited) (in millions, except per unit data)
Three Months Ended December 31,
%
Twelve Months Ended December 31,
%
GAAP Results
2024
2023
Change
2024
2023
Change
Net income attributable to PAA
$
36
$
312
(88
)%
$
772
$
1,230
(37
)%
Diluted net income/(loss) per common unit
$
(0.04
)
$
0.35
(111
)%
$
0.73
$
1.40
(48
)%
Diluted weighted average common units outstanding
704
701
—
%
702
699
—
%
Net cash provided by operating activities
$
726
$
1,011
(28
)%
$
2,490
$
2,727
(9
)%
Distribution per common unit declared for the period
$
0.3800
$
0.3175
20
%
$
1.3325
$
1.1200
19
%
Three Months Ended December 31,
%
Twelve Months Ended December 31,
%
Non-GAAP Results(1)
2024
2023
Change
2024
2023
Change
Adjusted net income attributable to PAA
$
357
$
355
1
%
$
1,318
$
1,250
5
%
Diluted adjusted net income per common unit
$
0.42
$
0.42
—
%
$
1.51
$
1.42
6
%
Adjusted EBITDA
$
867
$
875
(1
)%
$
3,326
$
3,167
5
%
Adjusted EBITDA attributable to PAA (2)
$
729
$
737
(1
)%
$
2,779
$
2,711
3
%
Implied DCF per common unit and common unit equivalent
Adjusted Free Cash Flow after Distributions (Excluding Changes in Assets & Liabilities) (3)
$
(152
)
$
150
**
$
28
$
615
(95
)%
**
Indicates that variance as a percentage is not meaningful.
(1)
See the section of this release entitled “Non-GAAP Financial Measures and Selected Items Impacting Comparability” and the tables attached hereto for information regarding our Non-GAAP financial measures, including their reconciliation to the most directly comparable measures as reported in accordance with GAAP, and certain selected items that PAA believes impact comparability of financial results between reporting periods.
(2)
Excludes amounts attributable to noncontrolling interests in the Plains Oryx Permian Basin LLC joint venture, Cactus II Pipeline LLC and Red River Pipeline LLC.
(3)
Fourth-quarter and full-year 2024 Adjusted Free Cash Flow (Excluding Changes in Assets & Liabilities) includes the negative impact of a $225 million charge resulting from the write-off of a receivable for Line 901 insurance proceeds.
Summary of Selected Financial Data by Segment (unaudited) (in millions)
Segment Adjusted EBITDA
Crude Oil
NGL
Three Months Ended December 31, 2024
$
569
$
154
Three Months Ended December 31, 2023
$
563
$
169
Percentage change in Segment Adjusted EBITDA versus 2023 period
1
%
(9
)%
Segment Adjusted EBITDA
Crude Oil
NGL
Twelve Months Ended December 31, 2024
$
2,276
$
480
Twelve Months Ended December 31, 2023
$
2,163
$
522
Percentage change in Segment Adjusted EBITDA versus 2023 period
5
%
(8
)%
Fourth-quarter 2024 Crude Oil Segment Adjusted EBITDA increased 1% versus comparable 2023 results primarily due to higher tariff volumes on our pipelines, tariff escalations and contributions from acquisitions. These items were partially offset by fewer market-based opportunities, as well as an increase in estimated costs for long-term environmental remediation obligations.
Fourth-quarter 2024 NGL Segment Adjusted EBITDA decreased 9% versus comparable 2023 results primarily due to lower weighted average frac spreads in the fourth quarter of 2024.
Plains GP Holdings
PAGP owns an indirect non-economic controlling interest in PAA’s general partner and an indirect limited partner interest in PAA. As the control entity of PAA, PAGP consolidates PAA’s results into its financial statements, which is reflected in the condensed consolidating balance sheet and income statement tables attached hereto.
Conference Call and Webcast Instructions
PAA and PAGP will hold a joint conference call at 9:00 a.m. CT on Friday, February 7, 2025 to discuss fourth-quarter performance and related items.
To access the internet webcast, please go to https://edge.media-server.com/mmc/p/xp2zqt6q/.
Alternatively, the webcast can be accessed on our website at https://ir.plains.com/news-events/events-presentations. Following the live webcast, an audio replay will be available on our website and will be accessible for a period of 365 days. Slides will be posted prior to the call at the above referenced website.
Non-GAAP Financial Measures and Selected Items Impacting Comparability
To supplement our financial information presented in accordance with GAAP, management uses additional measures known as “non-GAAP financial measures” in its evaluation of past performance and prospects for the future and to assess the amount of cash that is available for distributions, debt repayments, common equity repurchases and other general partnership purposes. The primary additional measures used by management are Adjusted EBITDA, Adjusted EBITDA attributable to PAA, Implied Distributable Cash Flow (“DCF”), Adjusted Free Cash Flow and Adjusted Free Cash Flow after Distributions.
Our definition and calculation of certain non-GAAP financial measures may not be comparable to similarly-titled measures of other companies. Adjusted EBITDA, Adjusted EBITDA attributable to PAA, Implied DCF and certain other non-GAAP financial performance measures are reconciled to Net Income, and Adjusted Free Cash Flow, Adjusted Free Cash Flow after Distributions and certain other non-GAAP financial liquidity measures are reconciled to Net Cash Provided by Operating Activities (the most directly comparable measures as reported in accordance with GAAP) for the historical periods presented in the tables attached to this release, and should be viewed in addition to, and not in lieu of, our Consolidated Financial Statements and accompanying notes. In addition, we encourage you to visit our website at www.plains.com (in particular the section under “Financial Information” entitled “Non-GAAP Reconciliations” within the Investor Relations tab), which presents a reconciliation of our commonly used non-GAAP and supplemental financial measures. We do not reconcile non-GAAP financial measures on a forward-looking basis as it is impractical to do so without unreasonable effort.
Non-GAAP Financial Performance Measures
Adjusted EBITDA is defined as earnings before (i) interest expense, (ii) income tax (expense)/benefit, (iii) depreciation and amortization (including our proportionate share of depreciation and amortization, including write-downs related to cancelled projects and impairments, of unconsolidated entities), (iv) gains and losses on asset sales, asset impairments and other, net, (v) gains and losses on investments in unconsolidated entities and (vi) interest income on promissory notes by and among PAA and certain Plains entities, and (vii) adjusted for certain selected items impacting comparability. Adjusted EBITDA attributable to PAA excludes the portion of Adjusted EBITDA that is attributable to noncontrolling interests.
Management believes that the presentation of Adjusted EBITDA, Adjusted EBITDA attributable to PAA and Implied DCF provides useful information to investors regarding our performance and results of operations because these measures, when used to supplement related GAAP financial measures, (i) provide additional information about our core operating performance and ability to fund distributions to our unitholders through cash generated by our operations and (ii) provide investors with the same financial analytical framework upon which management bases financial, operational, compensation and planning/budgeting decisions. We also present these and additional non-GAAP financial measures, including adjusted net income attributable to PAA and basic and diluted adjusted net income per common unit, as they are measures that investors, rating agencies and debt holders have indicated are useful in assessing us and our results of operations. These non-GAAP financial performance measures may exclude, for example, (i) charges for obligations that are expected to be settled with the issuance of equity instruments, (ii) gains and losses on derivative instruments that are related to underlying activities in another period (or the reversal of such adjustments from a prior period), gains and losses on derivatives that are either related to investing activities (such as the purchase of linefill) or purchases of long-term inventory, and inventory valuation adjustments, as applicable, (iii) long-term inventory costing adjustments, (iv) items that are not indicative of our core operating results and/or (v) other items that we believe should be excluded in understanding our core operating performance. These measures may be further adjusted to include amounts related to deficiencies associated with minimum volume commitments whereby we have billed the counterparties for their deficiency obligation and such amounts are recognized as deferred revenue in “Other current liabilities” in our Consolidated Financial Statements. We also adjust for amounts billed by our equity method investees related to deficiencies under minimum volume commitments. Such amounts are presented net of applicable amounts subsequently recognized into revenue. Furthermore, the calculation of these measures contemplates tax effects as a separate reconciling item, where applicable. We have defined all such items as “selected items impacting comparability.” Due to the nature of the selected items, certain selected items impacting comparability may impact certain non-GAAP financial measures, referred to as adjusted results, but not impact other non-GAAP financial measures. We do not necessarily consider all of our selected items impacting comparability to be non-recurring, infrequent or unusual, but we believe that an understanding of these selected items impacting comparability is material to the evaluation of our operating results and prospects.
Although we present selected items impacting comparability that management considers in evaluating our performance, you should also be aware that the items presented do not represent all items that affect comparability between the periods presented. Variations in our operating results are also caused by changes in volumes, prices, exchange rates, mechanical interruptions, acquisitions, divestitures, investment capital projects and numerous other factors. These types of variations may not be separately identified in this release, but will be discussed, as applicable, in management’s discussion and analysis of operating results in our Annual Report on Form 10-K.
Non-GAAP Financial Liquidity Measures
Management uses the non-GAAP financial liquidity measures Adjusted Free Cash Flow and Adjusted Free Cash Flow after Distributions to assess the amount of cash that is available for distributions, debt repayments, common equity repurchases and other general partnership purposes. Adjusted Free Cash Flow is defined as Net Cash Provided by Operating Activities, less Net Cash Provided by/(Used in) Investing Activities, which primarily includes acquisition, investment and maintenance capital expenditures, investments in unconsolidated entities and the impact from the purchase and sale of linefill, net of proceeds from the sales of assets and further impacted by distributions to and contributions from noncontrolling interests and proceeds from the issuance of related party notes. Adjusted Free Cash Flow is further reduced by cash distributions paid to our preferred and common unitholders to arrive at Adjusted Free Cash Flow after Distributions.
We also present these measures and additional non-GAAP financial liquidity measures as they are measures that investors have indicated are useful. We present the Adjusted Free Cash Flow (Excluding Changes in Assets & Liabilities) for use in assessing our underlying business liquidity and cash flow generating capacity excluding fluctuations caused by timing of when amounts earned or incurred were collected, received or paid from period to period. Adjusted Free Cash Flow (Excluding Changes in Assets & Liabilities) is defined as Adjusted Free Cash Flow excluding the impact of “Changes in assets and liabilities, net of acquisitions” on our Condensed Consolidated Statements of Cash Flows. Adjusted Free Cash Flow (Excluding Changes in Assets & Liabilities) is further reduced by cash distributions paid to our preferred and common unitholders to arrive at Adjusted Free Cash Flow after Distributions (Excluding Changes in Assets & Liabilities).
PLAINS ALL AMERICAN PIPELINE, L.P. AND SUBSIDIARIES FINANCIAL SUMMARY (unaudited)
CONDENSED CONSOLIDATED STATEMENTS OF OPERATIONS (in millions, except per unit data)
Three Months Ended December 31,
Twelve Months Ended December 31,
2024
2023
2024
2023
REVENUES
$
12,402
$
12,698
$
50,073
$
48,712
COSTS AND EXPENSES
Purchases and related costs
11,227
11,558
45,560
44,531
Field operating costs (1)
578
363
1,768
1,425
General and administrative expenses
93
87
381
350
Depreciation and amortization
258
273
1,026
1,048
(Gains)/losses on asset sales, asset impairments and other, net
159
(9
)
160
(152
)
Total costs and expenses
12,315
12,272
48,895
47,202
OPERATING INCOME
87
426
1,178
1,510
OTHER INCOME/(EXPENSE)
Equity earnings in unconsolidated entities
154
92
452
369
Gain on investments in unconsolidated entities, net
15
—
15
28
Interest expense, net (2)
(112
)
(97
)
(430
)
(386
)
Other income, net (2)
20
17
65
102
INCOME BEFORE TAX
164
438
1,280
1,623
Current income tax expense (3)
(52
)
(41
)
(195
)
(145
)
Deferred income tax benefit
7
2
28
24
NET INCOME
119
399
1,113
1,502
Net income attributable to noncontrolling interests
(83
)
(87
)
(341
)
(272
)
NET INCOME ATTRIBUTABLE TO PAA
$
36
$
312
$
772
$
1,230
NET INCOME/(LOSS) PER COMMON UNIT:
Net income/(loss) allocated to common unitholders — Basic and Diluted
$
(27
)
$
248
$
514
$
976
Basic and diluted weighted average common units outstanding
704
701
702
699
Basic and diluted net income/(loss) per common unit
$
(0.04
)
$
0.35
$
0.73
$
1.40
(1)
Field operating costs include $225 million and $345 million for the three and twelve months ended December 31, 2024, respectively, resulting from adjustments related to the Line 901 incident that occurred in May 2015, including the write-off of a receivable for Line 901 insurance proceeds in the fourth quarter of 2024 and settlements in the third quarter of 2024.
(2)
PAA and certain Plains entities have issued promissory notes by and among such entities to facilitate financing. “Interest expense, net” and “Other income, net” each include $17 million and $48 million for the three and twelve months ended December 31, 2024, respectively, related to interest on such notes. These amounts offset and do not impact Net Income or Non-GAAP metrics such as Adjusted EBITDA, Implied DCF and Adjusted Free Cash Flow.
(3)
The increase in current income tax expense for the 2024 periods was largely associated with Canadian withholding tax on dividends from our Canadian entities to other Plains entities driven by timing of dividend payments.
PLAINS ALL AMERICAN PIPELINE, L.P. AND SUBSIDIARIES FINANCIAL SUMMARY (unaudited)
CONDENSED CONSOLIDATED BALANCE SHEET DATA (in millions)
December 31, 2024
December 31, 2023
ASSETS
Current assets (including Cash and cash equivalents of $348 and $450, respectively)
$
4,802
$
4,913
Property and equipment, net
15,424
15,782
Investments in unconsolidated entities
2,811
2,820
Intangible assets, net
1,677
1,875
Linefill
968
976
Long-term operating lease right-of-use assets, net
332
313
Long-term inventory
280
265
Other long-term assets, net
268
411
Total assets
$
26,562
$
27,355
LIABILITIES AND PARTNERS’ CAPITAL
Current liabilities
$
4,950
$
5,003
Senior notes, net
7,141
7,242
Other long-term debt, net
72
63
Long-term operating lease liabilities
313
274
Other long-term liabilities and deferred credits
990
1,041
Total liabilities
13,466
13,623
Partners’ capital excluding noncontrolling interests
9,813
10,422
Noncontrolling interests
3,283
3,310
Total partners’ capital
13,096
13,732
Total liabilities and partners’ capital
$
26,562
$
27,355
DEBT CAPITALIZATION RATIOS (in millions)
December 31, 2024
December 31, 2023
Short-term debt
$
408
$
446
Long-term debt
7,213
7,305
Total debt
$
7,621
$
7,751
Long-term debt
$
7,213
$
7,305
Partners’ capital excluding noncontrolling interests
9,813
10,422
Total book capitalization excluding noncontrolling interests (“Total book capitalization”)
$
17,026
$
17,727
Total book capitalization, including short-term debt
$
17,434
$
18,173
Long-term debt-to-total book capitalization
42
%
41
%
Total debt-to-total book capitalization, including short-term debt
44
%
43
%
PLAINS ALL AMERICAN PIPELINE, L.P. AND SUBSIDIARIES FINANCIAL SUMMARY (unaudited)
COMPUTATION OF BASIC AND DILUTED NET INCOME/(LOSS) PER COMMON UNIT(1) (in millions, except per unit data)
Three Months Ended December 31,
Twelve Months Ended December 31,
2024
2023
2024
2023
Basic and Diluted Net Income/(Loss) per Common Unit
Net income attributable to PAA
$
36
$
312
$
772
$
1,230
Distributions to Series A preferred unitholders
(44
)
(44
)
(175
)
(173
)
Distributions to Series B preferred unitholders
(19
)
(20
)
(78
)
(76
)
Amounts allocated to participating securities
(1
)
(1
)
(10
)
(10
)
Other
1
1
5
5
Net income/(loss) allocated to common unitholders
$
(27
)
$
248
$
514
$
976
Basic and diluted weighted average common units outstanding (2) (3)
704
701
702
699
Basic and diluted net income/(loss) per common unit
$
(0.04
)
$
0.35
$
0.73
$
1.40
(1)
We calculate net income/(loss) allocated to common unitholders based on the distributions pertaining to the current period’s net income. After adjusting for the appropriate period’s distributions, the remaining undistributed earnings or excess distributions over earnings, if any, are allocated to common unitholders and participating securities in accordance with the contractual terms of our partnership agreement in effect for the period and as further prescribed under the two-class method.
(2)
The possible conversion of our Series A preferred units was excluded from the calculation of diluted net income/(loss) per common unit for each of the three and twelve months ended December 31, 2024 and 2023 as the effect was antidilutive.
(3)
Our equity-indexed compensation plan awards that contemplate the issuance of common units are considered potentially dilutive unless (i) they become vested only upon the satisfaction of a performance condition and (ii) that performance condition has yet to be satisfied. Equity-indexed compensation plan awards that are deemed to be dilutive are reduced by a hypothetical common unit repurchase based on the remaining unamortized fair value, as prescribed by the treasury stock method in guidance issued by the FASB.
PLAINS ALL AMERICAN PIPELINE, L.P. AND SUBSIDIARIES FINANCIAL SUMMARY (unaudited)
CONDENSED CONSOLIDATED CASH FLOW DATA (in millions)
Twelve Months Ended December 31, 2024
2024
2023
CASH FLOWS FROM OPERATING ACTIVITIES
Net income
$
1,113
$
1,502
Reconciliation of net income to net cash provided by operating activities:
Depreciation and amortization
1,026
1,048
(Gains)/losses on asset sales, asset impairments and other, net
160
(152
)
Deferred income tax benefit
(28
)
(24
)
Change in fair value of Preferred Distribution Rate Reset Option
—
(58
)
Equity earnings in unconsolidated entities
(452
)
(369
)
Distributions on earnings from unconsolidated entities
505
458
Gain on investments in unconsolidated entities, net
(15
)
(28
)
Other
107
156
Changes in assets and liabilities, net of acquisitions
74
194
Net cash provided by operating activities
2,490
2,727
CASH FLOWS FROM INVESTING ACTIVITIES
Net cash used in investing activities (1)
(1,504
)
(702
)
CASH FLOWS FROM FINANCING ACTIVITIES
Net cash used in financing activities (1)
(1,077
)
(1,976
)
Effect of translation adjustment
(11
)
—
Net increase/(decrease) in cash and cash equivalents and restricted cash
(102
)
49
Cash and cash equivalents and restricted cash, beginning of period
450
401
Cash and cash equivalents and restricted cash, end of period
$
348
$
450
(1)
PAA and certain Plains entities have issued promissory notes by and among such entities to facilitate financing. For the twelve months ended December 31, 2024, “Net cash used in investing activities” includes a cash outflow of $629 million associated with our investment in related party notes. An equal and offsetting cash inflow associated with our issuance of related party notes is included in “Net cash used in financing activities.”
CAPITAL EXPENDITURES (in millions)
Net to PAA(1)
Consolidated
Three Months Ended December 31,
Twelve Months Ended December 31,
Three Months Ended December 31,
Twelve Months Ended December 31,
2024
2023
2024
2023
2024
2023
2024
2023
Investment capital expenditures:
Crude Oil
$
55
$
75
$
214
$
245
$
80
$
100
$
300
$
334
NGL
41
14
115
65
41
14
115
65
Total Investment capital expenditures
96
89
329
310
121
114
415
399
Maintenance capital expenditures
68
58
242
214
73
63
261
231
$
164
$
147
$
571
$
524
$
194
$
177
$
676
$
630
(1)
Excludes expenditures attributable to noncontrolling interests.
PLAINS ALL AMERICAN PIPELINE, L.P. AND SUBSIDIARIES FINANCIAL SUMMARY (unaudited)
NON-GAAP RECONCILIATIONS (in millions, except per unit and ratio data)
Computation of Basic and Diluted Adjusted Net Income Per Common Unit(1):
Three Months Ended December 31,
Twelve Months Ended December 31,
2024
2023
2024
2023
Basic and Diluted Adjusted Net Income per Common Unit
Net income attributable to PAA
$
36
$
312
$
772
$
1,230
Selected items impacting comparability – Adjusted net income attributable to PAA (2)
321
43
546
20
Adjusted net income attributable to PAA
$
357
$
355
$
1,318
$
1,250
Distributions to Series A preferred unitholders
(44
)
(44
)
(175
)
(173
)
Distributions to Series B preferred unitholders
(19
)
(20
)
(78
)
(76
)
Amounts allocated to participating securities
(1
)
(1
)
(11
)
(10
)
Other
1
1
5
5
Adjusted net income allocated to common unitholders
$
294
$
291
$
1,059
$
996
Basic and diluted weighted average common units outstanding (3) (4)
704
701
702
699
Basic and diluted adjusted net income per common unit
$
0.42
$
0.42
$
1.51
$
1.42
(1)
We calculate adjusted net income allocated to common unitholders based on the distributions pertaining to the current period’s net income. After adjusting for the appropriate period’s distributions, the remaining undistributed earnings or excess distributions over earnings, if any, are allocated to the common unitholders and participating securities in accordance with the contractual terms of our partnership agreement in effect for the period and as further prescribed under the two-class method.
(2)
See the “Selected Items Impacting Comparability” table for additional information.
(3)
The possible conversion of our Series A preferred units was excluded from the calculation of diluted adjusted net income per common unit for each of the three and twelve months ended December 31, 2024 and 2023 as the effect was antidilutive.
(4)
Our equity-indexed compensation plan awards that contemplate the issuance of common units are considered potentially dilutive unless (i) they become vested only upon the satisfaction of a performance condition and (ii) that performance condition has yet to be satisfied. Equity-indexed compensation plan awards that are deemed to be dilutive are reduced by a hypothetical common unit repurchase based on the remaining unamortized fair value, as prescribed by the treasury stock method in guidance issued by the FASB.
Net Income/(Loss) Per Common Unit to Adjusted Net Income Per Common Unit Reconciliation:
Three Months Ended December 31,
Twelve Months Ended December 31,
2024
2023
2024
2023
Basic and diluted net income/(loss) per common unit
$
(0.04
)
$
0.35
$
0.73
$
1.40
Selected items impacting comparability per common unit (1)
0.46
0.07
0.78
0.02
Basic and diluted adjusted net income per common unit
$
0.42
$
0.42
$
1.51
$
1.42
(1)
See the “Selected Items Impacting Comparability” and the “Computation of Basic and Diluted Adjusted Net Income/(Loss) Per Common Unit” tables for additional information.
PLAINS ALL AMERICAN PIPELINE, L.P. AND SUBSIDIARIES FINANCIAL SUMMARY (unaudited)
Net Income to Adjusted EBITDA attributable to PAA and Implied DCF Reconciliation:
Three Months Ended December 31,
Twelve Months Ended December 31,
2024
2023
2024
2023
Net Income
$
119
$
399
$
1,113
$
1,502
Interest expense, net of certain items (1)
95
97
382
386
Income tax expense
45
39
167
121
Depreciation and amortization
258
273
1,026
1,048
(Gains)/losses on asset sales, asset impairments and other, net
159
(9
)
160
(152
)
Gain on investments in unconsolidated entities, net
(15
)
—
(15
)
(28
)
Depreciation and amortization of unconsolidated entities (2)
Adjusted EBITDA attributable to noncontrolling interests
(138
)
(138
)
(547
)
(456
)
Adjusted EBITDA attributable to PAA
$
729
$
737
$
2,779
$
2,711
Adjusted EBITDA
$
867
$
875
$
3,326
$
3,167
Interest expense, net of certain non-cash items (4)
(92
)
(92
)
(365
)
(367
)
Maintenance capital
(73
)
(63
)
(261
)
(231
)
Investment capital of noncontrolling interests (5)
(24
)
(24
)
(86
)
(87
)
Current income tax expense
(52
)
(41
)
(195
)
(145
)
Distributions from unconsolidated entities in excess of/(less than) adjusted equity earnings (6)
—
(15
)
11
(37
)
Distributions to noncontrolling interests (7)
(114
)
(97
)
(425
)
(333
)
Implied DCF
$
512
$
543
$
2,005
$
1,967
Preferred unit cash distributions paid (7)
(63
)
(64
)
(254
)
(241
)
Implied DCF Available to Common Unitholders
$
449
$
479
$
1,751
$
1,726
Weighted Average Common Units Outstanding
704
701
702
699
Weighted Average Common Units and Common Unit Equivalents
775
772
773
770
Implied DCF per Common Unit (8)
$
0.64
$
0.68
$
2.49
$
2.47
Implied DCF per Common Unit and Common Unit Equivalent (9)
$
0.64
$
0.68
$
2.49
$
2.46
Cash Distribution Paid per Common Unit
$
0.3175
$
0.2675
$
1.2700
$
1.0700
Common Unit Cash Distributions (7)
$
223
$
188
$
891
$
748
Common Unit Distribution Coverage Ratio
2.01x
2.55x
1.97x
2.31x
Implied DCF Excess
$
226
$
291
$
860
$
978
(1)
Represents “Interest expense, net” as reported on our Condensed Consolidated Statements of Operations, net of interest income associated with promissory notes by and among PAA and certain Plains entities.
(2)
Adjustment to exclude our proportionate share of depreciation and amortization expense (including write-downs related to cancelled projects and impairments) of unconsolidated entities.
(3)
See the “Selected Items Impacting Comparability” table for additional information.
(4)
Amount excludes certain non-cash items impacting interest expense such as amortization of debt issuance costs and terminated interest rate swaps.
(5)
Investment capital expenditures attributable to noncontrolling interests that reduce Implied DCF available to PAA common unitholders.
(6)
Comprised of cash distributions received from unconsolidated entities less equity earnings in unconsolidated entities (adjusted for our proportionate share of depreciation and amortization, including write-downs related to cancelled projects and impairments, and selected items impacting comparability of unconsolidated entities).
(7)
Cash distributions paid during the period presented.
(8)
Implied DCF Available to Common Unitholders for the period divided by the weighted average common units outstanding for the period.
(9)
Implied DCF Available to Common Unitholders for the period, adjusted for Series A preferred unit cash distributions paid, divided by the weighted average common units and common unit equivalents outstanding for the period. Our Series A preferred units are convertible into common units, generally on a one-for-one basis and subject to customary anti-dilution adjustments, in whole or in part, subject to certain minimum conversion amounts.
PLAINS ALL AMERICAN PIPELINE, L.P. AND SUBSIDIARIES FINANCIAL SUMMARY (unaudited)
Net Income Per Common Unit to Implied DCF Per Common Unit and Common Unit Equivalent Reconciliation:
Three Months Ended December 31,
Twelve Months Ended December 31,
2024
2023
2024
2023
Basic net income/(loss) per common unit
$
(0.04
)
$
0.35
$
0.73
$
1.40
Reconciling items per common unit (1) (2)
0.68
0.33
1.76
1.07
Implied DCF per common unit
$
0.64
$
0.68
$
2.49
$
2.47
Basic net income/(loss) per common unit
$
(0.04
)
$
0.35
$
0.73
$
1.40
Reconciling items per common unit and common unit equivalent (1) (3)
0.68
0.33
1.76
1.06
Implied DCF per common unit and common unit equivalent
$
0.64
$
0.68
$
2.49
$
2.46
(1)
Represents adjustments to Net Income to calculate Implied DCF Available to Common Unitholders. See the “Net Income to Adjusted EBITDA attributable to PAA and Implied DCF Reconciliation” table for additional information.
(2)
Based on weighted average common units outstanding for the period of 704 million, 701 million, 702 million and 699 million, respectively.
(3)
Based on weighted average common units outstanding for the period, as well as weighted average Series A preferred units outstanding of 71 million for each of the periods presented.
PLAINS ALL AMERICAN PIPELINE, L.P. AND SUBSIDIARIES FINANCIAL SUMMARY (unaudited)
Net Cash Provided by Operating Activities to Non-GAAP Financial Liquidity Measures Reconciliation:
Three Months Ended December 31,
Twelve Months Ended December 31,
2024
2023
2024
2023
Net cash provided by operating activities
$
726
$
1,011
$
2,490
$
2,727
Adjustments to reconcile Net cash provided by operating activities to Adjusted Free Cash Flow:
Net cash used in investing activities (1)
(264
)
(257
)
(1,504
)
(702
)
Cash contributions from noncontrolling interests
17
53
57
106
Cash distributions paid to noncontrolling interests (2)
(114
)
(97
)
(425
)
(333
)
Proceeds from the issuance of related party notes (1)
—
—
629
—
Adjusted Free Cash Flow (3)
$
365
$
710
$
1,247
$
1,798
Cash distributions (4)
(286
)
(252
)
(1,145
)
(989
)
Adjusted Free Cash Flow after Distributions (3)(5)
$
79
$
458
$
102
$
809
Three Months Ended December 31,
Twelve Months Ended December 31,
2024
2023
2024
2023
Adjusted Free Cash Flow (3)
$
365
$
710
$
1,247
$
1,798
Changes in assets and liabilities, net of acquisitions (6)
Adjusted Free Cash Flow after Distributions (Excluding Changes in Assets & Liabilities) (7)(8)
$
(152
)
$
150
$
28
$
615
(1)
PAA and certain Plains entities have issued promissory notes by and among such entities to facilitate financing. “Proceeds from the issuance of related party notes” has an equal and offsetting cash outflow associated with our investment in related party notes, which is included as a component of “Net cash used in investing activities.”
(2)
Cash distributions paid during the period presented.
(3)
Management uses the non-GAAP financial liquidity measures Adjusted Free Cash Flow and Adjusted Free Cash Flow after Distributions to assess the amount of cash that is available for distributions, debt repayments, common equity repurchases and other general partnership purposes. Adjusted Free Cash Flow after Distributions shortages, if any, may be funded from previously established reserves, cash on hand or from borrowings under our credit facilities or commercial paper program.
(4)
Cash distributions paid to preferred and common unitholders during the period.
(5)
Excess Adjusted Free Cash Flow after Distributions is retained to establish reserves for future distributions, capital expenditures, debt reduction and other partnership purposes. Adjusted Free Cash Flow after Distributions shortages may be funded from previously established reserves, cash on hand or from borrowings under our credit facilities or commercial paper program.
(6)
See the “Condensed Consolidated Cash Flow Data” table.
(7)
Management uses the non-GAAP financial liquidity measures Adjusted Free Cash Flow (Excluding Changes in Assets & Liabilities) and Adjusted Free Cash Flow after Distributions (Excluding Changes in Assets & Liabilities) to assess the underlying business liquidity and cash flow generating capacity excluding fluctuations caused by timing of when amounts earned or incurred were collected, received or paid from period to period.
(8)
Fourth-quarter and full-year 2024 Adjusted Free Cash Flow (Excluding Changes in Assets & Liabilities) includes the negative impact of a $225 million charge resulting from the write-off of a receivable for Line 901 insurance proceeds.
PLAINS ALL AMERICAN PIPELINE, L.P. AND SUBSIDIARIES FINANCIAL SUMMARY (unaudited)
SELECTED ITEMS IMPACTING COMPARABILITY (in millions)
Three Months Ended December 31,
Twelve Months Ended December 31,
2024
2023
2024
2023
Selected Items Impacting Comparability:(1)
Derivative activities and inventory valuation adjustments (2)
$
(6
)
$
43
$
(85
)
$
(101
)
Long-term inventory costing adjustments (3)
17
(62
)
9
(35
)
Deficiencies under minimum volume commitments, net (4)
Selected items impacting comparability – Adjusted net income attributable to PAA
$
(321
)
$
(43
)
$
(546
)
$
(20
)
(1)
Certain of our non-GAAP financial measures may not be impacted by each of the selected items impacting comparability. See the “Net Income to Adjusted EBITDA attributable to PAA and Implied DCF Reconciliation” and “Computation of Basic and Diluted Adjusted Net Income Per Common Unit” table for additional details on how these selected items impacting comparability affect such measures.
(2)
We use derivative instruments for risk management purposes and our related processes include specific identification of hedging instruments to an underlying hedged transaction. Although we identify an underlying transaction for each derivative instrument we enter into, there may not be an accounting hedge relationship between the instrument and the underlying transaction. In the course of evaluating our results, we identify differences in the timing of earnings from the derivative instruments and the underlying transactions and exclude the related gains and losses in determining adjusted results such that the earnings from the derivative instruments and the underlying transactions impact adjusted results in the same period. In addition, we exclude gains and losses on derivatives that are related to (i) investing activities, such as the purchase of linefill, and (ii) purchases of long-term inventory. We also exclude the impact of corresponding inventory valuation adjustments, as applicable. For applicable periods, we excluded gains and losses from the mark-to-market of the embedded derivative associated with the Preferred Distribution Rate Reset Option of our Series A preferred units.
(3)
We carry crude oil and NGL inventory that is comprised of minimum working inventory requirements in third-party assets and other working inventory that is needed for our commercial operations. We consider this inventory necessary to conduct our operations and we intend to carry this inventory for the foreseeable future. Therefore, we classify this inventory as long-term on our balance sheet and do not hedge the inventory with derivative instruments (similar to linefill in our own assets). We treat the impact of changes in the average cost of the long-term inventory (that result from fluctuations in market prices) and write-downs of such inventory that result from price declines as a selected item impacting comparability.
(4)
We, and certain of our equity method investees, have certain agreements that require counterparties to deliver, transport or throughput a minimum volume over an agreed upon period. Substantially all of such agreements were entered into with counterparties to economically support the return on capital expenditure necessary to construct the related asset. Some of these agreements include make-up rights if the minimum volume is not met. We record a receivable from the counterparty in the period that services are provided or when the transaction occurs, including amounts for deficiency obligations from counterparties associated with minimum volume commitments. If a counterparty has a make-up right associated with a deficiency, we defer the revenue attributable to the counterparty’s make-up right and subsequently recognize the revenue at the earlier of when the deficiency volume is delivered or shipped, when the make-up right expires or when it is determined that the counterparty’s ability to utilize the make-up right is remote. We include the impact of amounts billed to counterparties for their deficiency obligation, net of applicable amounts subsequently recognized into revenue or equity earnings, as a selected item impacting comparability. We believe the inclusion of the contractually committed revenues associated with that period is meaningful to investors as the related asset has been constructed, is standing ready to provide the committed service and the fixed operating costs are included in the current period results.
(5)
Our total equity-indexed compensation expense includes expense associated with awards that will be settled in units and awards that will be settled in cash. The awards that will be settled in units are included in our diluted net income per unit calculation when the applicable performance criteria have been met. We consider the compensation expense associated with these awards as a selected item impacting comparability as the dilutive impact of the outstanding awards is included in our diluted net income per unit calculation, as applicable. The portion of compensation expense associated with awards that will be settled in cash is not considered a selected item impacting comparability.
(6)
During the periods presented, there were fluctuations in the value of the Canadian dollar to the U.S. dollar, resulting in the realization of foreign exchange gains and losses on the settlement of foreign currency transactions as well as the revaluation of monetary assets and liabilities denominated in a foreign currency. The associated gains and losses are not integral to our results and were thus classified as a selected item impacting comparability.
(7)
Includes costs recognized during the period related to the Line 901 incident that occurred in May 2015. For the 2024 periods, includes the write-off of a receivable for Line 901 insurance proceeds in the fourth quarter of 2024 and the impact of settlements in the third quarter of 2024.
(8)
Includes expenses associated with the Rattler Permian Transaction.
(9)
For the 2024 periods, primarily includes non-cash charges related to the write-down of two U.S. NGL terminals. For the twelve months ended December 31, 2023 primarily includes gains related to the sale of our Keyera Fort Saskatchewan facility.
PLAINS ALL AMERICAN PIPELINE, L.P. AND SUBSIDIARIES FINANCIAL SUMMARY (unaudited)
SELECTED FINANCIAL DATA BY SEGMENT (in millions)
Three Months Ended December 31, 2024
Three Months Ended December 31, 2023
Crude Oil
NGL
Crude Oil
NGL
Revenues (1)
$
11,959
$
535
$
12,187
$
623
Purchases and related costs (1)
(11,019
)
(300
)
(11,306
)
(364
)
Field operating costs (2)(3)
(503
)
(75
)
(274
)
(89
)
Segment general and administrative expenses (2) (4)
(74
)
(19
)
(68
)
(19
)
Equity earnings in unconsolidated entities
154
—
92
—
Other segment items: (5)
Depreciation and amortization of unconsolidated entities
26
—
20
—
Derivative activities and inventory valuation adjustments
(16
)
22
(52
)
9
Long-term inventory costing adjustments
(9
)
(8
)
58
4
Deficiencies under minimum volume commitments, net
(41
)
—
8
—
Equity-indexed compensation expense
8
—
8
—
Foreign currency revaluation
(4
)
(1
)
18
5
Line 901 incident
225
—
10
—
Segment amounts attributable to noncontrolling interests (6)
(137
)
—
(138
)
—
Segment Adjusted EBITDA
$
569
$
154
$
563
$
169
Maintenance capital expenditures
$
48
$
25
$
39
$
24
(1)
Includes intersegment amounts.
(2)
Field operating costs and Segment general and administrative expenses include equity-indexed compensation expense.
(3)
Field operating costs for the three months ended December 31, 2024 include higher expenses related to (i) $225 million resulting from the write-off of a receivable for Line 901 insurance proceeds and (ii) an increase in estimated costs for long-term environmental remediation obligations.
(4)
Segment general and administrative expenses reflect direct costs attributable to each segment and an allocation of other expenses to the segments. The proportional allocations by segment require judgment by management and are based on the business activities that exist during each period.
(5)
Represents adjustments utilized by our CODM in the evaluation of segment results. Many of these adjustments are also considered selected items impacting comparability when calculating consolidated non-GAAP financial measures such as Adjusted EBITDA. See the “Selected Items Impacting Comparability” table for additional discussion.
(6)
Reflects amounts attributable to noncontrolling interests in the Permian JV, Cactus II Pipeline LLC and Red River Pipeline LLC.
PLAINS ALL AMERICAN PIPELINE, L.P. AND SUBSIDIARIES FINANCIAL SUMMARY (unaudited)
SELECTED FINANCIAL DATA BY SEGMENT (in millions)
Twelve Months Ended December 31, 2024
Twelve Months Ended December 31, 2023
Crude Oil
NGL
Crude Oil
NGL
Revenues (1)
$
48,720
$
1,724
$
47,174
$
1,935
Purchases and related costs (1)
(45,033
)
(898
)
(43,805
)
(1,123
)
Field operating costs (2)(3)
(1,440
)
(328
)
(1,053
)
(372
)
Segment general and administrative expenses (2) (4)
(298
)
(83
)
(271
)
(79
)
Equity earnings in unconsolidated entities
452
—
369
—
Other segment items: (5)
Depreciation and amortization of unconsolidated entities
84
—
87
—
Derivative activities and inventory valuation adjustments
5
80
17
142
Long-term inventory costing adjustments
1
(10
)
22
13
Deficiencies under minimum volume commitments, net
(31
)
—
12
—
Equity-indexed compensation expense
36
—
35
1
Foreign currency revaluation
(22
)
(5
)
19
5
Line 901 incident
345
—
10
—
Transaction-related expenses
—
—
1
—
Segment amounts attributable to noncontrolling interests (6)
(543
)
—
(454
)
—
Segment Adjusted EBITDA
$
2,276
$
480
$
2,163
$
522
Maintenance capital expenditures
$
183
$
78
$
145
$
86
(1)
Includes intersegment amounts.
(2)
Field operating costs and Segment general and administrative expenses include equity-indexed compensation expense.
(3)
Field operating costs for the twelve months ended December 31, 2024 include higher expenses related to (i) $225 million resulting from the write-off of a receivable for Line 901 insurance proceeds, (ii) $120 million associated with settlements related to the Line 901 incident that occurred in May 2015 and (iii) an increase in estimated costs for long-term environmental remediation obligations.
(4)
Segment general and administrative expenses reflect direct costs attributable to each segment and an allocation of other expenses to the segments. The proportional allocations by segment require judgment by management and are based on the business activities that exist during each period.
(5)
Represents adjustments utilized by our CODM in the evaluation of segment results. Many of these adjustments are also considered selected items impacting comparability when calculating consolidated non-GAAP financial measures such as Adjusted EBITDA. See the “Selected Items Impacting Comparability” table for additional discussion.
(6)
Reflects amounts attributable to noncontrolling interests in the Permian JV, Cactus II Pipeline LLC and Red River Pipeline LLC.
PLAINS ALL AMERICAN PIPELINE, L.P. AND SUBSIDIARIES FINANCIAL SUMMARY (unaudited)
OPERATING DATA BY SEGMENT
Three Months Ended December 31,
Twelve Months Ended December 31,
2024
2023
2024
2023
Crude Oil Segment Volumes
Crude oil pipeline tariff (by region) (1)
Permian Basin (2)
6,846
6,710
6,731
6,356
South Texas / Eagle Ford (2)
421
411
403
410
Mid-Continent (2)
478
503
506
507
Gulf Coast (2)
214
250
218
260
Rocky Mountain (2)
461
452
474
372
Western
259
237
256
214
Canada
349
340
346
341
Total crude oil pipeline tariff (1) (2)
9,028
8,903
8,934
8,460
Commercial crude oil storage capacity (2) (3)
72
72
72
72
Crude oil lease gathering purchases (1)
1,661
1,518
1,586
1,452
NGL Segment Volumes(1)
NGL fractionation
138
127
132
115
NGL pipeline tariff
224
188
213
180
Propane and butane sales
127
125
92
86
(1)
Average volumes in thousands of barrels per day calculated as the total volumes (attributable to our interest for assets owned by unconsolidated entities or through undivided joint interests) for the period divided by the number of days in the period. Volumes associated with assets acquired during the period represent total volumes for the number of days we actually owned the assets divided by the number of days in the period.
(2)
Includes volumes (attributable to our interest) from assets owned by unconsolidated entities.
(3)
Average monthly capacity in millions of barrels calculated as total volumes for the period divided by the number of months in the period.
PLAINS ALL AMERICAN PIPELINE, L.P. AND SUBSIDIARIES FINANCIAL SUMMARY (unaudited)
NON-GAAP SEGMENT RECONCILIATIONS (in millions)
Supplemental Adjusted EBITDA attributable to PAA Reconciliation:
Three Months Ended December 31,
Twelve Months Ended December 31,
2024
2023
2024
2023
Crude Oil Segment Adjusted EBITDA
$
569
$
563
$
2,276
$
2,163
NGL Segment Adjusted EBITDA
154
169
480
522
Adjusted other income, net (1)
6
5
23
26
Adjusted EBITDA attributable to PAA (2)
$
729
$
737
$
2,779
$
2,711
(1)
Represents “Other income, net” as reported on our Condensed Consolidated Statements of Operations, excluding interest income on promissory notes by and among PAA and certain Plains entities, as well as other income, net attributable to noncontrolling interests, adjusted for selected items impacting comparability. See the “Selected Items Impacting Comparability” table for additional information.
(2)
See the “Net Income to Adjusted EBITDA attributable to PAA and Implied DCF Reconciliation” table for reconciliation to Net Income.
PLAINS GP HOLDINGS AND SUBSIDIARIES FINANCIAL SUMMARY (unaudited)
CONDENSED CONSOLIDATING STATEMENTS OF OPERATIONS (in millions, except per share data)
Three Months Ended December 31, 2024
Three Months Ended December 31, 2023
Consolidating
Consolidating
PAA
Adjustments(1)
PAGP
PAA
Adjustments(1)
PAGP
REVENUES
$
12,402
$
—
$
12,402
$
12,698
$
—
$
12,698
COSTS AND EXPENSES
Purchases and related costs
11,227
—
11,227
11,558
—
11,558
Field operating costs
578
—
578
363
—
363
General and administrative expenses
93
1
94
87
1
88
Depreciation and amortization
258
—
258
273
—
273
(Gains)/losses on asset sales, asset impairments and other, net
159
—
159
(9
)
—
(9
)
Total costs and expenses
12,315
1
12,316
12,272
1
12,273
OPERATING INCOME
87
(1
)
86
426
(1
)
425
OTHER INCOME/(EXPENSE)
Equity earnings in unconsolidated entities
154
—
154
92
—
92
Gain on investments in unconsolidated entities, net
15
—
15
—
—
—
Interest expense, net
(112
)
17
(95
)
(97
)
—
(97
)
Other income, net
20
(17
)
3
17
—
17
INCOME BEFORE TAX
164
(1
)
163
438
(1
)
437
Current income tax expense
(52
)
—
(52
)
(41
)
—
(41
)
Deferred income tax (expense)/benefit
7
(2
)
5
2
(16
)
(14
)
NET INCOME
119
(3
)
116
399
(17
)
382
Net income attributable to noncontrolling interests
(83
)
(44
)
(127
)
(87
)
(243
)
(330
)
NET INCOME/(LOSS) ATTRIBUTABLE TO PAGP
$
36
$
(47
)
$
(11
)
$
312
$
(260
)
$
52
Basic and diluted weighted average Class A shares outstanding
197
196
Basic and diluted net income/(loss) per Class A share
$
(0.05
)
$
0.27
(1)
Represents the aggregate consolidating adjustments necessary to produce consolidated financial statements for PAGP.
PLAINS GP HOLDINGS AND SUBSIDIARIES FINANCIAL SUMMARY (unaudited)
CONDENSED CONSOLIDATING STATEMENTS OF OPERATIONS (in millions, except per share data)
Twelve Months Ended December 31, 2024
Twelve Months Ended December 31, 2023
Consolidating
Consolidating
PAA
Adjustments(1)
PAGP
PAA
Adjustments(1)
PAGP
REVENUES
$
50,073
$
—
$
50,073
$
48,712
$
—
$
48,712
COSTS AND EXPENSES
Purchases and related costs
45,560
—
45,560
44,531
—
44,531
Field operating costs
1,768
—
1,768
1,425
—
1,425
General and administrative expenses
381
6
387
350
6
356
Depreciation and amortization
1,026
—
1,026
1,048
3
1,051
(Gains)/losses on asset sales, asset impairments and other, net
160
—
160
(152
)
—
(152
)
Total costs and expenses
48,895
6
48,901
47,202
9
47,211
OPERATING INCOME
1,178
(6
)
1,172
1,510
(9
)
1,501
OTHER INCOME/(EXPENSE)
Equity earnings in unconsolidated entities
452
—
452
369
—
369
Gain on investments in unconsolidated entities, net
15
—
15
28
—
28
Interest expense, net
(430
)
48
(382
)
(386
)
—
(386
)
Other income, net
65
(48
)
17
102
—
102
INCOME BEFORE TAX
1,280
(6
)
1,274
1,623
(9
)
1,614
Current income tax expense
(195
)
—
(195
)
(145
)
—
(145
)
Deferred income tax (expense)/benefit
28
(37
)
(9
)
24
(68
)
(44
)
NET INCOME
1,113
(43
)
1,070
1,502
(77
)
1,425
Net income attributable to noncontrolling interests
(341
)
(626
)
(967
)
(272
)
(955
)
(1,227
)
NET INCOME ATTRIBUTABLE TO PAGP
$
772
$
(669
)
$
103
$
1,230
$
(1,032
)
$
198
Basic and diluted weighted average Class A shares outstanding
197
195
Basic and diluted net income per Class A share
$
0.52
$
1.01
(1)
Represents the aggregate consolidating adjustments necessary to produce consolidated financial statements for PAGP.
PLAINS GP HOLDINGS AND SUBSIDIARIES FINANCIAL SUMMARY (unaudited)
CONDENSED CONSOLIDATING BALANCE SHEET DATA (in millions)
December 31, 2024
December 31, 2023
Consolidating
Consolidating
PAA
Adjustments(1)
PAGP
PAA
Adjustments(1)
PAGP
ASSETS
Current assets
$
4,802
$
(26
)
$
4,776
$
4,913
$
3
$
4,916
Property and equipment, net
15,424
—
15,424
15,782
—
15,782
Investments in unconsolidated entities
2,811
—
2,811
2,820
—
2,820
Intangible assets, net
1,677
—
1,677
1,875
—
1,875
Deferred tax asset
—
1,220
1,220
—
1,239
1,239
Linefill
968
—
968
976
—
976
Long-term operating lease right-of-use assets, net
332
—
332
313
—
313
Long-term inventory
280
—
280
265
—
265
Other long-term assets, net
268
—
268
411
—
411
Total assets
$
26,562
$
1,194
$
27,756
$
27,355
$
1,242
$
28,597
LIABILITIES AND PARTNERS’ CAPITAL
Current liabilities
$
4,950
$
(26
)
$
4,924
$
5,003
$
2
$
5,005
Senior notes, net
7,141
—
7,141
7,242
—
7,242
Other long-term debt, net
72
—
72
63
—
63
Long-term operating lease liabilities
313
—
313
274
—
274
Other long-term liabilities and deferred credits
990
—
990
1,041
—
1,041
Total liabilities
13,466
(26
)
13,440
13,623
2
13,625
Partners’ capital excluding noncontrolling interests
9,813
(8,462
)
1,351
10,422
(8,874
)
1,548
Noncontrolling interests
3,283
9,682
12,965
3,310
10,114
13,424
Total partners’ capital
13,096
1,220
14,316
13,732
1,240
14,972
Total liabilities and partners’ capital
$
26,562
$
1,194
$
27,756
$
27,355
$
1,242
$
28,597
(1)
Represents the aggregate consolidating adjustments necessary to produce consolidated financial statements for PAGP.
PLAINS GP HOLDINGS AND SUBSIDIARIES FINANCIAL SUMMARY (unaudited)
COMPUTATION OF BASIC AND DILUTED NET INCOME/(LOSS) PER CLASS A SHARE (in millions, except per share data)
Three Months Ended December 31,
Twelve Months Ended December 31,
2024
2023
2024
2023
Basic and Diluted Net Income/(Loss) per Class A Share
Net income/(loss) attributable to PAGP
$
(11
)
$
52
$
103
$
198
Basic and diluted weighted average Class A shares outstanding
197
196
197
195
Basic and diluted net income/(loss) per Class A share
$
(0.05
)
$
0.27
$
0.52
$
1.01
Forward-Looking Statements
Except for the historical information contained herein, the matters discussed in this release consist of forward-looking statements that involve certain risks and uncertainties that could cause actual results or outcomes to differ materially from results or outcomes anticipated in the forward-looking statements. These risks and uncertainties include, among other things, the following:
general economic, market or business conditions in the United States and elsewhere (including the potential for a recession or significant slowdown in economic activity levels, the risk of persistently high inflation and supply chain issues, the impact of global public health events, such as pandemics, on demand and growth, and the timing, pace and extent of economic recovery) that impact (i) demand for crude oil, drilling and production activities and therefore the demand for the midstream services we provide and (ii) commercial opportunities available to us;
declines in global crude oil demand and/or crude oil prices or other factors that correspondingly lead to a significant reduction of North American crude oil and NGL production (whether due to reduced producer cash flow to fund drilling activities or the inability of producers to access capital, or both, the unavailability of pipeline and/or storage capacity, the shutting-in of production by producers, government-mandated pro-ration orders, or other factors), which in turn could result in significant declines in the actual or expected volume of crude oil and NGL shipped, processed, purchased, stored, fractionated and/or gathered at or through the use of our assets and/or the reduction of the margins we can earn or the commercial opportunities that might otherwise be available to us;
fluctuations in refinery capacity and other factors affecting demand for various grades of crude oil and NGL and resulting changes in pricing conditions or transportation throughput requirements;
unanticipated changes in crude oil and NGL market structure, grade differentials and volatility (or lack thereof);
the effects of competition and capacity overbuild in areas where we operate, including downward pressure on rates, volumes and margins, contract renewal risk and the risk of loss of business to other midstream operators who are willing or under pressure to aggressively reduce transportation rates in order to capture or preserve customers;
the successful operation of joint ventures and joint operating arrangements we enter into from time to time, whether relating to assets operated by us or by third parties, and the successful integration and future performance of acquired assets or businesses;
the availability of, and our ability to consummate, acquisitions, divestitures, joint ventures or other strategic opportunities and realize benefits therefrom;
environmental liabilities, litigation or other events that are not covered by an indemnity, insurance or existing reserves;
negative societal sentiment regarding the hydrocarbon energy industry and the continued development and consumption of hydrocarbons, which could influence consumer preferences and governmental or regulatory actions that adversely impact our business;
the occurrence of a natural disaster, catastrophe, terrorist attack (including eco-terrorist attacks) or other event that materially impacts our operations, including cyber or other attacks on our or our service providers’ electronic and computer systems;
weather interference with business operations or project construction, including the impact of extreme weather events or conditions (including wildfires and drought);
the impact of current and future laws, rulings, legislation, governmental regulations, executive orders, trade policies, tariffs, accounting standards and statements, and related interpretations that (i) prohibit, restrict or regulate the development of oil and gas resources and the related infrastructure on lands dedicated to or served by our pipelines, (ii) negatively impact our ability to develop, operate or repair midstream assets, or (iii) otherwise negatively impact our business or increase our exposure to risk;
negative impacts on production levels in the Permian Basin or elsewhere due to issues associated with (or laws, rules or regulations relating to) hydraulic fracturing and related activities (including wastewater injection or disposal), including earthquakes, subsidence, expansion or other issues;
the pace of development of natural gas or other infrastructure and its impact on expected crude oil production growth in the Permian Basin;
the refusal or inability of our customers or counterparties to perform their obligations under their contracts with us (including commercial contracts, asset sale agreements and other agreements), whether justified or not and whether due to financial constraints (such as reduced creditworthiness, liquidity issues or insolvency), market constraints, legal constraints (including governmental orders or guidance), the exercise of contractual or common law rights that allegedly excuse their performance (such as force majeure or similar claims) or other factors;
loss of key personnel and inability to attract and retain new talent;
disruptions to futures markets for crude oil, NGL and other petroleum products, which may impair our ability to execute our commercial or hedging strategies;
the effectiveness of our risk management activities;
shortages or cost increases of supplies, materials or labor;
maintenance of our credit ratings and ability to receive open credit from our suppliers and trade counterparties;
our inability to perform our obligations under our contracts, whether due to non-performance by third parties, including our customers or counterparties, market constraints, third-party constraints, supply chain issues, legal constraints (including governmental orders or guidance), or other factors or events;
the incurrence of costs and expenses related to unexpected or unplanned capital or maintenance expenditures, third-party claims or other factors;
failure to implement or capitalize, or delays in implementing or capitalizing, on investment capital projects, whether due to permitting delays, permitting withdrawals or other factors;
tightened capital markets or other factors that increase our cost of capital or limit our ability to obtain debt or equity financing on satisfactory terms to fund additional acquisitions, investment capital projects, working capital requirements and the repayment or refinancing of indebtedness;
the amplification of other risks caused by volatile or closed financial markets, capital constraints, liquidity concerns and inflation;
the use or availability of third-party assets upon which our operations depend and over which we have little or no control;
the currency exchange rate of the Canadian dollar to the United States dollar;
inability to recognize current revenue attributable to deficiency payments received from customers who fail to ship or move more than minimum contracted volumes until the related credits expire or are used;
significant under-utilization of our assets and facilities;
increased costs, or lack of availability, of insurance;
fluctuations in the debt and equity markets, including the price of our units at the time of vesting under our long-term incentive plans;
risks related to the development and operation of our assets; and
other factors and uncertainties inherent in the transportation, storage, terminalling and marketing of crude oil, as well as in the processing, transportation, fractionation, storage and marketing of NGL as discussed in the Partnerships’ filings with the Securities and Exchange Commission.
About Plains:
PAA is a publicly traded master limited partnership that owns and operates midstream energy infrastructure and provides logistics services for crude oil and natural gas liquids (“NGL”). PAA owns an extensive network of pipeline gathering and transportation systems, in addition to terminalling, storage, processing, fractionation and other infrastructure assets serving key producing basins, transportation corridors and major market hubs and export outlets in the United States and Canada. On average, PAA handles over 8 million barrels per day of crude oil and NGL.
PAGP is a publicly traded entity that owns an indirect, non-economic controlling general partner interest in PAA and an indirect limited partner interest in PAA, one of the largest energy infrastructure and logistics companies in North America.
PAA and PAGP are headquartered in Houston, Texas. For more information, please visit www.plains.com.
LIMERICK, Ireland, Feb. 07, 2025 (GLOBE NEWSWIRE) — kneat.com, inc. (TSX: KSI) (OTCQX: KSIOF), a leader in digitizing and automating validation and quality processes, is pleased to announce that a multinational consumer food and drink producer (“the Company”) has signed a three-year Master Services Agreement (“MSA”) with Kneat to digitize its validation processes.
Headquartered in Europe and operating manufacturing facilities globally, the Company will initially use Kneat for Equipment and Computer System Validation within a specialized health sciences division with over 5,000 employees. The MSA allows the company to scale Kneat to all its affiliate companies and business divisions.
“Today’s announcement highlights that life science applications for Kneat can be found outside traditional life sciences companies, as we bring another consumer products leader into the Kneat community. We are proud to be a part of this Company’s world-class quality effort supporting their pursuit of health, wellness, and nutrition for people around the world.”
– Eddie Ryan, Chief Executive Officer of Kneat
The number of consumer goods companies relying on Kneat has grown over the past several years, as certain products in their portfolios are subject to validation regulatory requirements. Digitizing these processes helps these companies mitigate risk and protect the brands they have been building for years, and positions Kneat to continue adding value to their efforts over the years ahead.
About Kneat
Kneat Solutions provides leading companies in highly regulated industries with unparalleled efficiency in validation and compliance through its digital validation platform Kneat Gx. As an industry leader in customer satisfaction, Kneat boasts an excellent record for implementation, powered by our user-friendly design, expert support, and on-demand training academy. Kneat Gx is an industry-leading digital validation platform that enables highly regulated companies to manage any validation discipline from end-to-end. Kneat Gx is fully ISO 9001 and ISO 27001 certified, fully validated, and 21 CFR Part 11/Annex 11 compliant. Multiple independent customer studies show up to 40% reduction in documentation cycle times, up to 20% faster speed to market, and a higher compliance standard.
Cautionary and Forward-Looking Statements
Except for the statements of historical fact contained herein, certain information presented constitutes “forward-looking information” within the meaning of applicable Canadian securities laws. Such forward-looking information includes, but is not limited to, the relationship between Kneat and the customer, Kneat’s business development activities, the use and implementation timelines of Kneat’s software within the customer’s validation processes, the ability and intent of the customer to scale the use of Kneat’s software within the customer’s organization, and the compliance of Kneat’s platform under regulatory audit and inspection. While such forward-looking statements are expressed by Kneat, as stated in this release, in good faith and believed by Kneat to have a reasonable basis, they are subject to important risks and uncertainties. As a result of these risks and uncertainties, the events predicted in these forward-looking statements may differ materially from actual results or events. These forward-looking statements are not guarantees of future performance, given that they involve risks and uncertainties.
Kneat does not undertake any obligation to release publicly revisions to any forward-looking statement, except as may be required under applicable securities laws. Investors should not assume that any lack of update to a previously issued forward-looking statement constitutes a reaffirmation of that statement. Continued reliance on forward-looking statements is at an investor’s own risk.
“The latest PISA results from 2022 show that Alberta is a world leader in education. Alberta students rank first in financial literacy among Canadian provinces, ahead of Ontario and British Columbia, which tied for second place.
“Alberta students also performed exceptionally well against international competitors in financial literacy. Globally, Alberta students placed first ahead of Denmark, the top-ranked country.
“Alberta’s students’ achievement in financial literacy builds off the previously released 2022 PISA results. Across Canada, Alberta students rank first in science, reading and creative thinking and second in mathematics. Globally, Alberta students rank second only to Singapore in science, reading and creative thinking.
“Ensuring Alberta’s youth can build the financial literacy skills they need to make informed decisions about their finances and their future continues to be a focus for our government.
“That’s why we have invested $5 million to support practical, hands-on financial literacy programming for students from Kindergarten to Grade 12 and our renewed K–6 curriculum that includes a stronger foundation in financial literacy.
“As we look forward, we will continue to develop new curriculum for grades 7–12 and ensure financial literacy is incorporated throughout all grades where appropriate.”
Related information
Programme for International Student Assessment 2022 results
Financial literacy grants
Related news
International success for Alberta students: Minister Nicolaides (Dec. 5, 2023)
Le ministre de l’Éducation, Demetrios Nicolaides, a fait la déclaration suivante sur les derniers résultats du Programme international pour le suivi des acquis des élèves (PISA) de 2022 :
« Les derniers résultats du PISA de 2022 montrent que l’Alberta est un leader mondial en matière d’éducation. Les élèves de l’Alberta se classent au premier rang en matière de littératie financière parmi les provinces canadiennes, devant l’Ontario et la Colombie-Britannique, qui se classent au deuxième rang ex æquo.
Les élèves de l’Alberta ont également obtenu des résultats exceptionnels par rapport à leurs concurrents internationaux en matière de littératie financière. À l’échelle mondiale, les élèves de l’Alberta se classent premiers, devant le Danemark, le pays le mieux classé.
Les résultats des élèves de l’Alberta en matière de littératie financière s’appuient sur les résultats du PISA de 2022 déjà publiés. Au Canada, les élèves de l’Alberta se classent premiers en sciences, en lecture et en pensée créative et deuxièmes en mathématiques. À l’échelle mondiale, les élèves de l’Alberta se classent au deuxième rang, après Singapour, en sciences, lecture et pensée créative.
Veiller à ce que les jeunes de l’Alberta puissent acquérir les compétences en littératie financière dont ils ont besoin pour prendre des décisions éclairées concernant leurs finances et leur avenir continue d’être une priorité pour notre gouvernement.
C’est pour cela que nous avons investi 5 millions de dollars pour soutenir des programmes pratiques de littératie financière pour les élèves de la maternelle à la 12e année, ainsi que notre programme d’études renouvelé de la maternelle à la 6e année, avec une base plus solide en littératie financière.
À l’avenir, nous continuerons d’élaborer de nouveaux programmes pour la 7e à la 12e année et nous veillerons à ce que la littératie financière soit intégrée à tous les niveaux, le cas échéant. »
Renseignements connexes
Résultats du Programme international pour le suivi des acquis des élèves de 2022
Subventions pour la littératie financière
Nouvelles connexes
Réussite internationale pour les élèves de l’Alberta : Ministre Nicolaides (5 décembre 2023)
UK and others regret cancellation of OSCE election observation and call on Tajikistan to engage constructively with ODIHR.
Mr. Chair,
I am delivering this statement on behalf of the following participating States: Iceland, Liechtenstein, Norway, Switzerland, the United Kingdom and my own country Canada.
We thank the European Union for adding this item to the agenda today.
In Istanbul in 1999, participating States committed to invite observers to elections from other participating States, ODIHR, and the OSCE Parliamentary Assembly, and to follow up on ODIHR’s election assessment and recommendations.
In this context, we deeply regret that the authorities of Tajikistan have not accredited OSCE/ODIHR election observers in a timely manner, nor made assurances that they would do so.
This has resulted in the cancellation of the ODIHR Election Observation Mission for the upcoming parliamentary elections and has denied the people of Tajikistan an impartial and independent assessment of the elections.
As ODIHR has stated, host governments need to provide the necessary conditions for the effective and unrestricted operation of election observation missions. Prolonged uncertainty surrounding accreditation undermines the integrity of the process.
Fulfilling these necessary conditions is an integral part of meeting OSCE commitments on the invitation of observers. We regret that not all OSCE participating States have chosen to uphold their commitments in this regard.
We thank ODIHR for its efforts in preparing and deploying the Election Observation Mission to Tajikistan. We fully support ODIHR’s mandate, autonomy and their well-proven and objective election monitoring methodology.
We encourage Tajikistan to engage constructively with ODIHR on previous election recommendations, as well as on ODIHR’s support for meeting OSCE commitments to strengthen democracy and human rights, including on free, fair and genuine elections.
NOT FOR DISTRIBUTION TO U.S. NEWSWIRES OR DISSEMINATION IN THE UNITED STATES
Vancouver, B.C., Feb. 07, 2025 (GLOBE NEWSWIRE) — Dynamite Blockchain Corp. (the “Company” or “Dynamite”) (CSE: KAS) is pleased to announce a non-brokered private placement (the “Offering”) of up to 10,000,000 units of the Company (each, a “Unit”) at a price of $0.10 per Unit, for aggregate gross proceeds of up to $1,000,000. Each Unit will consist of one (1) common share in the capital of the Company (a “Common Share”) and one (1) transferable share purchase warrant (a “Warrant”), each warrant to entitle the holder to purchase one (1) additional Common Share at an exercise price of C$0.20 per Common Share for a period of 24 months following the closing of the Offering, subject to acceleration in the event the Common Shares close above $0.30 for a period of five (5) consecutive trading days.
The Offering will be completed pursuant to the listed issuer financing exemption under Part 5A of National Instrument 45-106 Prospectus Exemptions and therefore the Common Shares underlying the Units issued in the Offering to Canadian subscribers will not be subject to a hold period in accordance with applicable Canadian securities laws. The Warrants underlying the Units issued in the Offering and any Shares issued upon exercise thereof will be subject to contractual restrictions on resale, expiring four-months and one day from the date of issue of the Warrants. There is an offering document related to the Offering (the “Offering Document”) that can be accessed under the Company’s profile at www.sedarplus.ca and at www.dynamiteblock.com. Prospective investors should read the Offering Document before making an investment decision.
The Offering is expected to close on about February 20, 2025, and completion of the Offering is subject to certain conditions including, but not limited to, receiving adequate subscriptions for the Offering and the receipt of all necessary approvals, including the approval of the Canadian Securities Exchange.
Use of Funds
The Company intends to use the net proceeds from the Offering to solidify the Company’s position as a Kaspa-focused public company, by using proceeds towards the purchase of Kaspa coins and further investment into Kaspa mining operations and Kaspa product development. Other uses of the proceeds will be used towards audit fees, legal fees, marketing fees, consulting fees and general working capital, as further set out in the Offering Document.
“By focusing the majority of the proceeds on Kaspa Purchases, Mining Operations and Kaspa Product development, we are strategically positioning ourselves to be on the path to becomethe ‘Kaspa Proxy’ by providing shareholders exposure to Kaspa on the Canadian Securities Exchange,” commented Akshay Sood, CEO of Dynamite Blockchain Corp.
WhyKaspaandWhyNow?
The Company believes that Kaspa is currently critically undervalued, due to the following expected developments:
1.Speed: Kaspa’s Crescendo hardfork (the “Hardfork”) is now expected in only a couple monthsi , an event that the Company expects to allow the Kaspa network to go through a transformational upgrade and enable it to process 10 times as many blocks as it is currently processing todayii;
2.Functionality: The Hardfork update is expected to come just prior to the implementation of smart contract functionalityiii, which the Company expects will take Kaspa’s Layer 1 network to new heights;
3.Scalability: With the two developments above in place, it is expected that Kaspa will not only be faster than Ethereum, Bitcoin and Solanaiv, but also more scalable; and
4.Security: Having higher transaction throughput than compared to its current statev, the Company expects Kaspa will take a further step towards building an extremely secure and decentralized framework that addresses the blockchain trilemma beautifullyvi.
“WiththeupcomingCrescendoHardfork,webelievethatKaspa’svaluepropositionandutility willstrengthenandthatwewillbepoisedtocapitalizeonthistransformation,” continued Mr. Sood.
“We are not just focused on mining or holding Kaspa but on creating a comprehensive ecosystem that fosters diversification, long-term sustainability and adoption,” concluded Mr. Sood.
The securities issued pursuant to the Offering have not, nor will they be registered under the United States Securities Act of 1933, as amended, and may not be offered or sold within the UnitedStatesorto,orfortheaccountorbenefitof,U.S.personsintheabsenceofU.S.registration or an applicable exemption from the U.S. registration requirements. This news release shall not constitute an offer to sell or the solicitation of an offer to buy nor shall there be any sale of the securities in the United States or in any other jurisdiction in which such offer, solicitation or sale would be unlawful.
Dynamite Blockchain is a blockchain technology infrastructure company focused on building a diversified blockchain ecosystem focused on Kaspa.
Forward-Looking Statements
The information in this news release includes certain information and statements about management’s view of future events, expectations, plans, and prospects that constitute forward- looking statements. These statements are based upon assumptions that are subject to risks and uncertainties. Forward-looking statements in this news release include, without limitation, statements respecting: the Offering, the timing thereof and the expected use of proceeds therefrom; the Company’s focus on Kaspa; the Company’s belief that Kaspa is critically undervalued; expectations respecting the Kaspa Crescendo Hardfork and the impact thereof; implementation of smart contract functionality into Kaspa and the impact thereof; the Company’s goal to become a Kaspa Proxy; Kaspa’s value proposition strengthening and the Company being poised to capitalize on that transformation; and the Company’s focus on creating a comprehensive ecosystem for Kaspa that fosters diversification, long-term sustainability and adoption. Although the Company believes that the expectations reflected in forward-looking statements are reasonable, it can give no assurances that the expectations of any forward- looking statement will prove to be correct. Except as required by law, the Company disclaims any intention and assumes no obligation to update or revise any forward-looking statements to reflect actual results, whether as a result of new information, future events, changes in assumptions, changes in factors affecting such forward-looking statements, or otherwise.
The CSE (operated by CNSX Markets Inc.) has neither approved nor disapproved of the contents of this press release.
07 February 2025 – Falcon Oil & Gas Ltd. (TSXV: FO, AIM: FOG) is pleased to announce the completion the Shenandoah S2-2H ST1 (“SS-2H ST1”) stimulation in the Beetaloo Sub-basin, Northern Territory, Australia with Falcon Oil & Gas Australia Limited’s joint venture partner, Tamboran (B2) Pty Limited.
Key Highlights
Successfully completed 35 stages across the 1,671-metre (5,483-feet) horizontal section of the Amungee Member B-shale with the Liberty Energy (NYSE: LBRT) modern stimulation equipment.
Stimulation activities achieved five stages over a 24-hour period on multiple days.
The average proppant intensity was 2,706 pounds per foot (lb/ft) and achieved wellhead injection rates above 100 barrels per minute.
The average stage spacing is 48-metres (~157-feet).
The SS-2H ST1 well will be completed ahead of clean out activities and the commencement of initial flow back and extended production testing.
Further updates on the completion of the Shenandoah South 4H (SS-4H) well will be provided in due course.
Philip O’Quigley, CEO of Falcon commented:
“We are extremely encouraged about the potential of the current stimulation program based on strong gas shows and other data observed whilst drilling. In addition, the experienced US operator, Liberty Energy, have shown the efficiencies they can achieve which will provide us with the greatest opportunity for the best possible outcomes from this stimulation program. We look forward to updating the market on the IP30 flow test results as soon as they become available.” Ends.
CONTACT DETAILS:
Falcon Oil & Gas Ltd.
+353 1 676 8702
Philip O’Quigley, CEO
+353 87 814 7042
Anne Flynn, CFO
+353 1 676 9162
Cavendish Capital Markets Limited(NOMAD & Broker)
Neil McDonald / Adam Rae
+44 131 220 9771
This announcement has been reviewed by Dr. Gábor Bada, Falcon Oil & Gas Ltd’s Technical Advisor. Dr. Bada obtained his geology degree at the Eötvös L. University in Budapest, Hungary and his PhD at the Vrije Universiteit Amsterdam, the Netherlands. He is a member of AAPG.
About Falcon Oil & Gas Ltd.
Falcon Oil & Gas Ltd is an international oil & gas company engaged in the exploration and development of unconventional oil and gas assets, with the current portfolio focused in Australia. Falcon Oil & Gas Ltd is incorporated in British Columbia, Canada and headquartered in Dublin, Ireland.
Falcon Oil & Gas Australia Limited is a c. 98% subsidiary of Falcon Oil & Gas Ltd.
For further information on Falcon Oil & Gas Ltd. Please visit www.falconoilandgas.com
About Beetaloo Joint Venture (EP 76, 98 and 117)
Company
Interest
Falcon Oil & Gas Australia Limited (Falcon Australia)
22.5%
Tamboran (B2) Pty Limited
77.5%
Total
100.0%
Shenandoah South Pilot Project -2 Drilling Space Units – 46,080 acres1
Company
Interest
Falcon Oil & Gas Australia Limited (Falcon Australia)
5.0%
Tamboran (B2) Pty Limited
95.0%
Total
100.0%
1Subject to the completion of the SS2HST1and SS4H wells on the Shenandoah South pad 2.
About Tamboran (B2) Pty Limited Tamboran (B1) Pty Limited (“Tamboran B1”) is the 100% holder of Tamboran (B2) Pty Limited, with Tamboran B1 being a 50:50 joint venture between Tamboran Resources Corporation and Daly Waters Energy, LP.
Tamboran Resources Corporation, is a natural gas company listed on the NYSE (TBN) and ASX (TBN). Tamboran is focused on playing a constructive role in the global energy transition towards a lower carbon future, by developing the significant low CO2 gas resource within the Beetaloo Basin through cutting-edge drilling and completion design technology as well as management’s experience in successfully commercialising unconventional shale in North America.
Bryan Sheffield of Daly Waters Energy, LP is a highly successful investor and has made significant returns in the US unconventional energy sector in the past. He was Founder of Parsley Energy Inc. (“PE”), an independent unconventional oil and gas producer in the Permian Basin, Texas and previously served as its Chairman and CEO. PE was acquired for over US$7 billion by Pioneer Natural Resources Company.
Advisory regarding forward-looking statements Certain information in this press release may constitute forward-looking information. Any statements that are contained in this news release that are not statements of historical fact may be deemed to be forward-looking information. Forward-looking information typically contains statements with words such as “may”, “will”, “should”, “expect”, “intend”, “plan”, “anticipate”, “believe”, “estimate”, “projects”, “dependent”, “consider” “potential”, “scheduled”, “forecast”, “outlook”, “budget”, “hope”, “suggest”, “support” “planned”, “approximately”, “potential” or the negative of those terms or similar words suggesting future outcomes. In particular, forward-looking information in this press release includes, details on the completion of the stimulation of SS-2H ST1; Liberty Energy conducting the stimulation campaign; and commencement of initial flow back and extended production testing and updates on SS-4H.
This information is based on current expectations that are subject to significant risks and uncertainties that are difficult to predict. The risks, assumptions and other factors that could influence actual results include risks associated with fluctuations in market prices for shale gas; risks related to the exploration, development and production of shale gas reserves; general economic, market and business conditions; substantial capital requirements; uncertainties inherent in estimating quantities of reserves and resources; extent of, and cost of compliance with, government laws and regulations and the effect of changes in such laws and regulations; the need to obtain regulatory approvals before development commences; environmental risks and hazards and the cost of compliance with environmental regulations; aboriginal claims; inherent risks and hazards with operations such as mechanical or pipe failure, cratering and other dangerous conditions; potential cost overruns, drilling wells is speculative, often involving significant costs that may be more than estimated and may not result in any discoveries; variations in foreign exchange rates; competition for capital, equipment, new leases, pipeline capacity and skilled personnel; the failure of the holder of licenses, leases and permits to meet requirements of such; changes in royalty regimes; failure to accurately estimate abandonment and reclamation costs; inaccurate estimates and assumptions by management and their joint venture partners; effectiveness of internal controls; the potential lack of available drilling equipment; failure to obtain or keep key personnel; title deficiencies; geo-political risks; and risk of litigation.
Readers are cautioned that the foregoing list of important factors is not exhaustive and that these factors and risks are difficult to predict. Actual results might differ materially from results suggested in any forward-looking statements. Falcon assumes no obligation to update the forward-looking statements, or to update the reasons why actual results could differ from those reflected in the forward-looking statements unless and until required by securities laws applicable to Falcon. Additional information identifying risks and uncertainties is contained in Falcon’s filings with the Canadian securities regulators, which filings are available at www.sedarplus.com, including under “Risk Factors” in the Annual Information Form.
Any references in this news release to initial production rates are useful in confirming the presence of hydrocarbons; however, such rates are not determinative of the rates at which such wells will continue production and decline thereafter and are not necessarily indicative of long-term performance or ultimate recovery. While encouraging, readers are cautioned not to place reliance on such rates in calculating the aggregate production for Falcon. Such rates are based on field estimates and may be based on limited data available at this time.
Neither the TSX Venture Exchange nor its Regulation Services Provider (as that term is defined in the policies of the TSX Venture Exchange) accepts responsibility for the adequacy or accuracy of this release.
Source: United States Senator for Connecticut – Chris Murphy
February 06, 2025
WASHINGTON—U.S. Senators Chris Murphy (D-Conn.), a member of the U.S. Senate Health, Education, Labor, and Pensions Committee, and Richard Blumenthal (D-Conn.) on Thursday joined U.S. Senator Sheldon Whitehouse (D-R.I.) and 15 of their Senate colleagues in reintroducing the No Tax Breaks for Outsourcing Act, legislation that would reverse the Trump tax law’s breaks for offshoring jobs and profits. The announcement comes as President Trump’s 25 percent tariffs on Canada and Mexico remain under negotiation, while Republicans push to expand those offshoring incentives in their reconciliation bill.
The No Tax Breaks for Outsourcing Act would level the playing field for American companies by requiring multinational corporations to pay the same tax rate on profits earned abroad as they do in the United States. The Trump tax law created a special tax rate for offshore profits that is half the domestic rate. Since the law’s passage, studies have found that multinationals have increased foreign, rather than domestic investment. Extending the Trump tax law would mean maintaining this half-off rate, which is otherwise scheduled to slightly increase.
If passed, the senators’ legislation would boost U.S. economic competitiveness by encouraging domestic investment, leveling the playing field for domestic companies, and bringing the U.S. into compliance with the global minimum tax agreement. The Joint Committee on Taxation found that large U.S. multinationals paid an average tax rate of just 7.8 percent the year after the Trump law passed, lower than their foreign competitors. They would still pay less than their competitors with a higher rate on foreign profits. Moreover, with over 140 countries moving to implement the global tax agreement, U.S. and foreign multinationals alike will be subject to the new minimum tax whether the U.S. complies or not. Failure to join, however, will mean the revenue fills foreign coffers instead of the U.S. Treasury.
U.S. Senators Richard Durbin (D-Ill.), Jack Reed (D-R.I.), Tammy Baldwin (D-Wis.), Elizabeth Warren (D-Mass.), Jeff Merkley (D-Ore.), Ed Markey (D-Mass.), Brian Schatz (D-Hawaii), John Fetterman (D-Pa.), Chris Van Hollen (D-Md.), Ruben Gallego (D-Ariz.), Mazie Hirono (D-Hawaii), Martin Heinrich (D-N.M.), Cory Booker (D-N.J.), Tina Smith (D-Minn.), and Tammy Duckworth (D-Ill.) also cosponsored the legislation.
The No Tax Breaks for Outsourcing Act would repeal offshoring incentives by:
Equalizing the tax rate on profits earned abroad to the tax rate on profits earned here at home. The bill would end the preferential tax rate for offshore profits by eliminating the deductions for “global intangible low-tax income (GILTI)” and “foreign-derived intangible income” and applying GILTI on a per-country basis.
Repealing the 10 percent tax exemption on profits earned from certain investments made overseas. In addition to the half-off tax rate on profits earned abroad, the Trump tax law exempts from tax a 10 percent return on tangible investments made overseas, like plants and equipment. The legislation would eliminate the zero-tax rate on certain investments made overseas.
Treating “foreign” corporations that are managed and controlled in the U.S. as domestic corporations. Ugland House in the Cayman Islands is the five-story legal home of over 18,000 companies – many of them actually American companies in disguise. The bill would treat corporations worth $50 million or more and managed and controlled within the U.S. as the American entities they in fact are, and subject them to the same tax as other U.S. taxpayers.
Cracking down on inversions by tightening the definition of expatriated entity. This provisionwould discourage corporations from renouncing their U.S. citizenship. It would deem certain mergers between a U.S. company and a smaller foreign firm to be a U.S. taxpayer, no matter where in the world the new company claims to be headquartered. Specifically, the combined company would continue to be treated as a domestic corporation if the historic shareholders of the U.S. company own more than 50 percent of the new entity.
Combating earnings stripping by restricting the deduction for interest expense for multinational enterprises with excess domestic indebtedness. Some multinational groups reduce or eliminate their U.S. tax bills by concentrating their worldwide debt, and the resulting interest deductions, in U.S. subsidiaries. The bill would disallow interest deduction for U.S. subsidiaries of a multinational corporation where a disproportionate share of the worldwide group’s debt is located in the U.S. entity, a tactic commonly known as “earnings stripping.”
Eliminating tax break for foreign oil and gas extraction income. Oil and gas extraction income earned abroad gets an even further break on the already half-off rate other industries pay on offshore profits.
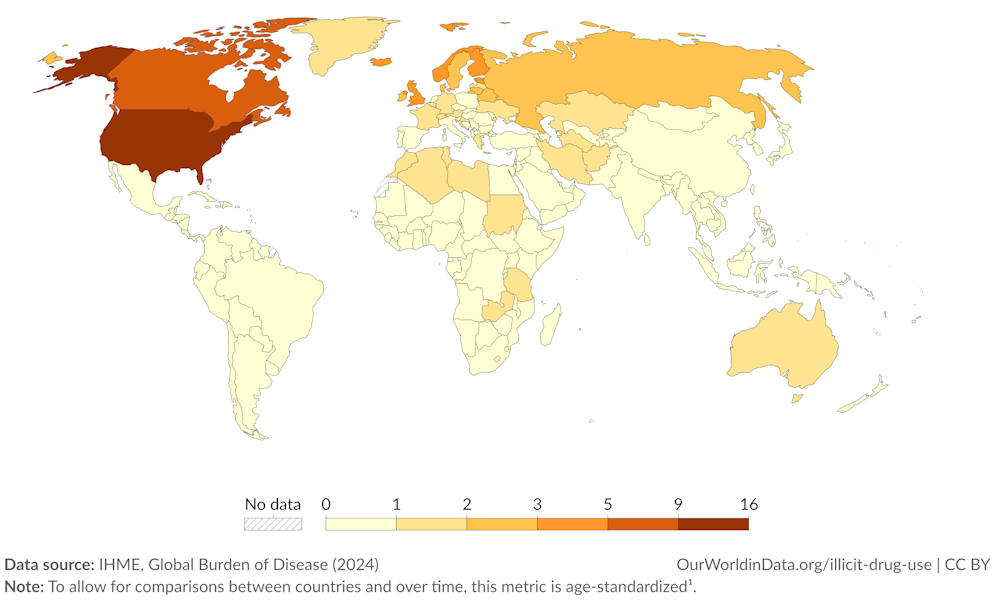