Category: Economics

  • MIL-OSI Economics: Global trade faces setback amid rising tariffs

    Source: World Trade Organization

    The WTO Secretariat’s latest Global Trade Outlook and Statistics report, issued today (16 April), comes at a time of growing uncertainty for the global economy – and with it, a sharp deterioration in the prospects for world trade.

    Following a strong performance in 2024, global trade is now facing headwinds from a surge in tariffs and rising trade policy uncertainty. The volume of world merchandise trade is projected to decline by 0.2 per cent in 2025 – almost three percentage points lower than it would have been without the recent policy shifts. A modest recovery of 2.5 per cent is expected in 2026.

    This marks a notable reversal from forecasts earlier this year, when WTO economists anticipated continued trade expansion, supported by improving macroeconomic conditions.

    There are also important downside risks that could lead to a steeper decline in world trade. These include the possible implementation of the currently suspended “reciprocal tariffs” by the United States, as well as the potential for a broader spillover of trade policy uncertainty to other trading relationships.

    If enacted, reciprocal tariffs would reduce global merchandise trade growth by an additional 0.6 percentage points. A wider spread of trade policy uncertainty could cut growth by a further 0.8 percentage points. Taken together, these risks would lead to a 1.5 per cent decline in world merchandise trade volume in 2025.

    The impact of recent trade policy changes varies sharply across regions.

    According to our current forecast, North America now subtracts 1.7 percentage points from global merchandise trade growth in 2025, turning the overall figure negative. Asia and Europe continue to contribute positively but less than in the baseline “low tariff” scenario, with Asia’s contribution halved to 0.6 percentage points. Meanwhile, the combined contribution of other regions – Africa, the Commonwealth of Independent States (CIS), the Middle East, and South and Central America and the Caribbean – also declines somewhat but remains positive. An important driving force behind these changes is the decoupling between China and the United States, resulting from tariffs that now well exceed 100 per cent.

    The disruption in United States–China trade is also expected to trigger significant trade diversion, raising concerns among other markets about increased competition from China. As trade is redirected, Chinese merchandise exports are projected to rise by between 4 and 9 per cent across all regions outside North America. At the same time, US imports from China are expected to fall sharply in sectors such as textiles, apparel and electrical equipment, creating new export opportunities for other suppliers able to fill the gap. This could open the door for some least-developed countries to increase their exports to the US market.

    Services trade, while not directly subject to tariffs, is also expected to be adversely affected. Declines in goods trade are likely to reduce demand for related services, such as transport and logistics, while broader uncertainty is likely to dampen discretionary spending on travel and to slow investment-related services.

    As a result, the volume of global services trade is now forecast to grow by 4.0 per cent in 2025 and 4.1 per cent in 2026 – well below the baseline projections of 5.1 per cent and 4.8 per cent. These figures are part of a new element in our analysis: for the first time, this report includes projections for commercial services trade in volume terms, complementing our long-standing merchandise trade estimates.

    The broader economic picture is also affected. World GDP is now expected to grow by 2.2 per cent in 2025 – 0.6 percentage points below the baseline prediction – before recovering slightly to reach 2.4 per cent in 2026. The largest impact will again be in North America, where growth is projected to slow by 1.6 percentage points, followed by Asia (down by 0.4 percentage points) and South and Central America and the Caribbean (down by 0.2 percentage points).

    While reciprocal tariffs alone would have a limited effect on global GDP, a wider spread of trade policy uncertainty could nearly double the projected GDP loss, bringing it to 1.3 percentage points below the baseline scenario.

    All of this follows a notably strong year for trade. In 2024, the volume of world merchandise trade grew by 2.9 per cent, and commercial services trade expanded by 6.8 per cent. With global GDP growing 2.8 per cent at market exchange rates, 2024 was the first year since 2017 – excluding the post-COVID-19 rebound – in which merchandise trade growth outpaced GDP growth. In value terms, merchandise exports rose 2 per cent, to US$ 24.43 trillion, and services exports increased by 9 per cent, to US$ 8.69 trillion, supported by strong global demand.

    Although the current outlook is challenging, it is worth recalling that the trajectory of world trade will not be determined by any single economy or bilateral relationship. Much will depend on how the broader international community responds. The fact that 87 per cent of global merchandise trade takes place outside the United States – and that bilateral trade between the United States and China accounts for around 3 per cent – is a reminder of the importance of other trading relationships.

    Open, predictable and cooperative trade policies remain essential – not just for trade itself, but for global economic resilience.

    MIL OSI Economics

  • MIL-OSI Economics: Temporary tariff pause mitigates trade contraction, but strong downside risks persist

    Source: World Trade Organization

    The volume of world merchandise trade is expected to decline by 0.2% in 2025 under current conditions, nearly three percentage points lower than what would have been expected under a “low tariff” baseline scenario, according to the WTO Secretariat’s latest Global Trade Outlook and Statistics report released on 16 April.  This is premised on the tariff situation as of 14 April. Trade could shrink even further, to -1.5% in 2025, if the situation deteriorates.

    Services trade, though not directly subject to tariffs, is also expected to be adversely affected, with the global volume of commercial services trade now forecast to grow by 4.0%, slower than expected.

    Director-General Ngozi Okonjo-Iweala said: “I am deeply concerned by the uncertainty surrounding trade policy, including the US-China stand-off. The recent de-escalation of tariff tensions has temporarily relieved some of the pressure on global trade. However, the enduring uncertainty threatens to act as a brake on global growth, with severe negative consequences for the world, the most vulnerable economies in particular. In the face of this crisis, WTO members have the unprecedented opportunity to inject dynamism into the organization, foster a level-playing field, streamline decision-making, and adapt our agreements to better meet today’s global realities.”

    At the start of the year, the WTO Secretariat expected to see continued expansion of world trade in 2025 and 2026, with merchandise trade growing in line with world GDP and commercial services trade increasing at a faster pace. However, the large number of new tariffs introduced since January prompted WTO economists to reassess the trade situation, resulting in a substantial downgrade to their forecast for merchandise trade and a smaller reduction in their outlook for services trade.

    Risks to the forecast

    Risks to the merchandise trade forecast persist, particularly from the reactivation of the suspended “reciprocal tariffs” by the United States, as well as the spread of trade policy uncertainty that could impact non-US trade relationships. If realized, reciprocal tariffs would reduce global merchandise trade volume growth by 0.6 percentage points in 2025 while spreading trade policy uncertainty could shave off another 0.8 percentage points. Together, reciprocal tariffs and spreading trade policy uncertainty would lead to a 1.5% decline in world merchandise trade in 2025. These scenarios are explored in detail in the Analytical Chapter of the report. Risks to services trade related to the escalation in trade tensions are not currently captured in the forecast.

    “Our simulations show that trade policy uncertainty has a significant dampening effect on trade flows, reducing exports and weakening economic activity,” WTO Chief Economist Ralph Ossa said. “Moreover, tariffs are a policy lever with wide-ranging, and often unintended consequences. In a world of growing trade tensions, a clear-eyed view of those trade-offs is more important than ever.”

    Regional goods trade forecasts

    The latest forecast marks a reversal from 2024, when the volume of world merchandise trade grew 2.9%, while GDP expanded by 2.8%, making 2024 the first year since 2017 (excluding the rebound from the COVID-19 pandemic) where merchandise trade grew faster than output.

    In 2025, the impact of recent tariff measures on merchandise trade is expected to differ sharply across regions.

    Under the current policy landscape, North America is expected to see a 12.6% decline in exports and 9.6% drop in imports in 2025. The region’s performance would subtract 1.7 percentage points from world merchandise trade growth in 2025, turning the overall figure negative. Asia is projected to post modest growth in both exports and imports this year (1.6% for both), along with Europe (1.0% export growth, 1.9% import growth). Both regions’ contributions to world trade growth would remain positive under current policies, albeit smaller than in the baseline low tariff scenario. The collective contribution to world trade growth of other regions would also remain positive, in part due to their importance as producers of energy products, demand for which tends to be stable over the global business cycle.

    The disruption in US-China trade is expected to trigger significant trade diversion, raising concerns among third markets about increased competition from China. Chinese merchandise exports are projected to rise by 4% to 9% across all regions outside North America, as trade is redirected. At the same time, US imports from China are expected to fall sharply in sectors such as textiles, apparel, and electrical equipment, creating new export opportunities for other suppliers able to fill the gap.

    Additionally, the reinstatement of US tariffs could have severe repercussions for export-oriented least-developed countries (LDCs) whose economies are particularly sensitive to external economic shocks due to their concentration of trade on a small number of products as well as their limited resources to deal with setbacks. Under the current situation with the pause on US’ “reciprocal” tariffs, LDCs may benefit from trade diversion as their export structure is similar to China’s, especially in textiles and electronics.

    Commercial services trade

    In 2024, services accounted for 26.4% of global trade based on balance of payments statistics, the highest share since 2005. Rising demand for services and advances in digitalization have helped expand the contribution of services to global trade. In 2024, services trade totalled US$ 8.69 trillion, increasing by 9% and mirroring the growth registered in 2023. This is in sharp contrast to goods trade, which rose by only 2% in value terms in 2024.

    Although the high tariffs are limited to goods, their effects are expected to ripple across the broader economy, including on services trade.

    High tariffs will directly affect the volume of goods traded, leading to weaker demand for freight shipping and logistics services in ports and airports, which account for the bulk of overall transport. International travel, particularly leisure travel, may be the first sector impacted by economic uncertainty, as discretionary spending on trips and accommodations can easily be curtailed. Furthermore, various intermediate services supporting goods trade and other services such as professional, research and development, and information technology services, will likely face declining demand in the current economic climate.

    Most services growth in 2025 will originate from Europe, where exports are expected to grow by 5.0% under current policies. European growth will continue at 4.4% in 2026. Asian economies’ services exports are projected to increase by 4.4% in 2025 and by 5.1% in 2026. Growth in services exports of North America will slow to 1.6% in 2025 but then accelerate to 2.3% in 2026. For the Middle East, services exports are expected to grow by 1.7% in 2025 and 1.0% in 2026. In the Commonwealth of Independent States (CIS), growth of 1.1% in 2025 and of 3.5% in 2026 is anticipated. The outlook for 2025 is subdued for Africa and for South and Central America and the Caribbean, both of which are expected to record declines in 2025.

    The full report is available here.

    Detailed annual, quarterly and monthly trade statistics can be downloaded from the WTO Stats portal. Our interactive user-friendly tools are also available for a more in-depth look at the data: WTO World Trade Statistics, Key Insights and Trends in 2024 and WTO Global Services Trade Data Hub.

    Share

    MIL OSI Economics

  • MIL-OSI Economics: Preview upcoming Dynamics 365 features at Microsoft Business Applications Launch Event

    Source: Microsoft

    Headline: Preview upcoming Dynamics 365 features at Microsoft Business Applications Launch Event

    Adaptation and change are the only constants in business—and the pace is accelerating. To thrive, your business needs the right tools, from AI-powered insights to low-code solutions, designed to help you adapt faster, enhance customer experiences, and boost efficiency.

    Register for the Microsoft Business Applications Launch Event.

    Join us on Wednesday, April 30, 2025, for the Microsoft Business Applications Launch Event, an exclusive first look at groundbreaking innovations coming to Microsoft Dynamics 365, Microsoft Power Platform, and Microsoft Copilot Studio. See firsthand how these new technologies empower your organization to proactively navigate changes and seize new opportunities.

    Event highlights include:

    • Live demonstrations of the latest updates in Dynamics 365, Microsoft Power Platform, and Copilot Studio.
    • Insights from Microsoft leaders on transforming CRM and ERP systems with agents to drive customer experiences and operational agility.
    • Real-world success stories from organizations using Dynamics 365 and Microsoft Power Platform.
    • Interactive Q&A session with product experts.

    During the event you will gain in-depth insights into how customers are adopting what’s new in Dynamics 365 and Microsoft Power Platform.

    Microsoft Dynamics 365 Sales:

    • AI-powered Microsoft Copilot and agents to boost seller productivity
    • Automated research, proactive follow-ups, and prioritized actions
    • Streamlined, intuitive user experiences designed to help sellers close deals faster

    See Dynamics 365 Sales 2025 release wave 1 in action for more.

    Microsoft Dynamics 365 Customer Service:

    • AI-enhanced case and knowledge management with intelligent routing
    • Extended Copilot capabilities for improved productivity
    • Microsoft Dynamics 365 Contact Center enhancements for effortless self-service and faster issue resolution

    See Dynamics 365 Contact Center 2025 release wave 1 in action for more.

    Microsoft Dynamics 365 Finance:

    • Copilot-first experiences streamlining complex tax and compliance management
    • Automated account and bank reconciliations using intelligent agents
    • Advanced analytics and planning tools to drive smarter financial decisions

    See Dynamics 365 Finance 2025 release wave 1 in action for more.

    Microsoft Dynamics 365 Supply Chain Management:

    • Integrated AI, analytics, and automation for improved operational efficiency
    • Enhanced supplier communication and demand planning accuracy
    • Intelligent manufacturing features aligning production data to real-world processes

    See Dynamics 365 Supply Chain Management release wave 1 2025 in action for more.

    Copilot Studio:

    • Create custom autonomous agents tailored to your specific business needs
    • Extend Microsoft 365 Copilot with new embedded capabilities
    • Connect with new conversational channels, including WhatsApp and SharePoint

    See Power Automate 2025 release wave 1 in action for more.

    Catch the wave—Register today

    The Microsoft Business Applications Launch Event streams live on Wednesday, April 30, 2025, starting at 9 AM PST and will also be available on-demand. Register now to stay updated and get helpful resources ahead of the event.

    Microsoft Business Applications Launch Event

    Join us on Wednesday, April 30, 2025.

    MIL OSI Economics

  • MIL-OSI Economics: Samsung Celebrates Debut of Samsung Vision AI TVs with Special Offer

    Source: Samsung

    Samsung Electronics America today announced that the next big thing in television is officially here: Samsung Vision AI1.
    Available across our 2025 lineup – including the Samsung Neo QLED 8K, Neo QLED 4K, OLED, QLED, and The Frame series – Samsung Vision AI redefines the TV viewing experience with AI-enhanced picture quality and sound, plus revolutionary AI-powered experiences.
    Now through May 4th, when you purchase a qualifying 2025 TV or Audio product on Samsung.com, you can receive a Music Frame2 on us – our customizable speaker that plays your favorite music while framing your favorite photo. Or, earn a $100 Samsung credit3 with your purchase of other select 2025 TVs and soundbars.

    “Samsung has led the way with AI integration across our TVs, making all your content look and sound even better,” said Lydia Cho, Head of Product, Home Electronics at Samsung Electronics America. “Yet, picture and sound aren’t the only important factors for shoppers when choosing a TV. They want products that look and sound great, but are also easy to use, with features that simplify daily routines. That’s why, with Samsung Vision AI, we’ll continue to deliver fantastic visuals and immersive audio, while giving you new ways to interact with and experience everything you watch.”

    At the core of Samsung Vision AI are its personalization features, which help you engage more deeply with your content and enjoy TV tailored to you.
    Click to Search4 provides information in real-time, including actor bios and content recommendations, without disrupting the viewing experience.
    Live Translate5 helps you break language barriers and enjoy content in your preferred language. Our AI processor instantly translates closed captions from live broadcasts, in up to seven languages.
    Universal Gestures6lets you pause your show, adjust volume, navigate menus and more through hand gestures while wearing a Galaxy Watch.
    Generative Wallpaper7transforms screens into dynamic, personalized art canvases by generating one-of-a-kind images that match your taste, mood, preference or occasion.

    Beyond personalization, Samsung Vision AI puts Samsung screens at the center of your connected home through further integration with SmartThings.
    Home Insights8helps you keep tabs on your household environment, allowing you to connect and control smart devices right from your screen with daily notifications and a 3D Map View showing every device in your home.
    Pet Care9 and Family Care10use on-device AI to detect a dog barking or a baby crying, alerting you when they need your attention. You also have the option to view real-time video footage of your room through your connected camera – providing peace of mind wherever you are.

    MIL OSI Economics

  • MIL-OSI Economics: Apple surpasses 60 percent reduction in global greenhouse gas emissions

    Source: Apple

    Headline: Apple surpasses 60 percent reduction in global greenhouse gas emissions

    April 16, 2025

    UPDATE

    Apple unveils environmental progress, surpassing 60 percent reduction in global greenhouse gas emissions

    Ahead of Earth Day, Apple hits new milestones in emissions reductions, clean energy, and recycled materials

    Customers are invited to recycle devices in-store with a special offer through May 16

    Apple today announced that the company has surpassed a 60 percent reduction in its global greenhouse gas emissions compared to 2015 levels, as part of its Apple 2030 goal to become carbon neutral across its entire footprint in the next five years. The company achieved several other major environmental milestones, including the use of 99 percent recycled rare earth elements in all magnets and 99 percent recycled cobalt in all Apple-designed batteries.1 Apple shared this and other progress in its annual Environmental Progress Report, published today.

    “We’re incredibly proud of the progress we’re making toward Apple 2030, which touches every part of our business,” said Lisa Jackson, Apple’s vice president of Environment, Policy, and Social Initiatives. “Today, we’re using more clean energy and recycled materials to make our products than ever before, we’re preserving water and preventing waste around the world, and we’re investing big in nature. As we get closer to 2030, the work gets even harder — and we’re meeting the challenge with innovation, collaboration, and urgency.”

    Apple’s 2030 strategy prioritizes cutting greenhouse gas emissions by 75 percent compared with its 2015 baseline year, before applying high-quality carbon credits to balance the remaining emissions. Last year, Apple’s comprehensive efforts to reduce its carbon footprint — including the continued transition of its supply chain to renewable electricity and designing products with more recycled materials — avoided an estimated 41 million metric tons of greenhouse gas emissions.

    As Apple celebrates Earth Day with its teams, partners, and customers around the world, including with a special offer for users who bring in devices for recycling, here’s a look at the progress the company is making across its environmental initiatives.

    Accelerating Clean Energy in Apple’s Supply Chain

    There are now 17.8 gigawatts of renewable electricity online in Apple’s global supply chain, thanks to the company’s long-standing collaboration with its suppliers to transition to 100 percent renewable energy for their Apple production by 2030. The renewable energy procured by Apple suppliers avoided 21.8 million metric tons of greenhouse gas emissions in 2024, an over 17 percent increase from the previous year. Additionally, suppliers avoided nearly 2 million metric tons of greenhouse gas emissions last year by working with Apple to optimize their energy efficiency.

    Driving Cleaner Semiconductor Production

    In addition to transitioning suppliers to clean energy, Apple is working across its supply chain to reduce the direct climate impact of industrial processes. This includes the manufacturing of semiconductors and flat-panel displays, both of which emit highly potent fluorinated greenhouse gases (F-GHGs). Today, Apple is announcing that 26 of its direct semiconductor suppliers have committed to abate at least 90 percent of F-GHGs from their facilities with Apple-related production by 2030. Many of these facilities also serve additional customers, helping this progress ripple beyond Apple. Additionally, 100 percent of the company’s direct display suppliers have made the same pledge. In 2024, display and semiconductor suppliers abated 8.4 million metric tons of greenhouse gas emissions, and the new commitments will accelerate that progress in the coming years.

    Expanding the Use of Recycled and Renewable Materials

    Apple continues to use more recycled and renewable materials across its products, helping drive down their carbon footprint without compromising quality or performance. Earlier this year, Apple surpassed 99 percent on the way toward its 2025 goals to use 100 percent recycled rare earth elements in all magnets and 100 percent recycled cobalt in all Apple-designed batteries. Magnets are by far the most significant use of rare earth elements in Apple products overall, and Apple-designed batteries comprise over 97 percent of Apple’s total cobalt use. Apple is committed to sourcing both recycled and primary minerals responsibly, and drives high human rights and environmental standards across its supply chain.

    Eliminating Millions of Metric Tons of Waste

    In 2024, suppliers participating in Apple’s Zero Waste program redirected approximately 600,000 metric tons of waste from landfills, bringing the total to 3.6 million metric tons since the program’s inception in 2015. That is equivalent to eliminating 4.5 million square meters of landfill space. Apple and its suppliers are innovating to further accelerate progress, from deploying recyclable protective films and reusable trays in manufacturing to recovering valuable metals from waste liquids generated during printed circuit board manufacturing.

    Innovating to Reduce Product Emissions

    Apple’s environmental progress continues to show up in its products. Earlier this year, the company introduced the new MacBook Air with over 55 percent recycled content overall, the most in any Apple product. Last year, Apple introduced its first-ever carbon neutral Mac with the new Mac mini. And customers can choose a carbon neutral option of any Apple Watch in any material. Apple’s carbon neutral products are the result of innovations to significantly reduce carbon emissions across their three biggest sources — materials, electricity, and transportation — before using high-quality carbon credits from nature-based projects to balance the small amount of remaining emissions.

    Saving Billions of Gallons of Water Each Year

    Apple and its suppliers have saved over 90 billion gallons of fresh water since launching the Supplier Clean Water Program in 2013, which promotes water reuse, efficiency, and other initiatives at facilities around the world. The average reuse rate by participating suppliers was 42 percent last year, saving 14 billion gallons of fresh water in 2024 alone. Across Apple’s corporate operations, the company has set a target to replenish 100 percent of freshwater withdrawals in high-stress locations by 2030. Apple has now initiated long-term partnerships amounting to over 40 percent of that target. This includes support for new and ongoing replenishment projects in the U.S., India, and Africa, which together are expected to deliver nearly 9 billion gallons in water benefits over the next 20 years.

    Celebrating Earth Day with Apple

    To celebrate Earth Day, Apple is offering customers and users a series of ways to learn and take action to protect the planet — from helping take part in recycling important materials, to enjoying content that celebrates Earth.

    Through Apple Trade In and free recycling programs available at Apple Store locations around the world, customers can bring in the Apple products they no longer use for credit or to be responsibly recycled. From now until May 16, customers can receive 10 percent off an Apple accessory when they recycle an eligible item in-store.2

    On April 22, Apple Watch users can earn an Earth Day limited-edition award by completing any workout of 30 minutes or more, encouraging them to get outside and stay active. Apple Fitness+ offers thousands of workouts and meditations that can be done anytime, anywhere, including outside. On April 21, a new Time to Walk episode celebrating Earth Day will feature actress and climate advocate Shailene Woodley, and users can discover a collection of Time to Run episodes with Fitness+ trainers through Lake Tahoe; Zion National Park; Kona, Hawaii; and Yellowstone National Park, or enjoy an ocean breathing meditation with Fitness+ trainer Jessica Skye.

    On the Apple TV app, customers can also enjoy movies and shows celebrating Earth in “The Future Is Up to Us,” a room that features family-friendly favorites, portraits of changemakers, and awe-inspiring Apple Originals like The Last of the Sea Women. And this Earth Day, Apple TV+ highlights the wonders of our planet through a slate of award-winning original series, specials, and shorts, including Jane, Stillwater, Earthsounds, Earth at Night in Color, Tiny World, Prehistoric Planet, The Secret Lives of Animals, Here We Are: Notes for Living on Planet Earth, and many more.

    Through a new Earth Day collection in the Tips app, users can learn about planet-friendly actions available on iPhone, including how to identify plants in the Photos app, customize and download Maps for a journey outdoors, save electricity at home, and more.

    For additional information about Apple’s environmental efforts, visit apple.com/environment.

    1. Recycled materials are certified to standards that conform to ISO 14021, and all cobalt claims use mass balance allocation.
    2. Offer available to customers who recycle an eligible device and purchase a new eligible accessory in the same transaction between April 16, 2025, and May 16, 2025. Only at Apple Store locations. Additional restrictions apply. For full terms and conditions of the offer, visit apple.com/trade-in.

    The information covered in this release contains forward-looking statements within the meaning of the Private Securities Litigation Reform Act of 1995, including statements regarding our goals, targets, commitments, and strategies. These statements involve risks and uncertainties, and actual results may differ materially from any future results expressed or implied by the forward-looking statements. More information on risks, uncertainties, and other potential factors that could affect our business and performance is included in our filings with the SEC.

    Press Contacts

    Sean Redding

    Apple

    s_redding@apple.com

    Chloe Sweet

    Apple

    chloe_sweet@apple.com

    Apple Media Helpline

    media.help@apple.com

    MIL OSI Economics

  • MIL-OSI Economics: Starting today, we’re bringing computer use agent capabilities to Copilot Studio – enabling anyone to build agents that take action on the UI across both desktop and web apps. Excited to see what this unlocks!

    Source: Microsoft

    Headline: Starting today, we’re bringing computer use agent capabilities to Copilot Studio – enabling anyone to build agents that take action on the UI across both desktop and web apps. Excited to see what this unlocks!

    Starting today, we’re bringing computer use agent capabilities to Copilot Studio – enabling anyone to build agents that take action on the UI across both desktop and web apps. Excited to see what this unlocks!

    Charles Lamanna

    Corporate Vice President, Business & Industry Copilot at Microsoft

    Exciting news from Microsoft Copilot Studio today – computer use is here! With computer use, you can enable your agents to automate interactions across desktop and web apps effortlessly, responding to changes in real-time. Read all about it in this blog: https://lnkd.in/g-TwS4xV

    MIL OSI Economics

  • MIL-OSI Economics: Announcing new computer use in Microsoft Copilot Studio for UI automation

    Source: Microsoft

    Headline: Announcing new computer use in Microsoft Copilot Studio for UI automation

    Announcing computer use in Copilot Studio! This new feature allows your Copilot Studio agents to interact directly with websites and desktop applications. Want to join the limited preview? Read on.

    AI innovation is accelerating at an unprecedented pace, and Microsoft Copilot Studio is at the forefront—integrating the best AI advancements into a platform built to solve business challenges at scale. Last month, we introduced deep reasoning capabilities for agents, support for model context protocol (MCP), and the general availability of agent flows in Copilot Studio.

    Today, we are excited to announce that computer use is coming to Copilot Studio through an early access research preview. This new capability allows your Copilot Studio agents to treat websites and desktop applications as tools. With computer use, agents can now interact with any system that has a graphical user interface!

    Achieve new efficiencies with computer use 

    Computer use enables agents to interact with websites and desktop apps by clicking buttons, selecting menus, and typing into fields on the screen. This allows agents to handle tasks even when there is no API available to connect to the system directly. If a person can use the app, the agent can too.

    Computer use adapts to changes in apps and websites automatically. It adjusts in real time using built-in reasoning to fix issues on its own, so work continues without interruption. It is also built on Copilot Studio’s robust security measures and governance frameworks, to help ensure compliance with organizational and industry standards.

    With computer use in Copilot Studio, makers can build agents that automate tasks on user interfaces across both desktop and browser applications, including Edge, Chrome, and Firefox. Additionally, computer use runs on Microsoft-hosted infrastructure, meaning organizations don’t need to manage their own servers. Enterprise data stays within Microsoft Cloud boundaries and is not used to train the Frontier model. This helps your organization accelerate deployment, reduce maintenance, and lower infrastructure costs.

    Unlock new value with agentic and automation scenarios

    To bring this technology to life, consider the following high value use cases:

    • Automated data entry: Imagine a scenario where an enterprise needs to input large volumes of data from various sources into a centralized system. Computer use can automate this process, reducing manual effort and minimizing errors.
    • Market research: Marketing teams can leverage the tool to automate the collection of market data from various online sources for analysis, providing valuable insights without the need for manual intervention.
    • Invoice processing: For finance departments, the tool can automate the extraction of data from invoices and input it into accounting systems, streamlining the entire invoicing process and reducing manual errors.

    Reimagining robotic process automation (RPA)

    Computer use agents are transforming robotic process automation (RPA). They overcome traditional limitations, like the fragility of UI elements, and can handle complex dynamic interfaces. This makes automation accessible to people beyond professional RPA developers.

    In Copilot Studio, computer use addresses common RPA challenges by making automation smarter and more intuitive:

    • It responds to changes in real time: When buttons or screens change, the tool keeps working without breaking your flow.
    • It is easy to use: You can describe what you want in natural language, no coding needed, and test and refine the prompt with real-time side-by-side video of the computer use reasoning chain and the planned UI automation.
    • It is built with intelligence: The agent sees what is on the screen and makes smart decisions in real time, even in complex or constantly changing environments.
    • It comes with full visibility: Makers can view a history of computer use activity at will, including captured screenshots and reasoning steps.

    The future of innovation with Copilot Studio

    Copilot Studio is the end-to-end agent platform designed to help organizations achieve their AI and operational goals. We want to empower you to streamline processes, enhance productivity, and drive innovation.

    If you are interested in exploring the new computer use capability, we would love to hear from you! Please fill out this form to let us know you would like to participate.

    We will also share more about this new announcement at Microsoft Build in May 2025—register here to join us! 

    MIL OSI Economics

  • MIL-OSI Economics: Inflation increased to 2.8 percent in March 2025

    Source: Bank of Botswana

    Headline inflation increased from 2.7 percent in February to 2.8 percent in March 2025, remaining below the lower bound of the medium-term objective range of 3 – 6 percent, and was lower than the 2.9 percent recorded in March 2024. The increase in inflation between February and March 2025 was mainly on account of the acceleration in the rate of annual price changes of most categories of goods and services, including Food & Non-Alcoholic Beverages and Transport. Similarly, the 16 percent trimmed mean inflation and inflation excluding administered prices increased from 2.4 percent and 3.8 percent to 2.5 percent and 4 percent, respectively, between February and March 2025.

    Inflation for domestic tradeables increased from 4.8 percent to 4.9 percent between February and March 2025, mainly on account of an increase in food prices. Similarly, inflation for imported tradeables increased from 1.9 percent to 2.4 percent over the same period, mainly due to an increase in vehicle prices. As a result, all tradeables inflation rose from 2.7 percent to 3 percent between February and March 2025. Meanwhile, inflation for non-tradeables eased marginally from 2.6 percent to 2.5 percent in the same period.


    MIL OSI Economics

  • MIL-OSI Economics: ASEAN steps up efforts to boost regional infrastructure projects

    Source: ASEAN

    PUTRAJAYA, 11 April 2025 – ASEAN is stepping up efforts to improve and expand its regional infrastructure project pipeline. A Regional Workshop on Updating and Advancing the Initial Pipeline of ASEAN Infrastructure Projects was held on 9–10 April 2025 in Putrajaya, Malaysia, bringing together over 60 stakeholders from across ASEAN Member States and Timor-Leste.

    The Workshop was organised by the Lead Implementing Body for Sustainable Infrastructure (LIB-SI) and supported by the Australian Government through the Australia for ASEAN Futures (Aus4ASEAN Futures) Initiative.

    Participants included officials, project owners, and experts from infrastructure, transport, energy, digital, finance, and smart cities sectors. They shared updates on potential projects for the updated Pipeline of ASEAN Infrastructure Projects. Further, they exchanged ideas on how to make these projects more relevant, resilient, bankable, and ready for future investment. The Workshop also provided insights into trends and developments in infrastructure financing, as well as challenges and opportunities in the transport, energy, and digital infrastructure sectors across the region.

    During the opening remarks, LIB-SI Chair H.E. Dato’ Nor Azmie Bin Diron, Secretary General, Ministry of Economy, Malaysia, reiterated the importance of sustainable infrastructure in enhancing ASEAN Connectivity. “Sustainable infrastructure is at the heart of ASEAN’s vision for greater integration and connectivity. As we face the challenges of climate change and rapid urbanisation, it is clear that building resilient, environmentally-friendly infrastructure is key to supporting long-term growth and improving the lives of our people. By working together on sustainable solutions, we not only enhance regional connectivity but also create stronger economic ties and more inclusive opportunities for all ASEAN nations.” 

    The Initial Pipeline of ASEAN Infrastructure Projects was developed in 2019 to support ASEAN Member States in identifying, assessing, and prioritising infrastructure projects that can drive ASEAN Connectivity, enhancing the movements of people, goods, services, and innovation across the region. LIB-SI has continued to intensify efforts through collaboration with partners to advance and update the Initial Pipeline, considering emerging trends, challenges, and priorities. As projects evolve over time, new projects could be added and/or existing projects completed or withdrawn from the Pipeline as appropriate.

    The Workshop marked a strong step forward in ASEAN’s ongoing commitment to building infrastructure that is sustainable, inclusive, and ready for the future and all, he added.

    ***

    Images Credit: ASEAN Secretariat
    The post ASEAN steps up efforts to boost regional infrastructure projects appeared first on ASEAN Main Portal.

    MIL OSI Economics

  • MIL-OSI Economics: RBI cancels the licence of Colour Merchants Co-operative Bank Ltd., Ahmedabad, Gujarat

    Source: Reserve Bank of India

    The Reserve Bank of India (RBI), vide order April 15, 2025, has cancelled the licence of “Colour Merchants Co-operative Bank Ltd., Ahmedabad, Gujarat”. Consequently, the bank ceases to carry on banking business with effect from the close of business on April 16, 2025. Registrar of Cooperative Societies, Gujarat has also been requested to issue an order for winding up the bank and appoint a liquidator for the bank.

    The Reserve Bank cancelled the licence of the bank as:

    1. The bank does not have adequate capital and earning prospects. As such, it does not comply with the provisions of Section 11(1) and Section 22(3)(d) read with Section 56 of the Banking Regulation Act, 1949.

    2. The bank has failed to comply with the requirements of Sections 22(3)(a), 22(3)(b), 22(3)(c), 22(3)(d) and 22(3)(e) read with Section 56 of the Banking Regulation Act, 1949;

    3. The continuance of the bank is prejudicial to the interest of the depositors;

    4. The bank with its present financial position would be unable to pay its present depositors in full; and

    5. Public interest would be adversely affected if the bank is allowed to carry on its banking business any further.

    2. Consequent to the cancellation of its licence “Colour Merchants Co-operative Bank Ltd., Ahmedabad, Gujarat” is prohibited from conducting the business of ‘banking’ which includes, among other things, acceptance of deposits and repayment of deposits as defined in Section 5(b) read with Section 56 of the Banking Regulation Act, 1949 with immediate effect.

    3. On liquidation, every depositor would be entitled to receive deposit insurance claim amount of his/her deposits up to a monetary ceiling of ₹5,00,000/- (Rupees five lakh only) from Deposit Insurance and Credit Guarantee Corporation (DICGC) subject to the provisions of DICGC Act, 1961. As per the data submitted by the bank, about 98.51% of the depositors are entitled to receive full amount of their deposits from DICGC. As on March 31, 2024, DICGC has already paid ₹13.94 crore of the total insured deposits under the provisions of Section 18A of the DICGC Act, 1961 based on the willingness received from the concerned depositors of the bank.

    (Puneet Pancholy)  
    Chief General Manager

    Press Release: 2025-2026/119

    MIL OSI Economics

  • MIL-OSI Economics: Allen & Overy and White & Case top M&A legal advisers in Middle East & Africa region during Q1 2025, reveals GlobalData

    Source: GlobalData

    Allen & Overy and White & Case top M&A legal advisers in Middle East & Africa region during Q1 2025, reveals GlobalData

    Posted in Business Fundamentals

    Allen & Overy and White & Case were the top mergers and acquisitions (M&A) legal advisers in the Middle East & Africa region during the first quarter (Q1) of 2025 by value and volume, respectively, according to the latest legal advisers league table by GlobalData, a leading data and analytics company.

    An analysis of GlobalData’s Deals Database revealed that Allen & Overy achieved the leading position in terms of value by advising on $2.8 billion worth of deals. Meanwhile, White & Case led in terms of volume by advising on four deals.

    Aurojyoti Bose, Lead Analyst at GlobalData, comments: “Both Allen & Overy and White & Case were the top advisers by value and volume in Q1 2024 and managed to retain their respective leadership positions in Q1 2025 as well. Despite suffering setbacks in terms of value and volume, respectively, in Q1 2025 compared to Q1 2024, Allen & Overy and White & Case were still ahead of their peers and managed to lead the pack.

    “White & Case, apart from leading by volume, also occupied the fourth position by value in Q1 2025. Similarly, While Allen & Overy, apart from leading by volume, also held the fourth position by value during Q1 2025.”

    Freshfields Bruckhaus Deringer occupied the second position in terms of value, by advising on $2.3 billion worth of deals, followed by Gibson, Dunn & Crutcher with $2.2 billion, White & Case with $1.8 billion and AS&H Clifford Chance with $906 million.

    Meanwhile, Baker McKenzie occupied the second position in terms of volume with three deals, followed by DLA Piper with three deals, Allen & Overy with two deals and Gibson, Dunn & Crutcher with two deals.

    MIL OSI Economics

  • MIL-OSI Economics: GPT-4.1 impresses influencers with coding prowess, surpassing GPT-4o, reveals GlobalData

    Source: GlobalData

    GPT-4.1 impresses influencers with coding prowess, surpassing GPT-4o, reveals GlobalData

    Posted in Business Fundamentals

    OpenAI emerged as a prominent subject of discussion among influencers in mid-April 2025, driven by the introduction of its GPT-4.1 model suite, comprising GPT-4.1, GPT-4.1-mini, and GPT-4.1-nano, specifically designed for developer applications. This rise to prominence was reinforced by the accompanying prompting guide and the models’ integration into platforms such as VS Code, GitHub Copilot, and Foundry. Influencers perceive this as a strategic effort by OpenAI to maintain its competitive edge against industry peers, including Google and Anthropic, particularly in light of its reported exploration of open-source initiatives, reveals the Social Media Analytics Platform of GlobalData, a leading data and analytics company.

    Shreyasee Majumder, Social Media Analyst at GlobalData, comments: “Influencer sentiment is predominantly optimistic about GPT-4.1’s advancements, emphasizing its superior coding precision, enhanced instruction adherence, and expanded contextual understanding compared to earlier models. Several influencers assert that GPT-4.1 delivers performance surpassing that of GPT-4o, with some even claiming it outperforms GPT-4.5, which OpenAI recently announced it would phase out from its API. However, confusion and skepticism persist regarding OpenAI’s complex naming conventions, with some observers critiquing the numbering system as lacking clarity.”

    Below are a few popular influencer opinions captured by GlobalData’s Social Media Analytics Platform:

    1. Thomas Dohmke, CEO at GitHub:

    “The next evolution of GPT GitHub Copilot is here. OpenAI GPT-4.1 is now available for all Copilot Plans, including Free, via the model picker in Visual Studio Code and http://GitHub.com chat (support in Visual Studio and JetBrains coming soon). It’s also up and running on GitHub Models, for all your model comparison needs. GPT-4.1 improves on GPT-4o’s coding accuracy, performance, and context awareness. It’s a strong choice for tasks that require speed, responsiveness, and general-purpose reasoning. And it’s ready for you to explore today.”

    1. Ethan Mollick, Associate Professor at The Wharton School:

    “Resisting the standard urge to tweet about OpenAI’s naming system given today’s new products are named 4.1, 4.1-mini, and 4.1-nano, given the existence of 4o, the upcoming o4, and the existing 4.5. Don’t worry, the numbering system is completely uninformative as to capabilities.”

    1. Aaron Levie, CEO at Box:

    “OpenAI just dropped GPT-4.1. It’s a huge jump over GPT-4o on basically every metric, and importantly document processing and data extraction from enterprise content. Box is now offering it in beta in the Box AI Studio, and will be rolling out to everyone shortly.”

    1. Tom Warren, Senior Editor at The Verge:

    “as I exclusively reported last week, OpenAI has just announced GPT-4.1, which it claims is better than GPT-4o “on just about every dimension.” I’m also expecting an o3 and o4 mini reveal, and other announcements later this week”

    1. Elvis S, Cofounder & CEO at DAIR.AI:

    “GPT-4.1 > GPT-4o OpenAI mentioned that GPT-4.1 is better than GPT-4o on every dimension and even beats GPT-4.5 in some tasks. The models can handle up to 1M content window (for the first time).”

    MIL OSI Economics

  • MIL-OSI Economics: RBC Capital Markets and UBS top M&A financial advisers in South & Central America region during Q1 2025, reveals GlobalData

    Source: GlobalData

    RBC Capital Markets and UBS top M&A financial advisers in South & Central America region during Q1 2025, reveals GlobalData

    Posted in Business Fundamentals

    RBC Capital Markets and UBS were the top mergers and acquisitions (M&A) financial advisers in the South & Central America region during the first quarter (Q1) of 2025 by value and volume, respectively, according to the latest financial advisers league table by GlobalData, a leading data and analytics company.

    An analysis of GlobalData’s Deals Database revealed that RBC Capital Markets achieved the leading position in terms of value by advising on $1.7 billion worth of deals. Meanwhile, UBS led in terms of volume by advising on two deals.

    Aurojyoti Bose, Lead Analyst at GlobalData, comments: “UBS was the top adviser by volume in Q1 2024 and managed to retain its leadership position by this metric in Q1 2025 as well. Apart from leading by volume, UBS also occupied second position by value in Q1 2025.

    “Meanwhile, RBC Capital Markets advised on just one deal in Q1 2025, but its billion-dollar* value significantly boosted the firm’s overall performance. As a result, the global investment bank witnessed a substantial surge in the total value of deals it advised on compared to Q1 2024. This propelled RBC Capital Markets from seventh place in Q1 2024 to the top spot by deal value in Q1 2025. In addition to leading by value, the firm also secured the third position by deal volume during the quarter.”

    UBS occupied the second position in terms of value, by advising on $269 million worth of deals, followed by Clairfield International with $240 million, Rand Merchant Bank with $240 million and DNB Bank with $40 million.

    Meanwhile, Pier Partners occupied the second position in terms of volume with two deals, followed by RBC Capital Markets with one deal, whereas Clairfield International and Rand Merchant Bank jointly occupied the fourth position with each of them advising on one deal.

    *Deal value ≥ $1 billion

    MIL OSI Economics

  • MIL-OSI Economics: Skadden, Arps, Slate, Meagher & Flom top M&A legal adviser in South & Central America region during Q1 2025, reveals GlobalData

    Source: GlobalData

    Skadden, Arps, Slate, Meagher & Flom top M&A legal adviser in South & Central America region during Q1 2025, reveals GlobalData

    Posted in Business Fundamentals

    Skadden, Arps, Slate, Meagher & Flom was the top mergers and acquisitions (M&A) legal adviser in the South & Central America region during the first quarter (Q1) of 2025 by both value and volume, according to the latest legal advisers league table by GlobalData, a leading data and analytics company

    An analysis of GlobalData’s Deals Database revealed that Skadden, Arps, Slate, Meagher & Flom achieved the leading position having advised on two deals worth $1.7 billion.

    Aurojyoti Bose, Lead Analyst at GlobalData, comments: “Skadden, Arps, Slate, Meagher & Flom recorded notable growth in both the volume and value of deals in Q1 2025 compared to the same period in 2024, leading to a significant improvement in its rankings. The firm jumped from 13th place by deal volume in Q1 2024 to claim the top position in Q1 2025. Similarly, its ranking by deal value also rose from seventh to first place over the same period.”

    Cleary Gottlieb Steen & Hamilton occupied the second position in terms of value, by advising on $1.2 billion worth of deals, followed by Squire Patton Boggs with $950 million whereas Edward Nathan Sonnenbergs Inc, Guerrero Olivos and Valdes y Cia jointly occupied the fourth position with each of them advising on $240 million worth of deals.

    Meanwhile, Perez Alati, Grondona, Benites, Arntsen & Martinez de Hoz and Wilson Sonsini Goodrich & Rosati jointly occupied the second position in terms of volume with each of them advising on two deals followed by Cleary Gottlieb Steen & Hamilton with one deals and Squire Patton Boggs with one deal.

    MIL OSI Economics

  • MIL-OSI Economics: Development Asia: Strengthening Anti-Corruption Standards in Kazakhstan

    Source: Asia Development Bank

    The first element of the methodology is the identification and mitigation of corruption risks. Organizations are required to carry out annual internal analyses using defined risk indicators. Once the assessment is complete, each risk is evaluated along two axes: risk likelihood (from very rare to very often) and risk impact (from minor to severe), scored on a scale from 1 to 5. These dimensions form the basis of the visual risk map illustrated below.

    Figure 1. Example of Corruption Risk Map

    Source: Methodological recommendations for establishing anti-corruption standards.

    This process results in two separate risk maps. The first map focuses on risks associated with legislative frameworks, such as inconsistencies, ambiguous formulations, or gaps that can be exploited. The second map highlights risks embedded in organizational processes and managerial operations (e.g., recruitment, budgeting, and procurement). Including the risk maps supports a more structured and data-driven approach to corruption prevention. It allows institutions to clearly visualize, assess, and prioritize corruption risks, helping them target vulnerabilities more effectively and implement appropriate mitigation strategies.

    MIL OSI Economics

  • MIL-OSI Economics: 16 April 2025 EEF travelling session dedicated to scientific and educational partnership between the Russian Far East and Indonesia was held in Jakarta As part of the Russia–Indonesia Business Forum in Jakarta, the Eastern Economic Forum held a travelling session entitled ‘Expanding Business Interaction through the Mechanisms of Scientific and Educational Partnership between the Russian Far East and Indonesia’. It was devoted to the prospects for cooperation between the Far East and Indonesian regions in the educational sphere.

    Source: Eastern Economic Forum

    16 April 2025

    EEF travelling session dedicated to scientific and educational partnership between the Russian Far East and Indonesia was held in Jakarta

    As part of the Russia–Indonesia Business Forum in Jakarta, the Eastern Economic Forum held a travelling session entitled ‘Expanding Business Interaction through the Mechanisms of Scientific and Educational Partnership between the Russian Far East and Indonesia’. It was devoted to the prospects for cooperation between the Far East and Indonesian regions in the educational sphere.

    The panel discussion was attended by representatives of leading universities and specialized departments from Russia and Indonesia. The speakers included Ahmad Najib Burhani, Director General for Science and Technology at the Ministry of Higher Education, Science and Technology of the Republic of Indonesia; Tatachipta Dirgantara, Rector of the Bandung Institute of Technology; Evgeny Vlasov, Vice-Rector for International Relations of the Far Eastern Federal University (FEFU); Tri Andika Kurniawan, Vice-Chancellor of Bakri University; Yury Marfin, Rector of the Pacific State University (PSU);  Hamdi Muluk, Vice-Chancellor for Research and Innovation, University of Indonesia; Elena Kharisova, General Director of the Fund for Development of the Russky Innovation Science and Technology Centre. The moderator was Elvira Nurgalieva, Deputy Minister of the Russian Federation for the Development of the Far East and the Arctic.

    During her speech, Elvira Nurgalieva noted that the scientific and educational partnership between the Far Eastern Federal District as a region of the Russian Federation and the Republic of Indonesia is not just an exchange of knowledge, but a valuable practical tool for expanding business cooperation.

    “Implementing joint training programmes, launching new research projects, working to improve the quality of education – all this can create a basis for long-term economic cooperation. We attribute an important role in this process to the work of the Innovation Science and Technology Centre on Russky Island. We are creating a concentrate of science, technology, education and production at the ISTC, where comprehensive programmes will be implemented with government support to attract the best scientists, engineering teams, and specialists in various fields of science and technology, including world-class ones. ISTC will become an important platform for interaction with scientists from Asia-Pacific countries, in particular Indonesia,” noted Elvira Nurgalieva.

    In turn, Yuri Marfin noted that expert support for the development of the Far East and strengthening Russia’s influence in the Asia–Pacific region are tasks that are part of the PSU development programme.

    ‘That is why we prioritize the development of co-operation with representatives of the academic and business sectors of the Asia–Pacific Region. Universities can and should become a significant entry point to start a meaningful dialogue on cooperation in science and technology. To address these challenges, our university has been increasing the number of international students, including those from Indonesia, year after year. We have developed entrepreneurship training programmes for students and implement them both in Russia and in our partner universities in the Asia–Pacific region. We design joint business missions to exchange topical projects. The joint development of young people through university education in our countries, academic and cultural exchanges is the key to long-term and effective co-operation. We are making the greatest efforts in this direction,’ emphasized Yuri Marfin.

    Boris Korobets noted that FEFU has been a key partner in the development of Russian-Indonesian co-operation in science, education and new technologies for more than a decade.

    ‘We are joining forces with scientists from Indonesia to solve urgent problems in medicine, pharmaceuticals and biotechnology development. Today, FEFU is the largest scientific and educational hub in the Far East with a network of more than 200 partners in APR countries. Our university has 3,500 international students, and we plan to increase this number to 7,500 by 2030. The university has access to unique infrastructure for joint initiatives, including the Russky Island ISTC, which is a special economic zone with attractive tax preferences. Our technologies can make a significant contribution to Indonesia’s ambitious oil and gas targets, while our expertise in biodiversity monitoring will help with environmental projects for ocean conservation. The synergy of science, education and business that we are creating at FEFU will become a powerful platform for developing Russian-Indonesian co-operation and solving the global challenges of our countries,’ said Boris Korobets.

    ‘Bakrie University, part of the Bakrie Group ecosystem, is focused on addressing the challenge of ‘connectivity and alignment’ between industry needs and the higher education system. This is fulfilled through active engagement with industry. Currently 250 Bakrie Group companies support the university in the implementation of apprenticeship programmes. Bakrie University expresses its readiness to cooperate with Russian universities through internship programmes for students from Russia at Bakrie Group enterprises,’ said Vice Chancellor of Bakrie University Tri Andika Kurniawan.

    Igor Pavlov, First Deputy CEO of the Roscongress Foundation and Director of the Eastern Economic Forum, emphasized that international communication platforms are a working tool for establishing interstate cooperation in the Asia-Pacific region.

    ‘The Eastern Economic Forum demonstrates sustainable development dynamics, consistently strengthening its position as a global discussion platform for developing strategic solutions, including in the sphere of new technologies, education and science. As a new co-operation architecture is being formed, we are concentrating our efforts on deepening the international track. In this regard, we are actively co-operating with the Ministry for the Development of the Far East and the Arctic, demonstrating the EEF’s capabilities at international events. This allows us not only to scale the business agenda, but also to build long-term partnerships with Asia–Pacific countries,’ said Igor Pavlov.

    ‘Today’s meeting was a starting point for meaningful dialogue and joint work. The next session, a large-scale gathering of university rectors from Indonesia and Russia lies ahead. There we will continue to communicate on a more substantive plane, focusing on the development of joint educational and scientific programmes. Our countries have long-standing friendly relations, cultural proximity and mutual aspirations for development. Today, all rectors have demonstrated openness, interest and readiness for co-operation. I take this opportunity to invite all participants to join us at the Eastern Economic Forum, which is held annually in Vladivostok with the participation of the President of the Russian Federation. This is a great opportunity to get a closer look at the economic potential of the Far East, its development programmes, and the region’s key venues – namely, FEFU and the Russky Island Innovation Science and Technology Centre – as part of the Indonesian delegation,’ Elvira Nurgalieva summed up the Eastern Economic Forum’s outgoing session in Jakarta.

    The Russia–Indonesia Business Forum was held on 14 April in Jakarta as part of the 3rd meeting of the Russian-Indonesian Joint Commission on Trade, Economic and Technical Cooperation. The organizers were the Roscongress Foundation under the Roscongress International brand and the Indonesian Chamber of Commerce and Industry (KADIN).  The Forum was supported by the Ministry of Industry and Trade of the Russian Federation, the Ministry of Economic Development of the Russian Federation, the Ministry of Energy of the Russian Federation, the Ministry of the Russian Federation for the Development of the Far East and the Arctic, and the Russia–ASEAN Business Council. A multi-sectoral business mission organized by the Russian Export Center was also launched as part of the Business Forum. More than 30 companies from 12 regions are presenting their solutions to potential partners under the national brand ‘Made in Russia’ with the support of the REC.

    The EEF Business Forum session was part of the large-scale cultural and educational project ‘The Word about the Russian Heart’, dedicated to the 75th anniversary of diplomatic relations between Russia and Indonesia and the 100th anniversary of Rossotrudnichestvo. The discussion was organized by the Ministry of the Russian Federation for the Development of the Far East and the Arctic together with the Far East and Arctic Development Corporation (FEDC), the Roscongress Foundation, the Federal Agency for the Commonwealth of Independent States, Compatriots Living Abroad and International Humanitarian Cooperation (Rossotrudnichestvo), and the New City Creative Industries Centre.


    Read more

    MIL OSI Economics

  • MIL-OSI Economics: Streamlining detection engineering in security operation centers

    Source: Securelist – Kaspersky

    Headline: Streamlining detection engineering in security operation centers

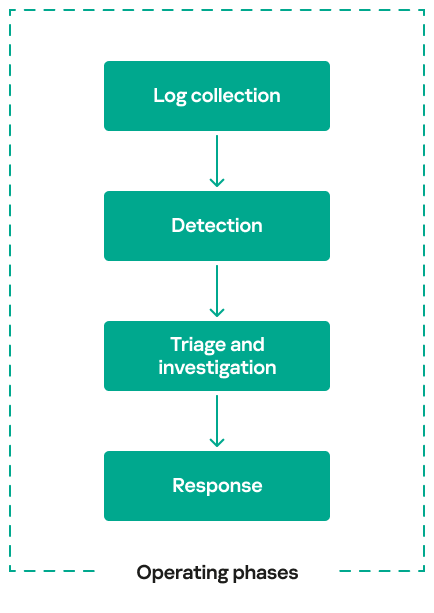
    Security operations centers (SOCs) exist to protect organizations from cyberthreats by detecting and responding to attacks in real time. They play a crucial role in preventing security breaches by detecting adversary activity at every stage of an attack, working to minimize damage and enabling an effective response. To accomplish this mission, SOC operations can be broken down into four operating phases:

    Each of these operating phases has a distinct role to play, and well-defined processes or procedures ensure a seamless handover of findings from one phase to the next. In practice, SOC processes and procedures at each operational phase often require continuous improvement over time.

    Assessment observations: Common SOC issues

    During our involvement in SOC technical assessments, adversary emulations, and incident response readiness projects across different regions, we evaluated each operating phase separately. Based on our assessments, we observed common challenges, weak practices, and recurring issues across these four key SOC capabilities.

    Log collection

    There are three main issues we have observed at this stage:

    • Lack of visibility coverage based on the MITRE DETT&CT framework – customers do not practice maintaining a visibility coverage matrix. Instead, they often maintain log source data as an Excel or similar spreadsheet that is not easily tracked. This means they don’t have a systematic approach to what data they are feeding into the SIEM and which TTPs can be detected in their environment. And in most cases, maintaining a continuous visibility matrix is also a challenge because log sources may disappear over time for a variety of reasons: agent termination, changes in log destination settings, device (e.g., firewall) replacement. This only leads to the degradation of the log visibility matrix.
    • Inefficient use of data for correlation – in many cases, relevant data is available to detect threats, but there are no correlation rules in place to leverage it for threat detection.
    • Correlation exists, but lacks the necessary data fields – while some rule sets are properly configured with the right logic to detect threats, the required data fields from log sources are missing, preventing the rules from being triggered. This critical issue can only be detected through a data quality assessment.

    Detection

    At this stage, we have seen the following issues during assessment procedures:

    • Over-reliance on vendor-provided rules – many customers rely heavily on the default rule sets in their SIEM and only tune them when alerts are triggered. Since the default content is not optimized, it often generates thousands of alerts. This reactive approach leads to excessive alert fatigue, making it difficult for analysts to focus on truly meaningful alerts.
    • Lack of detection alignment with the threat profile – the absence of a well-defined organizational threat profile prevents customers from focusing on the threats that are most likely to target them. Instead, they adopt a scattered approach to detection, like shooting in the dark rather than prioritizing relevant threats.
    • Poor use of threat intelligence feeds – we have encountered cases where endpoint logs do not contain file hash data. The log sources only provide filenames or file paths, but not the actual hash values, making it difficult for the SOC to correlate threat intelligence (TI) feeds that rely on file hashes. As a result, TI feeds are not operational because the required data field is not ingested into the SIEM.
    • Analytics deployment errors – one of the most challenging issues we see is when a well-designed detection rule is deployed incorrectly, causing threat detection to fail despite having the right analytics in place. We have found that there is no structured process for reviewing and validating rule deployments.

    Triage and investigation

    The most typical issues at this stage are:

    • Lack of a documented triage procedure – analysts often rely on generic, high-level response playbooks sourced from the internet, especially from unreliable sources, which slows or hinders the process of qualifying alerts as potential incidents. Without a structured triage procedure, they spend more time investigating each case instead of quickly assessing and escalating threats.
    • Unattended alerts – we also observed that many alerts were completely ignored by analysts. This likely stems from either a lack of skill in linking multiple alerts into a single incident, or analysts being swamped with high-severity alerts, causing them to overlook other relevant alerts.
    • Difficulty in correlating alerts – as noted in the previous observation, one of the biggest challenges is linking related alerts into a single incident. The lack of alert correlation makes it harder to see the full attack pattern, leading to disorganized alert diagnosis.
    • Default use of alert severity – SIEM default rules don’t take into account the context of the target system. Instead, they rely on the default severity in the rule, which is often set randomly or based on an engineer’s opinion without a clear process. This lack of context makes it harder to investigate and properly assess alerts.

    Response

    The challenges of the final operating phase are most often derived from the issues encountered in the previous stages.

    • Challenges in incident scoping – as mentioned earlier, the inability to properly correlate alerts leads to a fragmented understanding of attack patterns. This makes it difficult to see the bigger picture, resulting in inefficient incident handling and misjudged response efforts.
    • Increase in unnecessary escalations – this issue is particularly common in MSSP environments, where a lack of understanding of baseline behavior causes analysts to escalate benign cases. Without proper context, normal activities are mistaken for threats, resulting in wasted time and effort.

    With these ongoing challenges, chaos will continue in SOC operations. As organizations adopt new security tools such as CASB and container security, both of which generate valuable detection data, and as digital transformation introduces even more technology, security operations will only become more complex, exacerbating these issues.

    Taking the right and impactful approach

    Enhancing SOC operations requires evaluating each operating phase from an investment perspective, with the detection phase having the greatest impact because it directly affects data quality, threat visibility, incident response efficiency, and the overall effectiveness of the SOC analyst. Investing in detection directly influences all the other operating phases, making it the foundation for improving all operating phases. The detection operating phase must be handled through a dedicated program that ensures log collection is purpose-driven, collecting only the data fields necessary for detection rather than unnecessarily driving up SIEM costs. This focused approach helps define what should be ingested into the SIEM while ensuring meaningful threat visibility.

    Strengthening detection reduces false positives and false negatives, improves true positive rates, and enables the identification of attacker activity chains. A documented triage and investigation process streamlines the work of analysts, improving efficiency and reducing response time. Furthermore, effective incident scoping, guided by accurate detection of the cyber kill chain, enables a faster and more precise response. By prioritizing investment in detection and managing it through a structured approach, organizations can significantly improve SOC performance and resilience against evolving threats. This article focuses solely on SIEM-based detection management.

    Detection engineering program

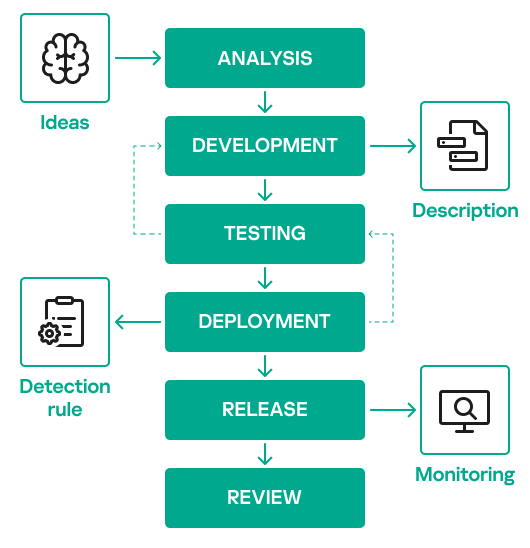
    Before diving into the program-level approach, we will first present the detection engineering lifecycle that forms the foundation of the proposed program. The image below shows the stages of this lifecycle.

    The detection engineering lifecycle shown here is typically followed when building detections, but its implementation often lacks well-defined processes or a dedicated team. A structured program must be put in place to ensure that the SOC’s investment and efforts in detection engineering are used efficiently.

    When we talk about a program, it should be built on the following key elements:

    • A dedicated team responsible for driving the program
    • Well-defined processes and procedures to ensure consistency and effectiveness
    • The right tools to integrate with workflows, facilitate output handovers, and enable feedback loops across related processes
    • Meaningful metrics to measure the overall performance of the program.

    We will discuss these performance measurement metrics in the final section of the article.

    1. Team supporting detection engineering program

    The key idea behind having a dedicated team is to take full control of the detection engineering (DE) lifecycle, from analysis to release, and ensure accountability for the program’s success. In a traditional SOC setup, deployment and release are often handled by SOC engineers. This can lead to deployment errors due to potential differences in the data models used by DE and SOC teams (raw log data vs. SIEM-optimized data), as well as deployment delays due to the SOC team being overloaded with other tasks. This, in turn, can indirectly impact the work of the detection team. However, the one responsibility that does not fall under the DE team is log onboarding. Since this process requires coordination with other teams, it should continue to be managed by SOC engineers to keep the DE team focused on its core objectives.

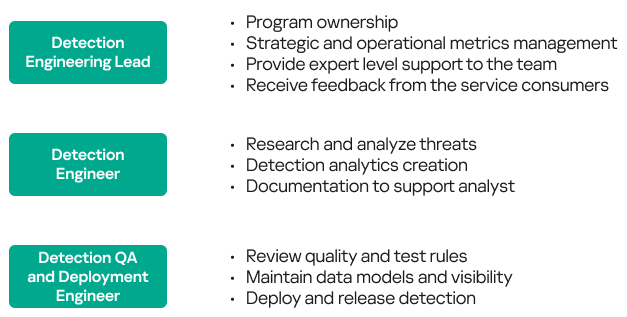
    The DE team should start with at least three key roles:

    The size of the team depends on factors related to the program’s objectives. For example, if the goal is to build a certain number of detection rules per month, the number of detection engineers required will vary accordingly. Similarly, if a certain number of rules need to be tested and deployed within a week, the team size must be adjusted to meet that demand.

    The Detection Engineering Lead should communicate with SOC leadership to set the right expectations by outlining what goals can realistically be achieved based on the size and capacity of the DE team. A dedicated Detection QA role can be established as the need for testing, deployment, and release of detections grows.

    1. Process and procedures

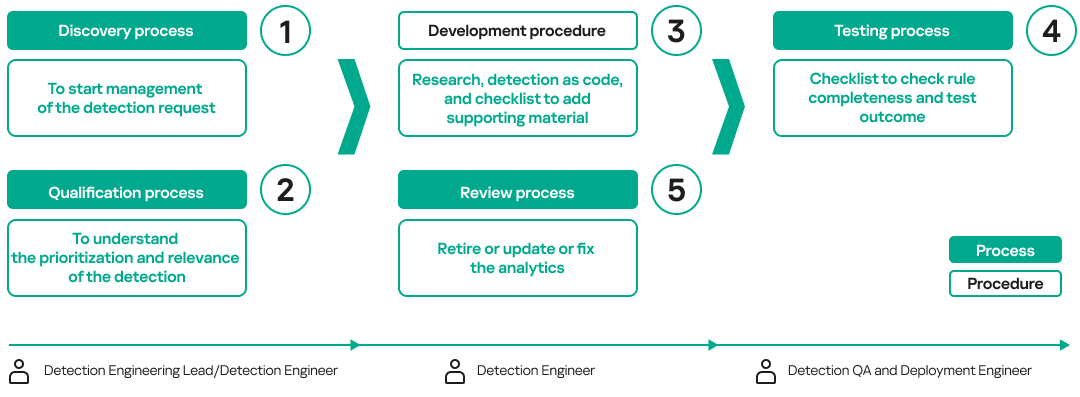
    Well-defined workflows, supported by structured processes and procedures, must be established to streamline detection engineering operations. The following image illustrates the necessary processes and procedures, along with the roles responsible for executing each workflow:

    During the qualification process, the Detection Engineering Lead or Detection Engineer may discover that the data source needed to develop a detection is not available. In such cases, they should follow the log management process to request onboarding of the required data before proceeding with detection research and development. The testing process typically checks that the rule works by ensuring that the SIEM triggers an alert based on the required data fields.

    Lastly, a validation process that is not part of the detection engineering lifecycle must be incorporated into the detection engineering program to assess its overall effectiveness. Ideally, this validation should be conducted by individuals outside the DE lifecycle or by an external service provider.

    Proper planning is required that incorporates threat intelligence and an updated threat profile. In addition, the validation process should generate reports that outline:

    • What is working well
    • Areas that need improvement
    • Detection gaps identified
    1. Tools

    An essential element of the DE lifecycle is the use of tools to streamline processes and improve efficiency. Key tools include:

    • Ticketing platform – efficiently manages workflows, tracks progress from ticket creation to closure, and provides time-based metrics for monitoring.
    • Rules repository – platform for managing detection queries and code, supporting Detection-as-Code, using a unified rule format such as SIGMA, and implementing code development best practices in detection engineering, including features such as version control and change management.
    • Centralized knowledge base – dedicated space for documenting detection rules, descriptions, research notes, and other relevant information. See the best practices section below for more details on centralized documentation.
    • Communication platform – facilitates collaboration among DE team members, integrates with the ticketing system, and provides real-time notification of ticket status or other issues.
    • Lab environment – virtualized setup, including SIEM and relevant data sources, tools to simulate attacks for testing purposes. The core function of the lab is to test detection rules prior to release.

    Best practices in detection engineering

    Several best practices can significantly enhance your detection engineering program. Based on our experience, implementing these best practices will help you effectively manage your rule set while providing valuable support to security analysts.

    1. Rule naming convention

    When developing analytics or a rule, adhering to a proper naming convention provides a concrete framework. A rule name like “Suspicious file drop detected” may confuse the analyst and force them to dig deeper to understand the context of the alert that was triggered. It would be better to give a rule a name that provides complete context at first glance, such as “Initial Access | Suspicious file drop detected in user directory | Windows – Medium”. This example makes it easy for the analyst to understand:

    • At what stage of the attack the rule is triggered. In this case, it is Initial Access as per MITRE / Kill Chain Model.
    • Where exactly the file was dropped. In this case, the user directory was the target, which may mean that this probably involved user interaction, which is another sign that the attack was probably detected at an early stage.
    • What platform was attacked. In this case, it is Windows, which can help the analyst to quickly find the machine that triggered the alert.
    • Lastly, an alert priority can be set, which helps the analyst to prioritize accordingly. For this to work properly, SIEM’s priority levels should be aligned with the rule priorities defined by the detection engineering team. For example, a high priority in SIEM should correspond to a high-priority alert.

    A consistent rule naming structure can help the detection engineering team to easily search, sort and manage existing rules, avoid creating duplicates with different names, etc.

    The naming structure doesn’t necessarily have to look like the example above. The whole idea of this best practice is to find a good naming convention that not only helps the SOC analyst, but also makes managing detection rules easier and more convenient.

    For example, while the rule name “Audit Log Deletion” gives a basic idea of what is happening, a more effective name would be:

    This provides better context, making it much more useful to the SOC team, and more keywords for the DE team to find this particular rule or filter rules if necessary.

    1. Centralized knowledge base

    Once a rule is created after thorough research, the detection team should manage it in a centralized platform (a knowledge base). This platform should not only store the rule name and logic, but also other key details. Important elements to consider:

    • Rule name/ID/description – rule name, unique ID, and a brief description of the rule.
    • Rule type/status – provides insight into the rule type (static, correlated, IoC-based, etc.) and the status (experimental, stable, retired, etc.).
    • Severity and confidence – seriousness of the threat triggering this rule and the likelihood of a true positive.
    • Research notes – possible public links, threat reports, used as a basis for creating the rule.
    • Data components used to detect the behavior – list of source and data fields used to detect activity.
    • Triage steps – provides steps to investigate the alert.
    • False positives – provides options where the alert could show false positive behavior.
    • Tags (CVE, Actors, Malware, etc.) – provide more context if the detection is linked to a behavior or artifact, specific to any APT group, or malware.

    Make sure this centralized documentation is accessible to all SOC analysts.

    1. Contextual tagging

    As covered in the previous best practice, tags provide a great value in understanding the attack chain. That’s why we want to highlight them as a separate best practice.

    The tags attached to the above detection rule are the result of the research done on the behavior of the attack when writing the detection rule. They help the analyst gain more context at the time the rule is triggered. In the example above, the analyst may suspect a potential initial access attempt related to QakBot or Black Basta ransomware. This also helps in reporting to security leadership that the SOC team successfully detected the initial ransomware behavior and was able to thwart the attack in the early stages of the kill chain.
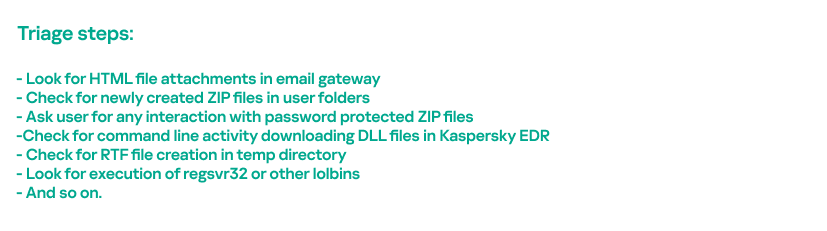
    1. Triage steps

    A good practice is to include triage (or investigation steps) in detection rule documentation. Since the DE team has spent a lot of time understanding the threat, it is very important to document the precursors and possible next steps the attacker can take. The SOC analyst can quickly review these and provide incident qualification with confidence.

    For the rule from the previous section, “Initial Access | Suspicious LNK files dropped in download folder | Windows – Medium”, the triage procedure is shown below.

    MITRE has a project called the Technique Inference Engine, which provides a model for understanding other techniques an attacker is likely to use based on observed adversary behavior. This tool can be useful for both DE and SOC teams. By analyzing the attacker’s path, organizations can improve alert correlation and enhance scoping of incident/threats.

    1. Baselining

    Understanding the infrastructure and its baseline operations is a must, as it helps reduce the false positive rate. The detection engineering team must learn the prevention policies (to de-prioritize detection if already remediated), learn about the technologies deployed in the infrastructure, understand the network protocols being used and user behavior under normal circumstances.

    For example, to detect T1480.002: Execution Guardrails: Mutual Exclusion sub-technique, MITRE recommends monitoring a “file creation” data component. According to the MITRE Data Sources framework, data components are possible actions with data objects and/or data objects statuses or parameters that may be relevant for threat detection. We discussed them in more detail in our detection prioritization article.

    MITRE’s detection recommendation for T1480.002 sub-technique

    A simple rule for detecting such activity is to monitor lock file creation events in the /var/run folder, which stores temporary runtime data for running services. However, if you have done the baselining and found that the environment uses containers that also create lock files to manage runtime operations, you can filter out container-linked events to avoid triggering false positive alerts. This filter is easy to apply, and overall detection can be improved by baselining the infrastructure you are monitoring.

    1. Finding the narrow corridors

    Some indicators, such as file hashes or software tools are easy to change, while others are more difficult to replace. Detections based on such “narrow corridors” tend to have high true positive rates. To pursue this, detection should focus primarily on behavioral indicators, ensuring that attackers cannot easily evade detection by simply changing their tools or tactics. Priority should be given to behavior-based detection over tool-specific, software-dependent, or IoC-driven approaches. This aligns with the Pyramid of Pain model, which emphasizes detecting adversaries based on their tactics, techniques, and procedures (TTPs) rather than easily replaceable indicators. By prioritizing common TTPs, we can effectively identify an adversary’s modus operandi, making detection more resilient and impactful.

    1. Universal rules

    When planning a detection program from scratch, it is important not to ignore the universal threat detection rules that are mostly available in SIEM by default. Detection engineers should operationalize them as soon as possible and tune them according to feedback received from SOC analysts or what they have learned about the organization’s infrastructure during baselining activity.

    Universal rules generally include malicious behavior associated with applications, databases, authentication anomalies, unusual remote access behavior, and policy violation rules (typically to monitor compliance requirements).

    Some examples include:

    • Windows firewall settings modification detected
    • Use of unapproved remote access tools
    • Bulk failed database login attempts

    Performance measurement

    Every investment needs to be justified with measurable outcomes that demonstrate its value. That is why communicating the value of a detection engineering program requires the use of effective and actionable metrics that demonstrate impact and alignment with business objectives. These metrics can be divided into two categories: program-level metrics and technical-level metrics. Program-level metrics signal to security leadership that the program is well aligned with the company’s security objectives. Technical metrics, on the other hand, focus on how operational work is being carried out to maximize the detection engineering team’s operational efficiency. By measuring both program-level metrics and technical-level metrics, security leaders can clearly show how the detection engineering program supports organizational resilience while ensuring operational excellence.

    Designing effective program-level metrics requires revisiting the core purpose for initiating the program. This approach helps identify metrics that clearly communicate success to security leadership. There are three metrics that can be very effective to measure the success at program level.

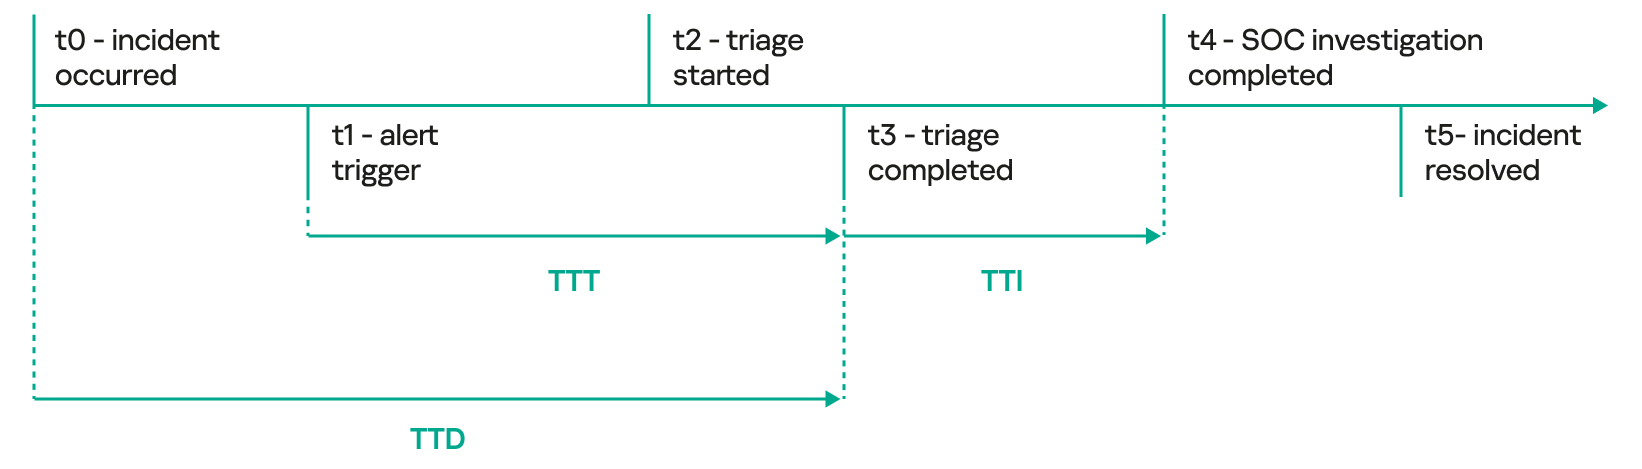
    1. Time to Detect (TTD) – this metric is calculated as the time elapsed from the moment an attacker’s initial activity is observed until the time it is formally detected by the analyst. Some SOCs consider the time the alert is triggered on the SIEM as the detection time, but that is not really an actionable metric to consider. The time the alert is converted into a potential incident is the best option to consider for detection time by SOC analysts.

    Although the initial detection of activity occurs at t1 (alert triggered), when malicious activity occurs, a series of events must be analyzed before qualifying the incident. This is why t3 is required to correctly qualify the detection as a potential threat. Additional metrics such as time to triage (TTT), which establishes how long it takes to qualify the incident, and time to investigate (TTI), which describes how long it takes to investigate the qualified incident, can also come in handy.

    Time to detect compared to time to triage and time to investigate metrics

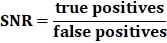
    1. Signal-to-Noise Ratio (SNR) – this metric indicates the effectiveness of detection rules by measuring the balance between relevant and irrelevant information. It compares the number of true positive detections (correct alerts for real threats) to the number of false positives (incorrect or misleading alerts).

    Where:

    True positives: instances where a real threat is correctly detected
    False positives: incorrect alerts that do not represent real threats

    A high SNR indicates that the system is generating more meaningful alerts (signal) compared to noise (false positives), thereby enhancing the efficiency of security operations by reducing alert fatigue and focusing analysts’ attention on genuine threats. Improving SNR is crucial to maximizing the performance and reliability of a detection program. SNR directly impacts the amount of SOC analyst effort spent on false positives, which in turn influences alert fatigue and the risk of professional burnout. Therefore, it is a very important metric to consider.

    1. Threat Profile Alignment (TPA) – this metric evaluates how well detections are aligned with known adversarial tactics, techniques, and procedures (TTPs). This metric measures this by determining how many of the identified TTPs are adequately covered by unique detections (unique data components).

    Total TTPs identified – this is the number of known adversarial techniques relevant to the organization’s threat model, typically derived from cyber threat intelligence threat profiling efforts
    Total TTPs covered with at least three unique detections (where possible) – this counts how many of the identified TTPs are covered by at least three distinct detection mechanisms. Having multiple detections for a given TTP enhances detection confidence, ensuring that if one detection fails or is bypassed, others can still identify the activity.
    Team efforts supporting the detection engineering program must also be measured to demonstrate progress. These efforts are reflected in technical-level metrics, and monitoring these metrics will help justify team scalability and address productivity challenges. Key metrics are outlined below:

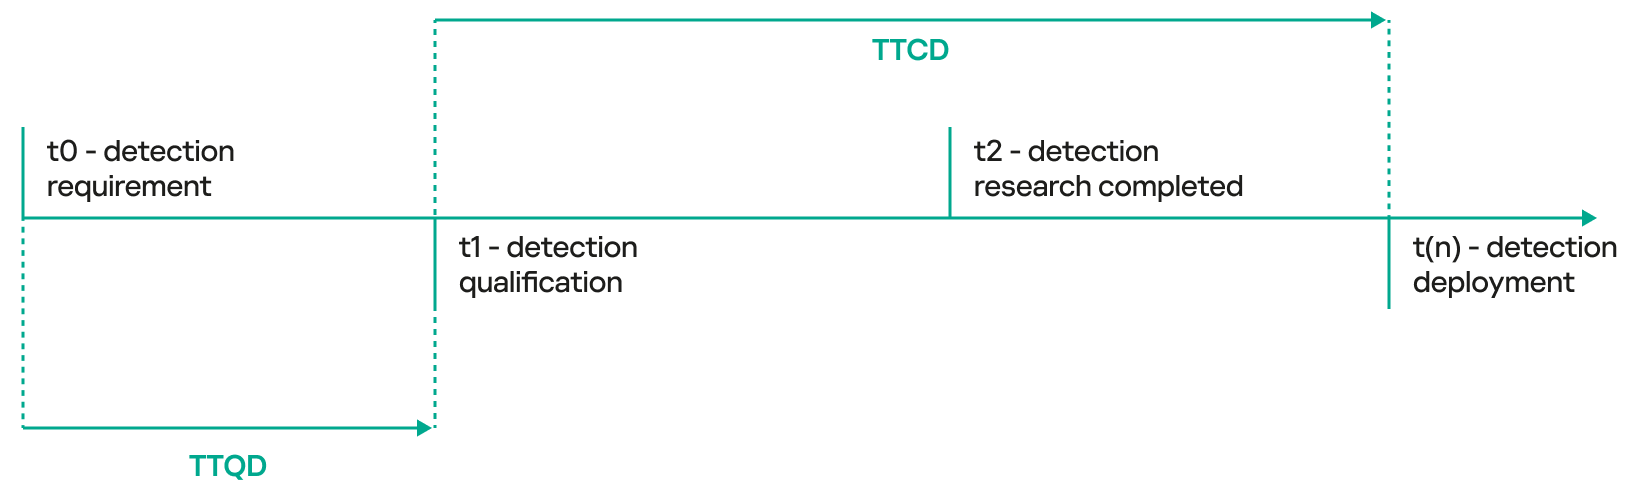
    1. Time to Qualify Detection (TTQD) – this metric measures the time required to analyze and validate the relevance of a detection for further processing. The Detection Engineering Lead assesses the importance of the detection and prioritizes it accordingly. The metric equals the time that has elapsed from when a ticket is raised to create a detection to when it is shortlisted for further research and implementation.

    1. Time to Create Detection (TTCD) – this tracks the amount of time required to design, develop and deploy a new detection rule. It highlights the agility of detection engineering processes in responding to evolving threats.

    1. Detection Backlog – the backlog refers to the number of pending detection rules awaiting review or consideration for detection improvement. A growing backlog might indicate resource constraints or inefficiencies.
    1. Distribution of Rules Criticality (High, Medium, Low) – this metric shows the proportion of detection rules categorized by their criticality level. It helps in understanding the balance of focus between high-risk and lower-risk detections.
    1. Detection Coverage (MITRE) – detection coverage based on MITRE ATT&CK indicates how well the detection rules cover various tactics, techniques, and procedures (TTPs) in the MITRE ATT&CK framework. It helps identify coverage gaps in the defense strategy. Tracking the number of unique detections that cover each specific technique is highly recommended, as it provides visibility into the threat profile alignment – a program level metric. If unique detections are not being built to detect gaps and the coverage is not increasing over time, it indicates an issue in the detection qualification process.
    1. Share of Rules Never Triggered – this metric tracks the percentage of detection rules that have never been triggered since their deployment. It may indicate inefficiencies, such as overly specific or poorly implemented rules, and provides insight for rule optimization.

    There are other relevant metrics, such as the proportion of behavior-based rules in the total set. Many more metrics can be derived from a general understanding of the detection engineering process and its purpose to support the DE program. However, program managers should focus on selecting metrics that are easy to measure and can be calculated automatically by available tools, minimizing the need for manual effort. Avoid using an excessive number of metrics, as this can lead to a focus on measurement only. Instead, prioritize a few meaningful metrics that provide valuable insight into the program’s progress and efforts. Choose wisely!

    MIL OSI Economics

  • MIL-OSI Economics: Euro area monthly balance of payments: February 2025

    Source: European Central Bank

    16 April 2025

    • Current account recorded €34 billion surplus in February 2025, down from €40 billion in previous month
    • Current account surplus amounted to €411 billion (2.7% of euro area GDP) in the 12 months to February 2025, up from €299 billion (2.0%) one year earlier
    • In financial account, euro area residents’ net acquisitions of non-euro area portfolio investment securities totalled €738 billion and non-residents’ net acquisitions of euro area portfolio investment securities totalled €800 billion in the 12 months to February 2025

    Chart 1

    Euro area current account balance

    (EUR billions unless otherwise indicated; working day and seasonally adjusted data)

    Source: ECB.

    The current account of the euro area recorded a surplus of €34 billion in February 2025, a decrease of €6 billion from the previous month (Chart 1 and Table 1). Surpluses were recorded for goods (€34 billion) and services (€14 billion). These were partly offset by deficits for secondary income (€10 billion) and primary income (€3 billion).

    Table 1

    Current account of the euro area

    Source: ECB.
    Note: Discrepancies between totals and their components may be due to rounding.

    Data for the current account of the euro area

    In the 12 months to February 2025, the current account surplus widened to €411 billion (2.7% of euro area GDP), up from €299 billion (2.0% of euro area GDP) one year earlier. This increase was driven by larger surpluses for goods (up from €320 billion to €371 billion), services (up from €128 billion to €169 billion) and primary income (up from €20 billion to €45 billion). The deficit for secondary income increased from €169 billion to €174 billion.

    Chart 2

    Selected items of the euro area financial account

    (EUR billions; 12-month cumulated data)

    Source: ECB.
    Notes: For assets, a positive (negative) number indicates net purchases (sales) of non-euro area instruments by euro area investors. For liabilities, a positive (negative) number indicates net sales (purchases) of euro area instruments by non-euro area investors.

    In direct investment, euro area residents made net investments of €172 billion in non-euro area assets in the 12 months to February 2025, following net disinvestments of €312 billion one year earlier (Chart 2 and Table 2). Non-residents disinvested €48 billion in net terms from euro area assets in the 12 months to February 2025, following net disinvestments of €386 billion one year earlier.

    In portfolio investment, euro area residents’ net purchases of non-euro area equity increased to €199 billion in the 12 months to February 2025, up from €73 billion one year earlier. Over the same period, net purchases of non-euro area debt securities by euro-area residents increased to €539 billion, up from €453 billion one year earlier. Non-residents’ net purchases of euro area equity increased to €408 billion in the 12 months to February 2025, up from €216 billion one year earlier. Over the same period, non-residents made net purchases of euro area debt securities amounting to €392 billion, declining from net purchases of €414 billion one year earlier.

    Table 2

    Financial account of the euro area

    Source: ECB.
    Notes: Decreases in assets and liabilities are shown with a minus sign. Net financial derivatives are reported under assets. “MFIs” stands for monetary financial institutions. Discrepancies between totals and their components may be due to rounding.

    Data for the financial account of the euro area

    In other investment, euro area residents recorded net acquisitions of non-euro area assets amounting to €427 billion in the 12 months to February 2025 (up from €199 billion one year earlier), while they recorded net incurrences of liabilities of €110 billion (following net disposals of €174 billion one year earlier).

    Chart 3

    Monetary presentation of the balance of payments

    (EUR billions; 12-month cumulated data)

    Source: ECB.
    Notes: “MFI net external assets (enhanced)” incorporates an adjustment to the MFI net external assets (as reported in the consolidated MFI balance sheet items statistics) based on information on MFI long-term liabilities held by non-residents, available in b.o.p. statistics. B.o.p. transactions refer only to transactions of non-MFI residents of the euro area. Financial transactions are shown as liabilities net of assets. “Other” includes financial derivatives and statistical discrepancies.

    The monetary presentation of the balance of payments (Chart 3) shows that the net external assets (enhanced) of euro area MFIs increased by €471 billion in the 12 months to February 2025. This increase was driven by the current and capital accounts surplus and, to a lesser extent, by euro area non-MFIs’ net inflows in portfolio investment equity and debt, other investment and other flows. These developments were partly offset by euro area non-MFIs’ net outflows in direct investment.

    In February 2025 the Eurosystem’s stock of reserve assets increased to €1,477.8 billion up from €1,457.5 billion in the previous month (Table 3). This increase was mainly driven by positive price changes (€17.9 billion), mostly due to an increase in the price of gold, and, to a lesser extent, by net acquisitions of assets (€1.3 billion) and positive exchange rate changes (€1.0 billion).

    Table 3

    Reserve assets of the euro area

    Source: ECB.
    Notes: “Other reserve assets” comprises currency and deposits, securities, financial derivatives (net) and other claims. Discrepancies between totals and their components may be due to rounding.

    Data for the reserve assets of the euro area

    Data revisions

    This press release incorporates revisions to the data for January 2025. These revisions did not significantly alter the figures previously published.

    Next releases:

    • Monthly balance of payments: 20 May 2025 (reference data up to March 2025)
    • Quarterly balance of payments: 03 July 2025 (reference data up to the first quarter of 2025)

    For media queries, please contact Benoît Deeg, tel.: +49 172 1683704.

    Notes

    • Current account data are always seasonally and working day-adjusted, unless otherwise indicated, whereas capital and financial account data are neither seasonally nor working day-adjusted.
    • Hyperlinks in this press release lead to data that may change with subsequent releases as a result of revisions.

    MIL OSI Economics

  • MIL-OSI Economics: Thales delivers complete set of Dual Travelling Wave Tubes (TWTs) for the Optus-11 Satellite, developed by Airbus Defence and Space

    Source: Thales Group

    Headline: Thales delivers complete set of Dual Travelling Wave Tubes (TWTs) for the Optus-11 Satellite, developed by Airbus Defence and Space

    • In order to enhance satellite performance and mission efficiency, travelling wave tubes (TWTs), which amplify radiofrequency signals in satellite systems, can be doubled and integrated together into a more compact and lightweight format (Dual-TWT),. This technology, with performances that are unique in the world, contributes to the new flexibility requirements of satellites.
    • Thales has delivered all the Dual-TWTs necessary for the optimal performance of the Optus-11 satellite, developed by Airbus Defence and Space, and operating in the Ku-band1. This delivery will significantly improve the communication and data management capabilities of Optus-11, while enhancing its performance and operational reliability.
    • Reconfigurable even in orbit, this flexible satellite represents a major advancement in the field of geostationary telecommunications satellites.
    © Airbus Defense and Space” id=”image-c42f2a26-0769-4e95-b799-941f5e3be8d5″ data-id=”c42f2a26-0769-4e95-b799-941f5e3be8d5″ data-original=”https://cdn.uc.assets.prezly.com/c42f2a26-0769-4e95-b799-941f5e3be8d5/-/inline/no/PR+IMG.png” data-mfp-src=”https://cdn.uc.assets.prezly.com/c42f2a26-0769-4e95-b799-941f5e3be8d5/-/format/auto/” alt=”© Airbus Defense and Space”/>
    © Airbus Defense and Space

    As the foundation of a new generation of highly flexible and innovative telecommunications satellites that can quickly adapt to the changing dynamics of the market and user needs, the OneSat program by Airbus Defence and Space has been developed through synergies among key national and international space industry players. While Airbus is responsible for the main design, TESAT is integrating Thales’s TWTs in to Microwave Power Modules (MPM). Both partners bring their expertise in communication systems, built on Thales’s experience with over 23,200 TWTs in orbit.

    Thales’s next-generation Dual-TWTs offer unparalleled global performance, combining reduced weight and size with advanced technology. These Dual-TWTs are engineered to provide exceptional reliability and performance in constrained space environments. Easily integrated into the satellite antenna system, they are a crucial element for the success of the Optus program. Available in two versions for both the Ku and Ka band satellite frequency ranges, the Dual-TWTs fully meet the requirements of active antenna amplification systems designed for flexible and software-defined satellites.

    Three of Thales’s facilities are collaborating to manufacture the Dual-TWTs: Ulm in Germany, and Thonon-les-Bains and Vélizy in France.

    With key components such as Thales’ Ku-band Dual-TWTs, the Optus-11 satellite is positioned as a vital element for next-generation spacecraft, significantly enhancing their communication and satellite service capabilities.

    “We are honored to make a significant contribution to the operation of the Optus-11 satellite by providing Airbus Defence and Space with our next-generation Dual Travelling Wave Tubes. Our successful delivery of this system for the first flight model showcases Thales’s ability to quickly provide cutting-edge technological solutions that will shape the future of space communications,” said Charles-Antoine Goffin, Vice President, Microwave and Imaging Systems, Thales.

    1Frequency of 12-18 GHz, allowing satellites to send and receive messages without interfering with other signals.

    MIL OSI Economics

  • MIL-OSI Economics: Utmost Trustee Solutions Limited

    Source: Isle of Man

    Notice is hereby given that Utmost Trustee Solutions Limited, which was licensed under Section 7 of the Financial Services Act 2008, was dissolved following a merger with Utmost International Trustee Solutions Limited with effect from 20/02/2025 and is therefore no longer Licensed. Utmost International Trustee Solutions Limited remains a Licensed entity.

    MIL OSI Economics

  • MIL-OSI Economics: Samsung Partners with Twickenham Film Studios and Quite Brilliant to Provide New LED Stage to Lead the Future of UK’s Virtual Production Capabilities

    Source: Samsung

    Samsung The Wall for Virtual Production – Photo Credit: Twickenham Film Studios/Quite Brilliant
     
    Samsung Electronics has today announced a new partnership with Twickenham Film Studios (TFS) and award-winning Virtual Production (VP) experts Quite Brilliant (QB) that will see Samsung’s cutting-edge VP technology housed at Twickenham.
     
    The partnership will see all the parties working closely together to push Virtual Production as a creative, cost-effective and more sustainable production process. Installation of the new facility is to be completed by the end of May 2025.
     
    This represents Samsung’s first major LED screen build in the UK and its third globally and will be housed at Twickenham’s historic Stage 3. It will be one of the largest permanent LED Display sound stages in the UK with a 24 x 4.5 metre back wall, a 105 sq metre LED ceiling and additional LED mobile totem walls along with a permanent turntable and motion control crane.   
     
    It also underlines Samsung’s commitment to supporting the creative industries within the UK. Samsung has been selected due to its superior picture quality, one of the most important factors in virtual production.
     
    The LED wall itself boasts Samsung’s latest IVC 2.1 pixel pitch technology and ARRI colour calibration management system. The ultra-large LED wall creates virtual content that can then be integrated with real-time visual effects technology providing an incredible result.
     
    Deborah Honig, Chief Customer Officer at Samsung Electronics, said: “As one of the world’s leaders in picture quality and screen technology, we are excited about the possibilities of how this could transform Virtual Production.
     
    “This technology opens the door to limitless potential for filmmakers, producers and content creators from various industries by amplifying digital effects, while making virtual content creation easier, faster and more cost effective. Alongside our ambitious partners at Twickenham Studios and Quite Brilliant we are excited to usher in a new era of excellence within this area.”
     
    “Having taken over Twickenham Film Studios in 2012, this new venture marks the next phase of our multi-year strategy to invest in Twickenham’s future. Samsung is our ideal partner. They see the value of our world-class award-winning team and appreciate our approach in balancing investment in technology with investment in our people.  This is why we are a preferred facility for so many of the world’s greatest filmmakers.” said Sunny Vohra, owner of TFS.
     
    “Twickenham Film Studios has been my home for the last 5 years, and I love being based here. Their talented team are always committed to delivering the very best. This great partnership with Samsung reinforces Twickenham’s position for the future as a vital part of the British Film Industry.” said Kenneth Branagh.
     
    “With five years and more than 200 VP projects under our belt, we have designed the stage, in partnership with Samsung to meet the needs of producers and directors.  This is designed by filmmakers for filmmakers. The stage will service all projects from features and television to advertising and social content. This is a bold statement about Twickenham’s commitment to the future of the UK film, television and media industry” said Quite Brilliant’s Managing Director, Chris Chaundler.
     
    Russell Shaw Quite Brilliant’s Head of Virtual Production added; “The stage will service all projects from features and television to advertising and social content. This is a bold statement about Twickenham’s commitment to the future of film making, supporting the UK film, television and media industry and embracing new technologies”
     
    Samsung will also have a base at the historic studios in Twickenham, widely recognised as a centre of excellence in post-production with an Oscar-winning team.
     
    Additional Technical Information on the LED Volume Stage/Technology
    To display colours as accurately and consistently as possible, The Wall for Virtual Production features 3D lookup tables (LUTs) for colour correction, wide-gamut HDR colour processing and colour adjustment between individual cabinets or modules.
     
    Meanwhile, the integrated Virtual Production Management (VPM) software and its intuitive interface make it easy and more efficient to manage the screen and facilitate the highest possible picture quality in a virtual production environment. The VPM is also capable of detecting and resolving any potential LED-related issues.
     
    The new IVC P2.1 model includes a curvature range that can stretch up to 5,800R, which creates a more realistic field of view. The display also packs an updated genlock feature that keeps The Wall in line with the system’s signals, so there aren’t any dropped or doubled frames. This capability — along with the enhanced phase offset feature that adjusts the time delay between camera and screen — ensures a perfect image.
     
    The Wall for Virtual Production features top-of-the-line capabilities, including:
     
    An improved 4:9 ratio that provides a variety of installation options, including the ability to be hung or stacked with other screens to maximise results in different production environments.
     
    A 12,288 Hz refresh rate that minimises flicker lines and ensures a clear outcome, regardless of the camera used during filming.
     
    Black Seal Technology+ that delivers the purest black levels for new depth. Users will experience unparalleled contrast that is specifically designed to be resilient to the dust and particles common in production environments.
     
    20-bit processing to present exact colour mapping with faultless accuracy and a precise linear greyscale that shows the intricacies of every scene. Users will be able to see realistic textures, volume and continuous shadow details.

    MIL OSI Economics

  • MIL-OSI Economics: Samsung News Launches in A UK First to Deliver Personalised News Straight to Your Fingertips

    Source: Samsung

     
    LONDON, UK – 16th April 2025 – Samsung Electronics Co., Ltd today announced the UK-first launch of Samsung News, a brand-new news app designed to deliver the daily news you need.
     
    Samsung News provides a fresh approach to digital news consumption by offering a full spectrum of news from a range of diverse publications—completely free and without paywalls. The service brings together top publishers, including Sky News, Sky Sports Daily Mail, The Standard, The Independent, Mirror, Business Insider, Reuters, Metro, Indy 100, and OK!, alongside other local news outlets, to create a seamless, high-quality news experience.
     
    A Personalised Way to Read the News
    Built for customisation and convenience, Samsung News allows users to tailor their feeds with preferred topics. A team of Editors will curate news based on reading habits, with options to select categories like politics, business, sports, and entertainment, plus up to three regions from a choice of 12*.
     
    Key features include Morning & Evening Briefings for curated news updates at the start and end of the day, Top Stories highlighting a handpicked selection of trending articles, and Subject Spotlights offering in-depth insights on specific news stories with diverse perspectives.
     
    Seamless Integration with the Samsung Ecosystem
    Samsung News is designed to work in harmony with the Samsung Galaxy ecosystem, adapting to users’ preferences and offering an intuitive reading experience. Whether catching up on the headlines over morning coffee or winding down with evening briefings, the app ensures effortless access to reliable journalism.
     
    Stringent Editorial Standards with Human Oversight
    Samsung News has established strict editorial guidelines to provide additional clarity and parity across US and UK standards. These are overseen by our experienced Editors, who have formed an editorial committee that ensures standards are upheld.
     
    This team is also responsible for maintaining a diverse and balanced portfolio of publishers, tracking political leanings to ensure Samsung News remains neutral and using their judgement to curate credible and trustworthy content. Andrew Bailey, Editor-in-Chief, Samsung News, says: “There’s never been a greater need for accurate, verified, and balanced news that doesn’t live behind a paywall. Our goal with Samsung News is to offer Galaxy users a broad selection of free content from premium partners, including breaking news, deep-dives, and briefings hand-picked by our experienced news editors.
     
    “Users will also be able to customise their feeds by following publishers and topics that interest them, such as Sport, Business and Entertainment. With diverse content from hundreds of sources, we aim to provide all sides of a story.”
     
    David Rhodes, Executive Chairman, Sky News Group, says: “Sky News is trusted by millions for fast and accurate breaking news, deep analysis and insight and eyewitness journalism from around the world. We’re delighted, alongside our Sky Sports colleagues, to be partnering with Samsung News allowing us to bring millions more Galaxy users the full story, first.”
     
    Samsung News will be rolled out to users as an update to Samsung Free, previously offering a variety of free multimedia content including TV, news, podcasts, and instant games. Users who already have the Samsung Free app on their device will see the icon change to Samsung News starting on 31st March 2025, when their apps are updated. All other users will be able to access the app by downloading directly from the Samsung Galaxy Store.
     
    To experience a smarter way to stay updated, simply open Samsung News and start personalising your feed today. Or visit the Galaxy Store for further information.
     
    *Regions include: London, South East, South West, Scotland, Northern Ireland, Wales, North West, North East, Yorkshire & Humbar, East Midlands, West Midlands, and East of England.

    MIL OSI Economics

  • MIL-OSI Economics: CBB 12 Month Treasury Bills Issue No. 127 Oversubscribed

    Source: Central Bank of Bahrain

    CBB 12 Month Treasury Bills Issue No. 127 Oversubscribed

    Published on 15 April 2025

    Manama, Bahrain –15th April 2025 – This week’s BD 100 million issue of Government Treasury Bills has been oversubscribed by 123%.

    The bills, carrying a maturity of 12 months, are issued by the CBB, on behalf of the Kingdom of Bahrain.

    The issue date of the bills is 17th April 2025, and the maturity date is 16th April 2026.

    The weighted average rate of interest is 5.03% compared to 4.88% of the previous issue on 20th March 2025.

    The approximate average price for the issue was 95.162% with the lowest accepted price being 94.823%.

    This is issue No. 127 (ISIN BH0002580072) of Government Treasury Bills. With this, the total outstanding value of Government Treasury Bills is BD 2.110 billion.

    Share this

    MIL OSI Economics

  • MIL-OSI Economics: Underwriting Auction for sale of Government Securities for ₹30,000 crore on April 17, 2025

    Source: Reserve Bank of India

    Government of India has announced the sale (re-issue) of Government Securities, as detailed below, through auctions to be held on April 17, 2025 (Thursday).

    As per the extant scheme of underwriting commitment notified on November 14, 2007, the amounts of Minimum Underwriting Commitment (MUC) and the minimum bidding commitment under Additional Competitive Underwriting (ACU) auction, applicable to each Primary Dealer (PD), are as under:

    (₹ crore)
    Security Notified Amount MUC amount per PD Minimum bidding commitment per PD under ACU auction
    6.79% GS 2031 11,000 262 262
    6.98% GOI SGrB 2054 5,000 120 120
    7.09% GS 2074 14,000 334 334

    The underwriting auction will be conducted through multiple price-based method on April 17, 2025 (Thursday). PDs may submit their bids for ACU auction electronically through Core Banking Solution (E-Kuber) System between 09:00 A.M. and 09:30 A.M. on the day of underwriting auction.

    The underwriting commission will be credited to the current account of the respective PDs with RBI on the day of issue of securities.

    Ajit Prasad          
    Deputy General Manager
    (Communications)    

    Press Release: 2025-2026/112

    MIL OSI Economics

  • MIL-OSI Economics: All-New Lexus ES to Debut at Auto Shanghai 2025 on April 23rd

    Source: Toyota

    Headline: All-New Lexus ES to Debut at Auto Shanghai 2025 on April 23rd

    LEXUS to unveil the all-new ES on April 23rd at the Shanghai International Automobile Industry Exhibition (April 23 – May 2). Details of the all-new ES, a global flagship model that refines advanced electrification technologies and pursues further evolution of its the hallmark quietness and ride comfort, will be announced at a press conference in the Lexus booth on April 23rd. In anticipation of the debut of this new proposition of luxury, Lexus has released a teaser image showing some of the unique design elements.

    MIL OSI Economics

  • MIL-OSI Economics: ADB Approves $1.45 Billion Final Tranche for Philippines’ Malolos-Clark Railway Project

    Source: Asia Development Bank

    ADB has approved $1.45 billion as the second and final tranche of its multitranche financing facility for the Malolos–Clark Railway Project, a core element of the government’s flagship project to provide a safe, affordable, reliable, and environment-friendly railway connecting northern and southern Luzon provinces to Metro Manila.

    MIL OSI Economics

  • MIL-OSI Economics: Money Market Operations as on April 15, 2025

    Source: Reserve Bank of India


    (Amount in ₹ crore, Rate in Per cent)

      Volume
    (One Leg)
    Weighted
    Average Rate
    Range
    A. Overnight Segment (I+II+III+IV) 6,26,000.41 5.76 3.00-6.80
         I. Call Money 14,971.25 5.84 5.00-5.95
         II. Triparty Repo 4,07,428.90 5.74 5.55-5.80
         III. Market Repo 2,01,961.26 5.79 3.00-6.80
         IV. Repo in Corporate Bond 1,639.00 5.96 5.90-6.05
    B. Term Segment      
         I. Notice Money** 125.97 5.65 5.50-5.90
         II. Term Money@@ 604.00 5.75-6.10
         III. Triparty Repo 11,500.70 5.90 5.85-6.00
         IV. Market Repo 487.46 6.10 6.10-6.10
         V. Repo in Corporate Bond 0.00
      Auction Date Tenor (Days) Maturity Date Amount Current Rate /
    Cut off Rate
    C. Liquidity Adjustment Facility (LAF), Marginal Standing Facility (MSF) & Standing Deposit Facility (SDF)
    I. Today’s Operations
    1. Fixed Rate          
    2. Variable Rate&          
      (I) Main Operation          
         (a) Repo          
         (b) Reverse Repo          
      (II) Fine Tuning Operations          
         (a) Repo Tue, 15/04/2025 1 Wed, 16/04/2025 9,564.00 6.01
         (b) Reverse Repo          
    3. MSF# Tue, 15/04/2025 1 Wed, 16/04/2025 32.00 6.25
    4. SDFΔ# Tue, 15/04/2025 1 Wed, 16/04/2025 1,77,126.00 5.75
    5. Net liquidity injected from today’s operations [injection (+)/absorption (-)]*       -1,67,530.00  
    II. Outstanding Operations
    1. Fixed Rate          
    2. Variable Rate&          
      (I) Main Operation          
         (a) Repo          
         (b) Reverse Repo          
      (II) Fine Tuning Operations          
         (a) Repo          
         (b) Reverse Repo          
    3. MSF#          
    4. SDFΔ#          
    D. Standing Liquidity Facility (SLF) Availed from RBI$       7,804.70  
    E. Net liquidity injected from outstanding operations [injection (+)/absorption (-)]*     7,804.70  
    F. Net liquidity injected (outstanding including today’s operations) [injection (+)/absorption (-)]*     -1,59,725.30  
    G. Cash Reserves Position of Scheduled Commercial Banks
         (i) Cash balances with RBI as on April 15, 2025 9,28,892.68  
         (ii) Average daily cash reserve requirement for the fortnight ending April 18, 2025 9,31,571.00  
    H. Government of India Surplus Cash Balance Reckoned for Auction as on¥ April 15, 2025 9,564.00  
    I. Net durable liquidity [surplus (+)/deficit (-)] as on March 21, 2025 1,11,247.00  
    @ Based on Reserve Bank of India (RBI) / Clearing Corporation of India Limited (CCIL).
    – Not Applicable / No Transaction.
    ** Relates to uncollateralized transactions of 2 to 14 days tenor.
    @@ Relates to uncollateralized transactions of 15 days to one year tenor.
    $ Includes refinance facilities extended by RBI.
    & As per the Press Release No. 2019-2020/1900 dated February 06, 2020.
    Δ As per the Press Release No. 2022-2023/41 dated April 08, 2022.
    * Net liquidity is calculated as Repo+MSF+SLF-Reverse Repo-SDF.
    ¥ As per the Press Release No. 2014-2015/1971 dated March 19, 2015.
    # As per the Press Release No. 2023-2024/1548 dated December 27, 2023.
    Ajit Prasad          
    Deputy General Manager
    (Communications)    
    Press Release: 2025-2026/110

    MIL OSI Economics

  • MIL-OSI Economics: Trade Policy Review: Sierra Leone

    Source: WTO

    Headline: Trade Policy Review: Sierra Leone

    The following documents are available:
    Secretariat report
    A detailed report written independently by the WTO Secretariat.

    Government report
    A policy statement by the government of the member under review.

    From the meeting
    The Secretariat and Government reports are discussed by the WTO’s full membership in the Trade Policy Review Body (TPRB).
    Concluding remarks

    Background
    Trade Policy Reviews are an exercise, mandated in the WTO agreements, in which member countries’ trade and related policies are examined and evaluated at regular intervals. Significant developments that may have an impact on the global trading system are also monitored. All WTO members are subject to review, with the frequency of review depending on the country’s size.

    Share

    MIL OSI Economics

  • MIL-OSI Economics: Meet four emerging filmmakers bending cultural and creative lines with iPhone 16 Pro Max

    Source: Apple

    Headline: Meet four emerging filmmakers bending cultural and creative lines with iPhone 16 Pro Max

    April 15, 2025

    UPDATE

    Meet four emerging filmmakers bending cultural and creative lines with iPhone 16 Pro Max

    The talent behind this year’s MAMI Select: Filmed on iPhone projects delve into how India’s varied landscapes and cultures shaped their shorts

    Writer, director, and actor Konkona Sen Sharma believes that beyond technology, a filmmaker’s most important tool is courage.

    “With iPhone, there’s so much power contained in such a compact package that you can bypass the conventions of mainstream filmmaking,” says Sen Sharma, a two-time winner of India’s National Film Awards. “All you need is a great idea, and the guts and determination to follow through with it.”

    Alongside fellow Indian film industry icons Vikramaditya Motwane, Lijo Jose Pellissery, and Vetri Maaran, Sen Sharma is mentoring four emerging filmmakers selected by the Mumbai Academy of the Moving Image (MAMI) to create short films for the 2025 MAMI Select: Filmed on iPhone program.

    Now in its second year, the program empowers MAMI alumni to push the boundaries of technology and innovation, shooting their projects on iPhone 16 Pro Max and editing them on MacBook Pro with M4 Max. Two of last year’s participating films recently won 2025 Critics’ Choice Awards India for Best Short Film, Best Director (Short Film), and Best Writing (Short Film).

    “Shooting on iPhone allows for complete personal expression,” says Maaran, writer-director of the upcoming Tamil action thriller Vaadivaasal. He believes he is learning as much from his mentees as he is teaching them. “We’re living in the age of democracy in filmmaking.”

    This year’s MAMI Select filmmakers — Amrita Bagchi, Rohin Raveendran Nair, Chanakya Vyas, and Shalini Vijayakumar — are discovering new cinematic worlds through the lens of iPhone 16 Pro Max.

    “The unique voices of these filmmakers are beautifully contextualized through the four languages and regions of India in which they are rooted,” says MAMI festival director Shivendra Singh Dungarpur.

    “These are very passionate people with important stories to tell,” says Pellissery, the filmmaker behind Malayalam features like Ee.Ma.Yau. and Jallikattu. “Shooting on iPhone, they are pushing their own limits with fantastic results.”

    Each filmmaker leveraged the powerful capabilities of MacBook Pro with the M4 Max chip to weave their stories together. “Shooting and editing within the Apple family of products gives you a stellar advantage: speed,” says writer-director Motwane, whose work in film and television includes Udaan and Black Warrant.

    That lightning-fast performance of MacBook Pro alongside the ease of use of iPhone 16 Pro Max is giving these artists even more creative control on and off set.

    Navigating childhood and change, legacy, and liberation, Bagchi, Nair, Vyas, and Vijayakumar recently premiered their stories in Mumbai.

    Creating Claustrophobia with Cinematic Mode

    With a background in design, acting, singing, and songwriting, Amrita Bagchi feels she was always destined to be a filmmaker. “It’s like a confluence of all the art forms,” she says.

    Bagchi, whose short film Succulent won the Grand Jury Prize at the Indian Film Festival of Los Angeles in 2022, hails from Kolkata, the city in West Bengal, India, that has produced cinematic stalwarts like Satyajit Ray and Mrinal Sen. It’s also the home of many a spooky story.

    Her new short film, Tinctoria, is a psychological thriller inspired by an actual historical event: the indigo revolt that arose in Bengal in 1859. It tells the story of a modern-day fashion mogul whose ancestral legacy is built on the skeletons of indigo farmers from the colonial era — the ghosts of whom quite literally come back to haunt her.

    To create the immersive, claustrophobic atmosphere of a thriller, Bagchi is engaging Cinematic mode for the film’s opening montage. “We’re tracking bubbles and plastic sheets flying through the air, and the depth of field is so clean,” she says. “Just like it’s shot on a huge, high-budget cinematic camera.”

    Bagchi believes her film could never have been shot through traditional means.

    “It was a very ambitious production, but with iPhone 16 Pro Max, I can constantly create and improvise,” she says. “That edginess of movement, it’s like visual rap.”

    With graphically demanding workflows — like overlaying the industry-standard Rec. 709 color space on ProRes Log footage captured on iPhone — she is surprised that her M4 Max MacBook Pro hasn’t lagged once.

    “It’s like a rocket machine,” she says. “On a tight schedule I can just shoot at 4K120 fps on my iPhone, and still have tremendous flexibility to change the pacing during the edit on my MacBook Pro.”

    The theme of legacy runs strong with Bagchi, and not just in her film. “We want to emulate pioneers like Satyajit Ray. He didn’t let the conventions of his time dictate his story,” she says.

    ProRes Paints a Coastal Canvas

    “Even though I grew up in New Delhi, I’ve always been exposed to Kerala’s brave, daring cinema,” says Rohin Raveendran Nair, a director, writer, and cinematographer whose credits include Netflix shows like Sacred Games and Black Warrant.

    Nair’s short film Kovarty takes him back to his roots in the coastal city of Alleppey. A love story tinged with magical realism, it showcases the relationship between a typewriter and typist. Qwerty, as the typewriter is christened, is slowly transformed by the lilting local accent into Kovarty. This acts as a metaphor for the film’s major theme: change.

    The prospect of shooting on iPhone 16 Pro Max was instrumental in Nair’s choice of narrative. “Using iPhone’s small form factor, I could place the camera inside the typewriter and capture its POV,” he says. “This, along with practical effects with fish wires, helps bring the device to life.”

    Nair is framing his point of view shots in a 4:3 aspect ratio to emulate the verticality of a sheet of paper. These are juxtaposed against a wider 2:1 aspect ratio when capturing the expansive backwater landscapes. For some old-world charm, he also uses a bloom filter to create a halo around the highlights.

    Nair believes iPhone 16 Pro Max will complement Alleppey’s vivid blue-greens.

    “One day our location is bright and sunny, the next it’s cloudy and gloomy,” he says. “The camera captures such rich detail with ProRes Log in all sorts of lighting situations.”

    Action Mode Helps Cut Through the Noise

    For his new short film Mangya, educator and thespian Chanakya Vyas found inspiration in an unusual place. “It may seem obsolete, but a newspaper is a great place to discover stories,” he says.

    Vyas — whose short film Loo was nominated for Best Short Film (Narrative) at the New York Indian Film Festival — went down a rabbit hole after reading an article about an avian flu outbreak in suburban Mumbai. That, combined with the devastating loss of his golden retriever, inspired his new short film.

    Mangya is a coming-of-age tale about an 11-year-old boy and his pet, the titular rooster. “Losing a pet is very different from the loss of another person,” muses Vyas. “What started out as a story about a lonely boy, eventually became one about letting go.”

    For a key scene in the film, Vyas is tracking his actor for 1,000 feet just before the break of dawn.

    “There’s no time to mount the camera on a traditional gimbal,” he says. “But with Action mode, I could even shoot multiple takes. The stabilization is just so impressive.”

    Recording clean sound in a country as loud as India can be tricky, but Vyas is incorporating the cacophony into his milieu.

    “We’re able to layer footsteps, the rooster crowing, and the whirring sound of a fan with distinct clarity with the studio-quality mics on iPhone 16 Pro Max,” he says. “The native audio is that good in its bit rate and cadence.”

    Out amid the chicken coops while on set, Vyas relies on the nano-texture display of his MacBook Pro, which dramatically reduces glare and distractions from reflections coming from the overhead sun as he reviews the continuity of his shots. Nano-texture is a game-changing experience when working outdoors.

    “For a director, the most important thing is how the footage will turn out,” Vyas says. “Thankfully the Liquid Retina XDR display on my MacBook Pro gives me an accurate representation of the actual colors we will see in the finished version.”

    Screaming in Slow Motion

    Growing up in a traditional Tamil-speaking home in Chennai, filmmaker Shalini Vijayakumar loved hearing stories about her mother’s large family. “Some used to be funny, others were sad,” she says.

    “Some were about an uncle who used to talk to ghosts,” she continues. “As a 6-year-old, I would imagine myself in my mom’s place — full of stories to tell.”

    Her influences all come together in her new short film, Seeing Red, a comedic horror film about the quashed emotions of the women in a large Tamil household.

    Set in the 1980s, the film begins with three different women screaming in horror after seeing a ghost. It ends with them screaming to express a collective, repressed rage. “It’s like a journey from being scared to being angry,” she says. “The actors enjoy just getting to shout at the top of their lungs. And I scream with them because I’m also letting it all out.”

    To depict the scream, Vijayakumar is inverting a traditionally masculine visual device from Tamil cinema using iPhone 16 Pro Max. “I call these the ‘mass shots’ where the heroes walk dramatically in slow motion,” she says. “I’m doing that for the women in 4K120 fps, and it looks fabulous.”

    For more tightly framed shots, the 120 mm lens on iPhone 16 Pro Max allows her to bring together her narrative, staging, and theme in a single shot that she composed using Procreate on iPad.

    “Using the 5x Telephoto lens, I’m able to place the men in front as they discuss the fate of the women in the background,” Vijayakumar explains. “There’s so much storytelling in that one frame through that particular lens.”

    For all the complexities of theme, technology, and technique, both Vijayakumar and Seeing Red possess an ephemeral lightness of spirit. “My hope is that everyone has fun and remembers that women screamed in it!”

    Vikramaditya Motwane, the award-winning director and program mentor, is convinced the four MAMI Select filmmakers can carry forward the legacy of visionaries like Orson Welles and Satyajit Ray. “These filmmakers can be the pioneers who take the camera to places we’ve never seen before,” he says.

    Watch these four short films on the MAMI YouTube channel.

    Press Contacts

    Renee Felton

    Apple

    rfelton@apple.com

    Apple Media Helpline

    media.help@apple.com

    MIL OSI Economics

  • MIL-OSI Economics: Google continues positive momentum in team collaboration, says GlobalData

    Source: GlobalData

    Google continues positive momentum in team collaboration, says GlobalData

    Posted in Technology

    As part of Google Cloud Next ’25, Google explored enhancements coming to Google Workspace, its team collaboration platform. The enhancements are fueled by Gemini, Google’s most capable set of large language models (LLMs) ever. They incorporate both generative AI and agentic AI, the latest AI advancement, according to GlobalData, a leading data and analytics company.

    Gregg Willsky, Principal Analyst, Enterprise Technology & Services at GlobalData, comments: “Google and its rivals have aggressively been circulating AI features across their platforms. Up until very recently, those additions were steeped in generative AI. It seems almost out of nowhere, competitors are now touting agentic AI capabilities as well.”

    Google is no exception. Agentic AI is the engine behind Google Workspace Flows, currently available in alpha. The capability automates multi-step processes using AI that can research, analyze, and consider context; for example, approving a request upon reviewing documents, which reflect an organization’s policies.

    Willsky continues: “In addition to its new agentic AI capability, Google announced impressive features based on generative AI. ‘Help me refine’ in Google Docs will be available in alpha later this quarter and offers suggestions for strengthening written communication. When it becomes available later this year, ‘Help me analyze’ in Google Sheets will highlight interesting trends in users’ data. Gemini in Meet, arriving later in Q2 2025, helps attendees catch up on what they missed, get clarity around specific topics or discussions, or organize their thoughts and sharpen arguments before entering a discussion.”

    Most pronounced about the unveiled features are their overall quality and the positive continued momentum they represent for Google in the team collaboration space.

    Willsky concludes: “Given Google’s position as a pioneer and leader in AI, there is no doubt the momentum will continue. The Gemini set of LLM’s provides Google Workspace with powerful AI capabilities and Google with differentiation from rivals’ ‘flavors’ of AI.”

    MIL OSI Economics