Category: Ukraine

  • MIL-OSI Global: USAid shutdown isn’t just a humanitarian issue – it’s a threat to American interests

    Source: The Conversation – UK – By Natasha Lindstaedt, Professor in the Department of Government, University of Essex

    The website for the United States Agency for International Development (USAid), the world’s biggest aid donor, has gone dark.

    Donald Trump’s new administration plans to place the autonomous agency under the control of the state department. The secretary of state, Marco Rubio, has now declared himself as head of the agency to “align” it with Trump’s priorities.

    Several days ago, on January 26, Rubio said: “Every dollar we spend, every programme we fund, and every policy we pursue must be justified with the answer to three simple questions: Does it make America safer? Does it make America stronger? Does it make America more prosperous?”

    But the decision to freeze USAid, which is part of Trump’s policy to put “America first”, places everyone at risk. Organisations that provide vital care for vulnerable people around the world are being forced to halt operations. The boss of one such organisation said: “People will die.”

    Elon Musk, the world’s richest man and a close adviser to Trump, is playing an active role in the destruction of USAid. He has claimed – without providing any evidence – that the agency is “beyond repair”. “It needs to die,” Musk wrote on X.

    Musk, who leads the newly formed Department of Government Efficiency (Doge), is gearing to cut trillions of dollars from the US budget. However, by seeing cuts to USAid as a solution, Trump and Musk are catering to an audience that has a fundamental misunderstanding about US foreign aid more generally.

    Surveys demonstrate that Americans believe 25% of the federal budget is spent on foreign aid. In reality, the US gives about 0.2% of its gross national product (GNP), the total value of goods and services produced by a country, to foreign aid – or less than 1% of its federal budget. This is far below the UN target of 0.7% of GNP.

    But, despite this, USAid provided 42% of all humanitarian aid globally in 2024. This included about US$72 billion (£58 billion) in aid in a wide range of areas, from helping people access clean water, sanitation, healthcare and energy, to providing disaster relief, shelter and food.

    USAid also delivered programmes aimed at supporting democracy, civil society, economic development and landmine clearance in war zones, as well as working to prevent organised crime, terrorism and conflict. The gutting of USAid will have a profound impact on human security.

    The Trump administration has granted a waiver for the continuation of “life-saving humanitarian assistance”. This includes a programme that helps 20 million people living with HIV/Aids access anti-retroviral drugs. But there are questions about the future of US Aids organisation, the President’s Emergency Plan for Aids Relief (Pepfar).

    To date, over 43 million people worldwide have died from Aids. But one of the biggest success stories of the George W. Bush administration was its launch of Pepfar in 2003. The World Health Organization says that Pepfar, working in partnership with USAid, has saved 26 million lives.

    Pepfar employs more than 250,000 doctors, nurses and other staff across 55 countries. One of the functions that USAid performs is ordering and procuring the drugs used by Pepfar to keep the millions infected with HIV alive. It remains to be seen whether federal payments to USAid’s locally run partner organisations will be stopped.

    We are, in any case, likely to see an uptick in other infectious diseases. USAid had been working to prevent current outbreaks of mpox and Marburg virus from spreading beyond Africa. It is not clear what the future is for these programmes.

    And USAid’s work with malaria, a disease that kills about 450,000 children under the age of five each year, is facing uncertainty. From 2000 to 2021, USAid’s work helped to prevent 7.6 million deaths from malaria. Also in doubt is USAid’s work to develop and implement the malaria vaccine, which was considered a gamechanger for combating the disease.

    At the same time, USAid responds to an average of 65 natural disasters each year. In 2024 alone, it responded to 84 separate crises across 66 different countries. The government is letting go all of the staff important for implementing these types of programmes.

    Dozens of senior USAid officials have been placed on leave, while contractors working on the agency’s programmes have been furloughed. Up to 3,000 aid workers in Washington DC could reportedly be laid off this week.

    What Trump’s team misunderstand is that the work of USAid is also vital for preserving American interests. China, which has poured more than US$1 trillion of assistance into infrastructure projects in Asia, Africa, Europe and Latin America since 2013, will now be given an opportunity to exert more influence around the world. The void in US aid is a gift for China in the battle for soft power.

    White House press secretary, Karoline Leavitt, lists some of what she calls the ‘insane priorities’ that USAid has been spending money on.

    Global aid sector in disarray

    Foreign aid relies on certainty and transparency about the future of aid programmes. But the Trump administration has offered little clarity while US foreign aid programmes are all being reviewed. One aid organisation referred to the situation as an “absolute dumpster fire” due to the uncertainty.

    There have already been reports of total confusion in health clinics previously supported by USAid, which were shut down without warning. Africa will probably be the region most negatively affected. Local workers in healthcare-related projects on the continent will lose their jobs, while nurses, doctors and healthcare workers across clinics will be unable to continue their vital work.

    The Democrats have claimed that Trump does not have the legal authority to eradicate a congressionally funded independent agency. They have said court challenges are already in motion and have pledged to try to block approval of Trump’s state department nominations until the shutdown is reversed.

    Trump did try to cut US foreign aid during his first term, but Congress refused. He then tried – and ultimately failed – to freeze the flow of aid appropriated by Congress. This time, Trump is not bothering to play by the rules.

    Natasha Lindstaedt does not work for, consult, own shares in or receive funding from any company or organisation that would benefit from this article, and has disclosed no relevant affiliations beyond their academic appointment.

    ref. USAid shutdown isn’t just a humanitarian issue – it’s a threat to American interests – https://theconversation.com/usaid-shutdown-isnt-just-a-humanitarian-issue-its-a-threat-to-american-interests-248939

    MIL OSI – Global Reports

  • MIL-OSI Global: The UK would be lucky to avoid US tariffs – but a global trade war would hurt everyone

    Source: The Conversation – UK – By Renaud Foucart, Senior Lecturer in Economics, Lancaster University Management School, Lancaster University

    Below the Sky/Shutterstock

    The first weeks of the Donald Trump’s administration have been marked by a flurry of announcements and U-turns on US trade policy.

    One of the first decrees centred on Trump’s favourite word: tariffs. He announced that US consumers and businesses would be taxed an extra 25% when they bought Canadian or Mexican products. (Canadian oil got off more lightly, with a 10% tariff.)

    But because this is Donald Trump we’re talking about, it later emerged that none of this was actually happening, for now. It might be next month, or later, or maybe not at all.

    However, US residents definitely face an additional 10% on the cost of products from China. There is also a plan for a 100% tax on semiconductors from Taiwan.

    And President Trump announced new import taxes will “definitely happen” on products from the European Union. If these do ever come to pass, it’s possible there may be a better deal for the UK.

    The reason for the possible Great British exemption from new US import taxes is that the stated goal of these taxes is to reduce the US trade deficit. This deficit refers to the fact that the US buys much more from the rest of the world than the rest of the world buys from it.

    And, depending on how we measure the financial flows coming in and out of tax havens such as the British Virgin Islands, the UK is one of the few countries in a position to make the case that it actually has a trade deficit with the US (the UK buys more from the US than the US buys from it).

    What about consumers?

    Being able to avoid new US tariffs would be very good news for the UK. If the US imposed import taxes on UK products and services, it would be bad for their consumers, who end up paying more. But it would also be bad for UK industry. Moreover, the UK would likely retaliate and tax US products, ultimately hurting British consumers as well.

    In theory, the UK miraculously escaping new US import taxes might even mean it indirectly benefits from a trade war between the US and the EU. If the UK can sell and buy more cheaply to both sides while they tax each other, it becomes more competitive. The UK would also get its imports more cheaply, and international businesses may want to establish subsidiaries in the UK.

    It is interesting to imagine a world in which a medium-sized, free trade supporting country like the UK ends up the winner of a global commercial war between its two most important trading partners.

    Things are not that simple however. Research shows that a major impact of tariffs is changes in global supply chains.

    As the UK has learned the hard way with Brexit, modern supply chains are increasingly interconnected. British exports are typically made with components from the European continent, which are themselves made with Chinese inputs.

    Additional costs anywhere in the chain result in more expensive products. Moreover, it is not clear that UK products made with EU and Chinese components would be exempt from US import tax.

    Disruption to supply chains could force up the cost of UK exports.
    Peter Titmuss/Shutterstock

    This is a global problem. For every final product a UK consumer ends up buying, there are many firms trying to source the best possible components and materials to make it with. If the US levies a 100% tax on chips and semiconductors from Taiwan, this means that products from the US tech industry will become more expensive for UK firms to use. This is even more pertinent given that China has retaliated to the new 10% US tax on its products by limiting the export of metals the US uses to produce its own chips.

    In this way it is easy to underestimate how sensitive supply chains are to small shocks, and what the butterfly effect of a trade war between two other countries might be on products bought and sold in the UK. So, while the UK would definitely be better off not being subject to US taxes, the main focus should be on helping to avoid global trade wars.

    How to do this is not clear, because no one seems to understand what Trump really wants from his tariffs. One theory is that he wants to pass for a madman and bully other countries into committing to buy more US-manufactured products.

    Or, in the case of Europe, to increase military spending by buying more US military equipment. In that case, tariffs would be short-lived and the impact limited. It will simply increase the incentives for international firms not to depend too much on the US.

    Or perhaps Trump really has no idea what he is doing, seemingly pursuing the two opposing goals of keeping domestic prices low while attempting to reduce its trade imbalance with ever-increasing import taxes. In that case, the consequences for consumers all over the world would be very bad. This is in part because of the effect on supply chains, but also because when the US economy is in bad shape the entire world suffers.

    Renaud Foucart does not work for, consult, own shares in or receive funding from any company or organisation that would benefit from this article, and has disclosed no relevant affiliations beyond their academic appointment.

    ref. The UK would be lucky to avoid US tariffs – but a global trade war would hurt everyone – https://theconversation.com/the-uk-would-be-lucky-to-avoid-us-tariffs-but-a-global-trade-war-would-hurt-everyone-248963

    MIL OSI – Global Reports

  • MIL-OSI United Kingdom: Minister for EU Relations – Article on UK-EU Reset

    Source: United Kingdom – Executive Government & Departments

    Opinion-editorial authored by Nick Thomas-Symonds, Minister for European Union Relations. This was originally published in The Telegraph on Tuesday 4 February 2025.

    Like many people, I remember the night of the Brexit referendum vividly. I was in my constituency of Torfaen: my home, where I grew up and where I have always lived. The majority of people in my constituency, and across the UK, voted to leave the EU.

    I believe my constituents – like millions across the country – voted to leave because they wanted a change that would improve their lives. They hoped Brexit would mean better public services, more jobs, less migration, more security.

    What they got instead was years of chaos and a botched deal. [Redacted political content].

    People deserve better. They want the Government to respect their vote on Brexit – which we do – and they’re also pragmatic. This Government was elected to reset relations with the EU to help boost growth, improve the cost of living crisis and make our borders more secure. People, rightly, demand delivery.

    My role as the UK minister for European Union relations is to take expectations and make them a reality.

    What does that mean? For this Government, our reset with the EU means the UK being safer, more secure and increasingly prosperous. It does not mean hitting rewind. We are not undoing Brexit. There is no opacity over the outcome of the referendum in 2016. Yet, five years on, we can see some of the negative impacts of the current deal emerging here at home, as well as in Europe.

    Trade is a clear example. Despite the EU being our largest trading partner, with trade in 2023 worth over £800 billion, we are trading less. Between 2021 and 2023, exports to the EU were down 27 per cent and imported goods down 32 per cent.

    The problems are not just economic. Our borders are less secure. The asylum system has been pushed into crisis, with backlogs reaching record levels and costs hitting £5.4 billion in the last financial year, up over a billion pounds on the year before.

    We are not cooperating closely enough with the EU on law enforcement to smash the gangs behind the small boats. To make people safer, we must do all we can to strengthen our collective ability to tackle organised crime and work together on illegal migration.

    The Brexit deal did not address issues around security and defence cooperation, more vital than ever after Putin’s illegal invasion of Ukraine. To keep the UK secure, we need to work with allies such as Ukraine and European partners, with NATO as our bedrock. The Prime Minister met with all 27 EU leaders and the secretary-general of NATO for this very reason: to discuss common threats and the value that closer EU-UK co-operation on defence could bring.

    To raise living standards, we need to build export and investment opportunities, reducing barriers to trade. This is of mutual benefit: the chancellor and the president of the European Commission are both pressing the need for cooperation to drive innovation, boost growth and reduce consumer costs.

    This is not about a choice between our allies. Some people make the false argument that we need to choose either America or Europe. For this Government, the UK’s national interest is paramount and demands we work with both.

    We will do so with a ruthless pragmatism, leaving ideologically driven division in the past in search of mutually beneficial areas of interest for both sides, within our red lines of no return to the single market, customs union, or freedom of movement.

    The Prime Minister and I will look at issues in a hard-headed way, guided by what works for the people and businesses of the UK. It’s as simple as that.

    The UK standing tall on the international stage, delivering for people by working with one of our key partners, matters. This is making Brexit work for my constituency and for the country.

    Updates to this page

    Published 4 February 2025

    MIL OSI United Kingdom

  • MIL-OSI Global: Hunger rises as food aid falls – and those living under autocratic systems bear the brunt

    Source: The Conversation – USA – By Jonas Gamso, Associate Professor and Deputy Dean of Knowledge Enterprise for the Thunderbird School of Global Management, Arizona State University

    Volunteers hand out USAID flour at the Zanzalima Camp in Ethiopia. J. Countess/Getty Images

    “No famine has ever taken place in the history of the world in a functioning democracy,” observed Nobel Prize-winning economist Amartya Sen in his 1999 book “Development as Freedom.”

    My recent research doesn’t tackle Sen’s central argument – premised on the belief that democratic leaders prioritize food security because they cannot win reelection if the most basic needs of their constituents are not met – head on. Instead, I explored an auxiliary question: Do democratic governments cope better than their autocratic counterparts when their countries are confronted by sudden drops in food aid?

    The answer is a resounding “yes.”

    I came to that conclusion by analyzing food insecurity data from 110 countries from 2000 to 2020.

    Food aid – a form of international assistance in which donors give food, or funds to buy food, to low- or middle-income countries – has recently fallen, reaching fewer people in 2024 than in 2023, according to estimates from the World Food Program, a United Nations agency. Major donors like Germany and the United States have reduced or suspended aid, citing budgetary constraints or concerns about theft, including to some of the neediest countries, such as Afghanistan, Haiti and Ethiopia. Adding to concerns, the Trump administration has signaled that it may move to “close down” the U.S. Agency for International Development, or USAID, the largest provider of global food assistance.

    At the same time, the world has faced a significant hunger crisis since 2019 due to a combination of factors, including the impacts of civil conflict, climate change and stubbornly high prices.

    I wanted to determine whether food aid cuts and rising hunger are connected, and if democracy matters. I started by cataloging instances when countries had experienced significant reductions in food aid inflows. I then looked at whether those “aid shocks” were followed by upticks in food insecurity, using data from the U.N.’s Food and Agricultural Organization. Finally, I assessed whether the relationship between aid shocks and food insecurity varied across countries and political systems.

    The results indicate that autocracies experience heightened food insecurity when sharp cuts to international food assistance occur, whereas democracies keep their people fed.

    For example, autocratic Eswatini, an absolute monarchy in southern Africa that was formerly known as Swaziland, experienced a food aid shock in 2010 that was followed by a 2 percentage point uptick in the prevalence of undernourishment. In contrast, when Mongolia, a robust democracy, experienced an aid shock in 2007, undernourishment actually declined by about 3 percentage points.

    On the one hand, this isn’t entirely surprising, as democratic leaders – unlike their autocratic counterparts – have to face the public in national elections, and winning is difficult when people are experiencing widespread hunger. Because leaders in a democracy are more accountable to their citizens, they make more of an effort to make up for the lost aid or cushion the adverse effects of food aid shocks on their populations.

    On the other hand, democracies often struggle to move quickly, due to their complex policymaking processes and checks and balances. This may lead some to conclude that it is harder for them to move nimbly during a foreign aid crisis.

    Why it matters

    While many question the effectiveness of aid, including food aid, my findings suggest that cutting it – as some critics suggest – will have negative effects on the health and well-being of vulnerable people around the world. Already, food systems experts have expressed fears over the Trump administration’s proposed aid freezes and the potential breaking up of USAID.

    For this reason, donor nations should be cautious about halting or rapidly shifting their foreign giving.

    At the same time, donor governments, which are mostly Western democracies, have often used aid as a tool for promoting democratic institutions, at times cutting off aid to autocratic countries that abuse human rights. While this practice seems sensible to donors that wish to punish or discourage autocrats, my findings raise a significant concern: People living in autocratic countries may be left starving when aid is withdrawn.

    And donor nations could take further steps to support democratization and democratic resilience, particularly in countries that are vulnerable to food insecurity. For example, donors can engage with civil society groups in aid-recipient nations, empowering them with tools and techniques to promote, protect and preserve democratic institutions. This way, countries will be more resilient and less likely to fall into crisis levels of hunger if and when aid cuts occur.

    What’s next

    While there is a tendency to treat governments as either “democratic” or “autocratic,” that approach obscures a good deal of nuance. Democracies vary in terms of their rules, procedures and governing structures. Likewise, autocracies can differ greatly from one another, with military regimes, personalist dictatorships and party-based autocracies each having unique characteristics.

    Moving forward, I hope to dig into these varieties of democracy and autocracy to see how countries representing each respond to aid shocks.

    The Research Brief is a short take on interesting academic work.

    Jonas Gamso does not work for, consult, own shares in or receive funding from any company or organization that would benefit from this article, and has disclosed no relevant affiliations beyond their academic appointment.

    ref. Hunger rises as food aid falls – and those living under autocratic systems bear the brunt – https://theconversation.com/hunger-rises-as-food-aid-falls-and-those-living-under-autocratic-systems-bear-the-brunt-247759

    MIL OSI – Global Reports

  • MIL-OSI: Data443 Acquires Breezemail.ai, Accelerating AI-Powered Email Privacy Capabilities for Microsoft Office and Google GMail

    Source: GlobeNewswire (MIL-OSI)

    RESEARCH TRIANGLE PARK, N.C., Feb. 04, 2025 (GLOBE NEWSWIRE) — Data443 Risk Mitigation, Inc. (OTCPK: ATDS) (“Data443” or the “Company”), a data security and privacy software company for “All Things Data Security,” today announced the acquisition of intellectual property and operational assets of Breezemail.ai, an innovative provider of AI-powered email management technology. This acquisition marks a significant expansion of Data443’s capabilities in intelligent threat detection and leverages its leadership at the forefront of the rapidly evolving AI security landscape.

    Breezemail.ai leverages proprietary implementations of machine-learning algorithms that manage end-user mailboxes for both Microsoft Office365 and Google GSuite GMail. This capability is the industry’s first implementation, giving end users direct management of their inboxes from outside the service provider – creating private implementations of email organization, detection, and visibility for important information. Managing this privately ensures that the mail provider does not have access to the rulesets that the end user designs, ensuring ongoing privacy of private rulesets for the customer. Email providers do not see the rules that the end user creates.

    “AI privacy continues to be a major issue the industry continues to tackle. End users should be able to keep their mailbox organization rules private, change them at will, and have a simple interface for managing this. Breezemail.ai enables this capability in a few mouse clicks and gives the user ultimate control. Even more importantly, the users’ private rules and decisions are not shared with any service provider,” stated Jason Remillard, CEO and Founder of Data443.

    Integrating this technology into Data443’s award-winning product suites increases the adoption of these capabilities in other segments, such as healthcare, national defense, and government organizations.

    The acquisition coincides with significant market validation of AI-powered email security solutions, evidenced by Abnormal Security’s anticipated IPO and growing enterprise demand for intelligent security platforms. This strategic move positions Data443 to capture an expanding share of the email security market, which is experiencing rapid growth driven by the increasing sophistication of cyber threats.

    The integration of Breezemail.ai’s technology will deliver immediate benefits to Data443’s customers:

    • Seamless integration with existing Cyren by Data443 deployments
    • Enhanced protection against sophisticated social engineering attacks
    • Real-time threat intelligence sharing across the customer base
    • A rich implementation for selective decision-making driven by the end-user without IT assistance
    • Complete privacy on how the users’ internal mindset works with data

    “Combining Breezemail.ai’s innovative AI implementations with our existing security capabilities, we’re building on our compounding advantages with our Cyren by Data443 email and threat intelligence product stack,” added Remillard. “This integration will provide our customers with unprecedented AI privacy enablement protection while significantly simplifying management tools for end users.”

    “This acquisition transcends mere technological expansion, marking a pivotal shift in email privacy protection. As artificial intelligence continues to automate more aspects of our digital lives, safeguarding user privacy has emerged as one of the industry’s most pressing challenges. This enables millions of users to self-manage their data with complete privacy,” concluded Mr.Remillard.

    About Data443 Risk Mitigation, Inc.

    Data443 Risk Mitigation, Inc. (OTCPK: ATDS) provides software and services to enable secure data across devices and databases, at rest and in flight/in transit, locally, on a network or in the cloud. We are All Things Data Security. With over 10,000 customers in over 100 countries, Data443 provides a modern approach to data governance and security by identifying and protecting all sensitive data regardless of location, platform or format. Data443’s framework helps customers prioritize risk, identify security gaps and implement effective data protection and privacy management strategies.

    Forward-Looking Statements 

    This press release contains forward-looking statements. These statements are made under the “safe harbor” provisions of the U.S. Private Securities Litigation Reform Act of 1995. Forward-looking statements may be identified by use of terms such as “expect,” “believe,” “anticipate,” “may,” “could,” “will,” “should,” “plan,” “project,” “intend,” “estimate,” “predict,” “potential,” “pursuant,” “target,” “continue” or the negative of these words or other comparable terminology. Statements in this press release that are not historical statements, including statements regarding Data443’s plans, objectives, future opportunities for Data443’s services, future financial performance and operating results, and any other statements regarding Data443’s future expectations, beliefs, plans, objectives, financial conditions, assumptions or future events or performance, or regarding the anticipated consummation of any transaction, are forward-looking statements. These statements are not guarantees of future performance and are subject to numerous risks, uncertainties and assumptions, many of which are difficult to predict or are beyond Data443’s control. These risks, uncertainties and assumptions could cause actual results to differ materially from the results expressed or implied by the statements. They may relate to the outcome of litigation, settlements and investigations; actions by third parties, including governmental agencies; volatility in customer spending; global economic conditions; inability to hire and retain personnel; loss of, or reduction in business with, key customers; difficulty with growth and integration of acquisitions; product liability; cybersecurity risk; anti-takeover measures in the Company’s charter documents; and the uncertainties created by global health issues, such as the ongoing outbreak of COVID, and political unrest and conflict, such as the invasion of Ukraine by Russia. These and other important risk factors are described more fully in the Company’s reports and other documents filed with the Securities and Exchange Commission (“the SEC”), including in Part I, Item 1A of the Company’s Annual Report on Form 10-K filed with the SEC on April 17, 2024, and subsequent filings with the SEC. Undue reliance should not be placed on the forward-looking statements in this press release, which are based on information available to the Company on the date hereof. Except as otherwise required by applicable law, Data443 undertakes no obligation to publicly update or revise any forward-looking statements, whether because of new information, future events or otherwise.

    “DATA443” is a registered trademark of Data443 Risk Mitigation, Inc.

    All product names, trademarks and registered trademarks are property of their respective owners. All company, product and service names used in this press release are for identification purposes only. Use of these names, trademarks and brands does not imply endorsement.

    For further information:

    Follow us on LinkedIn: https://www.linkedin.com/company/data443-risk-mitigation-inc/
    Follow us on YouTube: https://www.youtube.com/channel/UCZXDhJcx-XgMBhvE9aFHRdA
    Sign up for our Investor Newsletter: https://data443.com/investor-email-alerts/
    To learn more about Data443, please watch the Company’s video introduction on its YouTube channel: https://youtu.be/1Fp93jOxFSg

    Investor Relations Contact:
    Matthew Abenante
    ir@data443.com
    919.858.6542

    Attachment

    The MIL Network

  • MIL-OSI United Kingdom: Minister for European Union Relations speech at EU-UK Forum

    Source: United Kingdom – Government Statements

    A speech delivered in Brussels at the EU-UK Forum by Nick Thomas-Symonds, Minister for European Union Relations.

    Many thanks, Paul, and many thanks to the EU-UK Forum for organising this conference.

    And, of course, for the invitation for me to come along to speak.

    I suppose I should also say a big thank you to the Prime Minister for the warm-up act last night.

    It’s a real pleasure to share a stage with my EU counterpart Maros Sefcovic.

    Even though, of course, Maros joined us virtually, our mutual goal of reaching a better UK EU relationship is very real.   

    And today, I want to explain why that is so important…

    …what it could mean for the UK and for Europe…

    …and what I believe the defining structure of that relationship could look like. 

    It is obvious to me – as I am sure it is to all of you – that at a time of such intense global change, the UK and the EU have many mutually aligned interests and challenges.

    We want increased prosperity…

    … we want to strengthen our security…

    …and we want our citizens to be safe. 

    Those joint challenges that we face were powerfully set out by our UK Chancellor, Rachel Reeves…

    …and, indeed, the President of the European Commission, Ursula von der Leyen just last week.

    In her growth speech, my Friend the Chancellor didn’t shy away from the economic challenges that we are confronting. She said:

    “Growth will not come without a fight. Without a government willing to take the right decisions now to change our country’s future for the better.  

    “But for too long, that potential has been held back.”  

    On the same day, the President von der Leyen presented the ‘Competitiveness Compass’ saying that, and I quote:

     “Europe has everything it needs to succeed. But, at the same time, we must fix our weaknesses to regain competitiveness.” 

    The ‘Competitive Compass’ sets out the importance of “trade openness”, “not only for sustaining Europe’s prosperity, but also for enhancing its resilience”.

    We know that low growth is not the destiny for our economies. 

    Research and innovation…

    …reducing red tape…

    …a new skills agenda…

    …boosting productivity…

    …a more resilient economy…

    …all these elements found in the Compass are also crucial parts of the Prime Minister’s Plan for Change.  

    These are areas of mutual interest to both of our economies

    It is also clear about the vital interconnection between security and prosperity…

    …that is why the work we are all engaged in – that Maroš and I are driving forward – is so vital.

    In the UK and indeed in Brussels – we are clear-eyed about the scale of challenges that we face – and the opportunities for growth and innovation.

    The European Union is the UK’s biggest trading partner, with trade totalling – in 2023 – over £800bn.

    Many of our best education and science facilities have lifelong links…

    …and our collaboration on research and development has been the springboard for hugely successful innovations that have driven growth and jobs. 

    And in a more uncertain world, we are regularly reminded that allies are more secure together than they are apart.

    This Government’s position is simple: the UK and the EU are linked through trade and international organisations like NATO…

    …and even though we voted to leave the EU, our role as key allies and trade partner remains.

    We know that for these relationships to flourish, trust is a vital ingredient.  

    This Government recognises that the UK’s signature means something.

    So, we are committed to implementing the Trade and Co-operation Agreement and the Windsor Framework and building on that structure to address emerging challenges and opportunities.

    Now, I want to say – straightforwardly – that we see real opportunities to improve the status quo.

    As ‘Businesseurope’ set out in their report this Autumn: 

    “There remain many unnecessary barriers to trade and investment. Following the elections of new governments in the EU and UK, there is a clear opportunity to upgrade the relationship to deliver for businesses and citizens.”

    I agree with them. 

    A study published last year showed that between 2021 and 2023, the goods EU businesses export to the UK were down by 32%…

    …while UK goods exports to the EU were down by 27%.

    That is not good for British business or European businesses…

    …especially at a time when our economies need a kickstart. 

    Reducing trade barriers is of mutual benefit to the UK and the EU. 

    [redacted political content]

    It was vital that we re-joined Horizon…

    …we should never have left in the first place…

    …but the gap in continuity and other challenges means we haven’t together achieved as much as we could have done.

    It’s especially bad when global competition for innovation has never been fiercer.

    When the UK should have been working more closely with international law enforcement on security…

    …we frankly wasted years undermining the role of the ECHR, in pursuit of a doomed Rwanda deportation scheme.

    We cannot continue in this way with one of our largest, most important partners… 

    …that is why this Government will always work in the UK’s national interest…

    …and for me, that means being a ruthlessly pragmatic negotiator.

    That means making the case for closer working with our allies in the EU, to make people across the UK and the EU safer, more secure and more prosperous…

    …that means making sure that we are working to strengthen cooperation, moving away from a zero sum, win, lose dynamic we have seen in recent years…

    …and that is the spirit I take into discussions with the EU. 

    The UK and the EU have many mutually beneficial interests… 

    …I want to build on these as we work to reset our relationship…

    …to help construct a more secure, a safer and a more prosperous UK and EU. 

    Now this British Government was elected on a mandate…

    …to strengthen national security by reconnecting with our allies…

    …to increase people’s safety through strong borders…

    …and increase prosperity through growth.

    Our European friends are a part of every single one of those priorities…

    …and I believe it’s these priorities that form the three pillars of a reset in our relationship.

    On security – you saw yesterday how seriously we’re taking this.

    Our Prime Minister met with all 27 of the EU leaders and the Secretary General of NATO… 

    …discussing the common threats we face…

    …and the value that closer EU-UK cooperation on defence could bring…

    …whether it’s securing undersea cables or working together on research and development. 

    On safety – I am clear that if we want to protect our respective borders and keep our citizens safe, then we need to work together.

    That is the only way we’re going to break up the vile global trade in human trafficking…

    …that’s the only way to tackle organised crime and terrorism, which plagues us all. 

    And on prosperity – if we want to grow our economies…

    …and boost our living standards…

    …then we need to reduce barriers to UK and EU trade. 

    And I am pleased to say that – that on all three of these issues – we are making progress. 

    On security, the Prime Minister and the President of the European Council have made clear they wanted closer cooperation on security and defence…

    …and the EU High Representative and the Foreign Secretary have already agreed to new six-monthly Foreign Policy dialogues 

    On safety, we have already increased the UK’s presence at Europol…

    …but I want us to go further. 

    We need to find to find ways to better coordinate law enforcement so that we can smash the gangs behind the small boats. 

    To make people safer, we must do all we can to strengthen our collective ability to tackle organised crime and work together on illegal migration.

    Afterall, these are shared challenges. 

    And on prosperity, we have said we will seek to negotiate a Sanitary and Phytosanitary agreement to remove barriers to trade…

    …and find ways to resolve issues like the Mutual Recognition of Professional Qualifications.

    We can go much further on energy and the green transition.

    Our Government’s commitment is to Make Britain a Clean Energy superpower by 2030… 

    …and together, we need to deliver energy security so that we are never again left exposed as we were when Russia – illegally – invaded Ukraine.

    These challenges all span borders and we must work together to seize opportunities that lie ahead.

    All of this work is supported by much greater cooperation between the UK Government and the EU. 

    Right from the very top – with the Prime Minister meeting with President von der Leyen and Council President Costa…

    …agreeing to a leader-level summit that will be held in May, where we hope we can deliver a balanced, yet ambitious outcome to benefit all of our citizens.

    Just before Christmas, our Chancellor attended a meeting of the EU finance ministers…

    …the first time a British Chancellor has been invited to the Eurogroup since Brexit.

    These meetings form only some of the nearly 70 direct engagements…

    …between UK Ministers and our EU counterparts since coming into Government…

    …and I look forward to many more ahead. 

    And I say to you all: I look forward to working with you throughout this year and into the future.

    But ladies and gentlemen – the time for ideologically-driven division is over…

    …the time for ruthless pragmatism is now.

    It is through a new partnership between the UK and the EU that we will deliver for the people of the United Kingdom, and for people across the continent.

    The future of the EU and the UK lies beyond the status quo…

    …reaching forward to deliver benefits for all our people to share.

    So, let us rise to our shared challenges and grasp this opportunity.

    Because together we will create a stronger UK and we will create a stronger Europe.

    Thank you very much.

    Updates to this page

    Published 4 February 2025

    MIL OSI United Kingdom

  • MIL-OSI: Oaktree Specialty Lending Corporation Announces First Fiscal Quarter 2025 Financial Results

    Source: GlobeNewswire (MIL-OSI)

    LOS ANGELES, Feb. 04, 2025 (GLOBE NEWSWIRE) — Oaktree Specialty Lending Corporation (NASDAQ: OCSL) (“Oaktree Specialty Lending” or the “Company”), a specialty finance company, today announced its financial results for the fiscal quarter ended December 31, 2024.

    Financial Highlights for the Quarter Ended December 31, 2024

    • Oaktree Capital I, L.P. purchased $100.0 million of shares of OCSL common stock on February 3, 2025 at the Company’s net asset value as of January 31, 2025, which was $17.63 per share and represented a 10% premium to the closing stock price and resulted in a nearly 7% increase to NAV. The equity raise will help grow OCSL’s asset base and further diversify the portfolio.
    • Implemented total return hurdle resulting in waived Part I incentive fees of $6.4 million for the quarter ended December 31, 2024. In connection with the institution of this incentive fee cap, the calculation of the Part I incentive fee will consider capital gains and losses when determining Part I incentive fees payable. This new arrangement includes a lookback provision that commences effective October 1, 2024, and will build over time to a rolling 12 quarter lookback by the Company’s 2027 fiscal year-end.
    • Total investment income was $86.6 million ($1.05 per share) for the first fiscal quarter of 2025, as compared with $94.7 million ($1.15 per share) for the fourth fiscal quarter of 2024. Adjusted total investment income was $87.1 million ($1.06 per share) for the first fiscal quarter, as compared with $95.0 million ($1.16 per share) for the fourth fiscal quarter of 2024. The decrease was driven by (i) lower interest income, which was attributable to decreases in reference rates, the impact of certain investments that were placed on non-accrual status, a smaller investment portfolio and lower original issue discount (“OID”) acceleration from investment repayments, (ii) lower fee income from a decrease in prepayment fees and (iii) lower dividend income from the Company’s investment in Senior Loan Fund JV I, LLC (“SLF JV I”).
    • GAAP net investment income was $44.3 million ($0.54 per share) for the first fiscal quarter of 2025, as compared with $44.9 million ($0.55 per share) for the fourth fiscal quarter of 2024. The decrease for the quarter was primarily driven by lower total investment income and higher operating expenses, partially offset by lower interest expense and lower management and income-based (“Part I”) incentive fees (net of fees waived).
    • Adjusted net investment income was $44.7 million ($0.54 per share) for the first fiscal quarter of 2025, as compared with $45.2 million ($0.55 per share) for the fourth fiscal quarter of 2024. The decrease for the quarter was primarily driven by lower adjusted total investment income and higher operating expenses, partially offset by lower interest expense and lower management and Part I incentive fees (net of fees waived).
    • Net asset value (“NAV”) per share was $17.63 as of December 31, 2024, down as compared with $18.09 as of September 30, 2024. The decline from September 30, 2024 primarily reflected losses on certain debt and equity investments.
    • Originated $198.1 million of new investment commitments and received $352.4 million of proceeds from prepayments, exits, other paydowns and sales during the quarter ended December 31, 2024. The weighted average yield on new debt investments was 9.6%.
    • Total debt outstanding was $1,610.0 million as of December 31, 2024. The total debt to equity ratio was 1.11x, and the net debt to equity ratio was 1.03x, after adjusting for cash and cash equivalents.
    • Liquidity as of December 31, 2024 was composed of $112.9 million of unrestricted cash and cash equivalents and $957.5 million of undrawn capacity under the Company’s credit facilities (subject to borrowing base and other limitations). Unfunded investment commitments were $302.3 million, or $275.2 million excluding unfunded commitments to the Company’s joint ventures. Of the $275.2 million, approximately $243.7 million can be drawn immediately with the remaining amount subject to certain milestones that must be met by portfolio companies or other restrictions.
    • A quarterly and supplemental cash distribution was declared of $0.40 per share and $0.07 per share, respectively, payable in cash on March 31, 2025 to stockholders of record on March 17, 2025. The modification to the dividend policy introduces a stable base dividend, which is anticipated to be sustainable across market cycles, amid fluctuations in rates and spreads.

    Armen Panossian, Chief Executive Officer and Co-Chief Investment Officer said, “We had several positive outcomes within the portfolio, but continued to face challenges with several names. We remain focused on our underperforming borrowers, working through each situation to identify the appropriate course of action.”

    “We remain committed to our shareholders and growing our business. As part of that process, Oaktree has purchased $100 million of shares at NAV. And, in addition to the permanent fee reduction announced last year and additional support provided via voluntary fee waivers, starting with the quarter ending December 31, 2024, we have instituted a cap in the calculation of our Part I Incentive Fee to consider capital gains and losses, which will build up over time and look back to 12 quarters by our 2027 fiscal year-end. We believe these actions further demonstrate our ongoing commitment to our shareholders while providing the capital to execute on our long-term initiatives.”

    Distribution Declaration

    The Board of Directors declared a quarterly distribution of $0.40 per share, payable in cash on March 31, 2025 to stockholders of record on March 17, 2025. The Board of Directors also declared a supplemental distribution of $0.07 per share, payable in cash on March 31, 2025 to stockholders of record on March 17, 2025. For the quarter ended December 31, 2024 and going forward, in addition to a quarterly base dividend of $0.40 per share, the Company’s Board of Directors expects to declare, when applicable, a quarterly supplemental dividend in an amount to be determined each quarter.

    Distributions are paid primarily from distributable (taxable) income. To the extent taxable earnings for a fiscal taxable year fall below the total amount of distributions for that fiscal year, a portion of those distributions may be deemed a return of capital to the Company’s stockholders.

    Results of Operations

        For the three months ended
    ($ in thousands, except per share data)   December 31, 2024 (unaudited)   September 30, 2024 (unaudited)   December 31, 2023 (unaudited)
    GAAP operating results:            
    Interest income   $ 78,422     $ 83,626     $ 91,414  
    PIK interest income     5,728       6,018       3,849  
    Fee income     1,679       3,897       1,307  
    Dividend income     818       1,144       1,415  
    Total investment income     86,647       94,685       97,985  
    Net expenses     42,082       49,764       53,796  
    Net investment income before taxes     44,565       44,921       44,189  
    (Provision) benefit for taxes on net investment income     (263 )            
    Net investment income     44,302       44,921       44,189  
    Net realized and unrealized gains (losses), net of taxes     (37,063 )     (8,008 )     (33,654 )
    Net increase (decrease) in net assets resulting from operations   $ 7,239     $ 36,913     $ 10,535  
    Total investment income per common share   $ 1.05     $ 1.15     $ 1.26  
    Net investment income per common share   $ 0.54     $ 0.55     $ 0.57  
    Net realized and unrealized gains (losses), net of taxes per common share   $ (0.45 )   $ (0.10 )   $ (0.43 )
    Earnings (loss) per common share — basic and diluted   $ 0.09     $ 0.45     $ 0.14  
    Non-GAAP Financial Measures1:            
    Adjusted total investment income   $ 87,070     $ 95,000     $ 98,014  
    Adjusted net investment income   $ 44,725     $ 45,236     $ 44,218  
    Adjusted net realized and unrealized gains (losses), net of taxes   $ (37,124 )   $ (8,322 )   $ (32,858 )
    Adjusted earnings (loss)   $ 7,601     $ 36,914     $ 11,360  
    Adjusted total investment income per share   $ 1.06     $ 1.16     $ 1.26  
    Adjusted net investment income per share   $ 0.54     $ 0.55     $ 0.57  
    Adjusted net realized and unrealized gains (losses), net of taxes per share   $ (0.45 )   $ (0.10 )   $ (0.42 )
    Adjusted earnings (loss) per share   $ 0.09     $ 0.45     $ 0.15  

    ______________________ 
    1 See Non-GAAP Financial Measures below for a description of the non-GAAP measures and the reconciliations from the most comparable GAAP financial measures to the Company’s non-GAAP measures, including on a per share basis. The Company’s management uses these non-GAAP financial measures internally to analyze and evaluate financial results and performance and believes that these non-GAAP financial measures are useful to investors as an additional tool to evaluate ongoing results and trends for the Company and to review the Company’s performance without giving effect to non-cash income/gain/loss resulting from the merger of Oaktree Strategic Income Corporation (“OCSI”) with and into the Company in March 2021 (the “OCSI Merger”) and the merger of Oaktree Strategic Income II, Inc. (“OSI2”) with and into the Company in January 2023 (the “OSI2 Merger”) and, in the case of adjusted net investment income, without giving effect to capital gains incentive fees. The presentation of non-GAAP measures is not intended to be a substitute for financial results prepared in accordance with GAAP and should not be considered in isolation.

         
        As of
    ($ in thousands, except per share data and ratios)   December 31, 2024 (unaudited)   September 30, 2024     December 31, 2023 (unaudited)
    Select balance sheet and other data:              
    Cash and cash equivalents   $ 112,913     $ 63,966     $ 112,369  
    Investment portfolio at fair value     2,835,294       3,021,279       3,018,552  
    Total debt outstanding (net of unamortized financing costs)     1,577,795       1,638,693       1,622,717  
    Net assets     1,449,815       1,487,811       1,511,651  
    Net asset value per share     17.63       18.09       19.14  
    Total debt to equity ratio     1.11x     1.12x       1.10x  
    Net debt to equity ratio     1.03x     1.07x       1.02x  
                           

    Adjusted total investment income for the quarter ended December 31, 2024 was $87.1 million and included $78.9 million of interest income from portfolio investments, $5.7 million of payment-in-kind (“PIK”) interest income, $1.7 million of fee income and $0.8 million of dividend income. The $7.9 million quarterly decline in adjusted total investment income was primarily due to a $5.4 million decrease in interest income, which resulted from a decreases in reference rates, the impact of certain investments that were placed on non-accrual status, a smaller investment portfolio and lower OID acceleration from investment repayments. Additionally, there was a $2.2 million decrease in fee income driven by lower prepayment fees and a $0.3 million reduction in dividend income from the Company’s investment in SLF JV I.

    Net expenses for the quarter ended December 31, 2024 totaled $42.1 million, down $7.7 million from the quarter ended September 30, 2024. The decrease for the quarter was primarily driven by $6.2 million of lower Part I incentive fees (net of fees waived) and $1.5 million of lower interest expense due to lower reference rates on the Company’s floating rate liabilities.

    Adjusted net investment income was $44.7 million ($0.54 per share) for the quarter ended December 31, 2024, which was down from $45.2 million ($0.55 per share) for the quarter ended September 30, 2024. The decline of $0.5 million primarily reflected $7.9 million of lower adjusted total investment income and an increase in income tax expense of $0.3 million, partially offset by $7.7 million of lower net expenses.

    Adjusted net realized and unrealized losses, net of taxes, were $37.1 million for the quarter ended December 31, 2024, primarily reflecting realized and unrealized losses on certain debt and equity investments.

    Portfolio and Investment Activity

        As of
    ($ in thousands)   December 31, 2024 (unaudited)   September 30, 2024 (unaudited)   December 31, 2023 (unaudited)
    Investments at fair value   $ 2,835,294     $ 3,021,279     $ 3,018,552  
    Number of portfolio companies     136       144       146  
    Average portfolio company debt size   $ 22,000     $ 22,000     $ 20,200  
                 
    Asset class:            
    First lien debt     81.8 %     81.7 %     77.9 %
    Second lien debt     3.0 %     3.5 %     8.4 %
    Unsecured debt     3.9 %     3.6 %     2.5 %
    Equity     4.8 %     5.0 %     4.8 %
    JV interests     6.5 %     6.1 %     6.4 %
                 
    Non-accrual debt investments:            
    Non-accrual investments at fair value   $ 105,326     $ 114,292     $ 120,713  
    Non-accrual investments at cost     138,703       140,748       174,897  
    Non-accrual investments as a percentage of debt investments at fair value     3.9 %     4.0 %     4.2 %
    Non-accrual investments as a percentage of debt investments at cost     5.1 %     4.9 %     5.9 %
    Number of investments on non-accrual     9       9       7  
                 
    Interest rate type:            
    Percentage floating-rate     87.6 %     88.4 %     84.3 %
    Percentage fixed-rate     12.4 %     11.6 %     15.7 %
                 
    Yields:            
    Weighted average yield on debt investments1     10.7 %     11.2 %     12.2 %
    Cash component of weighted average yield on debt investments     9.5 %     10.0 %     11.1 %
    Weighted average yield on total portfolio investments2     10.2 %     10.7 %     11.7 %
                 
    Investment activity:            
    New investment commitments   $ 198,100     $ 259,000     $ 370,300  
    New funded investment activity3   $ 201,300     $ 232,700     $ 367,600  
    Proceeds from prepayments, exits, other paydowns and sales   $ 352,400     $ 338,300     $ 213,500  
    Net new investments4   $ (151,100 )   $ (105,600 )   $ 154,100  
    Number of new investment commitments in new portfolio companies     5       9       14  
    Number of new investment commitments in existing portfolio companies     8       10       10  
    Number of portfolio company exits     13       23       10  

    ______________________
    1 Annual stated yield earned plus net annual amortization of OID or premium earned on accruing investments, including the Company’s share of the return on debt investments in SLF JV I and Glick JV, and excluding any amortization or accretion of interest income resulting solely from the cost basis established by ASC 805 (see Non-GAAP Financial Measures below) for the assets acquired in connection with the OCSI Merger and OSI2 Merger.
    2 Annual stated yield earned plus net annual amortization of OID or premium earned on accruing investments and dividend income, including the Company’s share of the return on debt investments in SLF JV I and Glick JV, and excluding any amortization or accretion of interest income resulting solely from the cost basis established by ASC 805 for the assets acquired in connection with the OCSI Merger and OSI2 Merger.
    3 New funded investment activity includes drawdowns on existing revolver and delayed draw term loan commitments.
    4 Net new investments consists of new funded investment activity less proceeds from prepayments, exits, other paydowns and sales.

    As of December 31, 2024, the fair value of the investment portfolio was $2.8 billion and was composed of investments in 136 companies. These included debt investments in 114 companies, equity investments in 42 companies, and the Company’s joint venture investments in SLF JV I and OCSI Glick JV LLC (“Glick JV”). 22 of the equity investments were in companies in which the Company also had a debt investment.

    As of December 31, 2024, 94.4% of the Company’s portfolio at fair value consisted of debt investments, including 81.8% of first lien loans, 3.0% of second lien loans and 9.6% of unsecured debt investments, including the debt investments in SLF JV I and Glick JV. This compared to 81.7% of first lien loans, 3.5% of second lien loans and 9.0% of unsecured debt investments, including the debt investments in SLF JV I and Glick JV, as of September 30, 2024.

    As of December 31, 2024, there were nine investments on non-accrual status, which represented 5.1% and 3.9% of the debt portfolio at cost and fair value, respectively. As of September 30, 2024, there were nine investments on non-accrual status, which represented 4.9% and 4.0% of the debt portfolio at cost and fair value, respectively.

    SLF JV I

    The Company’s investments in SLF JV I totaled $135.4 million at fair value as of December 31, 2024, up 0.1% from $135.2 million as of September 30, 2024.

    As of December 31, 2024, SLF JV I had $344.9 million in assets, including senior secured loans to 42 portfolio companies. This compared to $375.8 million in assets, including senior secured loans to 48 portfolio companies, as of September 30, 2024. SLF JV I generated cash interest income of $3.4 million for the Company during the quarter ended December 31, 2024, down from $3.6 million in the prior quarter. In addition, SLF JV I generated dividend income of $0.7 million for the Company during the quarter ended December 31, 2024, down from $1.1 million in the prior quarter. As of December 31, 2024, SLF JV I had $95.0 million of undrawn capacity (subject to borrowing base and other limitations) on its $270 million senior revolving credit facility, and its debt to equity ratio was 1.1x.

    Glick JV

    The Company’s investments in Glick JV totaled $49.6 million at fair value as of December 31, 2024, up 1.4% from $48.9 million as of September 30, 2024. The increase was primarily driven by Glick JV’s use of leverage and unrealized appreciation in the underlying investment portfolio.

    As of December 31, 2024, Glick JV had $127.9 million in assets, including senior secured loans to 39 portfolio companies. This compared to $145.0 million in assets, including senior secured loans to 44 portfolio companies, as of September 30, 2024. Glick JV generated cash interest income of $1.4 million for the Company during the quarter ended December 31, 2024, down from $1.5 million in the prior quarter. As of December 31, 2024, Glick JV had $31.0 million of undrawn capacity (subject to borrowing base and other limitations) on its $100 million senior revolving credit facility, and its debt to equity ratio was 1.2x.

    Liquidity and Capital Resources

    As of December 31, 2024, the Company had total principal value of debt outstanding of $1,610.0 million, including $660.0 million of outstanding borrowings under its revolving credit facilities, $300.0 million of the 3.500% Notes due 2025, $350.0 million of the 2.700% Notes due 2027 and $300.0 million of the 7.100% Notes due 2029. The funding mix was composed of 41% secured and 59% unsecured borrowings as of December 31, 2024. The Company was in compliance with all financial covenants under its credit facilities as of December 31, 2024.

    As of December 31, 2024, the Company had $112.9 million of unrestricted cash and cash equivalents and $957.5 million of undrawn capacity on its credit facilities (subject to borrowing base and other limitations). As of December 31, 2024, unfunded investment commitments were $302.3 million, or $275.2 million excluding unfunded commitments to the Company’s joint ventures. Of the $275.2 million, approximately $243.7 million could be drawn immediately with the remaining amount subject to certain milestones that must be met by portfolio companies or other restrictions. The Company has analyzed cash and cash equivalents, availability under its credit facilities, the ability to rotate out of certain assets and amounts of unfunded commitments that could be drawn and believes its liquidity and capital resources are sufficient to invest in market opportunities as they arise.

    As of December 31, 2024, the weighted average interest rate on debt outstanding, including the effect of the interest rate swap agreements was 6.2%, down from 6.7% as of September 30, 2024, primarily driven by the impact of lower interest rates on the Company’s floating rate liabilities.

    The Company’s total debt to equity ratio was 1.11x and 1.12x as of each of December 31, 2024 and September 30, 2024, respectively. The Company’s net debt to equity ratio was 1.03x and 1.07x as of each of December 31, 2024 and September 30, 2024, respectively.

    Incentive Fee Lookback

    Effective as of October 1, 2024, Oaktree has agreed to waive incentive fees on income to institute an incentive fee cap (also known as a “total return hurdle”) in the calculation of the Part I Incentive Fee, which will consider capital gains and losses. This new arrangement includes a lookback provision that commences effective October 1, 2024, and will build over time to a rolling 12-quarter lookback by the Company’s 2027 fiscal year-end. Additional details regarding this new arrangement can be found in the Company’s Form 10-Q filed on February 4, 2025.

    Purchase Agreement

    On January 31, 2025, the Company and Oaktree Capital I, L.P., an affiliate of the Adviser, entered into a purchase agreement pursuant to which Oaktree Capital I, L.P. purchased 5,672,149 shares of the Company’s common stock on February 3, 2025 for an aggregate purchase price of $100.0 million. These shares were sold at the Company’s net asset value per share as of January 31, 2025, which was $17.63 per share and calculated in accordance with Section 23 of the Investment Company Act of 1940, as amended. Oaktree Capital I, L.P. has agreed not to sell the shares acquired in this transaction through February 3, 2026. This transaction represented a 10% premium to the closing stock price on January 31, 2025, and resulted in a nearly 7% increase in net assets, which (coupled with additional leverage) will increase dry powder for deployment, enabling growth and further diversification of the portfolio.

    Non-GAAP Financial Measures

    On a supplemental basis, the Company is disclosing certain adjusted financial measures, each of which is calculated and presented on a basis of methodology other than in accordance with GAAP (“non-GAAP”). The Company’s management uses these non-GAAP financial measures internally to analyze and evaluate financial results and performance and believes that these non-GAAP financial measures are useful to investors as an additional tool to evaluate ongoing results and trends for the Company and to review the Company’s performance without giving effect to non-cash income/gain/loss resulting from the OCSI Merger and the OSI2 Merger and in the case of adjusted net investment income, without giving effect to capital gains incentive fees. The presentation of the below non-GAAP measures is not intended to be a substitute for financial results prepared in accordance with GAAP and should not be considered in isolation.

    • “Adjusted Total Investment Income” and “Adjusted Total Investment Income Per Share” – represents total investment income excluding any amortization or accretion of interest income resulting solely from the cost basis established by ASC 805 (see below) for the assets acquired in connection with the OCSI Merger and the OSI2 Merger.
    • “Adjusted Net Investment Income” and “Adjusted Net Investment Income Per Share” – represents net investment income, excluding (i) any amortization or accretion of interest income resulting solely from the cost basis established by ASC 805 (see below) for the assets acquired in connection with the OCSI Merger and the OSI2 Merger and (ii) capital gains incentive fees (“Part II incentive fees”).
    • “Adjusted Net Realized and Unrealized Gains (Losses), Net of Taxes” and “Adjusted Net Realized and Unrealized Gains (Losses), Net of Taxes Per Share” – represents net realized and unrealized gains (losses) net of taxes excluding any net realized and unrealized gains (losses) resulting solely from the cost basis established by ASC 805 (see below) for the assets acquired in connection with the OCSI Merger and the OSI2 Merger.
    • “Adjusted Earnings (Loss)” and “Adjusted Earnings (Loss) Per Share” – represents the sum of (i) Adjusted Net Investment Income and (ii) Adjusted Net Realized and Unrealized Gains (Losses), Net of Taxes and includes the impact of Part II incentive fees1, if any.

    The OCSI Merger and the OSI2 Merger (the “Mergers”) were accounted for as asset acquisitions in accordance with the asset acquisition method of accounting as detailed in ASC 805-50, Business Combinations—Related Issues (“ASC 805”). The consideration paid to each of the stockholders of OCSI and OSI2 were allocated to the individual assets acquired and liabilities assumed based on the relative fair values of the net identifiable assets acquired other than “non-qualifying” assets, which established a new cost basis for the acquired investments under ASC 805 that, in aggregate, was different than the historical cost basis of the acquired investments prior to the OCSI Merger or the OSI2 Merger, as applicable. Additionally, immediately following the completion of the Mergers, the acquired investments were marked to their respective fair values under ASC 820, Fair Value Measurements, which resulted in unrealized appreciation/depreciation. The new cost basis established by ASC 805 on debt investments acquired will accrete/amortize over the life of each respective debt investment through interest income, with a corresponding adjustment recorded to unrealized appreciation/depreciation on such investment acquired through its ultimate disposition. The new cost basis established by ASC 805 on equity investments acquired will not accrete/amortize over the life of such investments through interest income and, assuming no subsequent change to the fair value of the equity investments acquired and disposition of such equity investments at fair value, the Company will recognize a realized gain/loss with a corresponding reversal of the unrealized appreciation/depreciation on disposition of such equity investments acquired.

    The Company’s management uses the non-GAAP financial measures described above internally to analyze and evaluate financial results and performance and to compare its financial results with those of other business development companies that have not adjusted the cost basis of certain investments pursuant to ASC 805. The Company’s management believes “Adjusted Total Investment Income”, “Adjusted Total Investment Income Per Share”, “Adjusted Net Investment Income” and “Adjusted Net Investment Income Per Share” are useful to investors as an additional tool to evaluate ongoing results and trends for the Company without giving effect to the income resulting from the new cost basis of the investments acquired in the Mergers because these amounts do not impact the fees payable to Oaktree Fund Advisors, LLC (the “Adviser”) under its investment advisory agreement (as amended and restated from time to time, the “A&R Advisory Agreement”), and specifically as its relates to “Adjusted Net Investment Income” and “Adjusted Net Investment Income Per Share”, without giving effect to Part II incentive fees. In addition, the Company’s management believes that “Adjusted Net Realized and Unrealized Gains (Losses), Net of Taxes”, “Adjusted Net Realized and Unrealized Gains (Losses), Net of Taxes Per Share”, “Adjusted Earnings (Loss)” and “Adjusted Earnings (Loss) Per Share” are useful to investors as they exclude the non-cash income and gain/loss resulting from the Mergers and are used by management to evaluate the economic earnings of its investment portfolio. Moreover, these metrics more closely align the Company’s key financial measures with the calculation of incentive fees payable to the Adviser under with the A&R Advisory Agreement (i.e., excluding amounts resulting solely from the lower cost basis of the acquired investments established by ASC 805 that would have been to the benefit of the Adviser absent such exclusion).

    The following table provides a reconciliation of total investment income (the most comparable U.S. GAAP measure) to adjusted total investment income for the periods presented:

        For the three months ended
        December 31, 2024 (unaudited)   September 30, 2024 (unaudited)   December 31, 2023 (unaudited)
    ($ in thousands, except per share data)   Amount   Per Share   Amount   Per Share   Amount   Per Share
    GAAP total investment income   $ 86,647     $ 1.05     $ 94,685     $ 1.15     $ 97,985     $ 1.26  
    Interest income amortization (accretion) related to merger accounting adjustments     423       0.01       315             29        
    Adjusted total investment income   $ 87,070     $ 1.06     $ 95,000     $ 1.16     $ 98,014     $ 1.26  
                                                     

    The following table provides a reconciliation of net investment income (the most comparable U.S. GAAP measure) to adjusted net investment income for the periods presented:

        For the three months ended
        December 31, 2024 (unaudited)   September 30, 2024 (unaudited)   December 31, 2023 (unaudited)
    ($ in thousands, except per share data)   Amount   Per Share   Amount   Per Share   Amount   Per Share
    GAAP net investment income   $ 44,302     $ 0.54     $ 44,921     $ 0.55     $ 44,189     $ 0.57  
    Interest income amortization (accretion) related to merger accounting adjustments     423       0.01       315             29        
    Part II incentive fee                                    
    Adjusted net investment income   $ 44,725     $ 0.54     $ 45,236     $ 0.55     $ 44,218     $ 0.57  
                                                     

    The following table provides a reconciliation of net realized and unrealized gains (losses), net of taxes (the most comparable U.S. GAAP measure) to adjusted net realized and unrealized gains (losses), net of taxes for the periods presented:

        For the three months ended
        December 31, 2024 (unaudited)   September 30, 2024 (unaudited)   December 31, 2023 (unaudited)
    ($ in thousands, except per share data)   Amount   Per Share   Amount   Per Share   Amount   Per Share
    GAAP net realized and unrealized gains (losses), net of taxes   $ (37,063 )   $ (0.45 )   $ (8,008 )   $ (0.10 )   $ (33,654 )   $ (0.43 )
    Net realized and unrealized gains (losses) related to merger accounting adjustments     (61 )           (314 )           796       0.01  
    Adjusted net realized and unrealized gains (losses), net of taxes   $ (37,124 )   $ (0.45 )   $ (8,322 )   $ (0.10 )   $ (32,858 )   $ (0.42 )
                                                     

    The following table provides a reconciliation of net increase (decrease) in net assets resulting from operations (the most comparable U.S. GAAP measure) to adjusted earnings (loss) for the periods presented:

        For the three months ended
        December 31, 2024 (unaudited)   September 30, 2024 (unaudited)   December 31, 2023 (unaudited)
    ($ in thousands, except per share data)   Amount   Per Share   Amount   Per Share   Amount   Per Share
    Net increase (decrease) in net assets resulting from operations   $ 7,239     $ 0.09     $ 36,913     $ 0.45     $ 10,535     $ 0.14  
    Interest income amortization (accretion) related to merger accounting adjustments     423       0.01       315             29        
    Net realized and unrealized gains (losses) related to merger accounting adjustments     (61 )           (314 )           796       0.01  
    Adjusted earnings (loss)   $ 7,601     $ 0.09     $ 36,914     $ 0.45     $ 11,360     $ 0.15  
                                                     

    Conference Call Information

    Oaktree Specialty Lending will host a conference call to discuss its first fiscal quarter 2025 results at 11:00 a.m. Eastern Time / 8:00 a.m. Pacific Time on February 4, 2025. The conference call may be accessed by dialing (877) 507-3275 (U.S. callers) or +1 (412) 317-5238 (non-U.S. callers). All callers will need to reference “Oaktree Specialty Lending” once connected with the operator. Alternatively, a live webcast of the conference call can be accessed through the Investors section of Oaktree Specialty Lending’s website, www.oaktreespecialtylending.com. During the conference call, the Company intends to refer to an investor presentation that will be available on the Investors section of its website.

    For those individuals unable to listen to the live broadcast of the conference call, a replay will be available on Oaktree Specialty Lending’s website, or by dialing (877) 344-7529 (U.S. callers) or +1 (412) 317-0088 (non-U.S. callers), access code 1211943, beginning approximately one hour after the broadcast.

    About Oaktree Specialty Lending Corporation

    Oaktree Specialty Lending Corporation (NASDAQ:OCSL) is a specialty finance company dedicated to providing customized one-stop credit solutions to companies with limited access to public or syndicated capital markets. The Company’s investment objective is to generate current income and capital appreciation by providing companies with flexible and innovative financing solutions including first and second lien loans, unsecured and mezzanine loans, and preferred equity. The Company is regulated as a business development company under the Investment Company Act of 1940, as amended, and is externally managed by Oaktree Fund Advisors, LLC, an affiliate of Oaktree Capital Management, L.P. For additional information, please visit Oaktree Specialty Lending’s website at www.oaktreespecialtylending.com.

    Forward-Looking Statements

    Some of the statements in this press release constitute forward-looking statements because they relate to future events, future performance or financial condition. The forward-looking statements may include statements as to: future operating results of the Company and distribution projections; business prospects of the Company and the prospects of its portfolio companies; and the impact of the investments that the Company expects to make. In addition, words such as “anticipate,” “believe,” “expect,” “seek,” “plan,” “should,” “estimate,” “project” and “intend” indicate forward-looking statements, although not all forward-looking statements include these words. The forward-looking statements contained in this press release involve risks and uncertainties. Certain factors could cause actual results and conditions to differ materially from those projected, including the uncertainties associated with (i) changes in the economy, financial markets and political environment, including the impacts of inflation and elevated interest rates; (ii) risks associated with possible disruption in the operations of the Company or the economy generally due to terrorism, war or other geopolitical conflict (including the current conflicts in Ukraine and Israel), natural disasters, pandemics or cybersecurity incidents; (iii) future changes in laws or regulations (including the interpretation of these laws and regulations by regulatory authorities); (iv) conditions in the Company’s operating areas, particularly with respect to business development companies or regulated investment companies; and (v) other considerations that may be disclosed from time to time in the Company’s publicly disseminated documents and filings. The Company has based the forward-looking statements included in this press release on information available to it on the date of this press release, and the Company assumes no obligation to update any such forward-looking statements. The Company undertakes no obligation to revise or update any forward-looking statements, whether as a result of new information, future events or otherwise, you are advised to consult any additional disclosures that it may make directly to you or through reports that the Company in the future may file with the Securities and Exchange Commission, including annual reports on Form 10-K, quarterly reports on Form 10-Q and current reports on Form 8-K.

    Contacts

    Investor Relations:
    Oaktree Specialty Lending Corporation
    Dane Kleven
    (213) 356-3260
    ocsl-ir@oaktreecapital.com

    Media Relations:
    Financial Profiles, Inc.
    Moira Conlon
    (310) 478-2700
    mediainquiries@oaktreecapital.com

     
    Oaktree Specialty Lending Corporation
    Consolidated Statements of Assets and Liabilities
    (in thousands, except per share amounts)
           
      December 31, 2024 (unaudited)   September 30, 2024
    ASSETS      
    Investments at fair value:      
    Control investments (cost December 31, 2024: $374,509; cost September 30, 2024: $372,901) $ 267,782     $ 289,404  
    Affiliate investments (cost December 31, 2024: $37,358; cost September 30, 2024: $38,175)   35,180       35,677  
    Non-control/Non-affiliate investments (cost December 31, 2024: $2,576,053; cost September 30, 2024: $2,733,843)   2,532,332       2,696,198  
    Total investments at fair value (cost December 31, 2024: $2,987,920; September 30, 2024: $3,144,919)   2,835,294       3,021,279  
    Cash and cash equivalents   112,913       63,966  
    Restricted cash   13,159       14,577  
    Interest, dividends and fees receivable   25,290       38,804  
    Due from portfolio companies   408       12,530  
    Receivables from unsettled transactions   55,661       17,548  
    Due from broker   21,880       17,060  
    Deferred financing costs   10,936       11,677  
    Deferred offering costs   162       125  
    Derivative assets at fair value   6,652        
    Other assets   1,437       775  
    Total assets $ 3,083,792     $ 3,198,341  
           
    LIABILITIES AND NET ASSETS      
    Liabilities:      
    Accounts payable, accrued expenses and other liabilities $ 3,371     $ 3,492  
    Base management fee and incentive fee payable   8,930       15,517  
    Due to affiliate   1,508       4,088  
    Interest payable   17,600       16,231  
    Payables from unsettled transactions         15,666  
    Derivative liabilities at fair value   24,759       16,843  
    Deferred tax liability   14        
    Credit facilities payable   660,000       710,000  
    Unsecured notes payable (net of $4,401 and $4,935 of unamortized financing costs as of December 31, 2024 and September 30, 2024, respectively)   917,795       928,693  
    Total liabilities   1,633,977       1,710,530  
    Commitments and contingencies      
    Net assets:      
    Common stock, $0.01 par value per share, 250,000 shares authorized; 82,245 and 82,245 shares issued and outstanding as of December 31, 2024 and September 30, 2024, respectively   822       822  
    Additional paid-in-capital   2,264,449       2,264,449  
    Accumulated overdistributed earnings   (815,456 )     (777,460 )
    Total net assets (equivalent to $17.63 and $18.09 per common share as of December 31, 2024 and September 30, 2024, respectively)   1,449,815       1,487,811  
    Total liabilities and net assets $ 3,083,792     $ 3,198,341  
     
    Oaktree Specialty Lending Corporation
    Consolidated Statements of Operations
    (in thousands, except per share amounts)
     
                 
        Three months ended
    December 31, 2024 (unaudited)
      Three months ended
    September 30, 2024 (unaudited)
      Three months ended
    December 31, 2023 (unaudited)
    Interest income:            
    Control investments   $ 5,226     $ 6,012     $ 6,005  
    Affiliate investments     166       159       324  
    Non-control/Non-affiliate investments     71,809       76,476       82,721  
    Interest on cash and cash equivalents     1,221       979       2,364  
    Total interest income     78,422       83,626       91,414  
    PIK interest income:            
    Control investments     830       765       544  
    Affiliate investments     28       45        
    Non-control/Non-affiliate investments     4,870       5,208       3,305  
    Total PIK interest income     5,728       6,018       3,849  
    Fee income:            
    Control investments           12       13  
    Affiliate investments                 5  
    Non-control/Non-affiliate investments     1,679       3,885       1,289  
    Total fee income     1,679       3,897       1,307  
    Dividend income:            
    Control investments     700       1,050       1,400  
    Non-control/Non-affiliate investments     118       94       15  
    Total dividend income     818       1,144       1,415  
    Total investment income     86,647       94,685       97,985  
    Expenses:            
    Base management fee     8,144       8,550       11,477  
    Part I incentive fee     7,913       8,943       9,028  
    Professional fees     1,067       862       1,504  
    Directors fees     160       160       160  
    Interest expense     30,562       32,058       32,170  
    Administrator expense     437       465       366  
    General and administrative expenses     926       704       591  
    Total expenses     49,209       51,742       55,296  
    Management fees waived     (750 )     (750 )     (1,500 )
    Part I incentive fees waived     (6,377 )     (1,228 )      
    Net expenses     42,082       49,764       53,796  
    Net investment income before taxes     44,565       44,921       44,189  
    (Provision) benefit for taxes on net investment income     (263 )            
    Net investment income     44,302       44,921       44,189  
    Unrealized appreciation (depreciation):            
    Control investments     (23,230 )     (12,909 )     1,339  
    Affiliate investments     320       207       (925 )
    Non-control/Non-affiliate investments     (7,198 )     60,159       (17,615 )
    Foreign currency forward contracts     10,494       (4,278 )     (7,824 )
    Net unrealized appreciation (depreciation)     (19,614 )     43,179       (25,025 )
    Realized gains (losses):            
    Control investments                 786  
    Affiliate investments     (288 )            
    Non-control/Non-affiliate investments     (17,056 )     (50,349 )     (13,340 )
    Foreign currency forward contracts     34       (1,499 )     4,101  
    Net realized gains (losses)     (17,310 )     (51,848 )     (8,453 )
    (Provision) benefit for taxes on realized and unrealized gains (losses)     (139 )     661       (176 )
    Net realized and unrealized gains (losses), net of taxes     (37,063 )     (8,008 )     (33,654 )
    Net increase (decrease) in net assets resulting from operations   $ 7,239     $ 36,913     $ 10,535  
    Net investment income per common share — basic and diluted   $ 0.54     $ 0.55     $ 0.57  
    Earnings (loss) per common share — basic and diluted   $ 0.09     $ 0.45     $ 0.14  
    Weighted average common shares outstanding — basic and diluted     82,245       82,245       77,840  

    1 Adjusted earnings (loss) includes accrued Part II incentive fees. As of and for the three months ended December 31, 2024, there was no accrued Part II incentive fee liability. Part II incentive fees are contractually calculated and paid at the end of the fiscal year in accordance with the A&R Advisory Agreement, which differs from Part II incentive fees accrued under GAAP. For the three months ended December 31, 2024, no amounts were payable under the A&R Advisory Agreement.

    The MIL Network

  • MIL-OSI: WTW Reports Fourth Quarter and Full Year 2024 Earnings

    Source: GlobeNewswire (MIL-OSI)

    • Revenue1 increased 4% over prior year to $3.0 billion for the quarter and increased 5% to $9.9 billion for the year
    • Organic Revenue growth of 5% for both the quarter and the year
    • Diluted Earnings per Share was $12.25 for the quarter, up 105% over prior year, and Diluted Loss2 was $0.96 for the year.
    • Adjusted Diluted Earnings per Share was $8.13 for the quarter, up 9% from prior year, and $16.93 for the year, up 17% over prior year 
    • Operating Margin was 29.7% for the quarter, up 300 basis points over prior year, and 6.3% for the year, down 810 basis points from prior year
    • Adjusted Operating Margin was 36.1% for the quarter, up 190 basis points from prior year, and 23.9% for the year, up 190 basis points over prior year

    LONDON, Feb. 04, 2025 (GLOBE NEWSWIRE) — WTW (NASDAQ: WTW) (the “Company”), a leading global advisory, broking and solutions company, today announced financial results for the fourth quarter ended December 31, 2024.

    “WTW is entering 2025 with considerable momentum after delivering on our 2024 financial targets through solid revenue growth, robust margin expansion and earnings growth,” said Carl Hess, WTW’s chief executive officer. “The successful completion of our Grow, Simplify and Transform strategy has primed all of our businesses to perform, and we are now stronger, more connected and more efficient than we have ever been. I’m confident our new strategy to accelerate our performance, enhance our efficiency and optimize our portfolio will produce innovative solutions for our customers and create more value for shareholders. I’m proud of our team’s dedication and look forward to executing on our strategic and financial goals in the years ahead.”

    Consolidated Results

    Fourth Quarter 2024, as reported, USD millions, except %

    Key Metrics Q4-24 Q4-23 Y/Y Change
    Revenue1 $3,035 $2,914 Reported 4% | CC 5% | Organic 5%
    Income from Operations $901 $779 16%
    Operating Margin % 29.7% 26.7% 300 bps
    Adjusted Operating Income $1,096 $998 10%
    Adjusted Operating Margin % 36.1% 34.2% 190 bps
    Net Income $1,248 $623 100%
    Adjusted Net Income $827 $775 7%
    Diluted EPS $12.25 $5.97 105%
    Adjusted Diluted EPS $8.13 $7.44 9%

    Revenue was $3.04 billion for the fourth quarter of 2024, an increase of 4% as compared to $2.91 billion for the same period in the prior year. Excluding the impact of foreign currency, revenue increased 5%. On an organic basis, revenue increased 5%. See Supplemental Segment Information for additional detail on book-of-business settlements and interest income included in revenue.

    Net Income for the fourth quarter of 2024 was $1.25 billion compared to Net Income of $623 million in the prior-year fourth quarter. Adjusted EBITDA for the fourth quarter was $1.2 billion, or 38.6% of revenue, an increase of 9%, compared to Adjusted EBITDA of $1.1 billion, or 37.1% of revenue, in the prior-year fourth quarter. The U.S. GAAP tax rate for the fourth quarter was 26.0%, and the adjusted income tax rate for the fourth quarter used in calculating adjusted diluted earnings per share was 21.3%.

    Full Year 2024, as reported, USD millions, except %

    Key Metrics FY-24 FY-23 Y/Y Change
    Revenue1 $9,930 $9,483 Reported 5% | CC 5% | Organic 5%
    Income from Operations $627 $1,365 (54)%
    Operating Margin % 6.3% 14.4% (810) bps
    Adjusted Operating Income $2,378 $2,082 14%
    Adjusted Operating Margin % 23.9% 22.0% 190 bps
    Net (Loss)/Income2 $(88) $1,064 NM
    Adjusted Net Income $1,730 $1,536 13%
    Diluted EPS2 $(0.96) $9.95 NM
    Adjusted Diluted EPS $16.93 $14.49 17%
    1 The revenue amounts included in this release are presented on a U.S. GAAP basis except where stated otherwise. This excludes reinsurance revenue which is reported in discontinued operations. The segment discussion is on an organic basis.
    2 Net Loss and Diluted Loss Per Share for the year ended 2024 primarily includes impairment charges of over $1.0 billion related to the sale of TRANZACT.
    NM Not meaningful

    Revenue was $9.93 billion for the year ended December 31, 2024, an increase of 5% as compared to $9.48 billion for the prior year. On an organic basis, revenue increased 5%. See Supplemental Segment Information for additional detail on book-of-business settlements and interest income included in revenue.

    Net Loss for the year ended December 31, 2024 was $88 million, compared to Net Income of $1.1 billion in the prior year. Adjusted EBITDA for 2024 was $2.7 billion, or 27.3% of revenue, an increase of $278 million, compared to Adjusted EBITDA of $2.4 billion, or 25.6% of revenue, in the prior year.

    The U.S. GAAP tax rate for 2024 was 184.7%, and the adjusted income tax rate for 2024 used in calculating adjusted diluted earnings per share was 21.5%.

    Cash Flow and Capital Allocation 

    Cash flows from operating activities were $1.5 billion for the year ended December 31, 2024, compared to $1.3 billion for the prior year. Free cash flow for the years ended December 31, 2024 and 2023 was $1.4 billion and $1.2 billion, respectively, an increase of $184 million, primarily driven by operating margin expansion, partially offset by cash outflows related to transformation and discretionary compensation payments. During the fourth quarter and year ended December 31, 2024, the Company repurchased $395 million and $901 million of WTW shares, respectively.

    Fourth Quarter 2024 Segment Highlights

    Health, Wealth & Career (“HWC”)

    As reported, USD millions, except %

    Health, Wealth & Career Q4-24 Q4-23 Y/Y Change
    Total Revenue $1,853 $1,798 Reported 3% | CC 3% | Organic 3%
    Operating Income $776 $729 6%
    Operating Margin % 41.9% 40.5% 140 bps

    The HWC segment had revenue of $1.85 billion in the fourth quarter of 2024, an increase of 3% (3% increase constant currency and organic) from $1.80 billion in the prior year. Health had organic revenue growth led by increased project work and brokerage income in North America and the continued expansion of our Global Benefits Management client portfolio in International and Europe. Wealth generated organic revenue growth from higher levels of Retirement work globally, an increase in our Investments business due to growth of our LifeSight solution and capital market improvements. Career had organic revenue growth from increased advisory services and product revenue. Benefits Delivery & Outsourcing (BD&O) had an organic revenue decline for the quarter primarily as a result of deliberately moderating growth in TRANZACT.

    Operating margins in the HWC segment increased 140 basis points from the prior-year fourth quarter to 41.9%, primarily from Transformation savings. Please refer to the Supplemental Slides for TRANZACT’s standalone historical financial results.

    Risk & Broking (“R&B”)

    As reported, USD millions, except %

    Risk & Broking Q4-24 Q4-23 Y/Y Change
    Total Revenue $1,141 $1,076 Reported 6% | CC 7% | Organic 7%
    Operating Income $383 $354 8%
    Operating Margin % 33.5% 32.9% 60 bps

    The R&B segment had revenue of $1.14 billion in the fourth quarter of 2024, an increase of 6% (7% increase constant currency and organic) from $1.08 billion in the prior year. Corporate Risk & Broking (CRB) had organic revenue growth driven by higher levels of new business activity and strong client retention. Insurance Consulting and Technology (ICT) had organic revenue growth for the quarter primarily due to strong software sales in Technology.

    Operating margins in the R&B segment increased 60 basis points from the prior-year fourth quarter to 33.5%, primarily due to operating leverage driven by organic revenue growth and disciplined expense management, as well as Transformation savings which were partially offset by headwinds from book-of-business activity and foreign currency fluctuations.

    Select 2025 Financial Considerations

    Changes to Non-GAAP financial measures:

    • All reported non-GAAP metrics will exclude non-cash net periodic pension and postretirement benefit credits
    • Free cash flow and free cash flow margin will capture cash outflows for capitalized software costs
    • Refer to Supplemental Slides for recast of historical Non-GAAP measures

    Business mix:

    • Divested TRANZACT business, which contributed $1.14 to adjusted diluted earnings per share in 2024, is no longer part of the business portfolio
    • Reinsurance joint venture expected to be a headwind on adjusted diluted earnings per share of approximately $0.25 to $0.35

    Free cash flow:

    • Expect cash outflows in 2025 from the settlement of accrued costs related to the Transformation program which concluded in 2024
    • Cash taxes related to receipt of earnout from reinsurance divestiture will be classified as Cash Flows from Operating Activities on Statement of Cash Flows

    Capital allocation:

    • Expect share repurchases of ~$1.5 billion, subject to market conditions and potential capital allocation to organic and inorganic investment opportunities

    Foreign exchange:

    • Expect a foreign currency headwind on adjusted diluted earnings per share of approximately $0.18 in 2025 at today’s rates

    Adjusted operating margin outlook:

    • ~100 basis points of average annual margin expansion over next 3 years in R&B
    • Incremental annual margin expansion at HWC and enterprise levels

    The 2025 Financial Considerations above include Non-GAAP financial measures. We do not reconcile forward-looking Non-GAAP measures for reasons explained under “WTW Non-GAAP Measures” below.

    Conference Call

    The Company will host a live webcast and conference call to discuss the financial results for the fourth quarter 2024. It will be held on Tuesday, February 4, 2025, beginning at 9:00 a.m. Eastern Time. A live broadcast of the conference call will be available on WTW’s website here. The conference call will include a question-and-answer session. To participate in the question-and-answer session, please register here. An online replay will be available at www.wtwco.com shortly after the call concludes.

    About WTW

    At WTW (NASDAQ: WTW), we provide data-driven, insight-led solutions in the areas of people, risk and capital. Leveraging the global view and local expertise of our colleagues serving 140 countries and markets, we help organizations sharpen their strategy, enhance organizational resilience, motivate their workforce and maximize performance. Working shoulder to shoulder with our clients, we uncover opportunities for sustainable success—and provide perspective that moves you. Learn more at www.wtwco.com.

    WTW Non-GAAP Measures

    In order to assist readers of our consolidated financial statements in understanding the core operating results that WTW’s management uses to evaluate the business and for financial planning, we present the following non-GAAP measures: (1) Constant Currency Change, (2) Organic Change, (3) Adjusted Operating Income/Margin, (4) Adjusted EBITDA/Margin, (5) Adjusted Net Income, (6) Adjusted Diluted Earnings Per Share, (7) Adjusted Income Before Taxes, (8) Adjusted Income Taxes/Tax Rate, (9) Free Cash Flow and (10) Free Cash Flow Margin.

    We believe that those measures are relevant and provide pertinent information widely used by analysts, investors and other interested parties in our industry to provide a baseline for evaluating and comparing our operating performance, and in the case of free cash flow, our liquidity results.

    Within the measures referred to as ‘adjusted’, we adjust for significant items which will not be settled in cash, or which we believe to be items that are not core to our current or future operations. Some of these items may not be applicable for the current quarter, however they may be part of our full-year results. Additionally, we have historically adjusted for certain items which are not described below, but for which we may adjust in a future period when applicable. Items applicable to the quarter or full year results, or the comparable periods, include the following:

    • Restructuring costs and transaction and transformation – Management believes it is appropriate to adjust for restructuring costs and transaction and transformation when they relate to a specific significant program with a defined set of activities and costs that are not expected to continue beyond a defined period of time, or significant acquisition-related transaction expenses. We believe the adjustment is necessary to present how the Company is performing, both now and in the future when the incurrence of these costs will have concluded.
    • Impairment – Adjustment to remove the non-cash goodwill impairment associated with our Benefits, Delivery and Administration reporting unit related to the sale of our TRANZACT business.
    • Provisions for specified litigation matters – We will include provisions for litigation matters which we believe are not representative of our core business operations. Among other things, we determine this by reference to the amount of the loss (net of insurance and other recovery receivables) and by reference to whether the matter relates to an unusual and complex scenario that is not expected to be repeated as part of our ongoing, ordinary business. These amounts are presented net of insurance and other recovery receivables. See the footnotes to the respective reconciliation tables below for more specificity on the litigation matter excluded from adjusted results.
    • Gains and losses on disposals of operations – Adjustment to remove the gains or losses resulting from disposed operations that have not been classified as discontinued operations.
    • Pension settlement – Adjustment to remove significant pension settlement to better present how the Company is performing.
    • Tax effect of significant adjustments – Relates to the incremental tax expense or benefit resulting from significant or unusual events including significant statutory tax rate changes enacted in material jurisdictions in which we operate, internal reorganizations of ownership of certain businesses that reduced the investment held by our U.S.-controlled subsidiaries and the recovery of certain refunds or payment of taxes related to businesses in which we no longer participate.

    We evaluate our revenue on an as reported (U.S. GAAP), constant currency and organic basis. We believe presenting constant currency and organic information provides valuable supplemental information regarding our comparable results, consistent with how we evaluate our performance internally.

    We consider Constant Currency Change, Organic Change, Adjusted Operating Income/Margin, Adjusted EBITDA/Margin, Adjusted Net Income, Adjusted Diluted Earnings Per Share, Adjusted Income Before Taxes, Adjusted Income Taxes/Tax Rate and Free Cash Flow to be important financial measures, which are used to internally evaluate and assess our core operations and to benchmark our operating and liquidity results against our competitors. These non-GAAP measures are important in illustrating what our comparable operating and liquidity results would have been had we not incurred transaction-related and non-recurring items. Reconciliations of these measures are included in the accompanying tables with the following exception: The Company does not reconcile its forward-looking non-GAAP financial measures to the corresponding U.S. GAAP measures, due to variability and difficulty in making accurate forecasts and projections and/or certain information not being ascertainable or accessible; and because not all of the information, such as foreign currency impacts necessary for a quantitative reconciliation of these forward-looking non-GAAP financial measures to the most directly comparable U.S. GAAP financial measure, is available to the Company without unreasonable efforts. For the same reasons, the Company is unable to address the probable significance of the unavailable information. The Company provides non-GAAP financial measures that it believes will be achieved, however it cannot accurately predict all of the components of the adjusted calculations and the U.S. GAAP measures may be materially different than the non-GAAP measures.

    Our non-GAAP measures and their accompanying definitions are presented as follows:

    Constant Currency Change – Represents the year-over-year change in revenue excluding the impact of foreign currency fluctuations. To calculate this impact, the prior year local currency results are first translated using the current year monthly average exchange rates. The change is calculated by comparing the prior year revenue, translated at the current year monthly average exchange rates, to the current year as reported revenue, for the same period. We believe constant currency measures provide useful information to investors because they provide transparency to performance by excluding the effects that foreign currency exchange rate fluctuations have on period-over-period comparability given volatility in foreign currency exchange markets.

    Organic Change – Excludes the impact of fluctuations in foreign currency exchange rates, as described above and the period-over-period impact of acquisitions and divestitures on current-year revenue. We believe that excluding transaction-related items from our U.S. GAAP financial measures provides useful supplemental information to our investors, and it is important in illustrating what our core operating results would have been had we not included these transaction-related items, since the nature, size and number of these transaction-related items can vary from period to period.

    Adjusted Operating Income/Margin – (Loss)/Income from operations adjusted for impairment, amortization, restructuring costs, transaction and transformation and non-recurring items that, in management’s judgment, significantly affect the period-over-period assessment of operating results. Adjusted operating income margin is calculated by dividing adjusted operating income by revenue. We consider adjusted operating income/margin to be important financial measures, which are used internally to evaluate and assess our core operations and to benchmark our operating results against our competitors.

    Adjusted EBITDA/Margin – Net (Loss)/Income adjusted for provision for income taxes, interest expense, impairment, depreciation and amortization, restructuring costs, transaction and transformation, gains and losses on disposals of operations and non-recurring items that, in management’s judgment, significantly affect the period-over-period assessment of operating results. Adjusted EBITDA Margin is calculated by dividing adjusted EBITDA by revenue. We consider adjusted EBITDA/margin to be important financial measures, which are used internally to evaluate and assess our core operations, to benchmark our operating results against our competitors and to evaluate and measure our performance-based compensation plans.

    Adjusted Net Income – Net (Loss)/Income Attributable to WTW adjusted for impairment, amortization, restructuring costs, transaction and transformation, gains and losses on disposals of operations and non-recurring items that, in management’s judgment, significantly affect the period-over-period assessment of operating results and the related tax effect of those adjustments and the tax effects of internal reorganizations. This measure is used solely for the purpose of calculating adjusted diluted earnings per share.

    Adjusted Diluted Earnings Per Share – Adjusted Net Income divided by the weighted-average number of ordinary shares, diluted. Adjusted diluted earnings per share is used to internally evaluate and assess our core operations and to benchmark our operating results against our competitors.

    Adjusted Income Before Taxes – (Loss)/Income from operations before income taxes adjusted for impairment, amortization, restructuring costs, transaction and transformation, gains and losses on disposals of operations and non-recurring items that, in management’s judgment, significantly affect the period-over-period assessment of operating results. Adjusted income before taxes is used solely for the purpose of calculating the adjusted income tax rate.

    Adjusted Income Taxes/Tax Rate – Benefit from/(provision for) income taxes adjusted for taxes on certain items of impairment, amortization, restructuring costs, transaction and transformation, gains and losses on disposals of operations, the tax effects of internal reorganizations, and non-recurring items that, in management’s judgment, significantly affect the period-over-period assessment of operating results, divided by adjusted income before taxes. Adjusted income taxes is used solely for the purpose of calculating the adjusted income tax rate. Management believes that the adjusted income tax rate presents a rate that is more closely aligned to the rate that we would incur if not for the reduction of pre-tax income for the adjusted items and the tax effects of internal reorganizations, which are not core to our current and future operations.

    Free Cash Flow – Cash flows from operating activities less cash used to purchase fixed assets and software for internal use. Free Cash Flow is a liquidity measure and is not meant to represent residual cash flow available for discretionary expenditures. Management believes that free cash flow presents the core operating performance and cash-generating capabilities of our business operations.

    Free Cash Flow Margin – Free Cash Flow as a percentage of revenue, which represents how much of revenue would be realized on a cash basis. We consider this measure to be a meaningful metric for tracking cash conversion on a year-over-year basis due to the non-cash nature of our pension income, which is included in our GAAP and Non-GAAP earnings metrics presented herein.

    These non-GAAP measures are not defined in the same manner by all companies and may not be comparable to other similarly titled measures of other companies. Non-GAAP measures should be considered in addition to, and not as a substitute for, the information contained within our condensed consolidated financial statements.

    WTW Forward-Looking Statements

    This document contains ‘forward-looking statements’ within the meaning of Section 27A of the Securities Act of 1933, and Section 21E of the Securities Exchange Act of 1934, which are intended to be covered by the safe harbors created by those laws. These forward-looking statements include information about possible or assumed future results of our operations or certain considerations relating to our future results. All statements, other than statements of historical facts, that address activities, events, or developments that we expect or anticipate may occur in the future, including such things as our outlook, plans and references to future performance, including our future financial and operating results (including our revenue, costs, or margins), short-term and long-term financial goals, plans, objectives, expectations and intentions, including with respect to organic revenue growth, free cash flow generation, adjusted net revenue, adjusted operating margin and adjusted earnings per share; future share repurchases; demand for our services and competitive strengths; strategic goals; existing and evolving business strategies including those related to acquisition and disposition activity; the benefits of new initiatives; the growth of our business and operations; the sustained health of our product, service, transaction, client, and talent assessment and management pipelines; our ability to successfully manage ongoing leadership, organizational, and technology changes, including investments in improving systems and processes; our ability to implement and realize anticipated benefits of any cost-savings initiatives including our multi-year operational transformation program; the potential impact of natural or man-made disasters like health pandemics and other world health crises; future capital expenditures; ongoing working capital efforts; the impact of changes to tax laws on our financial results; and our recognition of future impairment charges or write-off of receivables, are forward-looking statements. Also, when we use words such as ‘may’, ‘will’, ‘would’, ‘anticipate’, ‘believe’, ‘estimate’, ‘expect’, ‘intend’, ‘plan’, ‘continues’, ‘seek’, ‘target’, ‘goal’, ‘focus’, ‘probably’, or similar expressions, we are making forward-looking statements. Such statements are based upon the current beliefs and expectations of our management and are subject to significant risks and uncertainties. Actual results may differ from those set forth in the forward-looking statements. All forward-looking disclosure is speculative by its nature.

    There are important risks, uncertainties, events and factors that could cause our actual results or performance to differ materially from those in the forward-looking statements contained in this document, including the following: our ability to successfully establish, execute and achieve our global business strategy as it evolves; our ability to fully realize the anticipated benefits of our growth strategy, including inorganic growth through acquisitions; our ability to execute strategic transactions, including both acquisitions and dispositions, including our ability to receive adequate consideration or any earnout proceeds in return for any dispositions or integrate or manage acquired businesses or effect internal reorganizations; incremental risks relating to the transitional arrangements in effect subsequent to our previously completed sale of TRANZACT; our ability to successfully manage ongoing organizational changes, investments in improving systems and processes, and in connection with our acquisition and divestiture activities; risks relating to changes in our management structures and in senior leadership; our ability to achieve our short-term and long-term financial goals, such as with respect to our cash flow generation, and the timing with respect to such achievement; the risks related to changes in general economic conditions, business and political conditions, changes in the financial markets, inflation, credit availability, increased interest rates and changes in trade policies; the risks to our short-term and long-term financial goals from any of the risks or uncertainties set forth herein; the risks relating to the adverse impacts of macroeconomic trends, including inflation, changes in interest rates and trade policies, as well as political events, war, such as the Russia-Ukraine and Middle East conflicts, and other international disputes, terrorism, natural disasters, public health issues and other business interruptions on the global economy and capital markets, which could have a material adverse effect on our business, financial condition, results of operations, and long-term goals; our ability to successfully hedge against fluctuations in foreign currency rates; the risks relating to the adverse impacts of natural or man-made disasters such as health pandemics and other world health crises on the demand for our products and services, our cash flows and our business operations; material interruptions to or loss of our information processing capabilities, or failure to effectively maintain and upgrade our information technology resources and systems and related risks of cybersecurity breaches or incidents; our ability to comply with complex and evolving regulations related to data privacy, cybersecurity, and artificial intelligence; significant competition that we face and the potential for loss of market share and/or profitability; the impact of seasonality and differences in timing of renewals and non-recurring revenue increases from disposals and book-of-business sales; the insufficiency of client data protection, potential breaches of information systems or insufficient safeguards against cybersecurity breaches or incidents; the risk of increased liability or new legal claims arising from our new and existing products and services, and expectations, intentions and outcomes relating to outstanding litigation; the risk of substantial negative outcomes on existing litigation or investigation matters; changes in the regulatory environment in which we operate, including, among other risks, the impacts of pending competition law and regulatory investigations; various claims, government inquiries or investigations or the potential for regulatory action; our ability to integrate direct-to-consumer sales and marketing solutions with our existing offerings and solutions; disasters or business continuity problems; our ability to successfully enhance our billing, collection and other working capital efforts, and thereby increase our free cash flow; our ability to properly identify and manage conflicts of interest; reputational damage, including from association with third parties; reliance on third-party service providers and suppliers; the loss of key employees or a large number of employees and rehiring rates; our ability to maintain our corporate culture; doing business internationally, including the impact of foreign currency exchange rates; compliance with extensive government regulation; the risk of sanctions imposed by governments, or changes to associated sanction regulations (such as sanctions imposed on Russia) and related counter-sanctions; our ability to effectively apply technology, data and analytics changes for internal operations, maintaining industry standards and meeting client preferences; changes and developments in the insurance industry or the U.S. healthcare system, including those related to Medicare, any legislative actions from the current U.S. Congress, the recent Final Rule from the Centers for Medicare & Medicaid Services for contract year 2025 and any judicial claims, rulings and appeals related thereto, and any other changes and developments in legal, regulatory, economic, business or operational conditions that could impact our Medicare benefits businesses; the inability to protect our intellectual property rights, or the potential infringement upon the intellectual property rights of others; fluctuations in our pension assets and liabilities and related changes in pension income, including as a result of, related to, or derived from movements in the interest rate environment, investment returns, inflation, or changes in other assumptions that are used to estimate our benefit obligations and their effect on adjusted earnings per share; our capital structure, including indebtedness amounts, the limitations imposed by the covenants in the documents governing such indebtedness and the maintenance of the financial and disclosure controls and procedures of each; our ability to obtain financing on favorable terms or at all; adverse changes in our credit ratings; the impact of recent or potential changes to U.S. or foreign laws, and the enactment of additional, or the revision of existing, state, federal, and/or foreign laws and regulations, recent judicial decisions and development of case law, other regulations and any policy changes and legislative actions, including those that may impose additional excise taxes or impact our effective tax rate; U.S. federal income tax consequences to U.S. persons owning at least 10% of our shares; changes in accounting principles, estimates or assumptions; our recognition of future non-cash pre-tax losses and related impairment charges; risks relating to or arising from environmental, social and governance practices; fluctuation in revenue against our relatively fixed or higher than expected expenses; the laws of Ireland being different from the laws of the U.S. and potentially affording less protections to the holders of our securities; and our holding company structure potentially preventing us from being able to receive dividends or other distributions in needed amounts from our subsidiaries.

    The foregoing list of factors is not exhaustive and new factors may emerge from time to time that could also affect actual performance and results. For more information, please see Part I, Item 1A in our Annual Report on Form 10-K, and our subsequent filings with the SEC. Copies are available online at www.sec.gov or www.wtwco.com.

    Although we believe that the assumptions underlying our forward-looking statements are reasonable, any of these assumptions, and therefore also the forward-looking statements based on these assumptions, could themselves prove to be inaccurate. Given the significant uncertainties inherent in the forward-looking statements included in this document, our inclusion of this information is not a representation or guarantee by us that our objectives and plans will be achieved.

    Our forward-looking statements speak only as of the date made, and we will not update these forward-looking statements unless the securities laws require us to do so. With regard to these risks, uncertainties and assumptions, the forward-looking events discussed in this document may not occur, and we caution you against unduly relying on these forward-looking statements.

    Contact

    INVESTORS
    Claudia De La Hoz | Claudia.Delahoz@wtwco.com


    WTW
    Supplemental Segment Information
    (In millions of U.S. dollars)
    (Unaudited)
     
    REVENUE    
                  Components of Revenue Change(i)
                        Less:       Less:    
        Three Months Ended
     December 31,
        As Reported   Currency   Constant Currency   Acquisitions/   Organic
        2024     2023     % Change   Impact   Change   Divestitures   Change
                                     
    Health, Wealth & Career                                
    Revenue excluding interest income   $ 1,847     $ 1,791     3%   0%   3%   0%   3%
    Interest income     6       7                      
    Total     1,853       1,798     3%   0%   3%   0%   3%
                                     
    Risk & Broking                                
    Revenue excluding interest income   $ 1,115     $ 1,049     6%   (1)%   7%   0%   7%
    Interest income     26       27                      
    Total     1,141       1,076     6%   (1)%   7%   0%   7%
                                     
    Segment Revenue   $ 2,994     $ 2,874     4%   (1)%   5%   0%   5%
    Corporate, reimbursable expenses and other     37       35                      
    Interest income     4       5                      
    Revenue   $ 3,035     $ 2,914     4%   (1)%   5%   0%   5%(ii)
                  Components of Revenue Change(i)
                        Less:       Less:    
        Years Ended December 31,    As Reported   Currency   Constant Currency   Acquisitions/   Organic
        2024    2023    % Change   Impact   Change   Divestitures   Change
                                     
    Health, Wealth & Career                                
    Revenue excluding interest income   $ 5,745     $ 5,557     3%   0%   3%   0%   4%
    Interest income     32       25                      
    Total     5,777       5,582     3%   0%   4%   0%   4%
                                     
    Risk & Broking                                
    Revenue excluding interest income   $ 3,926     $ 3,656     7%   0%   8%   0%   8%
    Interest income     112       79                      
    Total     4,038       3,735     8%   (1)%   9%   0%   8%
                                     
    Segment Revenue   $ 9,815     $ 9,317     5%   0%   6%   0%   6%
    Corporate, reimbursable expenses and other     93       125                      
    Interest income     22       41                      
    Revenue   $ 9,930     $ 9,483     5%   0%   5%   0%   5%(ii)

    (i)  Components of revenue change may not add due to rounding.
    (ii)  Interest income did not contribute to organic change for the three months and year ended December 31, 2024.

    BOOK-OF-BUSINESS SETTLEMENTS AND INTEREST INCOME

        Three Months Ended December 31,  
        HWC    R&B    Corporate    Total 
        2024    2023    2024    2023    2024    2023    2024    2023 
    Book-of-business settlements   $ 5     $ 1     $ 6     $ 14     $     $     $ 11     $ 15  
    Interest income     6       7       26       27       4       5       36       39  
    Total   $ 11     $ 8     $ 32     $ 41     $ 4     $ 5     $ 47     $ 54  
        Years Ended December 31,  
        HWC    R&B    Corporate    Total 
        2024    2023    2024    2023    2024    2023    2024    2023 
    Book-of-business settlements   $ 8     $ 1     $ 14     $ 25     $     $     $ 22     $ 26  
    Interest income     32       25       112       79       22       41       166       145  
    Total   $ 40     $ 26     $ 126     $ 104     $ 22     $ 41     $ 188     $ 171  


    SEGMENT OPERATING INCOME (i)

        Three Months Ended
    December 31, 
        2024    2023 
                 
    Health, Wealth & Career   $ 776     $ 729  
    Risk & Broking     383       354  
    Segment Operating Income   $ 1,159     $ 1,083  
        Years Ended
    December 31, 
        2024    2023 
                 
    Health, Wealth & Career   $ 1,717     $ 1,565  
    Risk & Broking     958       813  
    Segment Operating Income   $ 2,675     $ 2,378  


    (i)
    Segment operating income excludes certain costs, including amortization of intangibles, restructuring costs, transaction and transformation expenses, certain litigation provisions, and to the extent that the actual expense based upon which allocations are made differs from the forecast/budget amount, a reconciling item will be created between internally-allocated expenses and the actual expenses reported for U.S. GAAP purposes.

    SEGMENT OPERATING MARGINS

        Three Months Ended December 31,
        2024    2023 
    Health, Wealth & Career   41.9%   40.5%
    Risk & Broking   33.5%   32.9%
        Years Ended
    December 31,
        2024    2023 
    Health, Wealth & Career   29.7%   28.0%
    Risk & Broking   23.7%   21.8%


    RECONCILIATIONS OF SEGMENT OPERATING INCOME TO INCOME FROM OPERATIONS BEFORE INCOME TAXES

        Three Months Ended December 31, 
        2024    2023 
                 
    Segment Operating Income   $ 1,159     $ 1,083  
    Amortization     (50 )     (60 )
    Restructuring costs     (32 )     (38 )
    Transaction and transformation(i)     (113 )     (121 )
    Unallocated, net(ii)     (63 )     (85 )
    Income from Operations     901       779  
    Interest expense     (66 )     (63 )
    Other income, net     853       23  
    Income from operations before income taxes   $ 1,688     $ 739  
        Years Ended December 31, 
        2024    2023 
                 
    Segment Operating Income   $ 2,675     $ 2,378  
    Impairment(iii)     (1,042 )      
    Amortization     (226 )     (263 )
    Restructuring costs     (61 )     (68 )
    Transaction and transformation(i)     (409 )     (386 )
    Unallocated, net(ii)     (310 )     (296 )
    Income from Operations     627       1,365  
    Interest expense     (263 )     (235 )
    Other (loss)/income, net     (260 )     149  
    Income from operations before income taxes   $ 104     $ 1,279  

     (i) In 2024 and 2023, in addition to legal fees and other transaction costs, includes primarily consulting fees and compensation costs related to the Transformation program.
     (ii) Includes certain costs, primarily related to corporate functions which are not directly related to the segments, and certain differences between budgeted expenses determined at the beginning of the year and actual expenses that we report for U.S. GAAP purposes.
     (iii) Represents the non-cash goodwill impairment associated with our BDA reporting unit related to the completed sale of our TRANZACT business.

    WTW
    Reconciliations of Non-GAAP Measures
    (In millions of U.S. dollars, except per share data)
    (Unaudited)

    RECONCILIATIONS OF NET INCOME/(LOSS) ATTRIBUTABLE TO WTW TO ADJUSTED DILUTED EARNINGS PER SHARE

        Three Months Ended December 31, 
        2024    2023 
                 
    Net income attributable to WTW   $ 1,246     $ 622  
    Adjusted for certain items:            
    Amortization     50       60  
    Restructuring costs     32       38  
    Transaction and transformation     113       121  
    Pension settlement     23        
    (Gain)/loss on disposal of operations     (853 )     1  
    Tax effect on certain items listed above(i)     216       (67 )
    Adjusted Net Income   $ 827     $ 775  
                 
    Weighted-average ordinary shares, diluted     102       104  
                 
    Diluted Earnings Per Share   $ 12.25     $ 5.97  
    Adjusted for certain items:(ii)            
    Amortization     0.49       0.58  
    Restructuring costs     0.31       0.36  
    Transaction and transformation     1.11       1.16  
    Pension settlement     0.23        
    (Gain)/loss on disposal of operations     (8.39 )     0.01  
    Tax effect on certain items listed above(i)     2.12       (0.64 )
    Adjusted Diluted Earnings Per Share(ii)   $ 8.13     $ 7.44  
        Years Ended December 31, 
        2024    2023 
                 
    Net (loss)/income attributable to WTW   $ (98 )   $ 1,055  
    Adjusted for certain items:            
    Impairment     1,042        
    Amortization     226       263  
    Restructuring costs     61       68  
    Transaction and transformation     409       386  
    Provision for specified litigation matter(iii)     13        
    Pension settlement     23        
    Loss/(gain) on disposal of operations     337       (43 )
    Tax effect on certain items listed above(i)     (276 )     (195 )
    Tax effect of significant adjustments     (7 )     2  
    Adjusted Net Income   $ 1,730     $ 1,536  
                 
    Weighted-average ordinary shares, diluted(iv)     102       106  
                 
    Diluted (Loss)/Earnings Per Share(iv)   $ (0.96 )   $ 9.95  
    Adjusted for certain items:(ii)            
    Impairment     10.20        
    Amortization     2.21       2.48  
    Restructuring costs     0.60       0.64  
    Transaction and transformation     4.00       3.64  
    Provision for specified litigation matter(iii)     0.13        
    Pension settlement     0.23        
    Loss/(gain) on disposal of operations     3.30       (0.41 )
    Tax effect on certain items listed above(i)     (2.70 )     (1.84 )
    Tax effect of significant adjustments     (0.07 )     0.02  
    Adjusted Diluted Earnings Per Share(ii)   $ 16.93     $ 14.49  

     (i) The tax effect was calculated using an effective tax rate for each item.
    (ii) Per share values and totals may differ due to rounding.
    (iii) Represents a provision related to litigation arising out of a structured insurance program originally placed for a client over 15 years ago. The program is of a type and complexity that was highly bespoke to the client and for that reason is unlikely to be exactly replicated elsewhere. We believe excluding this matter from adjusted results makes results more comparable from period to period and more representative of our core business operations.
    (iv) When there is a net loss attributable to WTW for the period, basic and diluted shares and earnings per share are the same values.

    RECONCILIATIONS OF NET INCOME/(LOSS) TO ADJUSTED EBITDA

        Three Months Ended December 31,    
        2024    2023   
                   
    Net Income   $ 1,248   41.1% $ 623   21.4%
    Provision for income taxes     440       116    
    Interest expense     66       63    
    Depreciation     54       58    
    Amortization     50       60    
    Restructuring costs     32       38    
    Transaction and transformation     113       121    
    Pension settlement     23          
    (Gain)/loss on disposal of operations     (853 )     1    
    Adjusted EBITDA and Adjusted EBITDA Margin   $ 1,173   38.6% $ 1,080   37.1%
        Years Ended December 31,    
        2024    2023   
                   
    Net (Loss)/Income   $ (88 ) (0.9)% $ 1,064   11.2%
    Provision for income taxes     192       215    
    Interest expense     263       235    
    Impairment     1,042          
    Depreciation     230       242    
    Amortization     226       263    
    Restructuring costs     61       68    
    Transaction and transformation     409       386    
    Provision for specified litigation matter(i)     13          
    Pension settlement     23          
    Loss/(gain) on disposal of operations     337       (43 )  
    Adjusted EBITDA and Adjusted EBITDA Margin   $ 2,708   27.3% $ 2,430   25.6%

     (i) Represents a provision related to litigation arising out of a structured insurance program originally placed for a client over 15 years ago. The program is of a type and complexity that was highly bespoke to the client and for that reason is unlikely to be exactly replicated elsewhere. We believe excluding this matter from adjusted results makes results more comparable from period to period and more representative of our core business operations.

    RECONCILIATIONS OF INCOME FROM OPERATIONS TO ADJUSTED OPERATING INCOME

        Three Months Ended December 31,    
        2024     2023    
                   
    Income from operations and Operating margin   $ 901   29.7% $ 779   26.7%
    Adjusted for certain items:              
    Amortization     50       60    
    Restructuring costs     32       38    
    Transaction and transformation     113       121    
    Adjusted operating income and Adjusted operating income margin   $ 1,096   36.1% $ 998   34.2%
        Years Ended December 31,    
        2024     2023    
                   
    Income from operations and Operating margin   $ 627   6.3% $ 1,365   14.4%
    Adjusted for certain items:              
    Impairment     1,042          
    Amortization     226       263    
    Restructuring costs     61       68    
    Transaction and transformation     409       386    
    Provision for specified litigation matter(i)     13          
    Adjusted operating income and Adjusted operating income margin   $ 2,378   23.9% $ 2,082   22.0%

    (i) Represents a provision related to litigation arising out of a structured insurance program originally placed for a client over 15 years ago. The program is of a type and complexity that was highly bespoke to the client and for that reason is unlikely to be exactly replicated elsewhere. We believe excluding this matter from adjusted results makes results more comparable from period to period and more representative of our core business operations.

    RECONCILIATIONS OF GAAP INCOME TAXES/TAX RATE TO ADJUSTED INCOME TAXES/TAX RATE

        Three Months Ended December 31, 
        2024    2023 
                 
    Income from operations before income taxes   $ 1,688     $ 739  
                 
    Adjusted for certain items:            
    Amortization     50       60  
    Restructuring costs     32       38  
    Transaction and transformation     113       121  
    Pension settlement     23        
    (Gain)/loss on disposal of operations     (853 )     1  
    Adjusted income before taxes   $ 1,053     $ 959  
                 
    Provision for income taxes   $ 440     $ 116  
    Tax effect on certain items listed above(ii)     (216 )     67  
    Adjusted income taxes   $ 224     $ 183  
                 
    U.S. GAAP tax rate     26.0 %     15.7 %
    Adjusted income tax rate     21.3 %     19.1 %
        Years Ended December 31, 
        2024    2023 
                 
    Income from operations before income taxes   $ 104     $ 1,279  
                 
    Adjusted for certain items:            
    Impairment     1,042        
    Amortization     226       263  
    Restructuring costs     61       68  
    Transaction and transformation     409       386  
    Provision for specified litigation matter(i)     13        
    Pension settlement     23        
    Loss/(gain) on disposal of operations     337       (43 )
    Adjusted income before taxes   $ 2,215     $ 1,953  
                 
    Provision for income taxes   $ 192     $ 215  
    Tax effect on certain items listed above(ii)     276       195  
    Tax effect of significant adjustments     7       (2 )
    Adjusted income taxes   $ 475     $ 408  
                 
    U.S. GAAP tax rate     184.7 %     16.8 %
    Adjusted income tax rate     21.5 %     20.9 %

    (i) Represents a provision related to litigation arising out of a structured insurance program originally placed for a client over 15 years ago. The program is of a type and complexity that was highly bespoke to the client and for that reason is unlikely to be exactly replicated elsewhere. We believe excluding this matter from adjusted results makes results more comparable from period to period and more representative of our core business operations.
    (ii) The tax effect was calculated using an effective tax rate for each item.

    RECONCILIATION OF CASH FLOWS FROM OPERATING ACTIVITIES TO FREE CASH FLOW

        Years Ended December 31, 
        2024    2023 
                 
    Cash flows from operating activities   $ 1,512     $ 1,345  
    Less: Additions to fixed assets and software for internal use     (136 )     (153 )
    Free Cash Flow   $ 1,376     $ 1,192  
                 
    Revenue   $ 9,930     $ 9,483  
    Free Cash Flow Margin     13.9 %     12.6 %


    WILLIS TOWERS WATSON PUBLIC LIMITED COMPANY
    Condensed Consolidated Statements of Income
    (In millions of U.S. dollars, except per share data)
    (Unaudited)
                 
        Three Months Ended
     December 31, 
      Years Ended
     December 31, 
        2024    2023    2024    2023 
    Revenue   $ 3,035     $ 2,914     $ 9,930     $ 9,483  
                             
    Costs of providing services                        
    Salaries and benefits     1,367       1,325       5,502       5,344  
    Other operating expenses     518       533       1,833       1,815  
    Impairment                 1,042        
    Depreciation     54       58       230       242  
    Amortization     50       60       226       263  
    Restructuring costs     32       38       61       68  
    Transaction and transformation     113       121       409       386  
    Total costs of providing services     2,134       2,135       9,303       8,118  
                             
    Income from operations     901       779       627       1,365  
                             
    Interest expense     (66 )     (63 )     (263 )     (235 )
    Other income/(loss), net     853       23       (260 )     149  
                             
    INCOME FROM OPERATIONS BEFORE INCOME TAXES   1,688       739       104       1,279  
                             
    Provision for income taxes     (440 )     (116 )     (192 )     (215 )
                             
    NET INCOME/(LOSS)   1,248       623       (88 )     1,064  
                             
    Income attributable to non-controlling interests     (2 )     (1 )     (10 )     (9 )
                             
    NET INCOME/(LOSS) ATTRIBUTABLE TO WTW   $ 1,246     $ 622     $ (98 )   $ 1,055  
                             
    EARNINGS/(LOSS) PER SHARE                        
    Basic earnings/(loss) per share   $ 12.32     $ 6.02     $ (0.96 )   $ 10.01  
    Diluted earnings/(loss) per share   $ 12.25     $ 5.97     $ (0.96 )   $ 9.95  
                             
    Weighted-average ordinary shares, basic     101       103       102       105  
    Weighted-average ordinary shares, diluted     102       104       102       106  


    WILLIS TOWERS WATSON PUBLIC LIMITED COMPANY
    Condensed Consolidated Balance Sheets
    (In millions of U.S. dollars, except share data)
    (Unaudited)
     
        December 31,    December 31, 
        2024    2023 
    ASSETS            
    Cash and cash equivalents   $ 1,890     $ 1,424  
    Fiduciary assets     9,504       9,073  
    Accounts receivable, net     2,494       2,572  
    Prepaid and other current assets     1,217       364  
    Total current assets     15,105       13,433  
    Fixed assets, net     661       720  
    Goodwill     8,799       10,195  
    Other intangible assets, net     1,295       2,016  
    Right-of-use assets     485       565  
    Pension benefits assets     530       588  
    Other non-current assets     806       1,573  
    Total non-current assets     12,576       15,657  
    TOTAL ASSETS   $ 27,681     $ 29,090  
    LIABILITIES AND EQUITY            
    Fiduciary liabilities   $ 9,504     $ 9,073  
    Deferred revenue and accrued expenses     2,211       2,104  
    Current debt           650  
    Current lease liabilities     118       125  
    Other current liabilities     793       678  
    Total current liabilities     12,626       12,630  
    Long-term debt     5,309       4,567  
    Liability for pension benefits     615       563  
    Deferred tax liabilities     45       542  
    Provision for liabilities     341       365  
    Long-term lease liabilities     502       592  
    Other non-current liabilities     226       238  
    Total non-current liabilities     7,038       6,867  
    TOTAL LIABILITIES     19,664       19,497  
    COMMITMENTS AND CONTINGENCIES            
    EQUITY(i)            
    Additional paid-in capital     10,989       10,910  
    Retained earnings     109       1,466  
    Accumulated other comprehensive loss, net of tax     (3,158 )     (2,856 )
    Total WTW shareholders’ equity     7,940       9,520  
    Non-controlling interests     77       73  
    Total Equity     8,017       9,593  
    TOTAL LIABILITIES AND EQUITY   $ 27,681     $ 29,090  

    ________________________
    (i)  Equity includes (a) Ordinary shares $0.000304635 nominal value; Authorized 1,510,003,775; Issued 99,805,780 (2024) and 102,538,072 (2023); Outstanding 99,805,780 (2024) and 102,538,072 (2023) and (b) Preference shares, $0.000115 nominal value; Authorized 1,000,000,000 and Issued none in 2024 and 2023.


    WILLIS TOWERS WATSON PUBLIC LIMITED COMPANY
    Condensed Consolidated Statements of Cash Flows
    (In millions of U.S. dollars)
    (Unaudited)
         
        Years Ended December 31, 
        2024    2023 
    CASH FLOWS FROM OPERATING ACTIVITIES            
    NET (LOSS)/INCOME   $ (88 )   $ 1,064  
    Adjustments to reconcile net income to total net cash from operating activities:            
    Depreciation     230       242  
    Amortization     226       263  
    Impairment     1,042        
    Non-cash restructuring charges     41       38  
    Non-cash lease expense     98       105  
    Net periodic benefit of defined benefit pension plans     4       (26 )
    Provision for doubtful receivables from clients     13       6  
    Benefit from deferred income taxes     (213 )     (109 )
    Share-based compensation     121       125  
    Net loss/(gain) on disposal of operations     337       (43 )
    Non-cash foreign exchange (gain)/loss     (31 )     20  
    Other, net     58       31  
    Changes in operating assets and liabilities, net of effects from purchase of subsidiaries:            
    Accounts receivable     (233 )     (206 )
    Other assets     (373 )     (185 )
    Other liabilities     301       16  
    Provisions     (21 )     4  
    Net cash from operating activities     1,512       1,345  
                 
    CASH FLOWS FROM/(USED IN) INVESTING ACTIVITIES            
    Additions to fixed assets and software for internal use     (136 )     (153 )
    Capitalized software costs     (109 )     (89 )
    Acquisitions of operations, net of cash acquired     (107 )     (6 )
    Proceeds from sale of operations     619       89  
    Cash and fiduciary funds transferred in sale of operations     (5 )     (922 )
    Purchase of investments     (12 )     (4 )
    Net cash from/(used in) investing activities     250       (1,085 )
                 
    CASH FLOWS USED IN FINANCING ACTIVITIES            
    Senior notes issued     746       748  
    Debt issuance costs     (9 )     (7 )
    Repayments of debt     (655 )     (254 )
    Repurchase of shares     (901 )     (1,000 )
    Net proceeds/(payments) from fiduciary funds held for clients     785       (234 )
    Payments of deferred and contingent consideration related to acquisitions     (2 )     (12 )
    Cash paid for employee taxes on withholding shares     (56 )     (26 )
    Dividends paid     (354 )     (352 )
    Acquisitions of and dividends paid to non-controlling interests     (13 )     (63 )
    Net cash used in financing activities     (459 )     (1,200 )
                 
    INCREASE/(DECREASE) IN CASH, CASH EQUIVALENTS AND RESTRICTED
       CASH
        1,303       (940 )
    Effect of exchange rate changes on cash, cash equivalents and restricted cash     (97 )     11  
    CASH, CASH EQUIVALENTS AND RESTRICTED CASH, BEGINNING OF
       PERIOD (i)
        3,792       4,721  
    CASH, CASH EQUIVALENTS AND RESTRICTED CASH, END OF PERIOD (i)   $ 4,998     $ 3,792  

    ________________________
    (i)  The amounts of cash, cash equivalents and restricted cash, their respective classification on the condensed consolidated balance sheets, as well as their respective portions of the increase or decrease in cash, cash equivalents and restricted cash for each of the periods presented have been included in the Supplemental Disclosures of Cash Flow Information section.

    SUPPLEMENTAL DISCLOSURES OF CASH FLOW INFORMATION

        Years Ended December 31, 
        2024    2023 
                 
    Supplemental disclosures of cash flow information:            
    Cash and cash equivalents   $ 1,890     $ 1,424  
    Fiduciary funds (included in fiduciary assets)     3,108       2,368  
    Total cash, cash equivalents and restricted cash   $ 4,998     $ 3,792  
                 
    Increase/(decrease) in cash, cash equivalents and other restricted cash   $ 510     $ 163  
    Increase/(decrease) in fiduciary funds     793       (1,103 )
    Total (i)   $ 1,303     $ (940 )

    (i) Does not include the effect of exchange rate changes on cash, cash equivalents and restricted cash.

    The MIL Network

  • MIL-OSI Europe: Minister for Foreign Affairs to visit Copenhagen

    Source: Government of Sweden

    Minister for Foreign Affairs to visit Copenhagen – Government.se

    Please enable javascript in your browser

    Press release from Ministry for Foreign Affairs

    Published

    On 5 February, Minister for Foreign Affairs Maria Malmer Stenergard will travel to Copenhagen for a meeting with Danish Minister for Foreign Affairs Lars Løkke Rasmussen.

    “Sweden and Denmark are close Allies, neighbours and friends. Denmark has just taken over from Sweden as coordinator of the Nordic-Baltic foreign and security policy cooperation format. I look forward to discussing how we can further develop our cooperation to tackle regional and global challenges and advance our positions,” says Ms Malmer Stenergard.

    Topics for the meeting between the foreign ministers will include enhanced regional cooperation, security issues, support to Ukraine and the 25th anniversary of the Öresund Bridge.

    Press contact

    MIL OSI Europe News

  • MIL-OSI China: Pro-Russian paramilitary leader dies in Moscow blast

    Source: China State Council Information Office

    A pro-Russian paramilitary leader from eastern Ukraine, Armen Sarkisyan, has died from his injuries in a blast at a residential building in Moscow, local media reported Monday.

    Sarkisyan was the head of the Donetsk People’s Republic Boxing Federation and founder of the Arbat volunteer battalion.

    One person was killed and four others were injured in the explosion at the entrance of the residential building in Moscow on Monday, the Russian Investigative Committee said.

    The committee later said that one of the injured died in hospital. Local media confirmed that person to be Sarkisyan.

    MIL OSI China News

  • MIL-OSI: RBB Bancorp Reports Fourth Quarter and Fiscal Year 2024 Earnings

    Source: GlobeNewswire (MIL-OSI)

    LOS ANGELES, Feb. 03, 2025 (GLOBE NEWSWIRE) — RBB Bancorp (NASDAQ:RBB) and its subsidiaries, Royal Business Bank (the “Bank”) and RBB Asset Management Company (“RAM”), collectively referred to herein as the “Company,” announced financial results for the quarter and fiscal year ended December 31, 2024.

    Fourth Quarter 2024 Highlights

    • Net income totaled $4.4 million, or $0.25 diluted earnings per share
    • Return on average assets of 0.44%, compared to 0.72% for the quarter ended September 30, 2024
    • Net interest margin of 2.76% compared to 2.68% for the quarter ended September 30, 2024
    • Book value and tangible book value per share(1) of $28.66 and $24.51 at December 31, 2024, compared to $28.81 and $24.64 at September 30, 2024

    The Company reported net income of $4.4 million, or $0.25 diluted earnings per share, for the quarter ended December 31, 2024, compared to net income of $7.0 million, or $0.39 diluted earnings per share, for the quarter ended September 30, 2024. Net income for the year ended December 31, 2024 totaled $26.7 million, or $1.47 diluted earnings per share, compared to net income of $42.5 million, or $2.24 diluted earnings per share, for the year ended December 31, 2023.

    “Declining funding costs and stable interest income drove net interest income and net interest margin higher in the fourth quarter,” said Johnny Lee, President of the Company and President and Chief Executive Officer of the Bank. “We continue to make good progress on our growth initiatives and expect we will resume loan growth in the first quarter and for the remainder of the year.  We did see an increase in nonperforming loans mainly due to one credit relationship that was downgraded late in the fourth quarter.  We are actively working to resolve our nonperforming loans as quickly as possible while minimizing the impact to earnings and capital.”

    “We are saddened by the devastation caused by the recent fires in Los Angeles,” said David Morris, Chief Executive Officer of the Company. “We stand ready to support our community and neighbors as they begin the process of rebuilding.”

    (1) Reconciliations of the non–U.S. generally accepted accounting principles (“GAAP”) measures included at the end of this press release.
       

    Net Interest Income and Net Interest Margin

    Net interest income was $26.0 million for the fourth quarter of 2024, compared to $24.5 million for the third quarter of 2024. The $1.4 million increase was due to a $130,000 increase in interest income and a $1.3 million decrease in interest expense. The increase in interest income was mostly due to higher interest income on cash and investment securities of $1.1 million offset by lower interest income on total loans of $952,000. The decrease in loan interest income was mostly due to lower average loans of $9.8 million and a 10 basis point decrease in the average loan yield due to decreases in market rates and a change in the loan mix. The increase in cash and investment interest income was attributed to higher average balances and a higher investment portfolio yield, offset by a lower yield on cash. The decrease in interest expense was mostly due to a 33 basis point decrease in total average interest-bearing deposit rates offset by higher average interest-bearing deposits of $33.8 million in the fourth quarter of 2024.

    Net interest margin (“NIM”) was 2.76% for the fourth quarter of 2024, an increase of 8 basis points from 2.68% for the third quarter of 2024. The increase was due to a 25 basis point decrease in the overall cost of funds, partially offset by a 15 basis point decrease in the yield on average interest-earning assets. The yield on average interest-earning assets decreased to 5.79% for the fourth quarter of 2024 from 5.94% for the third quarter of 2024 due mainly to a 55 basis point decrease in the yield on average cash and cash equivalents to 5.02%, a decrease in the loan yield of 10 basis points and the impact of a change in the mix of average-earnings assets. Average loans represented 82% of average interest-earning assets in the fourth quarter of 2024, a 2% decrease from the third quarter of 2024. The decrease in the loan yield was attributed mostly to a decrease in market rates and a change in the loan mix. 

    The overall cost of funds decreased to 3.32% in the fourth quarter of 2024 from 3.57% in the third quarter of 2024 due to a lower average cost of interest-bearing deposits. The overall funding mix for the fourth quarter of 2024 remained relatively unchanged from the third quarter of 2024 with the ratio of average noninterest-bearing deposits to average total funding sources of 16%. The all-in average spot rate for total deposits was 3.15% at December 31, 2024.

    Net interest income was $99.4 million for the year ended December 31, 2024, compared to $119.3 million for the year ended December 31, 2023. The $19.9 million decrease was due to a $15.4 million increase in interest expense and a $4.5 million decrease in interest income. The decrease in interest income was mostly due to lower interest income on total loans of $9.7 million offset by higher interest income on interest-earning deposits of $4.7 million. The decrease in loan interest income was mostly due to lower average loans of $164.3 million. The increase in cash and investment interest income was attributed to higher average cash balances and a higher investment portfolio yield, offset by a lower average of investment securities. The increase in interest expense was mostly due to a 72 basis point increase in total average interest-bearing deposit rates and higher average interest-bearing deposits of $30.1 million in the year ended December 31, 2024.

    NIM was 2.70% for the year ended December 31, 2024, a decrease of 46 basis points from 3.16% for the year ended December 31, 2023. The decrease was due to a 55 basis point increase in the overall cost of funds, partially offset by a 2 basis point increase in the yield on average interest-earning assets. The yield on average interest-earning assets increased to 5.88% for the year ended December 31, 2024 compared to the prior year due mainly to a 12 basis point increase in the yield on average cash and cash equivalents to 5.53%, an 18 basis point increase in the investment portfolio yield, offset by the impact of lower average loan balances. Average loans represented 83% of average interest-earning assets during 2024, and 85% during 2023.

    The overall cost of funds increased to 3.49% in the year ended December 31, 2024 from 2.94% in the year ended December 31, 2023 due to a higher average cost of interest-bearing deposits in response to higher average market interest rates. The overall funding mix for December 31, 2024 remained relatively unchanged from the prior year with a ratio of average noninterest-bearing deposits to average total funding sources of 16%.

    Provision for Credit Losses

    The provision for credit losses was $6.0 million for the fourth quarter of 2024 compared to $3.3 million for the third quarter of 2024. The fourth quarter of 2024 provision for credit losses was due to an increase in specific reserves of $4.3 million and net charge-offs of $2.0 million, partially offset by lower general reserves. The fourth quarter increase in specific reserves included $4.5 million for a construction loan secured by a partially completed mixed-use commercial project. Fourth quarter net charge-offs included $1.8 million for nonaccrual loans that were moved to held for sale (“HFS”). Net charge-offs on an annualized basis represented 0.26% of average loans for the fourth quarter of 2024 compared to 0.16% for the third quarter of 2024. The fourth quarter provision also took into consideration factors such as changes in loan balances, the loan portfolio mix, the outlook for economic conditions and market interest rates, and changes in credit quality metrics, including higher nonperforming loans, and changes in special mention and substandard loans during the period.

    The provision for credit losses was $9.9 million for the year ended December 31, 2024 compared to $3.4 million for the year ended December 31, 2023. The 2024 provision included the impact from an increase in specific reserves of $6.1 million and net charge-offs of $3.9 million. Net charge-offs totaled $3.9 million for the year ended December 31, 2024, compared to $3.1 million for the year ended December 31, 2023. Net charge-offs represented 0.13% of average loans for the fiscal year 2024 compared to 0.10% for the fiscal year 2023.

    Noninterest Income

    Noninterest income for the fourth quarter of 2024 was $2.7 million, a decrease of $3.0 million from $5.7 million for the third quarter of 2024. This decrease was mostly due to the third quarter of 2024 including a $2.8 million recovery of a fully charged off loan acquired in a bank acquisition.

    Noninterest income for the year ended December 31, 2024 was $15.3 million, an increase of $317,000 from $15.0 million for the year ended December 31, 2023. This increase was mostly due to a $2.9 million increase in recoveries on purchased loans, a $1.2 million increase in gain on sale of loans and an $883,000 increase in gain on OREO, offset by income from a $5.0 million Community Development Financial Institution Equitable Recovery Program award that was recognized during 2023.

    Noninterest Expense

    Noninterest expense for the fourth quarter of 2024 was $17.6 million, an increase of $228,000 from $17.4 million for the third quarter of 2024. This increase was mostly due to higher legal and professional expenses of $397,000, partially offset by lower occupancy and equipment expenses of $115,000. The annualized noninterest expenses to average assets ratio was 1.76% for the fourth quarter of 2024, down from 1.78% for the third quarter of 2024. The efficiency ratio was 61.5% for the fourth quarter of 2024, up from 57.5% for the third quarter of 2024 due mostly to lower noninterest income as the third quarter included a $2.8 million recovery of a fully charged off loan acquired in a bank acquisition.

    Noninterest expense for the year ended December 31, 2024 was $69.2 million, a decrease of $1.5 million from $70.7 million for the year ended December 31, 2023. This decrease was mostly due to lower legal and professional expenses of $3.7 million, partially offset by higher salaries and employee benefits of $1.6 million. The noninterest expenses to average assets ratio was 1.76% for the fiscal year 2024 and 2023. The efficiency ratio was 60.3% for the year ended December 31, 2024, up from 52.6% for the year ended December 31, 2023 due mostly to lower net interest income for 2024.

    Income Taxes

    The effective tax rate was 13.3% for the fourth quarter of 2024 and 26.9% for the third quarter of 2024. The decrease in the effective tax rate for the fourth quarter was due primarily to higher tax credits relative to pre-tax net income as compared to the prior quarter.

    The effective tax rate was 25.3% for the year ended December 31, 2024 and 29.5% for the year ended December 31, 2023. The decrease in the effective tax rate for 2024 was due primarily to higher tax credits as compared to the prior year.

    Balance Sheet

    At December 31, 2024, total assets were $4.0 billion, a $2.0 million increase compared to September 30, 2024, and a $33.5 million decrease compared to December 31, 2023.

    Loan and Securities Portfolio

    Loans held for investment (“HFI”) totaled $3.1 billion as of December 31, 2024, a decrease of $38.7 million compared to September 30, 2024 and a $21.4 million increase compared to December 31, 2023. The decrease from September 30, 2024 was primarily due to a $51.3 million decrease in commercial real estate (“CRE”) loans, a $6.9 million decrease in construction and land development (“C&D”) loans and an $826,000 decrease in Small Business Administration (“SBA”) loans, partially offset by a $20.6 million increase in single-family residential (“SFR”) mortgages and a $724,000 increase in commercial and industrial (“C&I”) loans. The loan to deposit ratio was 97.5% at December 31, 2024, compared to 98.6% at September 30, 2024 and 94.2% at December 31, 2023. 

    As of December 31, 2024, available-for-sale securities totaled $420.2 million, an increase of $114.5 million from September 30, 2024, primarily related to the purchase of $79.2 million in short-term commercial paper. As of December 31, 2024, net unrealized losses totaled $29.2 million, a $6.0 million increase due mostly to increases in treasury rates, when compared to net unrealized losses of $23.2 million as of September 30, 2024.

    Deposits

    Total deposits were $3.1 billion as of December 31, 2024, an $8.4 million decrease compared to September 30, 2024 and a $91.0 million decrease compared to December 31, 2023. The decrease during the fourth quarter of 2024 was due to a $27.8 million decrease in interest-bearing deposits, while noninterest-bearing deposits increased $19.4 million to $563.0 million as of December 31, 2024 compared to $543.6 million as of September 30, 2024. The decrease in interest-bearing deposits included a decrease in time deposits of $24.7 million and non-maturity deposits of $3.1 million. Wholesale deposits remained relatively unchanged at $147.5 million at December 31, 2024 compared to $147.3 million at September 30, 2024. Noninterest-bearing deposits represented 18.3% of total deposits at December 31, 2024 compared to 17.6% at September 30, 2024.

    Credit Quality

    Nonperforming assets totaled $81.0 million, or 2.03% of total assets, at December 31, 2024, compared to $60.7 million, or 1.52% of total assets, at September 30, 2024. The $20.4 million increase in nonperforming assets was due to the addition of one $26.4 million C&D loan, $2.0 million in SFR loans and $890,000 in SBA loans that migrated to nonaccrual status during the fourth quarter of 2024, partially offset by payoffs and paydowns of $6.7 million and partial charge-offs of $2.0 million.

    Nonperforming assets at December 31, 2024 include loans HFS with a total fair value of $11.2 million, which were transferred from HFI during the fourth quarter of 2024 after a $1.8 million charge-off against the allowance for credit losses. These loans were reported as nonperforming loans at September 30, 2024.

    Special mention loans totaled $65.3 million, or 2.14% of total loans, at December 31, 2024, compared to $77.5 million, or 2.51% of total loans, at September 30, 2024. The $12.2 million decrease was primarily due to CRE loans totaling $11.8 million that were upgraded to pass-rated and $1.8 million in payoffs and paydowns, offset by CRE loans totaling $1.4 million downgraded during the fourth quarter of 2024. All special mention loans are paying current.

    Substandard loans totaled $100.3 million, of which $11.2 million were HFS at December 31, 2024, compared to $79.8 million at September 30, 2024. This $20.5 million increase was primarily due to downgrades of one $26.4 million C&D loan, SFR loans totaling $2.0 million, C&I loans totaling $1.9 million and SBA loans totaling $747,000. These downgrades were offset by payoffs and paydowns totaling $6.5 million, upgrades totaling $2.0 million and partial charge-offs totaling $2.0 million. Of the total substandard loans at December 31, 2024, there are $19.3 million on accrual status, including an $11.7 million C&D loan that was in the process of renewal and also included in the 30-89 day delinquent category below.

    30-89 day delinquent loans, excluding nonperforming loans, totaled $22.1 million at December 31, 2024, compared to $10.6 million at September 30, 2024. The $11.5 million increase was mostly due to one $11.7 million C&D loan in process of renewal for a completed multifamily project at December 31, 2024, and since year end, it has been brought current and paid down by $1.5 million. Other changes in delinquent loans included additions totaling $5.5 million, offset by $3.2 million that returned to current status, $1.8 million that migrated to nonaccrual status and $735,000 in payoffs.

    As of December 31, 2024, the allowance for credit losses totaled $48.5 million and was comprised of an allowance for loan losses of $47.7 million and a reserve for unfunded commitments of $729,000 (included in “Accrued interest and other liabilities”). This compares to the allowance for credit losses of $44.5 million comprised of an allowance for loan losses of $43.7 million and a reserve for unfunded commitments of $779,000 at September 30, 2024. The $4.0 million increase in the allowance for credit losses for the fourth quarter of 2024 was due to a $6.0 million provision for credit losses offset by net charge-offs of $2.0 million. The increase in charge-offs in the fourth quarter of 2024 was primarily due to a decrease in the estimated fair value of collateral dependent loans and loans moved to HFS. The allowance for loan losses as a percentage of loans HFI increased to 1.56% at December 31, 2024, compared to 1.41% at September 30, 2024, due to an increase in specific reserves on one C&D loan mentioned previously. The allowance for loan losses as a percentage of nonperforming loans HFI was 68% at December 31, 2024, a decrease from 72% at September 30, 2024.

               
      For the Three Months Ended December 31, 2024     For the Year Ended December 31, 2024  
    (dollars in thousands) Allowance for loan losses     Reserve for unfunded loan commitments     Allowance for credit losses     Allowance for loan losses     Reserve for unfunded loan commitments   Allowance for credit losses  
    Beginning balance $ 43,685     $ 779     $ 44,464     $ 41,903     $ 640   $ 42,543  
    Provision for (reversal of) credit losses   6,050       (50 )     6,000       9,768       89     9,857  
    Less loans charged-off   (2,092 )           (2,092 )     (4,083 )         (4,083 )
    Recoveries on loans charged-off   86             86       141           141  
    Ending balance $ 47,729     $ 729     $ 48,458     $ 47,729     $ 729   $ 48,458  
                                                 

    Shareholders’ Equity

    At December 31, 2024, total shareholders’ equity was $507.9 million, a $1.9 million decrease compared to September 30, 2024, and a $3.4 million decrease compared to December 31, 2023. The decrease in shareholders’ equity for the fourth quarter of 2024 was due to higher net unrealized losses on available-for-sale securities of $4.2 million and common stock cash dividends paid of $2.9 million, offset by net income of $4.4 million, and equity compensation activity of $794,000. The decrease in shareholders’ equity for the year ended 2024 was due to common stock repurchases of $20.7 million, common stock cash dividends paid of $11.7 million and higher net unrealized losses on available-for-sale securities of $744,000, offset by net income of $26.7 million, and equity compensation activity of $3.1 million. Book value per share and tangible book value per share(1) decreased to $28.66 and $24.51 at December 31, 2024, down from $28.81 and $24.64 at September 30, 2024 and up from $27.47 and $23.48 at December 31, 2023.

    Contact:
    Lynn Hopkins, Chief Financial Officer
    (213) 716-8066
    lhopkins@rbbusa.com

    (1) Reconciliations of the non–U.S. generally accepted accounting principles (“GAAP”) measures included at the end of this press release.
       

    Corporate Overview

    RBB Bancorp is a community-based financial holding company headquartered in Los Angeles, California. As of December 31, 2024, the Company had total assets of $4.0 billion. Its wholly-owned subsidiary, Royal Business Bank, is a full service commercial bank, which provides consumer and business banking services predominately to the Asian-centric communities in Los Angeles County, Orange County, and Ventura County in California, in Las Vegas, Nevada, in Brooklyn, Queens, and Manhattan in New York, in Edison, New Jersey, in the Chicago neighborhoods of Chinatown and Bridgeport, Illinois, and on Oahu, Hawaii. Bank services include remote deposit, E-banking, mobile banking, commercial and investor real estate loans, business loans and lines of credit, commercial and industrial loans, SBA 7A and 504 loans, 1-4 single family residential loans, trade finance, a full range of depository account products and wealth management services. The Bank has nine branches in Los Angeles County, two branches in Ventura County, one branch in Orange County, California, one branch in Las Vegas, Nevada, three branches and one loan operation center in Brooklyn, three branches in Queens, one branch in Manhattan in New York, one branch in Edison, New Jersey, two branches in Chicago, Illinois, and one branch in Honolulu, Hawaii. The Company’s administrative and lending center is located at 1055 Wilshire Blvd., Los Angeles, California 90017, and its operations center is located at 7025 Orangethorpe Ave., Buena Park, California 90621. The Company’s website address is www.royalbusinessbankusa.com.

    Conference Call

    Management will hold a conference call at 11:00 a.m. Pacific time/2:00 p.m. Eastern time on Tuesday, February 4, 2025, to discuss the Company’s fourth quarter 2024 financial results.

    To listen to the conference call, please dial 1-888-506-0062 or 1-973-528-0011, the Participant ID code is 834092, conference ID RBBQ424. A replay of the call will be made available at 1-877-481-4010 or 1-919-882-2331, the passcode is 51830, approximately one hour after the conclusion of the call and will remain available through February 5, 2025.

    The conference call will also be simultaneously webcast over the Internet; please visit our Royal Business Bank website at www.royalbusinessbankusa.com and click on the “Investors” tab to access the call from the site. This webcast will be recorded and available for replay on our website approximately two hours after the conclusion of the conference call.

    Disclosure

    This press release contains certain non-GAAP financial disclosures for tangible common equity and tangible assets and adjusted earnings. The Company uses certain non-GAAP financial measures to provide meaningful supplemental information regarding the Company’s operational performance and to enhance investors’ overall understanding of such financial performance. Please refer to the tables at the end of this release for a presentation of performance ratios in accordance with GAAP and a reconciliation of the non-GAAP financial measures to the GAAP financial measures.

    Safe Harbor

    Certain matters set forth herein (including the exhibits hereto) constitute forward-looking statements relating to the Company’s current business plans and expectations and our future financial position and operating results. These forward-looking statements are subject to risks and uncertainties that could cause actual results, performance and/or achievements to differ materially from those projected. These risks and uncertainties include, but are not limited to, the effectiveness of the Companys internal control over financial reporting and disclosure controls and procedures; the potential for additional material weaknesses in the Companys internal controls over financial reporting or other potential control deficiencies of which the Company is not currently aware or which have not been detected; business and economic conditions generally and in the financial services industry, nationally and within our current and future geographic markets, including the tight labor market, ineffective management of the United States (U.S.) federal budget or debt or turbulence or uncertainly in domestic or foreign financial markets; the strength of the U.S. economy in general and the strength of the local economies in which we conduct operations; adverse developments in the banking industry highlighted by high-profile bank failures and the potential impact of such developments on customer confidence, liquidity and regulatory responses to these developments; our ability to attract and retain deposits and access other sources of liquidity; possible additional provisions for credit losses and charge-offs; credit risks of lending activities and deterioration in asset or credit quality; extensive laws and regulations and supervision that we are subject to, including potential supervisory action by bank supervisory authorities; increased costs of compliance and other risks associated with changes in regulation, including any amendments to the Dodd-Frank Wall Street Reform and Consumer Protection Act; compliance with the Bank Secrecy Act and other money laundering statutes and regulations; potential goodwill impairment; liquidity risk; failure to comply with debt covenants; fluctuations in interest rates; risks associated with acquisitions and the expansion of our business into new markets; inflation and deflation; real estate market conditions and the value of real estate collateral; the effects of having concentrations in our loan portfolio, including commercial real estate and the risks of geographic and industry concentrations; environmental liabilities; our ability to compete with larger competitors; our ability to retain key personnel; successful management of reputational risk; severe weather, natural disasters, earthquakes, fires, including direct and indirect costs and impacts on clients, the Company and its employees from the January 2025 Los Angeles County wildfires; or other adverse external events could harm our business; geopolitical conditions, including acts or threats of terrorism, actions taken by the U.S. or other governments in response to acts or threats of terrorism and/or military conflicts, including the conflicts between Russia and Ukraine, in the Middle East, and increasing tensions between China and Taiwan, which could impact business and economic conditions in the U.S. and abroad; public health crises and pandemics, and their effects on the economic and business environments in which we operate, including our credit quality and business operations, as well as the impact on general economic and financial market conditions; general economic or business conditions in Asia, and other regions where the Bank has operations; failures, interruptions, or security breaches of our information systems; climate change, including any enhanced regulatory, compliance, credit and reputational risks and costs; cybersecurity threats and the cost of defending against them; our ability to adapt our systems to the expanding use of technology in banking; risk management processes and strategies; adverse results in legal proceedings; the impact of regulatory enforcement actions, if any; certain provisions in our charter and bylaws that may affect acquisition of the Company; changes in tax laws and regulations; the impact of governmental efforts to restructure the U.S. financial regulatory system; the impact of future or recent changes in the Federal Deposit Insurance Corporation (“FDIC”) insurance assessment rate and the rules and regulations related to the calculation of the FDIC insurance assessments; the effect of changes in accounting policies and practices or accounting standards, as may be adopted from time-to-time by bank regulatory agencies, the SEC, the Public Company Accounting Oversight Board, the Financial Accounting Standards Board or other accounting standards setters, including Accounting Standards Update 2016-13 (Topic 326, “Measurement of Current Losses on Financial Instruments, commonly referenced as the Current Expected Credit Losses Model, which changed how we estimate credit losses and may further increase the required level of our allowance for credit losses in future periods; market disruption and volatility; fluctuations in the Company’s stock price; restrictions on dividends and other distributions by laws and regulations and by our regulators and our capital structure; issuances of preferred stock; our ability to raise additional capital, if needed, and the potential resulting dilution of interests of holders of our common stock; the soundness of other financial institutions; our ongoing relations with our various federal and state regulators, including the SEC, FDIC, FRB and California Department of Financial Protection and Innovation; our success at managing the risks involved in the foregoing items and all other factors set forth in the Company’s public reports, including its Annual Report as filed under Form 10-K for the year ended December 31, 2023, and particularly the discussion of risk factors within that document. The Company does not undertake, and specifically disclaims any obligation, to update any forward-looking statements to reflect occurrences or unanticipated events or circumstances after the date of such statements except as required by law. Any statements about future operating results, such as those concerning accretion and dilution to the Company’s earnings or shareholders, are for illustrative purposes only, are not forecasts, and actual results may differ.

                                 
    RBB BANCORP AND SUBSIDIARIES
    CONDENSED CONSOLIDATED BALANCE SHEETS
    (Unaudited)
    (Dollars in thousands)
                                 
      December 31,     September 30,     June 30,     March 31,     December 31,  
      2024     2024     2024     2024     2023  
    Assets                                      
    Cash and due from banks $ 27,747     $ 26,388     $ 23,313     $ 21,887     $ 22,671  
    Interest-earning deposits with financial institutions   229,998       323,002       229,456       247,356       408,702  
    Cash and cash equivalents   257,745       349,390       252,769       269,243       431,373  
    Interest-earning time deposits with financial institutions   600       600       600       600       600  
    Investment securities available for sale   420,190       305,666       325,582       335,194       318,961  
    Investment securities held to maturity   5,191       5,195       5,200       5,204       5,209  
    Loans held for sale   11,250       812       3,146       3,903       1,911  
    Loans held for investment   3,053,230       3,091,896       3,047,712       3,027,361       3,031,861  
    Allowance for loan losses   (47,729 )     (43,685 )     (41,741 )     (41,688 )     (41,903 )
    Net loans held for investment   3,005,501       3,048,211       3,005,971       2,985,673       2,989,958  
    Premises and equipment, net   24,601       24,839       25,049       25,363       25,684  
    Federal Home Loan Bank (FHLB) stock   15,000       15,000       15,000       15,000       15,000  
    Cash surrender value of bank owned life insurance   60,296       59,889       59,486       59,101       58,719  
    Goodwill   71,498       71,498       71,498       71,498       71,498  
    Servicing assets   6,985       7,256       7,545       7,794       8,110  
    Core deposit intangibles   2,011       2,194       2,394       2,594       2,795  
    Right-of-use assets   28,048       29,283       30,530       31,231       29,803  
    Accrued interest and other assets   83,561       70,644       63,416       65,608       66,404  
    Total assets $ 3,992,477     $ 3,990,477     $ 3,868,186     $ 3,878,006     $ 4,026,025  
    Liabilities and shareholders’ equity                                      
    Deposits:                                      
    Noninterest-bearing demand $ 563,012     $ 543,623     $ 542,971     $ 539,517     $ 539,621  
    Savings, NOW and money market accounts   663,034       666,089       647,770       642,840       632,729  
    Time deposits, $250,000 and under   1,007,452       1,052,462       1,014,189       1,083,898       1,190,821  
    Time deposits, greater than $250,000   850,291       830,010       818,675       762,074       811,589  
    Total deposits   3,083,789       3,092,184       3,023,605       3,028,329       3,174,760  
    FHLB advances   200,000       200,000       150,000       150,000       150,000  
    Long-term debt, net of issuance costs   119,529       119,433       119,338       119,243       119,147  
    Subordinated debentures   15,156       15,102       15,047       14,993       14,938  
    Lease liabilities – operating leases   29,705       30,880       32,087       32,690       31,191  
    Accrued interest and other liabilities   36,421       23,150       16,818       18,765       24,729  
    Total liabilities   3,484,600       3,480,749       3,356,895       3,364,020       3,514,765  
    Shareholders’ equity:                                      
    Common stock   259,957       259,280       266,160       271,645       271,925  
    Additional paid-in capital   3,645       3,520       3,456       3,348       3,623  
    Retained earnings   264,460       262,946       262,518       259,903       255,152  
    Non-controlling interest   72       72       72       72       72  
    Accumulated other comprehensive loss, net   (20,257 )     (16,090 )     (20,915 )     (20,982 )     (19,512 )
    Total shareholders’ equity   507,877       509,728       511,291       513,986       511,260  
    Total liabilities and shareholders’ equity $ 3,992,477     $ 3,990,477     $ 3,868,186     $ 3,878,006     $ 4,026,025  


    RBB BANCORP AND SUBSIDIARIES
    CONDENSED CONSOLIDATED STATEMENTS OF INCOME
    (Unaudited)
    (In thousands, except share and per share data) 
             
      For the Three Months Ended     For the Year Ended
      December 31, 2024   September 30, 2024   December 31, 2023     December 31, 2024   December 31, 2023
    Interest and dividend income:                              
    Interest and fees on loans $ 46,374   $ 47,326   $ 45,895     $ 184,567   $ 194,264
    Interest on interest-earning deposits   3,641     3,388     4,650       15,422     10,746
    Interest on investment securities   3,962     3,127     3,706       14,331     14,028
    Dividend income on FHLB stock   330     326     312       1,314     1,125
    Interest on federal funds sold and other   248     258     269       1,027     985
    Total interest and dividend income   54,555     54,425     54,832       216,661     221,148
    Interest expense:                              
    Interest on savings deposits, NOW and money market accounts   4,671     5,193     4,026       19,295     12,205
    Interest on time deposits   21,361     22,553     22,413       89,086     76,837
    Interest on long-term debt and subordinated debentures   1,660     1,681     2,284       6,699     9,951
    Interest on FHLB advances   886     453     440       2,217     2,869
    Total interest expense   28,578     29,880     29,163       117,297     101,862
    Net interest income before provision for credit losses   25,977     24,545     25,669       99,364     119,286
    Provision for (reversal of) credit losses   6,000     3,300     (431 )     9,857     3,362
    Net interest income after provision for (reversal of) credit losses   19,977     21,245     26,100       89,507     115,924
    Noninterest income:                              
    Service charges and fees   988     1,071     972       4,115     4,172
    Gain on sale of loans   376     447     116       1,586     374
    Loan servicing fees, net of amortization   492     605     616       2,265     2,576
    Increase in cash surrender value of life insurance   407     403     374       1,577     1,409
    (Loss) gain on OREO           (57 )     1,016     133
    Other income   466     3,220     5,373       4,776     6,354
    Total noninterest income   2,729     5,746     7,394       15,335     15,018
    Noninterest expense:                              
    Salaries and employee benefits   9,927     10,008     8,860       39,395     37,795
    Occupancy and equipment expenses   2,403     2,518     2,387       9,803     9,629
    Data processing   1,499     1,472     1,357       5,857     5,326
    Legal and professional   1,355     958     1,291       4,453     8,198
    Office expenses   399     348     349       1,455     1,512
    Marketing and business promotion   251     252     241       864     1,132
    Insurance and regulatory assessments   677     658     1,122       3,298     3,165
    Core deposit premium   182     200     215       784     923
    Other expenses   956     1,007     571       3,254     3,016
    Total noninterest expense   17,649     17,421     16,393       69,163     70,696
    Income before income taxes   5,057     9,570     17,101       35,679     60,246
    Income tax expense   672     2,571     5,028       9,014     17,781
    Net income $ 4,385   $ 6,999   $ 12,073     $ 26,665   $ 42,465
                                   
    Net income per share                              
    Basic $ 0.25   $ 0.39   $ 0.64     $ 1.47   $ 2.24
    Diluted $ 0.25   $ 0.39   $ 0.64     $ 1.47   $ 2.24
    Cash dividends declared per common share $ 0.16   $ 0.16   $ 0.16     $ 0.64   $ 0.64
    Weighted-average common shares outstanding                              
    Basic   17,704,992     17,812,791     18,887,501       18,121,764     18,965,346
    Diluted   17,796,840     17,885,359     18,900,351       18,183,319     18,985,233


    RBB BANCORP AND SUBSIDIARIES
    AVERAGE BALANCE SHEET AND NET INTEREST INCOME
    (Unaudited)
         
      For the Three Months Ended  
      December 31, 2024     September 30, 2024     December 31, 2023  
     (tax-equivalent basis, dollars in thousands) Average   Interest   Yield /     Average   Interest   Yield /     Average   Interest   Yield /  
    Balance   & Fees   Rate     Balance   & Fees   Rate     Balance   & Fees   Rate  
    Interest-earning assets                                                    
    Cash and cash equivalents (1) $ 308,455   $ 3,890   5.02 %   $ 260,205   $ 3,646   5.57 %   $ 333,940   $ 4,919   5.84 %
    FHLB Stock   15,000     330   8.75 %     15,000     326   8.65 %     15,000     312   8.25 %
    Securities                                                    
    Available for sale (2)   361,253     3,939   4.34 %     298,948     3,105   4.13 %     329,426     3,684   4.44 %
    Held to maturity (2)   5,194     48   3.68 %     5,198     46   3.52 %     5,212     46   3.50 %
    Total loans   3,059,786     46,374   6.03 %     3,069,578     47,326   6.13 %     3,055,232     45,895   5.96 %
    Total interest-earning assets   3,749,688   $ 54,581   5.79 %     3,648,929   $ 54,449   5.94 %     3,738,810   $ 54,856   5.82 %
    Total noninterest-earning assets   244,609                 242,059                 253,385            
    Total average assets $ 3,994,297               $ 3,890,988               $ 3,992,195            
                                                         
    Interest-bearing liabilities                                                    
    NOW   53,879     254   1.88 %   $ 55,757   $ 277   1.98 %   $ 54,378   $ 214   1.56 %
    Money market   463,850     3,735   3.20 %     439,936     4,093   3.70 %     422,582     3,252   3.05 %
    Saving deposits   162,351     682   1.67 %     164,515     823   1.99 %     148,354     560   1.50 %
    Time deposits, $250,000 and under   1,034,946     11,583   4.45 %     1,037,365     12,312   4.72 %     1,162,014     13,244   4.52 %
    Time deposits, greater than $250,000   835,583     9,778   4.66 %     819,207     10,241   4.97 %     781,833     9,169   4.65 %
    Total interest-bearing deposits   2,550,609     26,032   4.06 %     2,516,780     27,746   4.39 %     2,569,161     26,439   4.08 %
    FHLB advances   200,000     886   1.76 %     150,543     453   1.20 %     150,000     440   1.16 %
    Long-term debt   119,466     1,295   4.31 %     119,370     1,295   4.32 %     155,536     1,895   4.83 %
    Subordinated debentures   15,121     365   9.60 %     15,066     386   10.19 %     14,902     389   10.36 %
    Total interest-bearing liabilities   2,885,196     28,578   3.94 %     2,801,759     29,880   4.24 %     2,889,599     29,163   4.00 %
    Noninterest-bearing liabilities                                                    
    Noninterest-bearing deposits   539,900                 528,081                 535,554            
    Other noninterest-bearing liabilities   56,993                 52,428                 61,858            
    Total noninterest-bearing liabilities   596,893                 580,509                 597,412            
    Shareholders’ equity   512,208                 508,720                 505,184            
    Total liabilities and shareholders’ equity $ 3,994,297               $ 3,890,988               $ 3,992,195            
    Net interest income / interest rate spreads       $ 26,003   1.85 %         $ 24,569   1.70 %         $ 25,693   1.82 %
    Net interest margin             2.76 %               2.68 %               2.73 %
                                                         
    Total cost of deposits $ 3,090,509   $ 26,032   3.35 %   $ 3,044,861   $ 27,746   3.63 %   $ 3,104,715   $ 26,439   3.38 %
    Total cost of funds $ 3,425,096   $ 28,578   3.32 %   $ 3,329,840   $ 29,880   3.57 %   $ 3,425,153   $ 29,163   3.38 %
                                                         

    ____________________

    (1) Includes income and average balances for interest-earning time deposits and other miscellaneous interest-earning assets.
    (2) Interest income and average rates for tax-exempt securities are presented on a tax-equivalent basis.
    (3) Average loan balances include nonaccrual loans. Interest income on loans includes the effects of discount accretion and net deferred loan origination fees and costs accounted for as yield adjustments.
       
         
    RBB BANCORP AND SUBSIDIARIES
    AVERAGE BALANCE SHEET AND NET INTEREST INCOME
    (Unaudited)
         
      For the Year Ended  
      December 31, 2024     December 31, 2023  
     (tax-equivalent basis, dollars in thousands) Average   Interest   Yield /     Average   Interest   Yield /  
    Balance   & Fees   Rate     Balance   & Fees   Rate  
    Interest-earning assets                                  
    Cash and cash equivalents (1) $ 297,331   $ 16,449   5.53 %   $ 216,851   $ 11,731   5.41 %
    FHLB Stock   15,000     1,314   8.76 %     15,000     1,125   7.50 %
    Securities                                  
    Available for sale (2)   324,644     14,242   4.39 %     331,357     13,928   4.20 %
    Held to maturity (2)   5,200     188   3.62 %     5,509     198   3.59 %
    Total loans   3,041,337     184,567   6.07 %     3,205,625     194,264   6.06 %
    Total interest-earning assets   3,683,512   $ 216,760   5.88 %     3,774,342   $ 221,246   5.86 %
    Total noninterest-earning assets   243,258                 246,980            
    Total average assets $ 3,926,770               $ 4,021,322            
                                       
    Interest-bearing liabilities                                  
    NOW $ 56,158     1,105   1.97 %   $ 58,191   $ 725   1.25 %
    Money market   436,925     15,231   3.49 %     429,102     10,565   2.46 %
    Saving deposits   162,243     2,959   1.82 %     126,062     915   0.73 %
    Time deposits, $250,000 and under   1,074,291     50,059   4.66 %     1,146,513     47,150   4.11 %
    Time deposits, greater than $250,000   803,187     39,027   4.86 %     742,839     29,687   4.00 %
    Total interest-bearing deposits   2,532,804     108,381   4.28 %     2,502,707     89,042   3.56 %
    FHLB advances   162,705     2,217   1.36 %     172,219     2,869   1.67 %
    Long-term debt   119,324     5,182   4.34 %     169,182     8,477   5.01 %
    Subordinated debentures   15,039     1,517   10.09 %     14,821     1,474   9.95 %
    Total interest-bearing liabilities   2,829,872     117,297   4.14 %     2,858,929     101,862   3.56 %
    Noninterest-bearing liabilities                                  
    Noninterest-bearing deposits   531,458                 602,291            
    Other noninterest-bearing liabilities   53,970                 59,562            
    Total noninterest-bearing liabilities   585,428                 661,853            
    Shareholders’ equity   511,470                 500,540            
    Total liabilities and shareholders’ equity $ 3,926,770               $ 4,021,322            
    Net interest income / interest rate spreads       $ 99,463   1.74 %         $ 119,384   2.30 %
    Net interest margin             2.70 %               3.16 %
                                       
    Total cost of deposits $ 3,064,262   $ 108,381   3.54 %   $ 3,104,998   $ 89,042   2.87 %
    Total cost of funds $ 3,361,330   $ 117,297   3.49 %   $ 3,461,220   $ 101,862   2.94 %
                                       

    ____________________

    (1) Includes income and average balances for interest-earning time deposits and other miscellaneous interest-earning assets.
    (2) Interest income and average rates for tax-exempt securities are presented on a tax-equivalent basis.
    (3) Average loan balances include nonaccrual loans. Interest income on loans includes the effects of discount accretion and net deferred loan origination fees and costs accounted for as yield adjustments.
       
               
    RBB BANCORP AND SUBSIDIARIES
    SELECTED FINANCIAL HIGHLIGHTS
    (Unaudited)
               
      At or for the Three Months Ended     At or for the Year Ended December 31,  
      December 31,   September 30,     December 31,                  
        2024     2024     2023     2024     2023  
    Per share data (common stock)                                  
    Book value $ 28.66     $ 28.81     $ 27.47     $ 28.66     $ 27.47  
    Tangible book value (1) $ 24.51     $ 24.64     $ 23.48     $ 24.51     $ 23.48  
    Performance ratios                                  
    Return on average assets, annualized   0.44 %     0.72 %     1.20 %     0.68 %     1.06 %
    Return on average shareholders’ equity, annualized   3.41 %     5.47 %     9.48 %     5.21 %     8.48 %
    Return on average tangible common equity, annualized (1)   3.98 %     6.40 %     11.12 %     6.09 %     9.97 %
    Noninterest income to average assets, annualized   0.27 %     0.59 %     0.73 %     0.39 %     0.37 %
    Noninterest expense to average assets, annualized   1.76 %     1.78 %     1.63 %     1.76 %     1.76 %
    Yield on average earning assets   5.79 %     5.94 %     5.82 %     5.88 %     5.86 %
    Yield on average loans   6.03 %     6.13 %     5.96 %     6.07 %     6.06 %
    Cost of average total deposits (2)   3.35 %     3.63 %     3.38 %     3.54 %     2.87 %
    Cost of average interest-bearing deposits   4.06 %     4.39 %     4.08 %     4.28 %     3.56 %
    Cost of average interest-bearing liabilities   3.94 %     4.24 %     4.00 %     4.14 %     3.56 %
    Net interest spread   1.85 %     1.70 %     1.82 %     1.74 %     2.30 %
    Net interest margin   2.76 %     2.68 %     2.73 %     2.70 %     3.16 %
    Efficiency ratio (3)   61.48 %     57.51 %     49.58 %     60.30 %     52.64 %
    Common stock dividend payout ratio   64.00 %     41.03 %     25.00 %     43.54 %     28.57 %
                                           

    ____________________

    (1) Non-GAAP measure. See Non–GAAP reconciliations set forth at the end of this press release.
    (2) Total deposits include non-interest bearing deposits and interest-bearing deposits.
    (3) Ratio calculated by dividing noninterest expense by the sum of net interest income before provision for credit losses and noninterest income.
       
         
    RBB BANCORP AND SUBSIDIARIES
    SELECTED FINANCIAL HIGHLIGHTS
    (Unaudited)
    (Dollars in thousands)
         
      At or for the quarter ended  
      December 31,     September 30,     December 31,  
      2024     2024     2023  
    Credit Quality Data:                      
    Special mention loans $ 65,329     $ 77,501     $ 32,842  
    Special mention loans to total loans   2.14 %     2.51 %     1.08 %
    Substandard loans HFI $ 89,141     $ 79,831     $ 61,099  
    Substandard loans HFS $ 11,195     $     $  
    Substandard loans HFI to total loans HFI   2.92 %     2.58 %     2.02 %
    Loans 30-89 days past due, excluding nonperforming loans $ 22,086     $ 10,625     $ 16,803  
    Loans 30-89 days past due, excluding nonperforming loans, to total loans   0.72 %     0.34 %     0.55 %
    Nonperforming loans HFI $ 69,843     $ 60,662     $ 31,619  
    Nonperforming loans HFS $ 11,195     $     $  
    OREO $     $     $  
    Nonperforming assets $ 81,038     $ 60,662     $ 31,619  
    Nonperforming loans HFI to total loans HFI   2.29 %     1.96 %     1.04 %
    Nonperforming assets to total assets   2.03 %     1.52 %     0.79 %
                           
    Allowance for loan losses $ 47,729     $ 43,685     $ 41,903  
    Allowance for loan losses to total loans HFI   1.56 %     1.41 %     1.38 %
    Allowance for loan losses to nonperforming loans HFI   68.34 %     72.01 %     132.52 %
    Net charge-offs $ 2,006     $ 1,201     $ 109  
    Net charge-offs to average loans   0.26 %     0.16 %     0.01 %
                           
    Capital ratios (1)                      
    Tangible common equity to tangible assets (2)   11.08 %     11.13 %     11.06 %
    Tier 1 leverage ratio   11.92 %     12.19 %     11.99 %
    Tier 1 common capital to risk-weighted assets   17.94 %     18.16 %     19.07 %
    Tier 1 capital to risk-weighted assets   18.52 %     18.75 %     19.69 %
    Total capital to risk-weighted assets   24.49 %     24.80 %     25.92 %
                           

    ____________________

    (1 ) December 31, 2024 capital ratios are preliminary.
    (2 ) Non-GAAP measure. See Non-GAAP reconciliations set forth at the end of this press release.
         
                   
    RBB BANCORP AND SUBSIDIARIES
    SELECTED FINANCIAL HIGHLIGHTS
    (Unaudited)
                   
    Loan Portfolio Detail As of December 31, 2024   As of September 30, 2024     As of December 31, 2023  
    (dollars in thousands) $   %   $     %     $     %  
    Loans:                                    
    Commercial and industrial $ 129,585   4.2 %   $ 128,861     4.2 %   $ 130,096     4.3 %
    SBA   47,263   1.5 %     48,089     1.6 %     52,074     1.7 %
    Construction and land development   173,290   5.7 %     180,196     5.8 %     181,469     6.0 %
    Commercial real estate (1)   1,201,420   39.3 %     1,252,682     40.5 %     1,167,857     38.5 %
    Single-family residential mortgages   1,494,022   48.9 %     1,473,396     47.7 %     1,487,796     49.1 %
    Other loans   7,650   0.4 %     8,672     0.2 %     12,569     0.4 %
    Total loans (2) $ 3,053,230   100.0 %   $ 3,091,896     100.0 %   $ 3,031,861     100.0 %
    Allowance for loan losses   (47,729 )       (43,685 )           (41,903 )      
    Total loans, net $ 3,005,501       $ 3,048,211           $ 2,989,958        
                                         

    _____________________

    (1) Includes non-farm and non-residential loans, multi-family residential loans and non-owner occupied single family residential loans.
    (2) Net of discounts and deferred fees and costs of $488, $467, and $542 as of December 31, 2024, September 30, 2024, and December 31, 2023, respectively.
       
                   
    Deposits As of December 31, 2024   As of September 30, 2024     As of December 31, 2023  
    (dollars in thousands) $   %   $   %     $   %  
    Deposits:                                
    Noninterest-bearing demand $ 563,012   18.3 %   $ 543,623   17.6 %   $ 539,621   17.0 %
    Savings, NOW and money market accounts   663,034   21.5 %     666,089   21.5 %     632,729   19.9 %
    Time deposits, $250,000 and under   882,438   28.6 %     926,877   30.0 %     876,918   27.6 %
    Time deposits, greater than $250,000   827,854   26.8 %     808,304   26.1 %     719,892   22.7 %
    Wholesale deposits (1)   147,451   4.8 %     147,291   4.8 %     405,600   12.8 %
    Total deposits $ 3,083,789   100.0 %   $ 3,092,184   100.0 %   $ 3,174,760   100.0 %
                                       

    ______________________

    (1) Includes brokered deposits, collateralized deposits from the State of California, and deposits acquired through internet listing services.
       

    Non-GAAP Reconciliations

    Tangible Book Value Reconciliations

    Tangible book value per share is a non-GAAP disclosure. Management measures tangible book value per share to assess the Company’s capital strength and business performance and believes this is helpful to investors as additional tools for further understanding our performance. The following is a reconciliation of tangible book value to the Company shareholders’ equity computed in accordance with GAAP, as well as a calculation of tangible book value per share as of December 31, 2024, September 30, 2024, and December 31, 2023.

                         
    (dollars in thousands, except share and per share data) December 31, 2024     September 30, 2024     December 31, 2023  
    Tangible common equity:                      
    Total shareholders’ equity $ 507,877     $ 509,728     $ 511,260  
    Adjustments                      
    Goodwill   (71,498 )     (71,498 )     (71,498 )
    Core deposit intangible   (2,011 )     (2,194 )     (2,795 )
    Tangible common equity $ 434,368     $ 436,036     $ 436,967  
    Tangible assets:                      
    Total assets-GAAP $ 3,992,477     $ 3,990,477     $ 4,026,025  
    Adjustments                      
    Goodwill   (71,498 )     (71,498 )     (71,498 )
    Core deposit intangible   (2,011 )     (2,194 )     (2,795 )
    Tangible assets $ 3,918,968     $ 3,916,785     $ 3,951,732  
    Common shares outstanding   17,720,416       17,693,416       18,609,179  
    Common equity to assets ratio   12.72 %     12.77 %     12.70 %
    Tangible common equity to tangible assets ratio   11.08 %     11.13 %     11.06 %
    Book value per share $ 28.66     $ 28.81     $ 27.47  
    Tangible book value per share $ 24.51     $ 24.64     $ 23.48  


    Return on Average Tangible Common Equity

    Management measures return on average tangible common equity (“ROATCE”) to assess the Company’s capital strength and business performance and believes this is helpful to investors as an additional tool for further understanding our performance. Tangible equity excludes goodwill and other intangible assets (excluding mortgage servicing rights) and is reviewed by banking and financial institution regulators when assessing a financial institution’s capital adequacy. This non-GAAP financial measure should not be considered a substitute for operating results determined in accordance with GAAP and may not be comparable to other similarly titled measures used by other companies. The following table reconciles ROATCE to its most comparable GAAP measure:

               
      Three Months Ended     Year Ended December 31,  
    (dollars in thousands) December 31, 2024     September 30, 2024     December 31, 2023     2024     2023  
    Net income available to common shareholders $ 4,385     $ 6,999     $ 12,073     $ 26,665     $ 42,465  
    Average shareholders’ equity   512,208       508,720       505,184       511,470       500,540  
    Adjustments:                                      
    Average goodwill   (71,498 )     (71,498 )     (71,498 )     (71,498 )     (71,498 )
    Average core deposit intangible   (2,129 )     (2,326 )     (2,935 )     (2,425 )     (3,282 )
    Adjusted average tangible common equity $ 438,581     $ 434,896     $ 430,751     $ 437,547     $ 425,760  
    Return on average common equity   3.41 %     5.47 %     9.48 %     5.21 %     8.48 %
    Return on average tangible common equity   3.98 %     6.40 %     11.12 %     6.09 %     9.97 %

    The MIL Network

  • MIL-OSI United Kingdom: Strong bonds with European neighbours is the only tonic to toxic Trump

    Source: Green Party of England and Wales

    In response to Starmer joining the EU 27 this evening, Greens are urging him to put European unity at the top of his agenda to provide a united front against the toxic impact of Trump’s trade wars.

    Commenting, Green Party Co-Leader, Adrian Ramsay MP, said: 

    “Tonight represents a historic opportunity for the UK. Starmer will be the first PM to attend an EU summit since we left the European Union.

    “In the face of increasing international hostility from President Trump, the UK needs to be clear that we stand united in the face of his aggression.

    “Starmer cannot do that by parroting Trump’s talking points on defence spending.

    “Strong bonds with our European neighbours are the only antidote available to this toxic Trump Presidency.

    “In the short-term, Starmer should embrace the idea of young people being able to move freely across their continent to work travel and study and respond positively to the EU’s offer of a youth mobility scheme”

    He continued: 

    “Brexit has resulted in tens of billions of pounds draining from our economy.

    “The Office for Budget Responsibility estimates that Brexit will deliver a 15% long-term hit to UK trade.

    “We should, as a matter of urgency, be looking to rejoin the Customs Union as a first step to plugging this hole.

    “And the PEM deal the EU has offered is a no brainer.

    “If Starmer is serious about taking tough decisions for economic stability then this would be a good starting point, not pumping money into climate-rocketing projects like Heathrow expansion.”

    END 

    MIL OSI United Kingdom

  • MIL-OSI United Nations: Press Conference by Security Council President on Programme of Work for February

    Source: United Nations General Assembly and Security Council

    The Security Council’s February programme of work will feature a signature event on practising multilateralism and reforming and improving global governance, its President for the month announced at a Headquarters press conference today.

    “As the world enters a very turbulent period, the open debate aims to encourage countries to revisit the original aspirations of the [United Nations],” said Fu Cong of China, which has assumed the rotating presidency of the 15-nation organ.  This high-level meeting, scheduled for 18 February, will be chaired by his country’s Foreign Minister, Wang Yi, he said, encouraging foreign ministers and senior officials of other countries to attend.

    The Middle East will remain a priority on the Council’s agenda this month, he said, noting briefings on the Palestinian issue, Syria and Yemen.  The Gaza situation remains fragile, and the Council needs to ensure full implementation of the ceasefire agreement and unhindered humanitarian access.  Also highlighting reports of the Israel Defense Forces’ military attacks on Sunday, 2 February, against residential blocks in Jenin, he said the Council is considering a possible meeting to address this.

    It will also pay close attention to the challenges facing United Nations Relief and Works Agency for Palestine Refugees in the Near East (UNRWA), he added. On Syria, he said, the Council’s focus is on supporting that country in maintaining unity, restoring stability and starting a credible and inclusive political transition.

    Turning to Africa, he noted that the situation in eastern Democratic Republic of the Congo “is deteriorating rapidly which could further jeopardize peace and security of the region”.  The Council’s actions must be conducive to the cessation of hostilities and easing of tensions there.  The programme of work for February also includes briefings on UN missions in South Sudan, Libya and the Central African Republic, as well as the situation in Sudan, he said.  Pointing to the volatile security and humanitarian situations in many countries on the continent, he said, as President, “China will work with other Council members, the A3 [Council members representing African countries] in particular, to promote dialogue and consultation and seek political solutions on African issues.”

    The Council will also consider the Secretary-General’s semi-annual report on the threat posed by Islamic State in Iraq and the Levant (ISIL/Da’esh), he said, describing it as an opportunity to further coordinate counter-terrorism efforts.  It will also conduct its annual dialogue with the peacekeeping police, and will hold consultations on the Security Council Committee pursuant to resolution 1718 (2006), regarding sanctions relating to the Democratic People’s Republic of Korea.  China will “encourage Council members to consult with each other to enhance trust and bridge differences”, he said, noting that the presidency will invite civil society representatives to participate in relevant meetings and keep in close contact with the media.

    In the ensuing conversation with correspondents, Ambassador Fu elaborated on the open debate on multilateralism, noting the increasing calls in the international community, particularly among the Global South countries, for reforming the global governance system.  Rather than “dismantling the existing system or reinventing the wheel”, the aim is to build a more equitable system that addresses the global governance deficit, he said.  He also stressed the need to enhance the Council’s ability to respond to crises, adding that “solidarity and cooperation are being replaced by division and confrontation”, as a result of which, the Council has been unable to discharge its responsibilities.  The core of the diplomatic mission is to build bridges, he said, adding that the Council must return to the path of multilateralism.

    Mr. Fu took several questions concerning the new United States President Donald J. Trump’s “America First” policy, its impact on the United Nations, as well as the 10 per cent tariffs he recently imposed on Chinese goods.  His country considers the tariff increases unwarranted, he said, and will file a complaint to the World Trade Organization (WTO).  “There is no winner in a trade war,” he emphasised, and noting that the excuse for raising tariffs is fentanyl, he said China has stringent regulations on that and related substances.  The United States should look at its own problems, including the “demand side of fentanyl”, he advised.

    China and the United States have much in common, he said, adding that it is essential they cooperate on global issues such as climate change and terrorism.  Further, as the two biggest financial contributors “within this house”, he said both countries have similar concerns about improving the efficiency of the United Nations.  All these offer avenues of cooperation, he said.

    He also took a question on United States’ claims that China has influence over the Panama Canal and surrounding areas, and the subsequent statement by Panama’s President about leaving the Belt and Road initiative.  Such an action would be regrettable, he said, stressing that his country has not participated or interfered in the management or operation of the Canal.  The Panama Belt and Road initiative is an economic platform to enable Global South countries to cooperate with each other, he said, adding that the “smear campaign launched by the US and other Western countries on this initiative is totally groundless”.

    Regarding competition with the United States on artificial intelligence (AI) he noted that the Chinese AI tool DeepSeek has caused “some commotion or panic in certain quarters” and encouraged the correspondents to use it to write their news reports.  Technological restrictions do not work, he said, adding:  “Never ever underestimate the ingenuity of Chinese scientists and engineers.”  The world must ensure the benefits of artificial intelligence are available to all countries and there are guardrails to prevent it from being misused, he said, noting that his country put forward the Assembly resolution concerning cooperation on this matter.

    Responding to various questions concerning the conflict in the Democratic Republic of the Congo, he said a ceasefire is a priority — the 23 March Movement (M23) and Rwandan troops must withdraw from the territories they occupied.  Encouraging Rwanda and the Democratic Republic of the Congo to engage in peace talks, he noted that one Council member has floated the idea of a resolution on this topic, which his country will support in its national and presidential capacity.  The territorial integrity of the Democratic Republic of the Congo must be protected, he said, calling on parties to respond to mediation efforts.

    On meetings concerning Ukraine, he noted proposals from Member States to mark the upcoming 25 February anniversary of the beginning of the conflict in that country.  China is obliged to make proper arrangements according to rules of procedures, he said, adding that it is also crucial to highlight that conflict’s ramifications on the food and energy security, as well as maritime transportation. 

    For the full programme of work, please see:  www.un.org/securitycouncil/events/calendar.

    MIL OSI United Nations News

  • MIL-OSI: NXP Semiconductors Reports Fourth Quarter and Full-Year 2024 Results

    Source: GlobeNewswire (MIL-OSI)

    EINDHOVEN, The Netherlands, Feb. 03, 2025 (GLOBE NEWSWIRE) — NXP Semiconductors N.V. (NASDAQ: NXPI) today reported financial results for the fourth quarter and full-year, which ended December 31, 2024. “NXP delivered full-year 2024 revenue of $12.61 billion, a decrease of 5 percent year-on-year. In the fourth quarter, revenue was $3.11 billion, a decrease of 9 percent year-on-year, modestly above the mid-point of our guidance range. In review, NXP delivered resilient results throughout 2024, reflecting solid execution, consistent gross margin, and healthy free cash flow generation despite a challenging market environment. We rigorously focus on managing what is in our control, to navigate a soft landing while executing our growth strategy,” said Kurt Sievers, NXP President and Chief Executive Officer.

    Key Highlights for the Fourth Quarter and Full-year 2024:

    • Fourth quarter revenue was $3.11 billion, down 9 percent year-on-year. Full-year revenue was 12.61 billion, down 5 percent year-on-year;
    • Fourth quarter GAAP gross margin was 53.9 percent, GAAP operating margin was 21.7 percent and GAAP diluted Net Income per Share was $1.93. Full year GAAP gross margin was 56.4 percent, GAAP operating margin was 27.1 percent and GAAP diluted Net Income per Share was $9.73;
    • Fourth quarter Non-GAAP gross margin was 57.5 percent, non-GAAP operating margin was 34.2 percent, and non-GAAP diluted Net Income per Share was $3.18. Full-year Non-GAAP gross margin was 58.1 percent, non-GAAP operating margin was 34.6 percent, and non-GAAP diluted Net Income per Share was $13.09;
    • Fourth quarter cash flow from operations was $391 million, with net capex investments of $99 million, resulting in non-GAAP free cash flow of $292 million. Full-year cash flow from operations was $2,782 million, with net capex investments of $693 million, resulting in non-GAAP free cash flow of $2,089 million;
    • During the fourth quarter of 2024, NXP continued to execute its capital return policy with the payment of $258 million in cash dividends, and the repurchase of $455 million of its common shares. The total capital return of $713 million in the quarter represented 244 percent of fourth quarter non-GAAP free cash flow. On a trailing twelve month basis, capital return to shareholders represented $2.4 billion or 115 percent of non-GAAP free cash flow. The interim dividend for the fourth quarter 2024 was paid in cash on January 8, 2025 to shareholders of record as of December 5, 2024. Subsequent to the end of the fourth quarter, between January 1, 2025 and January 31, 2025, NXP executed via a 10b5-1 program additional share repurchases totaling $101 million;
    • On October 15, 2024, NXP introduced the S32J family of high-performance automotive Ethernet switches and network controllers to enable the next generation of software-defined vehicle development (SDV). The S32J family shares a common switch core with the NXP S32 portfolio of automotive processing devices to maximize software re-use and simplify network configuration and integration;
    • On October 23, 2024, NXP announced Audi has adopted the Trimension® NCJ29Dx Ultra Wide Band (UWB) product family in its advanced UWB platform delivering precise and secure real-time localization to enable hands-free secure car access via smart mobile device and other UWB-based features. Cars featuring NXP’s Trimension UWB devices, including the Audi Q6 e-tron, will hit the road in 2024;
    • On November 12, 2024, NXP announced the i.MX 94 family, the newest addition to its i.MX 9 series of applications processors, designed for industrial control, telematics, gateways, and building and energy control. The i.MX94 family includes Ethernet Time Sensitive Networking (TSN) switching capabilities;
    • On November 12, 2024, NXP announced industry-first wireless battery management system (BMS) based on Ultra-Wideband (UWB) connectivity, expanding its “FlexCom” family of wired and wireless BMS solutions. The new UWB-based BMS solutions enable increased battery energy density, decoupling the mechanical and electrical development for faster time to market;
    • On December 17, 2024, NXP announced it had entered into an definitive agreement to acquire Aviva Links, a provider of Automotive SerDes Alliance (ASA) compliant in-vehicle connectivity solutions in an all-cash transaction valued at $242.5 million. The acquisition of Aviva Links expands NXP’s market leading in-vehicle networking (IVN) portfolio with the industry’s most advanced ASA compliant portfolio, supporting SerDes point-to-point (ASA-ML) and Ethernet-based connectivity (ASA-MLE) with data rates up to 16 Gbps;
    • On January 7, 2025, NXP announced it had entered into an definitive agreement to acquire TT Tech Auto, a leader in safety-critical systems and middleware for software-defined vehicles (SDVs). The all-cash transaction is valued at $625 million, and accelerates the NXP CoreRide platform, enabling automakers to reduce complexity, maximize system performance and shorten time to market. TT Tech Auto’s MotionWise middleware platform has a proven industry track record and is designed to manage the interconnected systems in SDVs, prioritizing safety-critical functions while ensuring seamless integration.

    Summary of Reported Fourth Quarter and Full-year 2024 ($ millions, unaudited) (1)

      Q4 2024 Q3 2024 Q4 2023 Q – Q Y – Y 2024 2023 Y – Y
    Total Revenue $ 3,111   $ 3,250   $ 3,422   -4 % -9 % $ 12,614   $ 13,276   -5 %
    GAAP Gross Profit $ 1,678   $ 1,866   $ 1,937   -10 % -13 % $ 7,119   $ 7,553   -6 %
    Gross Profit Adjustments (i) $ (111 ) $ (26 ) $ (73 )     $ (213 ) $ (209 )  
    Non-GAAP Gross Profit $ 1,789   $ 1,892   $ 2,010   -5 % -11 % $ 7,332   $ 7,762   -6 %
    GAAP Gross Margin   53.9 %   57.4 %   56.6 %       56.4 %   56.9 %  
    Non-GAAP Gross Margin   57.5 %   58.2 %   58.7 %       58.1 %   58.5 %  
    GAAP Operating Income (Loss) $ 675   $ 990   $ 907   -32 % -26 % $ 3,417   $ 3,661   -7 %
    Operating Income Adjustments (i) $ (390 ) $ (163 ) $ (312 )     $ (952 ) $ (1,001 )  
    Non-GAAP Operating Income $ 1,065   $ 1,153   $ 1,219   -8 % -13 % $ 4,369   $ 4,662   -6 %
    GAAP Operating Margin   21.7 %   30.5 %   26.5 %       27.1 %   27.6 %  
    Non-GAAP Operating Margin   34.2 %   35.5 %   35.6 %       34.6 %   35.1 %  
    GAAP Net Income (Loss) attributable to Stockholders $ 495   $ 718   $ 697       $ 2,510   $ 2,797    
    Net Income Adjustments (i) $ (322 ) $ (172 ) $ (269 )     $ (866 ) $ (864 )  
    Non-GAAP Net Income (Loss) Attributable to Stockholders $ 817   $ 890   $ 966       $ 3,376   $ 3,661    
    GAAP diluted Net Income (Loss) per Share (ii) $ 1.93   $ 2.79   $ 2.68       $ 9.73   $ 10.70    
    Non-GAAP diluted Net Income (Loss) per Share (ii) $ 3.18   $ 3.45   $ 3.71       $ 13.09   $ 14.01    
    Additional information                
      Q4 2024 Q3 2024 Q4 2023 Q – Q Y – Y 2024 2023 Y – Y
    Automotive $ 1,790 $ 1,829 $ 1,899 -2 % -6 % $ 7,151 $ 7,484 -4 %
    Industrial & IoT $ 516 $ 563 $ 662 -8 % -22 % $ 2,269 $ 2,351 -3 %
    Mobile $ 396 $ 407 $ 406 -3 % -2 % $ 1,497 $ 1,327 13 %
    Comm. Infra. & Other $ 409 $ 451 $ 455 -9 % -10 % $ 1,697 $ 2,114 -20 %
    DIO   151   149   132          
    DPO   65   60   72          
    DSO   30   30   24          
    Cash Conversion Cycle   116   119   84          
    Channel Inventory (weeks)   8   8   7          
    Gross Financial Leverage (iii) 2.1x 1.9x 2.1x          
    Net Financial Leverage (iv) 1.5x 1.3x 1.3x          
                     
    1. Additional Information for the Fourth Quarter and Full-year 2024:
      1. For an explanation of GAAP to non-GAAP adjustments, please see “Non-GAAP Financial Measures”.
      2. Refer to Table 1 below for the weighted average number of diluted shares for the presented periods.
      3. Gross financial leverage is defined as gross debt divided by trailing twelve months adjusted EBITDA.
      4. Net financial leverage is defined as net debt divided by trailing twelve months adjusted EBITDA.
      5. Guidance for the First Quarter 2025: ($ millions, except Per Share data) (1)

          Guidance Range
          GAAP   Reconciliation   non-GAAP
          Low   Mid   High       Low   Mid   High
        Total Revenue $2,725   $2,825   $2,925       $2,725   $2,825   $2,925  
        Q-Q -12%   -9%   -6%       -12%   -9%   -6%  
        Y-Y -13%   -10%   -6%       -13%   -10%   -6%  
        Gross Profit $1,489   $1,559   $1,630   $(31)   $1,520   $1,590   $1,661  
        Gross Margin 54.6%   55.2%   55.7%       55.8%   56.3%   56.8%  
        Operating Income (loss) $652   $712   $773   $(178)   $830   $890   $951  
        Operating Margin 23.9%   25.2%   26.4%       30.5%   31.5%   32.5%  
        Financial Income (expense) $(90)   $(90)   $(90)   $(10)   $(80)   $(80)   $(80)  
        Tax rate 18.0%-19.0%       17.0%-18.0%
        Equity-accounted investees $(4)   $(4)   $(4)   $(3)   $(1)   $(1)   $(1)  
        Non-controlling interests $(5)   $(5)   $(5)       $(5)   $(5)   $(5)  
        Shares – diluted 256.0   256.0   256.0       256.0   256.0   256.0  
        Earnings Per Share – diluted $1.75   $1.95   $2.14       $2.39   $2.59   $2.79  
                                     

        Note (1) Additional Information:

        1. GAAP Gross Profit is expected to include Purchase Price Accounting (“PPA”) effects, $(7) million; Share-based Compensation, $(16) million; Other Incidentals, $(8) million;
        2. GAAP Operating Income (loss) is expected to include PPA effects, $(35) million; Share-based Compensation, $(128) million; Restructuring and Other Incidentals, $(15) million;
        3. GAAP Financial Income (expense) is expected to include Other financial expense $(10) million;
        4. GAAP Results relating to equity-accounted investees is expected to include results relating to non-foundry equity-accounted investees $(3) million;
        5. GAAP diluted EPS is expected to include the adjustments noted above for PPA effects, Share-based Compensation, Restructuring and Other Incidentals in GAAP Operating Income (loss), the adjustment for Other financial expense, the adjustment for Non-controlling interests & Other and the adjustment on Tax due to the earlier mentioned adjustments.

        NXP has based the guidance included in this release on judgments and estimates that management believes are reasonable given its assessment of historical trends and other information reasonably available as of the date of this release. Please note, the guidance included in this release consists of predictions only, and is subject to a wide range of known and unknown risks and uncertainties, many of which are beyond NXP’s control. The guidance included in this release should not be regarded as representations by NXP that the estimated results will be achieved. Actual results may vary materially from the guidance we provide today. In relation to the use of non-GAAP financial information see the note regarding “Non-GAAP Financial Measures” below. For the factors, risks, and uncertainties to which judgments, estimates and forward-looking statements generally are subject see the note regarding “Forward-looking Statements.” We undertake no obligation to publicly update or revise any forward-looking statements, including the guidance set forth herein, to reflect future events or circumstances.

        Non-GAAP Financial Measures

        In managing NXP’s business on a consolidated basis, management develops an annual operating plan, which is approved by our Board of Directors, using non-GAAP financial measures, that are not in accordance with, nor an alternative to, U.S. generally accepted accounting principles (“GAAP”). In measuring performance against this plan, management considers the actual or potential impacts on these non-GAAP financial measures from actions taken to reduce costs with the goal of increasing our gross margin and operating margin and when assessing appropriate levels of research and development efforts. In addition, management relies upon these non-GAAP financial measures when making decisions about product spending, administrative budgets, and other operating expenses. We believe that these non-GAAP financial measures, when coupled with the GAAP results and the reconciliations to corresponding GAAP financial measures, provide a more complete understanding of the Company’s results of operations and the factors and trends affecting NXP’s business. We believe that they enable investors to perform additional comparisons of our operating results, to assess our liquidity and capital position and to analyze financial performance excluding the effect of expenses unrelated to core operating performance, certain non-cash expenses and share-based compensation expense, which may obscure trends in NXP’s underlying performance. This information also enables investors to compare financial results between periods where certain items may vary independent of business performance, and allow for greater transparency with respect to key metrics used by management.

        These non-GAAP financial measures are provided in addition to, and not as a substitute for, or superior to, measures of financial performance prepared in accordance with GAAP. The presentation of these and other similar items in NXP’s non-GAAP financial results should not be interpreted as implying that these items are non-recurring, infrequent, or unusual. Reconciliations of these non-GAAP measures to the most comparable measures calculated in accordance with GAAP are provided in the financial statements portion of this release in a schedule entitled “Financial Reconciliation of GAAP to non-GAAP Results (unaudited).” Please refer to the NXP Historic Financial Model file found on the Financial Information page of the Investor Relations section of our website at https://investors.nxp.com for additional information related to our rationale for using these non-GAAP financial measures, as well as the impact of these measures on the presentation of NXP’s operations.

        In addition to providing financial information on a basis consistent with GAAP, NXP also provides the following selected financial measures on a non-GAAP basis: (i) Gross profit, (ii) Gross margin, (iii) Research and development, (iv) Selling, general and administrative, (v) Amortization of acquisition-related intangible assets, (vi) Other income, (vii) Operating income (loss), (viii) Operating margin, (ix) Financial Income (expense), (x) Income tax benefit (provision), (xi) Results relating to non-foundry equity-accounted investees, (xii) Net income (loss) attributable to stockholders, (xiii) Earnings per Share – Diluted, (xiv) EBITDA, adjusted EBITDA and trailing 12 month adjusted EBITDA, and (xv) free cash flow, trailing 12 month free cash flow and trailing 12 month free cash flow as a percent of Revenue. The non-GAAP information excludes, where applicable, the amortization of acquisition related intangible assets, the purchase accounting effect on inventory and property, plant and equipment, merger related costs (including integration costs), certain items related to divestitures, share-based compensation expense, restructuring and asset impairment charges, extinguishment of debt, foreign exchange gains and losses, income tax effect on adjustments described above and results from non-foundry equity-accounted investments.

        The difference in the benefit (provision) for income taxes between our GAAP and non-GAAP results relates to the income tax effects of the GAAP to non-GAAP adjustments that we make and the income tax effect of any discrete items that occur in the interim period. Discrete items primarily relate to unexpected tax events that may occur as these amounts cannot be forecasted (e.g., the impact of changes in tax law and/or rates, changes in estimates or resolved tax audits relating to prior year tax provisions, the excess or deficit tax effects on share-based compensation, etc.).

        Conference Call and Webcast Information

        The company will host a conference call with the financial community on Tuesday, February 4, 2025 at 8:00 a.m. U.S. Eastern Standard Time (EST) to review the fourth quarter 2024 results in detail.

        Interested parties may preregister to obtain a user-specific access code for the call here.

        The call will be webcast and can be accessed from the NXP Investor Relations website at www.nxp.com. A replay of the call will be available on the NXP Investor Relations website within 24 hours of the actual call.

        About NXP Semiconductors

        NXP Semiconductors N.V. (NASDAQ: NXPI) is the trusted partner for innovative solutions in the automotive, industrial & IoT, mobile, and communications infrastructure markets. NXP’s “Brighter Together” approach combines leading-edge technology with pioneering people to develop system solutions that make the connected world better, safer, and more secure. The company has operations in more than 30 countries and posted revenue of $12.61 billion in 2024. Find out more at www.nxp.com.

        Forward-looking Statements

        This document includes forward-looking statements which include statements regarding NXP’s business strategy, financial condition, results of operations, market data, as well as any other statements which are not historical facts. By their nature, forward-looking statements are subject to numerous factors, risks and uncertainties that could cause actual outcomes and results to be materially different from those projected. These factors, risks and uncertainties include the following: market demand and semiconductor industry conditions; our ability to successfully introduce new technologies and products; the demand for the goods into which NXP’s products are incorporated; trade disputes between the U.S. and China, potential increase of barriers to international trade and resulting disruptions to NXP’s established supply chains; the impact of government actions and regulations, including restrictions on the export of US-regulated products and technology; increasing and evolving cybersecurity threats and privacy risks, including theft of sensitive or confidential data; the ability to generate sufficient cash, raise sufficient capital or refinance corporate debt at or before maturity to meet both NXP’s debt service and research and development and capital investment requirements; our ability to accurately estimate demand and match our production capacity accordingly or obtain supplies from third-party producers to meet demand; our access to production capacity from third-party outsourcing partners, and any events that might affect their business or NXP’s relationship with them; our ability to secure adequate and timely supply of equipment and materials from suppliers; our ability to avoid operational problems and product defects and, if such issues were to arise, to correct them quickly; our ability to form strategic partnerships and joint ventures and to successfully cooperate with our alliance partners; our ability to win competitive bid selection processes; our ability to develop products for use in customers’ equipment and products; the ability to successfully hire and retain key management and senior product engineers; global hostilities, including the invasion of Ukraine by Russia and resulting regional instability, sanctions and any other retaliatory measures taken against Russia and the continued hostilities and the armed conflict in the Middle East, which could adversely impact the global supply chain, disrupt our operations or negatively impact the demand for our products in our primary end markets; the ability to maintain good relationships with NXP’s suppliers; and a change in tax laws could have an effect on our estimated effective tax rate. In addition, this document contains information concerning the semiconductor industry, our end markets and business generally, which is forward-looking in nature and is based on a variety of assumptions regarding the ways in which the semiconductor industry, our end markets and business will develop. NXP has based these assumptions on information currently available, if any one or more of these assumptions turn out to be incorrect, actual results may differ from those predicted. While NXP does not know what impact any such differences may have on its business, if there are such differences, its future results of operations and its financial condition could be materially adversely affected. Readers are cautioned not to place undue reliance on these forward-looking statements, which speak to results only as of the date the statements were made. Except for any ongoing obligation to disclose material information as required by the United States federal securities laws, NXP does not have any intention or obligation to publicly update or revise any forward-looking statements after we distribute this document, whether to reflect any future events or circumstances or otherwise. For a discussion of potential risks and uncertainties, please refer to the risk factors listed in our SEC filings. Copies of our SEC filings are available on our Investor Relations website, www.nxp.com/investor or from the SEC website, www.sec.gov.

        For further information, please contact:

        NXP-CORP

        NXP Semiconductors
        Table 1: Condensed consolidated statement of operations (unaudited)

        ($ in millions except share data) Three months ended   Full-year
          December 31,
        2024
          September 29,
        2024
          December 31,
        2023
            2024       2023  
                           
        Revenue $ 3,111     $ 3,250     $ 3,422     $ 12,614     $ 13,276  
        Cost of revenue   (1,433 )     (1,384 )     (1,485 )     (5,495 )     (5,723 )
        Gross profit   1,678       1,866       1,937       7,119       7,553  
        Research and development   (612 )     (577 )     (651 )     (2,347 )     (2,418 )
        Selling, general and administrative   (323 )     (265 )     (311 )     (1,164 )     (1,159 )
        Amortization of acquisition-related intangible assets   (28 )     (29 )     (63 )     (136 )     (300 )
        Total operating expenses   (963 )     (871 )     (1,025 )     (3,647 )     (3,877 )
        Other income (expense)   (40 )     (5 )     (5 )     (55 )     (15 )
        Operating income (loss)   675       990       907       3,417       3,661  
        Financial income (expense):                  
        Extinguishment of debt                            
        Other financial income (expense)   (91 )     (82 )     (78 )     (318 )     (309 )
        Income (loss) before income taxes   584       908       829       3,099       3,352  
        Benefit (provision) for income taxes   (77 )     (173 )     (124 )     (545 )     (523 )
        Results relating to equity-accounted investees   (2 )     (6 )     (2 )     (12 )     (7 )
        Net income (loss)   505       729       703       2,542       2,822  
        Less: Net income (loss) attributable to non-controlling interests   10       11       6       32       25  
        Net income (loss) attributable to stockholders   495       718       697       2,510       2,797  
                           
        Earnings per share data:                  
        Net income (loss) per common share attributable to stockholders in $        
        Basic $ 1.95     $ 2.82     $ 2.71     $ 9.84     $ 10.83  
        Diluted $ 1.93     $ 2.79     $ 2.68     $ 9.73     $ 10.70  
                           
        Weighted average number of shares of common stock outstanding during the period (in thousands):        
        Basic   254,349       254,458       257,285       255,208       258,381  
        Diluted   256,628       257,717       260,298       257,848       261,370  
                           

        NXP Semiconductors
        Table 2: Condensed consolidated balance sheet (unaudited)

          ($ in millions) As of
            December 31,
        2024
          September 29,
        2024
          December 31,
        2023
        ASSETS          
        Current assets:          
          Cash and cash equivalents $ 3,292   $ 2,748   $ 3,862
          Short-term deposits       400     409
          Accounts receivable, net   1,032     1,070     894
          Inventories, net   2,356     2,234     2,134
          Other current assets   625     574     565
        Total current assets   7,305     7,026     7,864
                     
        Non-current assets:          
          Deferred tax assets   1,251     1,131     992
          Other non-current assets   1,796     1,510     1,297
          Property, plant and equipment, net   3,267     3,309     3,323
          Identified intangible assets, net   836     735     922
          Goodwill   9,930     9,958     9,955
        Total non-current assets   17,080     16,643     16,489
                     
        Total assets   24,385     23,669     24,353
                     
        LIABILITIES AND EQUITY          
        Current liabilities:          
          Accounts payable   1,017     899     1,164
          Restructuring liabilities-current   147     52     92
          Other current liabilities   1,434     1,542     1,855
          Short-term debt   500     499     1,000
        Total current liabilities   3,098     2,992     4,111
                     
        Non-current liabilities:          
          Long-term debt   10,354     9,683     10,175
          Restructuring liabilities   10     4     9
          Other non-current liabilities   1,392     1,246     1,098
        Total non-current liabilities   11,756     10,933     11,282
                     
          Non-controlling interests   348     338     316
          Stockholders’ equity   9,183     9,406     8,644
        Total equity   9,531     9,744     8,960
                   
        Total liabilities and equity   24,385     23,669     24,353
                     

        NXP Semiconductors
        Table 3: Condensed consolidated statement of cash flows (unaudited)

        ($ in millions) Three months ended   Full-year
          December 31,
        2024
          September 29,
        2024
          December 31,
        2023
            2024       2023  
        Cash flows from operating activities:                  
        Net income (loss) $ 505     $ 729     $ 703     $ 2,542     $ 2,822  
        Adjustments to reconcile net income (loss) to net cash provided by (used for) operating activities:                  
        Depreciation, amortization and impairment   259       218       269       925       1,106  
        Share-based compensation   117       115       107       461       411  
        Amortization of discount (premium) on debt, net   1                   3       2  
        Amortization of debt issuance costs   2       2       2       7       8  
        Net (gain) loss on sale of assets   (1 )                 (3 )     (1 )
        Results relating to equity-accounted investees   2       6       2       12       7  
        (Gain) loss on equity securities, net   6       7             18       (1 )
        Deferred tax expense (benefit)   (145 )     (40 )     (97 )     (272 )     (267 )
        Changes in operating assets and liabilities:                  
        (Increase) decrease in receivables and other current assets   (25 )     (167 )     (20 )     (207 )     (138 )
        (Increase) decrease in inventories   (122 )     (86 )     6       (222 )     (353 )
        Increase (decrease) in accounts payable and other liabilities   16       118       101       (188 )     (119 )
        (Increase) decrease in other non-current assets   (218 )     (134 )     65       (306 )     16  
        Exchange differences   (1 )     7       7       14       22  
        Other items   (5 )     4       (8 )     (2 )     (2 )
        Net cash provided by (used for) operating activities   391       779       1,137       2,782       3,513  
                           
        Cash flows from investing activities:                  
        Purchase of identified intangible assets   (36 )     (26 )     (44 )     (149 )     (179 )
        Capital expenditures on property, plant and equipment   (130 )     (186 )     (175 )     (727 )     (827 )
        Insurance recoveries received for equipment damage                     2        
        Proceeds from the disposals of property, plant and equipment   1                   4       1  
        Advance payment from sale of property, plant and equipment   30                   30        
        Investment in short-term deposits               (409 )           (409 )
        Proceeds of short-term deposits   400                   409        
        Purchase of investments   (67 )     (159 )     (1 )     (260 )     (94 )
        Proceeds from the sale of investments                     5        
        Net cash provided by (used for) investing activities   198       (371 )     (629 )     (686 )     (1,508 )
                           
        Cash flows from financing activities:                  
        Repurchase of long-term debt                     (1,000 )      
        Proceeds from the issuance of long-term debt   670                   670        
        Cash paid for debt issuance costs   (1 )                 (1 )      
        Dividends paid to common stockholders   (258 )     (259 )     (261 )     (1,038 )     (1,006 )
        Proceeds from issuance of common stock through stock plans   3       39       1       82       71  
        Purchase of treasury shares and restricted stock unit
        withholdings
          (455 )     (305 )     (434 )     (1,373 )     (1,053 )
        Other, net         (1 )           (2 )     (2 )
        Net cash provided by (used for) financing activities   (41 )     (526 )     (694 )     (2,662 )     (1,990 )
                           
        Effect of changes in exchange rates on cash positions   (4 )     7       6       (4 )     2  
        Increase (decrease) in cash and cash equivalents   544       (111 )     (180 )     (570 )     17  
        Cash and cash equivalents at beginning of period   2,748       2,859       4,042       3,862       3,845  
        Cash and cash equivalents at end of period   3,292       2,748       3,862       3,292       3,862  
                           
        Net cash paid during the period for:                  
        Interest   92       27       83       243       261  
        Income taxes, net of refunds   280       196       221       867       919  
        Net gain (loss) on sale of assets:                  
        Cash proceeds from the sale of assets   1                   4       1  
        Book value of these assets                     (1 )      
        Non-cash investing activities:                  
        Non-cash capital expenditures   161       125       266       161       266  
                           

        NXP Semiconductors
        Table 4: Financial Reconciliation of GAAP to non-GAAP Results (unaudited)

        ($ in millions except share data) Three months ended   Full-year
          December 31,
        2024
          September 29,
        2024
          December 31,
        2023
            2024       2023  
        GAAP Gross Profit $ 1,678     $ 1,866     $ 1,937     $ 7,119     $ 7,553  
        PPA Effects   (11 )     (12 )     (13 )     (47 )     (53 )
        Restructuring   (21 )           (13 )     (28 )     (11 )
        Share-based compensation   (15 )     (14 )     (14 )     (59 )     (54 )
        Other incidentals   (64 )           (33 )     (79 )     (91 )
        Non-GAAP Gross Profit $ 1,789     $ 1,892     $ 2,010     $ 7,332     $ 7,762  
        GAAP Gross margin   53.9 %     57.4 %     56.6 %     56.4 %     56.9 %
        Non-GAAP Gross margin   57.5 %     58.2 %     58.7 %     58.1 %     58.5 %
        GAAP Research and development $ (612 )   $ (577 )   $ (651 )   $ (2,347 )   $ (2,418 )
        Restructuring   (50 )           (49 )     (57 )     (59 )
        Share-based compensation   (60 )     (58 )     (55 )     (234 )     (211 )
        Other incidentals   (5 )           (1 )     (6 )     (5 )
        Non-GAAP Research and development $ (497 )   $ (519 )   $ (546 )   $ (2,050 )   $ (2,143 )
        GAAP Selling, general and administrative $ (323 )   $ (265 )   $ (311 )   $ (1,164 )   $ (1,159 )
        PPA effects         (1 )     (1 )     (2 )     (3 )
        Restructuring   (41 )           (22 )     (40 )     (28 )
        Share-based compensation   (42 )     (43 )     (38 )     (168 )     (146 )
        Other incidentals   (12 )     (2 )     (5 )     (45 )     (32 )
        Non-GAAP Selling, general and administrative $ (228 )   $ (219 )   $ (245 )   $ (909 )   $ (950 )
        GAAP Operating income (loss) $ 675     $ 990     $ 907     $ 3,417     $ 3,661  
        PPA effects   (39 )     (42 )     (77 )     (185 )     (356 )
        Restructuring   (112 )           (84 )     (125 )     (98 )
        Share-based compensation   (117 )     (115 )     (107 )     (461 )     (411 )
        Other incidentals   (122 )     (6 )     (44 )     (181 )     (136 )
        Non-GAAP Operating income (loss) $ 1,065     $ 1,153     $ 1,219     $ 4,369     $ 4,662  
        GAAP Operating margin   21.7 %     30.5 %     26.5 %     27.1 %     27.6 %
        Non-GAAP Operating margin   34.2 %     35.5 %     35.6 %     34.6 %     35.1 %
        GAAP Income tax benefit (provision) $ (77 )   $ (173 )   $ (124 )   $ (545 )   $ (523 )
        Income tax effect   87       9       54       141       170  
        Non-GAAP Income tax benefit (provision) $ (164 )   $ (182 )   $ (178 )   $ (686 )   $ (693 )
        GAAP Net income (loss) attributable to stockholders $ 495     $ 718     $ 697       2,510       2,797  
        PPA Effects   (39 )     (42 )     (77 )     (185 )     (356 )
        Restructuring   (112 )           (84 )     (125 )     (98 )
        Share-based compensation   (117 )     (115 )     (107 )     (461 )     (411 )
        Other incidentals   (122 )     (6 )     (44 )     (181 )     (136 )
        Other adjustments:                      
        Adjustments to financial income (expense)   (17 )     (12 )     (9 )     (43 )     (26 )
        Income tax effect   87       9       54       141       170  
        Results relating to equity-accounted investees, excluding Foundry investees1   (2 )     (6 )     (2 )     (12 )     (7 )
        Non-GAAP Net income (loss) attributable to stockholders $ 817     $ 890     $ 966     $ 3,376     $ 3,661  
                           
                           
        Additional Information:                  
        1. Refer to Table 7 below for further information regarding the results relating to equity-accounted investees.
                           
        GAAP net income (loss) per common share attributable to stockholders – diluted $ 1.93     $ 2.79     $ 2.68     $ 9.73     $ 10.70  
        PPA Effects   (0.15 )     (0.16 )     (0.30 )     (0.72 )     (1.36 )
        Restructuring   (0.44 )           (0.32 )     (0.48 )     (0.38 )
        Share-based compensation   (0.46 )     (0.45 )     (0.41 )     (1.79 )     (1.57 )
        Other incidentals   (0.47 )     (0.02 )     (0.17 )     (0.70 )     (0.52 )
        Other adjustments:                  
        Adjustments to financial income (expense)   (0.07 )     (0.05 )     (0.03 )     (0.17 )     (0.10 )
        Income tax effect   0.34       0.04       0.21       0.55       0.65  
        Results relating to equity-accounted investees, excluding Foundry investees1         (0.02 )     (0.01 )     (0.05 )     (0.03 )
        Non-GAAP net income (loss) per common share attributable to stockholders – diluted $ 3.18     $ 3.45     $ 3.71     $ 13.09     $ 14.01  
                           
                           
        Additional Information:                  
        1. Refer to Table 7 below for further information regarding the results relating to equity-accounted investees.


        NXP Semiconductors
        Table 5: Financial Reconciliation of GAAP to non-GAAP Financial income (expense) (unaudited)

          ($ in millions) Three months ended   Full-year
            December 31,
        2024
          September 29,
        2024
          December 31,
        2023
            2024       2023  
        GAAP Financial income (expense) $ (91 )   $ (82 )   $ (78 )   $ (318 )   $ (309 )
          Foreign exchange loss   3       (3 )     (6 )     (3 )     (15 )
          Other financial expense   (20 )     (9 )     (3 )     (40 )     (11 )
        Non-GAAP Financial income (expense) $ (74 )   $ (70 )   $ (69 )   $ (275 )   $ (283 )
                             

        NXP Semiconductors
        Table 6: Financial Reconciliation of GAAP to non-GAAP Other income (expense) (unaudited)

          ($ in millions) Three months ended   Full-year
            December 31,
        2024
          September 29,
        2024
          December 31,
        2023
            2024       2023  
        GAAP Other income (expense) $ (40 )   $ (5 )   $ (5 )   $ (55 )   $ (15 )
          Other incidentals   (41 )     (4 )     (5 )     (51 )     (8 )
        Non-GAAP Other income (expense) $ 1     $ (1 )   $     $ (4 )   $ (7 )
                           

        NXP Semiconductors
        Table 7: Financial Reconciliation of GAAP to non-GAAP Results relating to equity-accounted investees (unaudited)

          ($ in millions) Three months ended   Full-year
            December 31,
        2024
          September 29,
        2024
          December 31,
        2023
            2024       2023  
        GAAP Results relating to equity-accounted investees $ (2 )   $ (6 )   $ (2 )   $ (12 )   $ (7 )
          Results of equity-accounted investees, excluding Foundry investees1   (2 )     (6 )     (2 )     (12 )     (7 )
        Non-GAAP Results relating to equity-accounted investees $     $     $     $     $  
                           
        Additional Information:
        1. We adjust our results relating to equity-accounted investees for those results from investments over which NXP has significant influence, but not control, and whose business activities are not related to the core operating performance of NXP. Our equity-investments in foundry partners are part of our long-term core operating performance and accordingly those results comprise the Non-GAAP Results relating to equity-accounted investees.

        NXP Semiconductors
        Table 8: Adjusted EBITDA and Free Cash Flow (unaudited)

        ($ in millions) Three months ended   Full-year
          December 31,
        2024
          September 29,
        2024
          December 31,
        2023
            2024       2023  
        GAAP Net income (loss) $ 505     $ 729     $ 703     $ 2,542     $ 2,822  
        Reconciling items to EBITDA (Non-GAAP)                  
        Financial (income) expense   91       82       78       318       309  
        (Benefit) provision for income taxes   77       173       124       545       523  
        Depreciation and impairment   190       149       167       630       652  
        Amortization   69       69       102       295       454  
        EBITDA (Non-GAAP) $ 932     $ 1,202     $ 1,174     $ 4,330     $ 4,760  
        Reconciling items to adjusted EBITDA (Non-GAAP)                  
        Results of equity-accounted investees, excluding Foundry investees1   2       6       2       12       7  
        Restructuring   112             84       125       98  
        Share-based compensation   117       115       107       461       411  
        Other incidental items2   77       6       44       136       134  
        Adjusted EBITDA (Non-GAAP) $ 1,240     $ 1,329     $ 1,411     $ 5,064     $ 5,410  
        Trailing twelve month adjusted EBITDA (Non-GAAP) $ 5,064     $ 5,235     $ 5,410     $ 5,064     $ 5,410  
                           
        Additional Information:                  
        1. Refer to Table 7 above for further information regarding the results relating to equity-accounted investees.
        2. Excluding from total other incidental items, charges included in depreciation, amortization or impairment reconciling items:        
                   – other incidental items   45                   45       2  


        ($ in millions) Three months ended   Full-year
          December 31,
        2024
          September 29,
        2024
          December 31,
        2023
            2024       2023  
        Net cash provided by (used for) operating activities $ 391     $ 779     $ 1,137     $ 2,782     $ 3,513  
        Net capital expenditures on property, plant and equipment   (99 )     (186 )     (175 )     (693 )     (826 )
        Non-GAAP free cash flow $ 292     $ 593     $ 962     $ 2,089     $ 2,687  
        Trailing twelve month non-GAAP free cash flow $ 2,089     $ 2,759     $ 2,687     $ 2,089     $ 2,687  
        Trailing twelve month non-GAAP free cash flow as percent of Revenue   17 %     21 %     20 %     17 %     20 %
                           

      The MIL Network

  • MIL-Evening Report: Whether Biden Or Trump, US’ Latin American Policy Will Be Contemptible

    Source: Council on Hemispheric Affairs – Analysis-Reportage

    By John Perry and Roger D. Harris

    Migration, Drugs, and Tariffs.

    With Donald Trump as the new US president, pundits are speculating about how US policy towards Latin America might change.

    In this article, we look at some of the speculation, then address three specific instances of how the US’s policy priorities may be viewed from a progressive, Latin American perspective. This leads us to a wider argument: that the way these issues are dealt with is symptomatic of Washington’s paramount objective of sustaining the US’s hegemonic position. In this overriding preoccupation, its policy towards Latin America is only one element, of course, but always of significance because the US hegemon still treats the region as its “backyard.”

    First, some examples of what the pundits are saying. In Foreign Affairs, Brian Winter argues that Trump’s return signals a shift away from Biden’s neglect of the region. “The reason is straightforward,” he says. “Trump’s top domestic priorities of cracking down on unauthorized immigration, stopping the smuggling of fentanyl and other illicit drugs, and reducing the influx of Chinese goods into the United States all depend heavily on policy toward Latin America.”

    Ryan Berg, who is with the thinktank, Center for Strategic and International Studies, funded by the US defense industry, is also hopeful. Trump will “focus U.S. policy more intently on the Western Hemisphere,” he argues, “and in so doing, also shore up its own security and prosperity at home.”

    According to blogger James Bosworth, Biden’s “benign neglect” could be replaced by an “aggressive Monroe Doctrine – deportations, tariff wars, militaristic security policies, demands of fealty towards the US, and a rejection of China.” However, notwithstanding the attention of Trump’s Secretary of State, Marco Rubio, Bosworth thinks there is still a good chance of policy lapsing into benign neglect as the new administration focuses elsewhere.

    The wrong end of the telescope

    What these and similar analyses share is a concern with problems of importance to the US, including domestic ones, and how they might be tackled by shifts in policy towards Latin America. They view the region from the end of a US-mounted telescope.

    Trump’s approach may be the more brazen “America first!,” but the basic stance is much the same as these pundits. The different scenarios will be worked out in Washington, with Latin America’s future seen as shaped by how it handles US policy changes over which it has little influence. Analyses by these supposed experts are constrained by their adopting the same one-dimensional perspective as Washington’s, instead of questioning it.

    Here’s one example. The word “neglect” is superficial because it hides the immense involvement of the US in Latin America even when it is “neglecting” it: from deep commercial ties to a massive military presence. It is also superficial because, in a real sense, the US constantly neglects the problems that concern most Latin Americans: low wages, inequality, being safe in the streets, the damaging effects of climate change, and many more. “Neglect” would be seen very differently on the streets of a Latin American city than it is inside the Washington beltway.

    Who has the “drug problem”?

    The vacuum in US thinking is nowhere more apparent than in responses to the drug problem. Trump threatens to declare Mexican drug cartels to be terrorist organizations and to invade Mexico to attack them.

    But, as academic Carlos Pérez-Ricart told El Pais: “This is a problem that does not originate in Mexico. The source, the demand, and the vectors are not Mexican. It is them.” Mexican President Claudia Sheinbaum also points out that it is consumption in the US that drives drug production and trafficking in Mexico.

    Trump could easily make the same mistake as his predecessor Clinton did two decades ago. Back then, billions were poured into “Plan Colombia” but still failed to solve the “drug problem,” while vastly augmenting violence and human rights violations in the target country.

    A foretaste of what might happen, if Trump carries out his threat, occurred last July, when Biden’s administration captured Ismael “El Mayo” Zambada. That caused an all-out war between cartels in the Mexican state of Sinaloa.

    Sheinbaum rightly turns questions about drug production and consumption back onto the US. Rhetorically, she asks: “Do you believe that fentanyl is not manufactured in the United States?…. Where are the drug cartels in the United States that distribute fentanyl in US cities? Where does the money from the sale of that fentanyl go in the United States?”

    If Trump launches a war on cartels, he will not be the first US president to the treat drug consumption as a foreign issue rather than a concomitantly domestic one.

    Where does the “migration problem” originate?

    Trump is also not the first president to be obsessed by migration. Like drugs, it is seen as a problem to be solved by the countries where the migrants originate, while both the “push” and “pull” factors under US control receive less attention.

    Exploitation of migrant labor, complex asylum procedures, and schemes such as “humanitarian parole” to encourage migration are downplayed as reasons. Biden intensified US sanctions on various Latin American countries, which have been shown conclusively to provoke massive emigration. Meanwhile Trump threatens to do the same.

    Many Latin American countries have been made unsafe by crime linked to drugs or other problems in which the US is implicated. About 392,000 Mexicans were displaced as a result of conflict in 2023 alone, their problem aggravated by the massive, often illegal, export of firearms from the US to Mexico.

    Costa Rica, historically a safe country, had a record 880 homicides in 2023, many of which were related to drug trafficking. In Brazil and other countries, US-trained security forces contribute directly to the violence, rather than reducing it.

    Mass deportations from the US, promised by Trump, could worsen these problems, as happened in El Salvador in the late 1990s. They would also affect remittances sent home by migrant workers, exacerbating regional poverty. The threatened use of tariffs on exports to the US could also have serious consequences if Latin America does not stand up to Trump’s threats. Economist Michael Hudson argues that countries will have to jointly retaliate by refusing to pay dollar-based debts to bond holders if export earnings from the US are summarily cut.

    China in the US “backyard”

    Trump also joins the Washington consensus in its preoccupation with China’s influence in Latin America. Monica de Bolle is with the Peterson Institute for International Economics, a thinktank partly funded by Pentagon contractors. She told the BBC: “You have got the backyard of America engaging directly with China. That’s going to be problematic.”

    Recently retired US Southern Command general, Laura Richardson, was probably the most senior frequent visitor on Washington’s behalf to Latin American capitals, during the Biden administration. She accused China of “playing the ‘long game’ with its development of dual-use sites and facilities throughout the region, “adding that those sites could serve as “points of future multi-domain access for the PLA [People’s Liberation Army] and strategic naval chokepoints.”

    As Foreign Affairs points out, Latin America’s trade with China has “exploded” from $18 billion in 2002 to $480 billion in 2023. China is also investing in huge infrastructure projects, and seemingly its only political condition is a preference for a country to recognize China diplomatically (not Taiwan). Even here, China is not absolute as with Guatemala, Haiti, and Paraguay, which still recognize Taiwan. China still has direct investments in those holdouts, though relatively more modest than with regional countries that fully embrace its one-China policy.

    Peru, currently a close US ally, has a new, Chinese-funded megaport at Chancay, opened in November by President Xi Jinping himself. Even right-wing Argentinian president Milei said of China, “They do not demand anything [in return].”

    What does the US offer instead? While Antony Blinken proudly displayed old railcars that were gifted to Peru, the reality is that most US “aid” to Latin America is either aimed at “promoting democracy” (i.e. Washington’s political agenda) or is conditional or exploitative in other ways.

    The BBC cites “seasoned observers” who believe that Washington is paying the price for “years of indifference” towards the region’s needs. Where the US sees a loss of strategic influence to China and to a lesser extent to Russia, Iran, and others, Latin American countries see opportunities for development and economic progress.

    Remember the Monroe Doctrine

    Those calling for a more “benign” policy are forgetting that, in the two centuries since President James Monroe announced the “doctrine,” later given his name, US policy towards Latin America has been aggressively self-interested.

    Its troops have intervened thousands of times in the region and have occupied its countries on numerous occasions. Just since World War II, there have been around 50 significant interventions or coup attempts, beginning with Guatemala in 1954. The US has 76 military bases across the region, while other major powers like China and Russia have none.

    The doctrine is very much alive. In Foreign Affairs, Brian Winter warns: “Many Republicans perceive these linkages [with China], and the growing Chinese presence in Latin America more broadly, as unacceptable violations of the Monroe Doctrine, the 201-year-old edict that the Western Hemisphere should be free of interference from outside powers.”

    Bosworth adds that Trump wants Latin America to decisively choose a side in the US vs China scrimmage, not merely underplay the role of China in the hemisphere. Any country courting Trump, he suggests, “needs to show some anti-China vibes.”

    Will Freeman is with the Council on Foreign Relations, whose major sponsors are also Pentagon contractors. He thinks that a new Monroe Doctrine and what he calls Trump’s “hardball” diplomacy may partially work, but only with northern Latin America countries, which are more dependent on US trade and other links.

    Trump has two imperatives: while one is stifling China’s influence (e.g. by taking possession of the Panama Canal), another is gaining control of mineral resources (a reason for his wanting to acquire Greenland). The desire for mineral resources is not new, either. General Richardson gave an interview in 2023 to another defense-industry-funded thinktank in which she strongly insinuated that Latin American minerals rightly belong to the US.

    Maintaining hegemonic power against the threat of multipolarity

    Neoconservative Charles Krauthammer, writing 20 years ago for yet another thinktank funded by the  defense industry, openly endorsed the US’s status as the dominant hegemonic power and decried multilateralism, at least when not in US interests. “Multipolarity, yes, when there is no alternative,” he said. “But not when there is. Not when we have the unique imbalance of power that we enjoy today.”

    Norwegian commentator Glen Diesen, writing in 2024, contends that the US is still fighting a battle – although perhaps now a losing one – against multipolarity and to retain its predominant status. Trump’s “America first!” is merely a more blatant expression of sentiments held by his other presidential predecessors for clinging on to Washington’s contested hegemony.

    The irony of Biden’s presidency was that his pursuit of the Ukraine war has led to warmer relations between his two rivals, Russia and China. In this context, the growth of BRICS has been fostered – an explicitly multipolar, non-hegemonic partnership. As Glen Diesen says, “The war intensified the global decoupling from the West.”

    Other steps to maintain US hegemony – its support for Israel’s genocide in Gaza, the regime-change operation in Syria and the breakdown of order in Haiti – suggest that, in Washington’s view, according to Diesen, “chaos is the only alternative to US global dominance.” Time and again, Yankee “beneficence” has meant ruination, not development.

    These have further strengthened desires in the global south for alternatives to US dominance, not least in Latin America. Many of its countries (especially those vulnerable to tightening US sanctions) now want to follow the alternative of BRICS.

    Unsurprisingly, Trump has been highly critical of this perceived erosion of hegemonic power on Biden’s watch. Thomas Fazi argues in UnHerd that this is realism on Trump’s part; he knows the Ukraine war cannot be conclusively won, and that China’s power is difficult to contain. Accordingly, this is leading to a “recalibrating of US priorities toward a more manageable ‘continental’ strategy — a new Monroe Doctrine — aimed at reasserting full hegemony over what it deems to be its natural sphere of influence, the Americas and the northern Atlantic,” stretching from Greenland and the Arctic to Tierra del Fuego and Antarctica.

    The pundits may not agree on quite what Trump’s approach towards Latin America will be, but they concur with Winter’s judgment that the region “is about to become a priority for US foreign policy.” His appointment of Marco Rubio is a signal of this. The new secretary of state is a hawk, just like Blinken, but one with a dangerous focus on Latin America.

    However, the mere fact that such pundits hark back to the Monroe Doctrine indicates that this is only, so to speak, old wine in new bottles. Even in the recent past, an aggressive application of the 201-year-old Monroe Doctrine has never seen a hiatus.

    Recall US-backed coups that deposed Honduran President Manuel Zelaya (2009) and Bolivian Evo Morales (2019), plus the failed coup against Daniel Ortega in Nicaragua (2018), along with the parliamentary coup that ousted Paraguayan Fernando Lugo (2012). To these, US-backed regime change by “lawfare” included Dilma Rousseff in Brazil (2016) and Pedro Castillo in Peru (2023). Currently presidential elections have simply been suspended in Haiti and Peru with US backing.

    Even if Trump is more blatant than his predecessors in making clear that his policymaking is based entirely on what he perceives to be US interests, rather than those of Latin Americans, this is not new.

    As commentator Caitlin Johnstone points out, the main difference between Trump and his predecessors is that he “makes the US empire much more transparent and unhidden.” From the other end of the political spectrum, a former John McCain adviser echoes the same assessment: “there will likely be far more continuity between the two administrations than meets the eye.”

    Regardless, Latin America will continue to struggle to set its own destiny, patchily and with setbacks, and this will likely draw it away from the hegemon, whatever the US does.

    Nicaragua-based John Perry is with the Nicaragua Solidarity Coalition and writes for the London Review of Books, FAIR, and CovertAction.

    Roger D. Harris is with the Task Force on the Americas, the US Peace Council, and the Venezuela Solidarity Network

    Featured image courtesy of Cornell University/Wikimedia Commons

    First published by Popular Resistance: https://popularresistance.org/whether-biden-or-trump-us-latin-american-policy-will-still-be-contemptible/

    MIL OSI AnalysisEveningReport.nz

  • MIL-OSI Europe: Answer to a written question – Sanctioning and deterring hybrid operations – P-003032/2024(ASW)

    Source: European Parliament

    In response to the intensified Russia’s hybrid campaign, the High Representative (HR) and the Commission have taken forward a number of measures in the framework of the EU hybrid toolbox[1] to deter and respond to these operations.

    On 8 October 2024[2], the HR issued a statement strongly condemning Russia’s hybrid campaign against the EU and its Member States. The same day, the Council also adopted a hybrid sanctions regime in response to Russia’s destabilising activities[3].

    On 16 December 2024, the first package of restrictive measures[4] was adopted against individuals and entities, involved inter alia in foreign assassinations, sabotage activities, as well as foreign information manipulation and interference, spreading Russian disinformation in Europe, Ukraine, the United States and Africa.

    In parallel, the HR and the Commission finalised the operationalisation of Hybrid Rapid Response Teams[5] to support Member States and partners to increase their resilience and response to hybrid threats.

    As part of the response to instrumentalisation of migrants, the Commission adopted the Crisis and Force Majeure Regulation in May 2024[6].

    As stated in the recent Joint Statement by the Commission and the HR[7], the EU is also strengthening efforts to protect undersea cables[8], including enhanced information exchange, new detection technologies, as well as undersea repair capabilities, and international cooperation.

    More broadly, the EU will continue to work closely with Member States to improve situational awareness, and maritime domain awareness, ensure the resilience and security of critical infrastructure and take additional measures, to further prevent, deter and respond to hybrid activities threatening EU’s security and stability.

    More so, the EU will continue close cooperation with its international partners via relevant formats such as the G7.

    • [1] https://data.consilium.europa.eu/doc/document/ST-15880-2022-INIT/en/pdf
    • [2] https://www.consilium.europa.eu/en/press/press-releases/2024/10/08/hybrid-threatsrussia-statement-by-the-high-representative-on-behalf-of-the-eu-on-russia-s-continued-hybrid-activity-against-the-eu-and-its-member-states/
    • [3] https://eur-lex.europa.eu/legal-content/EN/TXT/HTML/?uri=OJ:L_202402642
    • [4] https://eur-lex.europa.eu/legal-content/EN/TXT/HTML/?uri=OJ:L_202403174
    • [5] https://www.consilium.europa.eu/en/press/press-releases/2024/12/16/russian-hybrid-threats-eu-agrees-first-listings-in-response-to-destabilising-activities-against-the-eu-its-member-states-and-partners/
    • [6] https://eur-lex.europa.eu/legal-content/EN/TXT/HTML/?uri=OJ:L_202401359
    • [7] https://www.eeas.europa.eu/eeas/joint-statement-european-commission-and-high-representative-investigation-damaged-electricity-and_en
    • [8] https://digital-strategy.ec.europa.eu/en/library/recommendation-security-and-resilience-submarine-cable-infrastructures

    MIL OSI Europe News

  • MIL-OSI Europe: Answer to a written question – Urgent action needed to counter the EU’s growing dependence on Russian fertilisers, including through the introduction of sanctions and tariffs – P-002726/2024(ASW)

    Source: European Parliament

    In response to Russia’s war of aggression against Ukraine, the EU has adopted unprecedented economic sanctions on Russia, imposing severe consequences and costs and seriously curbing its war economy.

    The EU has sought to balance effective sanctions against Russia with the specific economic needs of its Member States and partners and ensure, in the interests of global food security, that EU sanctions do not target in any way the trade in agricultural and food products, including wheat and fertilisers, between third countries and Russia.

    The Commission is closely monitoring the situation regarding the import of fertilisers into the EU from Russia and Belarus. The Commission is concerned by the EU’s continued reliance on certain types of Russian fertilisers and is considering ways to reduce it. While reflecting on new measures, upholding food security remains our primary consideration.

    The EU has designated a number of persons having interests in the fertiliser sector. Those listings are based either on their leading role in the Russian economy, or their involvement in economic sectors providing a substantial source of revenue to the Russian government.

    The EU remains committed to ensuring that sanctions are robustly enforced and that they target those supporting or benefiting from activities that undermine the territorial integrity, sovereignty and independence of Ukraine.

    Last updated: 3 February 2025

    MIL OSI Europe News

  • MIL-OSI Europe: REPORT on the proposal for a regulation of the European Parliament and of the Council on establishing the Reform and Growth Facility for the Republic of Moldova – A10-0006/2025

    Source: European Parliament

    DRAFT EUROPEAN PARLIAMENT LEGISLATIVE RESOLUTION

    on the proposal for a regulation of the European Parliament and of the Council on establishing the Reform and Growth Facility for the Republic of Moldova

    (COM(2024)0469 – C10‑0127/2024 – 2024/0258(COD))

    (Ordinary legislative procedure: first reading)

    The European Parliament,

     having regard to the Commission proposal to Parliament and the Council (COM(2024)0469),

     having regard to Article 294(2) and Article 212 of the Treaty on the Functioning of the European Union, pursuant to which the Commission submitted the proposal to Parliament (C10‑0127/2024),

     having regard to Article 294(3) of the Treaty on the Functioning of the European Union,

     having regard to Rule 60 of its Rules of Procedure,

     having regard to the opinions of the Committee on International Trade and the Committee on Budgetary Control,

     having regard to the report of the Committee on Foreign Affairs and the Committee on Budgets (A10-0006/2025),

    1. Adopts its position at first reading hereinafter set out;

    2. Calls on the Commission to refer the matter to Parliament again if it replaces, substantially amends or intends to substantially amend its proposal;

    3. Instructs its President to forward its position to the Council, the Commission and the national parliaments.


    Amendment  1

    AMENDMENTS BY THE EUROPEAN PARLIAMENT[*]

    to the Commission proposal

    ———————————————————

    2024/0258 (COD)

    Proposal for a

    REGULATION OF THE EUROPEAN PARLIAMENT AND OF THE COUNCIL

    on establishing the Reform and Growth Facility for the Republic of Moldova
     

    THE EUROPEAN PARLIAMENT AND THE COUNCIL OF THE EUROPEAN UNION,

    Having regard to the Treaty on the Functioning of the European Union, and in particular Article 212 thereof,

    Having regard to the proposal from the European Commission,

    Acting in accordance with the ordinary legislative procedure,

    Whereas:

    (1) The Union is founded on the values referred to in Article 2 of the Treaty on the European Union (TEU), which include democracy, the rule of law and respect for human rights. Those values form part of the accession criteria established at the Copenhagen European Council in June 1993 (‘Copenhagen criteria’), which constitute the conditions of eligibility for the Union membership,

    (2) The enlargement process is built on established criteria, fair and rigorous conditionality and the principle of own merits. A firm commitment to ‘fundamentals first’ approach, which requires a strong focus on the rule of law, fundamental rights, the functioning of democratic institutions and public administration reform, as well as on economic criteria, remains essential. Progress depends on  implementation by the Republic of Moldova (hereinafer referred to as ‘Moldova’) of the necessary reforms to align with the Union acquis,

    (3) Russia’s war of aggression against Ukraine further showed that enlargement is a geo-strategic investment in peace, security and stability. The Union is fully and unequivocally committed to the Union membership perspective of Moldova. Moldova’s orientation and commitment towards the Union is a strong expression of its strategic choice and place in a community of values. Moldova’s EU path needs to be firmly anchored in tangible and concrete progress on reforms,

    (4) It is in the common interest of the Union and Moldova to advance with the reforms its political, legal and economic systems with a view to its future Union membership and to support its accession process. The prospect of Union membership has a powerful transformative effect, embedding positive democratic, political, economic and societal change,

    (5) It is necessary to bring forward some of the advantages of Union membership before accession. Economic convergence is at the heart of those benefits. Currently, the convergence of Moldova in terms of GDP per capita expressed in purchasing power standards remains low at 29% of the Union average and is not progressing fast enough,

    (6) As accession negotiations with Moldova opened in June 2024, it is important that support to Moldova’s accession track is brought to levels that are comparable with other candidate countries engaged in accession negotiations and to ensure commensurate resources.

    (7) The implementation of the Growth Plan for Moldova requires the appropriate funding under a dedicated new financing instrument, the Facility to assist the country in implementing reforms for sustainable economic growth and advance on the fundamentals.

    (8) To achieve the goals of the Growth Plan for Moldova, emphasis with respect to investment areas should be placed on sectors that are likely to function as key multipliers for social and economic development: connectivity, infrastructure, including sustainable transport, decarbonisation, energy, green and digital transitions, agriculture and rural communities as well as education, labour market participation and skills development, with a particular focus on children and youth and on raising the standard of living throughout the country. Moldova’s diaspora should also be considered as an important contributor to Moldova’s social and economic development.

    (9) The Facility should build on the Association Agenda with Moldova as well as the work of the Economic and Investment Plan for the Eastern Partnership in Moldova which spearheaded investments in critical sectors such as connectivity, energy efficiency and energy security, while avoiding stranded assets, business development, and competitiveness, recognising that the liberalisation of tariff-rate quotas for key Moldovan exports, facilitation of trade through infrastructure and regulatory alignment, and strengthening Moldova’s integration into Union-led economic initiatives and programs will contribute to Moldova’s  integration into the Union single market and will deliver immediate and tangible socio-economic benefits.

    (9a) Given Russia’s unjust war of aggression against Ukraine, which has profoundly impacted Moldova’s security, economy, and citizens’ livelihoods, as well as the ongoing and unprecedented hybrid attacks targeting the country and democratic institutions, it is appropriate for the Facility to provide support to Moldova in a timely manner and to enable Moldova to strengthen its resilience to foreign malign interference in its sovereignty, democratic processes and institutions. The Facility should also seek to support Moldova’s needs for energy independence from Russia.

    (10) Sustainable and cohesive transport infrastructure is essential to improve connectivity between Moldova and the Union. It should contribute to the integration of Moldova in the Union’s transport network In the revised trans-European transport network (TEN-T), the Commission extended the Baltic Sea – Black Sea – Aegean Sea European Transport Corridor to Moldova. The TEN-T network is the reference for funding sustainable transport infrastructure, including for environmentally friendly means of transport, such as railways as well as digitalisation of transport. Cross-border energy infrastructure projects and interconnections are essential for regional energy security and integration within the Union.

    (11) The Facility should support investments and reforms that promote Moldova’s path to the digital transformation of the economy and society in line with the Union vision for 2030 presented in the Commission communication, entitled ‘2030 Digital Compass: the European way for the Digital Decade’, fostering an inclusive digital economy that benefits all citizens. The Facility should strive to facilitate Moldova’ achievement of the general objectives and digital targets with regard to the Union. As outlined by the Commission in its communication of 15 June 2023, entitled ‘Implementation of the 5G cybersecurity Toolbox’, the 5G cybersecurity Toolbox should be the reference for Union funding to ensure security, resilience and the protection of integrity of digital infrastructure projects in the region.

    (12) The support under the Facility should be provided to meet general and specific objectives, based on established criteria and with clear payment conditions. Those general and specific objectives should be pursued in a mutually reinforcing manner. The Facility should support the enlargement process by accelerating the alignment with Union values, laws, rules, standards, policies and practices (‘acquis’) with a view to Union membership, accelerate progressive integration of Moldova in the Union single market, and accelerate its socio-economic convergence with the Union. The Facility should also foster good neighbourly relations.

    (13) In addition to boosting socio-economic convergence, the Facility should also help accelerate reforms related to the fundamentals of the enlargement process including rule of law, fundamental rights, inter alia, the rights of refugees, of persons belonging to minorities, including national minorities and Roma, as well as the rights of lesbian, gay, bisexual, transgender and intersex (LGBTI) persons. It should also improve the functioning of democratic institutions and public administrations; public procurement, state aid control and public finance management; the fight against all forms of corruption and organised crime; quality education and training as well as employment policies; the country’s green transition, climate and environmental objectives.

    (14) This Facility should help Moldova in its preparation for Union Membership and in line with the existing enlargement methodology[1].

    (15) The Facility should complement the existing Economic and Financial Dialogue without compromising its scope, thereby enhancing economic integration and preparation for the Union’s multilateral surveillance of economic policies.

    (16) The Facility should promote the development of effectiveness principles, respecting additionality to and complementarity with the support provided under other Union programmes and instruments and striving to avoid duplication and ensure synergies between assistance under this Regulation and other assistance, including integrated financial packages composed of both export and development financing provided by the Union, the Member States, third countries, multilateral and regional organisations and entities. Moldova’s participation in other EU funding programmes should be promoted and encouraged.

    (17) In line with the principle of inclusive partnerships, the Commission should strive to ensure that relevant stakeholders in Moldova, including Moldova’s parliament, local and regional authorities, social partners and civil society organisations are duly consulted and have timely access to relevant information to allow them to play a meaningful role during the design and implementation of programmes and the related monitoring processes.

    (18) Technical assistance, as well as cross-border cooperation assistance, should be provided in support of the objectives of this Facility and in order to strengthen the relevant capacities of Moldova to implement the Reform Agenda.

    (19) The Facility should ensure consistency with, and support for the general objectives of Union external action as laid down in Article 21 of the TEU, including the respect for fundamental rights as enshrined in the Charter of Fundamental Rights of the European Union. It should in particular ensure the protection and promotion of human rights, and the rule of law.

    (20) The Facility should boost innovation, research, and cooperation between academic institutions and industry in support of the green and digital transitions, promoting local industries with a particular emphasis on locally based micro, small and medium-sized enterprises and start-ups;

    (21) Moldova should demonstrate a credible commitment to European values, including through its alignment with the Union’s Common Foreign and Security Policy, including Union restrictive measures.

    (22) In the implementation of the Facility, account should be taken of the Union’s strategic autonomy as well as of the Union and its Member States’ strategic interests and the values on which the Union is founded.

    (23) Activities under the Facility should support progress towards Union social, climate and environmental standards, and support progress towards the United Nations Sustainable Development Goals, the Paris Agreement adopted under the United Nations Framework Convention on Climate Change, the United Nations Convention on Biological Diversity and the United Nations Convention to Combat Desertification and should not contribute to environmental degradation or cause harm to the environment or climate. Measures funded under the Facility should be in line with Moldova’ Energy and Climate Plans, their Nationally Determined Contribution and ambition to reach climate neutrality by 2050. The Facility should contribute to the mitigation of climate change and to the ability to adapt to its adverse effects, and foster climate resilience. In particular, funding under the Facility should promote the transition towards a decarbonised, climate-neutral, climate-resilient and circular economy.

    (24) The implementation of this Regulation should be guided by the principles of equality and non-discrimination, as elaborated in the Union of Equality strategies. It should promote and advance gender equality and mainstreaming, ensure meaningful participation of women in decision-making processes, and the empowerment of women and girls, and seek to protect and promote women’s and girls’ rights, as well as prevent and combat violence against women and domestic violence, taking into consideration relevant EU Gender Action Plans and relevant Council conclusions and international conventions. Furthermore, this Regulation should be implemented in full respect of the European Pillar of Social Rights, including on child protection and labour rights. The implementation of the Facility should be in line with the United Nations Convention on the Rights of Persons with Disabilities and its protocol and ensure accessibility in its investments and technical assistance, in line with Directive (EU) 2019/882 of the European Parliament and of the Council.

    (25) Reflecting the European Green Deal as Europe’s sustainable growth strategy and the importance of tackling climate and biodiversity objectives in line with the commitments of the Interinstitutional Agreement, the Facility should contribute to the achievement of an overall target of 30 % of Union budget expenditure supporting climate objectives and 7,5 % in 2024 and 10 % in 2026 and 2027 to biodiversity objectives. At least 37 % of the non-repayable financial support, including provisioning, provided to investment projects approved under the Neighbourhood Investment Platform (NIP), one of the regional investment platforms referred to in Article 32 of Regulation (EU) 2021/947[2], should account to climate objectives. That amount should be calculated using the Rio markers following the obligation to report the EU’s international climate finance to the OECD, as well as other international agreements or frameworks. As early as June 2025, the EU climate coefficients, applicable across all programmes under the 2021-2027 Multi-annual Financing Framework (MFF) and set out in the Commission Staff Working Document entitled ‘Climate Mainstreaming Architecture in the 2021-2027 Multiannual Financial Framework’ (SWD(2022) 225), will also be applied to climate expenditure under the MFF’s Heading 6 (‘Neighbourhood and the world’). The Facility will align with the approach of other Heading 6 instruments, in order to ensure consistent climate reporting in the region. The Facility should support activities that fully respect the climate and environmental standards and priorities of the Union and the principle of ‘do no significant harm’ within the meaning of Article 17 of Regulation (EU) 2020/852 of the European Parliament and of the Council (6).

    (26) Projects are approved under the NIP after assessment by the Commission and subject to a positive opinion by the Member States in the NIP Board.

    (27) The Commission, in cooperation with the Member States and Moldova, should ensure the compliance, coherence, consistency and complementarity, increased transparency and accountability in the delivery of assistance, including by implementing appropriate internal control systems and anti-fraud policies. The support under the Facility should be made available under the preconditions that Moldova upholds and respects effective democratic mechanisms, including a multi-party parliamentary system, free and fair elections, independent and pluralistic media, an independent judiciary and the rule of law, and to guarantee respect for all human rights obligations, including the effective rights of persons belonging to minorities.

    (28) The Facility should be supported with resources from the Neighbourhood, Development and International Cooperation Instrument – Global Europe amounting to EUR 420 million and a maximum amount of EUR 1 500 million in loans for the period from 2025-2027. The amount should cover the 9% provisioning required for the loans corresponding to EUR 135 million, support provided by the Union for projects approved under the NIP, as referred to in Article 18(2), and complementary support, including support to civil society organisations and technical assistance.  The non-repayable support should be financed from the envelope allocated to the Neighbourhood geographic programme under Article 6(2), point (a), of Regulation (EU) 2021/947. In order to maximise EU financial support, the 9 % provisioning required for the loans corresponding to EUR 135 million should be covered from the NDICI- Global Europe Emerging challenges and priorities cushion, in line with Articles 6(3) and 17 of Regulation (EU) 2021/947. All provisions under Regulation (EU) 2021/947 should apply unless otherwise mentioned in this Regulation. In particular, Moldova should remain eligible for NDICI regional, thematic and rapid response programmes as well as humanitarian aid. The proposed Facility is closely modelled on the Reform and Growth Facility for the Western Balkans.

    (29) Decisions on the release referred to in Article 19(3) for the support in the form of loans should be adopted in the period from 1 January 2025 to 30 June 2029. This final date includes the time necessary for the Commission to evaluate the successful fulfilment of the payment conditions concerned and to adopt the subsequent release decision.

    (30) In order to maximise the leverage of Union financial support to attract additional investment, and to ensure Union control over the expenditure, the investments supporting the Reform Agenda should be implemented through the NIP. At least 25% of the loan amount released to Moldova should be made available by Moldova to investment projects approved under the NIP. This is in addition to the non-repayable support provided by the Union for these projects.

    (31) The financial liability from loans under the Facility should not constitute part of the amount of the External Action Guarantee within the meaning of Article 31(4) of Regulation (EU) 2021/947 of the European Parliament and of the Council.

    (32) Horizontal financial rules adopted by the European Parliament and the Council on the basis of Article 322 of the Treaty on the Functioning of the European Union (TFEU) should apply to this Regulation. Those rules are laid down in Regulation (EU, Euratom) 2024/2509 and determine in particular the procedure for establishing and implementing the budget in direct and indirect management through grants, procurement, financial assistance, blending operations and the reimbursement of external experts, and provide for checks on the responsibility of financial actors.

    (33) Restrictions on eligibility in award procedures under the Facility should be provided for, where appropriate, given the specific nature of the activity or when the activity affects security or public order.

    (34) In order to ensure the efficient implementation of the Facility, including the facilitation of Moldova’ integration in European value chains, all supplies and materials financed and procured under this Facility should originate from Member States, Moldova, candidate countries and contracting parties to the Agreement on the European Economic Area and countries which provide a level of support to Moldova comparable to the one provided by the Union, taking into account the size of their economy, and for which reciprocal access to external assistance in Moldova is established by the Commission, unless the supplies and materials cannot be sourced under reasonable conditions in any of those countries.

    (35) A Facility Agreement should be concluded with Moldova to set up the principles of the financial cooperation between the Union and Moldova, and to specify the necessary mechanisms related to the control, supervision, monitoring, evaluation, reporting and audit of Union funding under the Facility, rules on taxes, duties and charges and measures to prevent, detect, investigate and correct irregularities, fraud, corruption and conflicts of interest. Consequently, a loan agreement should also be concluded with Moldova setting out specific provisions for the management and implementation of funding provided in the forms of loans. Both the Facility Agreement and the loan agreement should be transmitted without delay, simultaneously to the European Parliament and to the Council ▌.

    (36) The Facility Agreement should provide the obligation for Moldova to ensure the collection of, and access to data in compliance with Union data protection principles and with applicable data protection rules, adequate data on persons and entities receiving funding, including beneficial ownership information, for the implementation of Reform Agenda.

    (37) The implementation of the Facility should be underpinned by a coherent and prioritised set of targeted reforms and investment-related priorities in Moldova (the ‘Reform Agenda’), providing a framework for boosting inclusive sustainable socio-economic growth, clearly articulated and aligned with Union accession requirements and the fundamentals of the enlargement process. The Reform Agenda will serve as an overarching framework to achieve the objectives of the Facility. The Reform Agenda should be prepared in close consultation with relevant stakeholders, including Moldova’s parliament, local and regional authorities, social partners and civil society organisations and their input should be reflected, in accordance with the national legal framework. Disbursement of Union support should be conditional on compliance with the payment conditions and on measurable progress in the implementation of reforms set out in the Reform Agenda assessed and formally approved by the Commission. The release of funds should be structured accordingly, reflecting the objectives of the Facility.

    (38) The Reform Agenda should include targeted reform measures and priority investment areas, along with payment conditions in the form of measurable qualitative and quantitative steps that indicate satisfactory progress or completion of those measures, and a timetable for the implementation of those measures. The Reform Agenda should also include a preliminary list of planned investment projects intended for implementation under NIP. Those steps should be planned to be implemented for no later than 31 December 2027, although it should be possible for the overall completion of the measures, to which such steps refer, to extend beyond 2027 but not later than 31 December 2028. The Reform Agenda should include an explanation of Moldova’s system to effectively prevent, detect and correct irregularities, corruption, including high-level corruption, fraud and conflicts of interest, when using the funds provided under the Facility, and the arrangements to avoid double funding from the Facility and other Union programmes as well as other donors.

    (39) The Reform Agenda should include an explanation on how the measures are expected to contribute to the climate and environmental objectives and the principle of ‘do no significant harm’, and the digital transformation.

    (40) Measures under the Reform Agenda should contribute to improving an efficient public financial management and control system, money laundering, tax avoidance, tax evasion, fraud and organised crime and to an effective system of State aid control, with the aim of ensuring fair conditions for all undertakings.

    (41) The Reform Agenda should contain a description of such systems as well as specific steps related to Chapter 32 in order to support Moldova in bringing its audit and controls requirements in line with Union standards. In the event that a request for the release of funds includes a step related to Chapter 32, referred to in Article 19(2), the Commission may not adopt a decision authorizing the release of funds unless it assesses such step positively.

    (42) The Facility Agreement should also include indicators for assessing progress towards the achievement of general and specific objectives of the Facility set out in this Regulation. Those indicators should be based on internationally agreed indicators. Indicators should also, to the extent possible, be coherent with the key performance indicators included in Commission Implementing Decision approving the Reform Agendas for the Western Balkans under Regulation (EU) 2024/1449 and in the EFSD+ Results Measurement Framework. The indicators should be relevant, accepted, credible, easy, and robust.

    (43) The Commission should assess the Reform Agenda based on the list of criteria set out in this Regulation. In order to ensure uniform conditions for the implementation of this Regulation, implementing powers should be conferred on the Commission to approve the Reform Agenda. The Commission will duly take into account Council decision 2010/427/EU (11) and the role of the European External Action Service (EEAS), where appropriate.

    (44) The work programme within the meaning of Article 110(2) of Regulation (EU, Euratom) 2024/2509 adopted in accordance with the relevant provisions of Regulation (EU) 2021/947 should cover the amounts funded from the envelope allocated to the Neighbourhood geographic programme under Article 6(2), point (a), of Regulation (EU) 2021/947.

    (45) Given the need for flexibility in the implementation of the Facility, it should be possible for Moldova to make a reasoned request to the Commission to amend the implementing decision, where the Reform Agenda, including relevant payment conditions, is no longer achievable, either partially or totally, because of objective circumstances. Moldova should be able to make a reasoned request to amend the Reform Agenda, including by proposing addenda, where relevant. The Commission should be able to amend the implementing decision.

    (46) The Facility Agreement should provide the obligation for Moldova to ensure the collection of, and access to data in compliance with Union data protection principles and with applicable data protection rules, adequate data on persons and entities receiving funding, including beneficial ownership information, for the implementation of the Reform Agenda. Financial support for the Reform Agenda should be possible in the form of a loan. In the context of Moldova’s financing needs, it is appropriate to organise the financial assistance under the diversified funding strategy provided for in Article 224of Regulation (EU, Euratom) 2024/2509 and established as a single funding method therein, which is expected to enhance the liquidity of Union bonds and the attractiveness and cost-effectiveness of Union issuance.

    (47) It is appropriate to provide loans to Moldova on highly concessional terms with a maximum duration of 40 years and to not start the repayment of the principal before 2034.

    (48) Considering that the financial risks associated with the support to Moldova in the form of loans under the Facility is comparable to the financial risks associated with lending operations under Regulation (EU) 2021/947, provisioning for the financial liability from loans under this Regulation should be constituted at the rate of 9 %, in line with Article 214 of Regulation (EU, Euratom) 2024/2509 and the funding of the provisioning should be sourced from the emerging challenges and priorities cushion under Article  6(3) of Regulation (EU) 2021/947.

    (49) In order to ensure that Moldova disposes of start-up funding for the implementation of the first reforms, it should have access to up to 20 % of the total amount provided for in this Facility, after deduction of complementary support, including support to civil society organisations and technical assistance, and provisioning for loans, in the form of a pre-financing, subject to availability of funding and to the respect of the preconditions for support under the Facility.

    (50) It is important to guarantee both flexibility and programmability in providing Union support to Moldova. Moldova should submit on a six-monthly basis a duly justified request for the release of funds at the latest two months after the timeline for the planned fulfilment of steps, set in the Commission Implementing Decision approving the Reform Agenda. For that purpose, funds under the Facility should be released according to a fixed semi-annual schedule, subject to availability of funding, on the basis of a request for the release of funds submitted by Moldova and following verification by the Commission of the satisfactory fulfilment of both the general conditions related to macro-financial stability, sound public financial management, transparency and oversight of the budget and the relevant payment conditions. Where a payment condition is not fulfilled as per the indicative timeline set in the decision approving the Reform Agenda, the Commission could withhold in whole or in part the release of funds corresponding to that condition, following a methodology on partial payments. The release of the corresponding withheld funds could take place during the next window for the release of funds and up to twelve months after the original deadline set out in the indicative timeline, provided that the payment conditions have been fulfilled. In the first year of implementation, that deadline should be extended to 24 months from the initial negative assessment.

    (51) By way of derogation from Article 116(2) and (5) of the Financial Regulation, it is appropriate to set the payment deadline for contributions to state budgets starting from the date of the communication of the decision authorising the disbursement to Moldova and to exclude the payment of default interest by the Commission to Moldova.

    (52) The Commission should provide▌ the European Parliament in the framework of the discharge procedure with detailed information about the implementation of the Union budget under the Facility, in particular as regards audits carried out, including weaknesses identified and corrective measures taken, and as regards projects approved under NIP, including where applicable the amount of Moldova’s co-financing as well as other sources of contributions including from other Union financing instruments.

    (53) In the framework of the Union’s restrictive measures, adopted on the basis of Article 29 TEU and Article 215 TFEU, no funds or economic resources may be made available, directly or indirectly, to or for the benefit of designated legal persons, entities or bodies. Such designated entities, and entities owned or controlled by them, therefore should not be supported by the Facility.

    (54) In the interest of transparency and accountability, Moldova should publish data on final recipients receiving amounts of funding exceeding the equivalent of EUR 50 000 cumulatively during the implementation of reforms and investments under this Facility.

    (55) In accordance with Regulation (EU, Euratom) 2024/2509, Regulation (EU, Euratom) 883/2013 of the European Parliament and of the Council (13) and Council Regulations (EC, Euratom) No 2988/95 (14), (Euratom, EC) No 2185/96 (15) and (EU) 2017/1939 (16), the financial interests of the Union are to be protected by means of proportionate measures, including measures relating to the prevention, detection, correction and investigation of irregularities, fraud, corruption, conflicts of interest, double funding, to the recovery of funds lost, wrongly paid or incorrectly used.

    (56) In particular, in accordance with regulations (Euratom, EC) No 2185/96 and (EU, Euratom) 883/2013, the European Anti-Fraud Office (OLAF) should be in a position to carry out administrative investigations, including on-the-spot checks and inspections, with a view to establishing whether there has been fraud, corruption or any other illegal activity affecting the financial interests of the Union.

    (57) In accordance with Article 129 of Regulation (EU, Euratom) 2024/2509, the necessary rights and access should be granted to the Commission, OLAF, the Court of Auditors and, where applicable the European Public Prosecutor’s Office (EPPO), including by third parties involved in the implementation of Union funds.

    (58) The Commission should ensure that the financial interests of the Union are effectively protected under the Facility. Considering the long track record of financial assistance provided to Moldova also under indirect management and taking into account its gradual alignment with the Unions internal control standards and practices, the Commission should rely to a great extent on the operation of Moldova’s internal control and fraud prevention systems. In particular, the Commission and OLAF and, where applicable, the EPPO should be informed of all suspected cases of irregularities, fraud, corruption and conflicts of interest affecting the implementation of funds under the Facility without delay.

    (59) Furthermore, Moldova should report the irregularities including fraud which have been the subject of a primary administrative or judicial finding, without delay, to the Commission and keep it informed of the progress of administrative and legal proceedings. With the objective of alignment to good practices in Member States, this reporting should be done by electronic means, using the Irregularity Management System, established by the Commission.

    (60) Moldova should establish a monitoring system feeding into a semi-annual report on the fulfilment of its Reform Agenda’s payment conditions accompanying the semi-annual request for the release of funds. Moldova should collect and provide access to data and information allowing the prevention, detection and correction of irregularities, fraud, corruption and conflicts of interest, in relation to the measures supported by the Facility.

    (61) The Commission should ensure that clear monitoring and independent evaluation mechanisms are in place in order to provide effective accountability and transparency in implementing the Union budget, and to ensure effective assessment of progress towards the achievement of the objectives of this Regulation.

    (62) The Commission should provide an annual report to the European Parliament and the Council on progress towards the achievement of the objectives of this Regulation.

    (63) The Commission should carry out an evaluation of the Facility upon its completion.

    (64) Moldova should support free pluralistic media that enhance and promote the understanding of Union values and the benefits and obligations of potential Union membership, while undertaking decisive actions in terms of tackling Foreign Information Manipulation and Interference. They should also ensure pro-active, clear and consistent public communication, including on the Union support. The recipients of Union funding should actively acknowledge the origin and ensure visibility of the Union funding, in line with the Communication and Visibility Manual for EU External Actions.

    (65) Implementation of the Facility should also be accompanied by enhanced strategic communication and public diplomacy to promote the values of the Union and highlight the added value of the Union’s support.

    (66) Since the objectives of this Regulation cannot be sufficiently achieved by the Member States, but can rather be better achieved at Union level, the Union may adopt measures, in accordance with the principle of subsidiarity as set out in Article 5 of the TEU. In accordance with the principle of proportionality as set out in that Article, this Regulation does not go beyond what is necessary to achieve those objectives.

    (67) In order to provide funding for Moldova in due time without further delay, this Regulation should enter into force on the day following that of its publication in the Official Journal of the European Union,

    HAVE ADOPTED THIS REGULATION:


    CHAPTER I

    General Provisions


    Article 1

    Subject matter

    1. This Regulation establishes the Reform and Growth Facility for Moldova for the period 2025-2027 (the ‘Facility’).

    2. The Regulation shall provide assistance to Moldova for the delivery of EU-related reforms, in particular inclusive and sustainable socio-economic reforms and reforms concerning fundamentals of the enlargement process, aligned with Union values, as well as investments to implement Moldova’s Reform Agenda.

    3. The rules set out in Regulation (EU) 2021/947 shall apply to the implementation of the Facility, unless specified otherwise in this Regulation.

    Article 2

    Definitions

    For the purposes of this Regulation, the following definitions apply:

    (1) ‘Moldova’ means the Republic of Moldova.

    (2) ‘Facility Agreement’ means an arrangement concluded between the Commission and Moldova laying down the principles for the financial cooperation between Moldova and the Commission under this Regulation; this arrangement constitutes a financing agreement within the meaning of Article 114(2) of Regulation (EU, Euratom) 2024/2509 ;

    (3) ‘enlargement policy framework’ means the overall policy framework for the implementation of this Regulation as defined by the European Council and the Council, and includes the revised enlargement methodology, agreements that establish a legally binding relationship with Moldova, the negotiating frameworks governing accession negotiations with candidates, where applicable, as well as resolutions of the European Parliament, relevant communications from the Commission, including, where applicable, on the rule of law, and joint communications from the Commission and the High Representative of the Union for Foreign Affairs and Security Policy 

    (4) ‘loan agreement’ means an agreement concluded between the Union and Moldova laying down the terms of the loan support under the Facility;

    (5) ‘Reform Agenda’ means a comprehensive, coherent and prioritised set of targeted reforms and priority investment areas in Moldova, including payment conditions that indicate satisfactory progress or completion of related measures, and an indicative timetable for their implementation;

    (6) ‘measures’ means reforms and investments as set out in the Reform Agenda under Chapter III;

    (7) ‘payment conditions’ means conditions for the release of funds that take the form of observable and measurable qualitative or quantitative steps to be implemented by Moldova, as set out in the Reform Agenda under Chapter III;

    (8) ‘blending operation’ means an operation supported by the Union budget that combines non-repayable forms of support from the Union budget with repayable forms of support from development or other public financial institutions, including export credit agencies, or from commercial finance institutions and investors;

    (9) ‘final recipient’ means a person or entity receiving funding under the Facility; for the part of the funding that is made available as financial assistance, final recipient will be the treasury of Moldova; for the part of the funding that is made available through the Neighbourhood Investment Platform, final recipient will be the contractor or sub-contractor implementing the investment project; 

    (10) ‘do no significant harm’ means not supporting or carrying out economic activities that do significant harm to any environmental objective, where relevant, within the meaning of Article 17 of Regulation (EU) 2020/852;

    (11) ‘the Neighbourhood Investment Platform’ is one of the regional investment platforms referred to under Article 32 of Regulation (EU) 2021/947.


    Article 3

    Objectives of the Facility

    1. The general objectives of the Facility shall be to:

    (a) support the enlargement process by accelerating the alignment with Union values, laws, rules, standards, policies and practices (‘acquis’) through the adoption and implementation of reforms with a view to future Union membership;

    (b) support progressive integration of Moldova into the Union single market;

    (c) accelerate the socio-economic convergence of Moldova’s economy with the Union;

    (d) foster good neighbourly relations, as well as people-to-people contact.


    2. The specific objectives of the Facility shall be to:

    (a) further strengthen the fundamentals of the enlargement process, including the rule of law and fundamental rights, the functioning of democratic institutions, including de-polarisation, public administration and fulfil the economic criteria; build a functioning market economy capable of coping with competitive pressure and market forces within the Union, ▌ promoting an independent judiciary, reinforcing security and stability, strengthening the fight against fraud and all forms of corruption, including high-level corruption, oligarchic influence and nepotism, organised crime, cross-border crime and money laundering as well as terrorism financing, tax evasion and tax fraud, tax avoidance; increasing compliance with international law; strengthening freedom and independence of media and academic freedom; combating hate speech; reinforce territorial integrity; enabling an environment for civil society, fostering social dialogue; promoting gender equality, gender mainstreaming and the empowerment of women and girls, children’s rights and child and youth participation, non-discrimination and tolerance, to ensure and strengthen respect for the rights of refugees and persons belonging to minorities, including national minorities and Roma, as well as rights of lesbian, gay, bisexual, transgender and intersex persons;

    (b) move towards full alignment of Moldova with the Union Common Foreign and Security Policy (CFSP), including Union restrictive measures;

    (c) fight disinformation, hybrid threats, cyberattacks and Foreign Information Manipulation and Interference, in particular by Russia, against Moldova’s sovereignty, democratic processes and institutions, as well as against the Union and its values;

    (d) move towards harmonisation of visa policies with the Union;

    (e) reinforce the effectiveness of public administration, build capacities and invest in administrative staff in Moldova; ensure access to information, public scrutiny and the involvement of civil society in decision-making processes; support transparency, accountability, structural reforms and good governance at all levels, including as regards their powers of oversight and inquiry over the distribution of and access to public funds as well as in the areas of public financial management and public procurement and State aid control; support initiatives and bodies involved in supporting and enforcing international justice in Moldova;

    (f) accelerate the transition of Moldova to sustainable, climate-neutral and inclusive economy, that is capable of withstanding competitive market pressures of the Union single market, and to a stable investment environment and reduce its strategic dependency by diversifying energy sources and by constructing new electricity interconnections with neighbouring countries in order to achieve energy security;

    (g) foster economic integration of Moldova with the Union single market, in particular through increased trade and investment flows, and resilient value chains;

    (h) support enhanced integration with the Union single market through improved and sustainable connectivity in line with trans-European networks to reinforce good neighbourly relations, as well as people-to-people contact;

    (i) accelerate the inclusive and sustainable green transition to climate neutrality by 2050, in accordance with the Paris Agreement and the Green Deal and covering all economic sectors, particularly energy, including the transition towards a de-carbonised, climate-neutral, climate-resilient and circular economy, while ensuring that investments respect the ‘do no significant harm’ principle;

    (j) promote the digital transformation and digital skills as an enabler of sustainable development and inclusive growth;

    (k) boost innovation, research, and cooperation between academic institutions and industry in support of the green and digital transitions, promoting local industries with a particular emphasis on locally based micro, small and medium-sized enterprises and start-ups;

    (l) boost quality education, training, reskilling and upskilling at all levels, with a particular focus on youth, including tackling youth unemployment, preventing brain drain and supporting vulnerable communities, including refugees, and support employment policies, including labour rights, in line with the European Pillar of Social Rights, and fighting poverty.

    (la) support communication activities to improve Moldovan citizens’ awareness of the positive impact of Union accession and understanding of the required reforms.


    Article 4

    General principles

    1. Support from the Facility shall be managed by the Commission in a manner consistent with the key principles and objectives of economic reforms set out in the EU-Moldova Association Agreement and the EU enlargement policy.

    2. Cooperation under the Facility shall be needs-based and shall promote the development effectiveness principles, namely ownership of development priorities by Moldova with a focus on clear conditionality and tangible results, inclusive partnerships with local and regional authorities, social partners and civil society organisations, as well as transparency and mutual accountability. That cooperation shall be based on an effective and efficient allocation and use of resources.

    3. The provision of macro-financial assistance shall not fall within the scope of this Facility.

    4. Support from the Facility shall be additional and complementary to the support provided under other Union programmes and instruments. Activities eligible for funding under this Regulation may receive support from other Union programmes and instruments provided that such support does not cover the same cost and that appropriate oversight and budget control is ensured. The Commission shall ensure complementarities and synergies between the Facility and other Union programmes, with a view to avoiding the duplication of assistance and double funding.

    5. In order to promote the complementarity, coherence and efficiency of their actions, the Commission and the Member States shall cooperate and shall strive to avoid duplication and ensure synergies between assistance under this Regulation and other forms of assistance, including integrated financial packages composed of both export and development financing provided by the Union, Member States, third countries, multilateral and regional organisations and entities, such as international organisations and the relevant international financial institutions, agencies and non-Union donors, in line with the established principles for strengthening operational coordination in the field of external assistance, including through enhanced coordination with Member States at local level. Such coordination at local level shall involve regular and timely consultations and frequent exchanges of information throughout the implementation of the Facility.

    5a. In order to maximise international support, it shall be possible for Member States, third countries, international organisations, international financial institutions or other sources to contribute to the implementation of the Facility. Such contributions shall be implemented in accordance with the same rules and conditions and shall constitute external assigned revenue within the meaning of Article 21(2), points (a), (d) and (e), of Regulation (EU, Euratom) 2024/2509.

    6. Activities under the Facility shall mainstream and promote democracy, human rights and gender equality, progressively align with the social, climate and environmental standards of the Union, mainstream climate change mitigation and adaptation, where relevant, disaster risk reduction, environmental protection and biodiversity conservation, including through, where appropriate, environmental impact assessments, and shall support progress towards the Sustainable Development Goals, promoting integrated actions that can create co-benefits and meet multiple objectives in a coherent way. Those activities shall avoid stranded assets, and shall be guided by the principles of ‘do no significant harm’ and of ‘leaving no one behind’, as well as by the sustainability mainstreaming approach underpinning the European Green Deal. At least 37 % of the non-repayable financial support, including provisioning, provided to investment projects approved under the Neighbourhood Investment Platform (NIP) should account to climate objectives.

    7. Moldova and the Commission shall ensure that gender equality, gender mainstreaming and the integration of a gender perspective are taken into account and promoted throughout the preparation of the Reform Agenda and the implementation of the Facility. Moldova and the Commission shall take appropriate steps to prevent any discrimination based upon gender, racial or ethnic origin, religion or belief, disability, age or sexual orientation. The Commission shall report on these measures in the context of its regular reporting under the Gender Action Plans.

    8. The Facility shall not support activities or measures which are incompatible with Moldova’s Energy and Climate Plans, their Nationally Determined Contribution under the Paris Agreement, and ambition to reach climate-neutrality by 2050 at the latest or that promote investments in fossil fuels, or that cause significant adverse effects on the environment, the climate or biodiversity, while taking into account possible transitional arrangements, in line with existing Union legislation, to mitigate energy crises.

    9. In line with the principle of inclusive partnership, the Commission shall ▌ensure, as appropriate, democratic scrutiny in the form of consultation by Moldova’s government of the parliament of Moldova as well as of relevant stakeholders, including local and regional authorities, social partners and civil society, including vulnerable groups, refugees, and all minorities and communities, as relevant, so as to allow them to participate in shaping the design and the implementation of activities eligible for funding under the Facility and in the related monitoring, scrutiny and evaluation processes, as relevant. That consultation shall seek to represent the pluralism of Moldova’s society. In addition, the Commission shall ensure that civil society in Moldova, including non-governmental organisations, is able to directly report any irregularities concerning funding or final beneficiaries to the Commission via appropriate standing channels, as well as to send to the Commission opinions on the implementation of the Reform Agenda and the evaluation of its measures by the Moldovan government.

    10. The Commission, in close cooperation with the Member States and Moldova, shall ensure the implementation of Union commitments to increased transparency and accountability in the delivery of support, including by promoting the implementation and reinforcement of internal control systems and anti-fraud policies. The Commission shall make information on the volume and allocation of support publicly available through the Scoreboard referred to in Article 24. Moldova shall publish up-to-date data on final recipients receiving Union funds for the implementation of reforms and investments under this Facility, as described in Article 20.

    Article 5

    Preconditions for Union support

    1. Preconditions for the support under the Facility shall be that Moldova upholds and respects effective democratic mechanisms, including a multi-party parliamentary system, free and fair elections, pluralistic media, meaningful engagement of the civil society, an independent judiciary and the rule of law, and guarantee respect for all human rights obligations, including the rights of persons belonging to minorities.

    2. The Commission shall monitor the fulfilment of the preconditions set out in paragraph 1 before funds, including pre-financing, are released to Moldova under the Facility and throughout the period of the support provided under the Facility taking duly into account the enlargement policy framework. The Commission shall also take into account the relevant recommendations of international bodies, such as the Council of Europe and its Venice Commission, or the Office for Democratic Institutions and Human Rights of the Organization for Security and Co-operation in Europe (OSCE) in the monitoring process.

    3. The Commission may adopt a decision concluding that some of the preconditions set out in paragraph 1 of this Article are not met, and in particular, withhold the release of funds referred to in Article 19, irrespective of whether the payment conditions referred to in Article 10 are fulfilled.


    CHAPTER II

    Financing and implementation

    Article 6

    Implementation

    1. The Facility shall be supported with resources from the Neighbourhood, Development and International Cooperation Instrument – Global Europe amounting to EUR 420 million and a maximum amount of EUR 1 500 million in loans. The amount for loans shall not constitute part of the amount of the External Action Guarantee within the meaning of Article 31(4) of Regulation (EU) 2021/947.

    2. The non-repayable financial support shall be financed for the period from 1 January 2025 to 31 December 2027 from the envelope allocated to the Neighbourhood geographic programme under Article 6(2), point (a) of Regulation (EU) 2021/947. It shall cover▌ support provided by the Union for projects approved under the NIP, as referred to in Article 18(2)and complementary support, including support to civil society organisations and technical assistance. That funding shall be implemented in accordance with Regulation (EU) 2021/947. The provisioning for loans amounting to EUR 135 million shall be covered from the NDICI-Global Europe Emerging challenges and priorities cushion in accordance with Articles 6(3) and 17 of Regulation (EU) 2021/947.

    Decisions on the release referred to in Article 19(3) for the support in the form of loans shall be adopted in the period from 1 January 2025 to 30 June 2029.

    3. The release of the Union’s assistance shall be managed by the Commission in a manner consistent with the key principles and objectives of reforms set out in the Reform Agenda. All funds, with the exception of complementary support referred to in paragraph 2, and resources referred to in paragraph 5 and the exceptional bridge financing shall be provided in twice-yearly instalments based on the completion of the necessary reforms in the specified timelines as agreed in the reform agenda and agreed in the Commission Implementing Decision.

    4. At least 25% part of the loan component released to Moldova shall be made available by Moldova to investment projects approved under the NIP, one of the regional investment platforms referred to in Article 32 of Regulation (EU) 2021/947. The Facility Agreement, referred to in Article 8, shall detail this obligation, as well as the detailed rules and principles for implementation. Failure to comply with this obligation shall trigger suspension of further operations under this Facility and recovery of said amounts from Moldova, as referred to in Article 19.

    4a  Complementary support shall correspond to at least 20 % of total non-repayable financial support as referred to in Article 6(2) and shall include measures to strengthen the administrative capacities of Moldovan authorities and other stakeholders, including local and regional authorities, social partners and civil society organisations.

    5. An amount of up to 1% of the non-repayable support referred to in paragraph 2 may be used for technical and administrative assistance for the implementation of the Facility, such as preparatory actions, monitoring, control, audit and evaluation activities, which are required for the management of the Facility and the achievement of its objectives, in particular studies, meetings of experts, training consultations with Moldova’s authorities, conferences, consultation of stakeholders, including local and regional authorities and civil society organisations, information and communication activities, including inclusive outreach actions▌insofar as they are related to the objectives of this Regulation, expenses linked to IT networks focusing on information processing and exchange, corporate information technology tools, as well as all other expenditure at headquarters and Union delegation for the administrative and coordination support required for the Facility. Expenses may also cover the costs of activities supporting transparency and of other activities such as quality control and monitoring of projects or programmes on the ground and the costs of peer counselling and experts for the assessment and implementation of reforms and investments.

    5a  Member States, third countries, international organisations, international financial institutions or other sources may provide additional financial contributions to the Facility. Such contributions shall constitute external assigned revenue within the meaning of Article 21(2), points (a), (d) and (e), of Regulation (EU, Euratom) 2024/2509. Additional amounts received as external assigned revenue within the meaning of Article 21(2) of Regulation (EU, Euratom) 2024/2509 under the relevant Union legal acts shall be added to the resources referred to in Article 6(1) and be implemented in accordance with the same rules and conditions.

    Article 7

    Rules on the eligibility of persons and entities, on the origin of supply and materials and on restrictions under the Facility

    1. By way of derogation from Article 28 of Regulation (EU) 2021/947, participation in procurement and in grant award procedures for activities financed under the Facility shall be open to international and regional organisations and to all natural persons who are nationals of, or legal persons effectively established in:

    (a) Member States, Moldova, candidate countries and contracting parties to the Agreement on the European Economic Area;

    (b) countries which provide a level of support to Moldova comparable to that provided by the Union, taking into account the size of their economy, and for which reciprocal access to external assistance in Moldova is established by the Commission.

    2. The reciprocal access referred to in paragraph 1, point (b), may be granted for a limited period of at least one year where a country grants eligibility on equal terms to entities from the Union and from countries eligible under the Facility.

    The Commission shall decide on the reciprocal access after consulting Moldova.

    3. All supplies and materials financed and procured under this Facility shall originate from any country referred to in paragraph 1, points (a) and (b), unless those supplies and materials cannot be sourced under reasonable conditions in any of those countries. In addition, the rules on restrictions laid down in paragraph 6 shall apply.

    4. The eligibility rules under this Article shall not apply to, and shall not create nationality restrictions for, natural persons employed or otherwise legally contracted by an eligible contractor or, where applicable, subcontractor except where the nationality restrictions are based on the rules provided for in paragraph 6.

    5. For activities jointly co-financed by an entity or implemented under direct management or indirect management with entities referred to in Article 62(1), first subparagraph, point (c) of Regulation (EU, Euratom) 2024/2509, the rules applicable to those entities shall also apply in addition to the rules established under this Article, including, where applicable, the restrictions provided for under paragraph 6 of this Article and duly reflected in the financing agreements and contractual documents signed with those entities.

    6. The eligibility rules and rules on the origin of supplies and materials set out in paragraphs 1 and 3 and rules on the nationality of the natural persons as set out in paragraph 4 may be restricted with regard to the nationality, geographical location or nature of the legal entities participating in award procedures, as well as with regard to the geographical origin of supplies and materials where:

    (a) such restrictions are required on account of the specific nature or objectives of the activity or specific award procedure or where those restrictions are necessary for the effective implementation of the activity;

    (b) the activity or specific award procedures affect security or public order, in particular concerning strategic assets and interests of the Union, of Member States, or of Moldova, including the security, resilience and protection of integrity of digital infrastructure, including 5G network infrastructure, communication and information systems, and related supply chains.

    7. Tender applicants and candidates from non-eligible countries may be accepted as eligible in cases of urgency or where services are unavailable in the markets of the countries or territories concerned, or in other duly substantiated cases where the application of the eligibility rules would make the realisation of an activity impossible or exceedingly difficult.

    8. In the framework of the Union’s restrictive measures, adopted on the basis of Article 29 TEU and Article 215 TFEU, no funds or economic resources may be made available, directly or indirectly, to or for the benefit of legal persons, entities or bodies subject to Union restrictive measures. Such persons and entities, and entities owned or controlled by them, shall not be supported by the Facility either directly or indirectly, including as indirect owners, sub-contractors in the supply chain or ultimate beneficiaries.

    Article 8

     Facility Agreement

    1. The Commission shall conclude a Facility Agreement with Moldova for the implementation of this Regulation setting out the obligations and payment conditions for the disbursement of funding.

    2. The Facility Agreement shall be complemented by a loan agreement in accordance with Article 15, setting out specific provisions for the management and implementation of funding provided in the form of a loan. The Facility Agreement, including any related documentation, shall be made available▌, to the European Parliament and the Council simultaneously and without delay.

    3. With the exception of bridge financing referred to in Article 17a, funding shall be granted to Moldova only after the Facility Agreement and the loan agreement have entered into force.

    4. The Facility Agreement and the loan agreement concluded with Moldova shall ensure that the obligations set out in Article 129 of Regulation (EU, Euratom) 2024/2509 are fulfilled.

    5. The Facility Agreement shall lay down the necessary detailed provisions concerning:

    (a) the commitment of Moldova to make decisive progress towards a robust legal framework to fight fraud, and establish more efficient and effective control systems, including appropriate mechanisms for the protection of whistleblowers as well as appropriate mechanisms and measures to effectively prevent, detect and correct irregularities, fraud, corruption and conflicts of interest as well as to strengthen the fight against money laundering, organised crime, misuse of public funds, terrorism financing, tax avoidance, tax fraud or tax evasion, and other illegal activities affecting the funds provided under the Facility;

    (b) the rules on the release, withholding and reduction of funds in accordance with Article 19;

    (c) the detailed rules on and the obligation of Moldova to provide part of total loan amount for projects approved under the NIP, pursuant to Art. 6(4).

    (d) the activities related to management, control, supervision, monitoring, evaluation, reporting and audit, as well as system reviews, investigations, anti-fraud measures and cooperation;

    (e) the rules on reporting to the Commission on whether and how the payment conditions referred to in Article 10 are fulfilled;

    (f) the rules on taxes, duties and charges in accordance with Article 27(9) and (10) of Regulation (EU) 2021/947;

    (g) the measures to effectively prevent, detect and correct irregularities, fraud, corruption and conflicts of interest, and the obligation for persons or entities implementing Union funds under the Regulation to notify the Commission, OLAF and, where applicable, EPPO, without delay, of suspected or actual cases of irregularities, fraud, corruption and conflicts of interest and other illegal activities affecting the funds provided under the Facility and their follow-up;

    (h) the obligations referred to in Articles 21 and 22, including the precise rules and a timeframe on collection of data by Moldova and access to it for the Commission, OLAF, the Court of Auditors and, where applicable, EPPO;

    (i) a procedure to ensure that disbursement requests for loan support fall within the available loan amount, in accordance with Article 6(1);

    (j) the right of the Commission to reduce proportionately the support provided under the Regulation and to recover any amount referred to in Article 6(1) spent to achieve the objectives of the Regulation, or to ask for early repayment of the loan, in cases of irregularities, fraud, corruption and conflicts of interest affecting the financial interests of the Union that have not been corrected by Moldova, of a reversal of qualitative or quantitative steps, or of a serious breach of an obligation provided for in the Facility Agreement;

    (k) rules and modalities for Moldova to report for the purpose of monitoring the implementation of the Facility and assessing the achievement of the objectives set out in Article 3.

    (l) the obligation for Moldova to transmit electronically to the Commission the data referred to in Article 20.


    CHAPTER III

    Reform Agenda


    Article 9

    Submission of Reform Agenda

    1. In order to receive any support under this Regulation, Moldova shall submit to the Commission a Reform Agenda for 2025-2027 based on the key principles and objectives of socio-economic and fundamental reforms set out in the EU-Moldova Association Agreement, agreed under the European Neighbourhood Policy, and the enlargement policy framework.

    2. The Reform Agenda shall provide an overarching framework to achieve the general and specific objectives set out in Article 3, setting out the reforms to be undertaken by Moldova, as well as investment areas. The Reform Agenda shall comprise measures for the implementation of reforms through a comprehensive and coherent package. In the areas of the fundamentals of the enlargement process, including the rule of law, the fight against corruption, including high-level corruption, fundamental rights and the freedom of expression, the Reform Agendas shall reflect the assessments in the enlargement policy framework.

    3. The Reform Agendas shall be consistent with the latest macroeconomic and fiscal policy framework submitted to the Commission in the context of the Economic and Financial Dialogue with the Union.

    4. The Reform Agenda shall be consistent with and support the reform priorities identified in the context of Moldova’s accession path, and in other relevant documents, the Nationally Determined Contribution under the Paris Agreement and the ambition to reach climate neutrality by 2050 at the latest.

    5. The Reform Agenda shall respect the general principles set out in Article 4.

    6. The Reform Agenda shall be prepared in an inclusive and transparent manner, in consultation with social partners and civil society organisations.

    7. The Commission shall invite Moldova to submit its Reform Agenda within three months of the entry into force of this Regulation. The Commission shall transmit Moldova’s Reform Agenda to the European Parliament and the Council as soon as it is received.


    Article 10

    Principles for financing under the Reform Agenda

    1. The Regulation shall provide incentives for the implementation of the Reform Agenda by setting payment conditions on the release of funds. Those payment conditions shall apply to funds under Article 6(1), with the exception of complementary support including support to civil society organisations and technical assistance. Those payment conditions shall take the form of measurable qualitative or quantitative steps. Such steps shall reflect progress on specific socio-economic reforms and on the fundamentals of the enlargement process linked to the achievement of the objectives of the Facility set out in Article 3, consistent with the enlargement policy framework.

    2. The fulfilment of those payment conditions shall trigger full or partial release of funds, depending on the degree of their completion.

    3. Macro financial stability, sound public financial management, transparency and oversight of the budget are general conditions for payments that shall be fulfilled for any release of funds.

    Funds under the Facility shall not support activities or measures which undermine the sovereignty and territorial integrity of Moldova.

    Article 11

    Content of the Reform Agenda

    1. The Reform Agenda shall in particular set out the following elements, which shall be reasoned and substantiated:

    (a) measures constituting a coherent, comprehensive and adequately balanced response to the objectives set out in Article 3, including structural reforms, investments, and measures to ensure compliance with preconditions referred to in Article 5, where appropriate;

    (b) an explanation of how the measures are consistent with the general principles referred to in Article 4, as well as the requirements, strategies, plans and programmes referred to in Articles 4 and 10;

    (c) an explanation of how the measures are expected to further strengthen the fundamentals of the enlargement process as referred to in Article 3(2), point (n), including the rule of law, fundamental rights and the fight against corruption;

    (d) an indicative list of investment projects and programmes intended for discussion and approval under the NIP,, including respective overall investment volumes and envisaged timelines for implementation;

    (e) an explanation of the extent to which the measures are expected to contribute to climate and environmental objectives and their compatibility with the principle ‘do no significant harm’;

    (f) an explanation of the extent to which the measures are expected to contribute to digital transformation;

    (g) an explanation of the extent to which the measures are expected to contribute to education, training and employment and social objectives;

    (h) an explanation of the extent to which the measures are expected to contribute to gender equality and the empowerment of women and girls, and the promotion of women and girls’ rights;

    (i) for the reforms and investments, an indicative timetable, and the envisaged payment conditions for the release of funds in the form of measurable qualitative and quantitative steps planned to be implemented by 31 December 2027 at the latest;

    (j) an explanation of how the measures are expected to contribute to a progressive and continuous alignment with the CFSP, including Union restrictive measures;

    (k) the arrangements for the effective monitoring, reporting and evaluation of the Reform Agenda by Moldova, including the proposed measurable qualitative and quantitative steps and relevant indicators set out in paragraph 2;

    (l) an explanation of Moldova’s system to effectively prevent, detect and correct irregularities, fraud, corruption, including high-level corruption, and conflicts of interest and to enforce State aid control rules, and the proposed measures to address existing deficiencies in the first years of the implementation of the Reform Agenda;

    (m) for the preparation and, where available, for the implementation of the Reform Agenda, a summary of the consultation process, conducted in accordance with Moldova’s legal framework, of relevant stakeholders, including Moldova’s parliament, local and regional representative bodies and authorities, social partners and civil society organisations, and how the input of those stakeholders is reflected in the Reform Agenda;

    (n) a communication and visibility plan on the Reform Agenda for the local audiences of Moldova;

    (o) any other relevant information.

    2. The Reform Agenda shall be results-based and include indicators for assessing progress towards the achievement of the general and specific objectives set out in Article 3. Those indicators shall be based, where appropriate and relevant, on internationally agreed indicators and those already available related to the Moldova’s policies. Indicators shall also be coherent, to the extent possible, with the key performance indicators included in Commission Implementing Decision approving the Reform Agendas for the Western Balkans under Regulation (EU) 2024/1449 and in the EFSD+ Results Measurement Framework.

    Article 12

    Commission assessment of the Reform Agenda

    1. The Commission shall assess the relevance, comprehensiveness and appropriateness of Moldova’s Reform Agenda or, where applicable, any amendment to that Agenda, without undue delay. When carrying out its assessment, the Commission shall act in close cooperation with Moldova, and may make observations, seek additional information or require Moldova to review or modify its Reform Agenda.

    2. As regards the objective set out in Article 11(1)(j) of this Regulation, the Commission, in accordance with Decision 2010/427/EU, shall duly take into account the role and the contribution of the EEAS.

    3. When assessing the Reform Agenda, the Commission shall take into account relevant available analytical information about Moldova, including its macroeconomic situation and debt sustainability, the justification and the elements provided by Moldova as referred to in Article 13, as well as any other relevant information such as the information listed in Article 11.

    4. In its assessment, the Commission shall consider in particular the following criteria:

    (a) whether the Reform Agenda represents a relevant, comprehensive, coherent and adequately balanced response to the objectives set out in Article 3 and elements set out in Article 11;

    (b) whether the Reform Agenda and its measures are consistent with the principles, strategies, plans and programmes referred to in Articles 4 and 11;

    (c) whether the Reform Agenda can be expected to accelerate progress towards bridging the socio-economic gap between Moldova and the Union, and thereby enhances their economic, social and environmental development and supports the convergence towards the Union’s standards, reduces inequalities and reinforces social cohesion;

    (d) whether the Reform Agenda can be expected to further strengthen the fundamentals of the enlargement process as referred to in Article 3(2), point (a);

    (e) whether the Reform Agenda can be expected to accelerate the transition of Moldova towards sustainable, climate-neutral and climate resilient and inclusive economy by improving connectivity, making progress on the twin transition of green and digital, including biodiversity, reducing strategic dependencies and boosting research and innovation, education, training, employment and skills and the wider labour market, with particular attention on youth;

    (f) whether the measures included in the Reform Agenda are compatible with the principles of ‘do no significant harm’ and of ‘leaving no one behind’;

    (g) whether the Reform Agenda appropriately addresses potential risks in compliance with preconditions and payment conditions;

    (h) whether the payment conditions proposed by Moldova are appropriate and ambitious, consistent with the enlargement policy framework, as well as sufficiently meaningful and clear to allow for the corresponding release of funds in case of their fulfilment and whether the proposed reporting indicators are appropriate and sufficient to monitor and report on the progress made towards the overall objectives;

    (i) whether the arrangements proposed by Moldova are expected to effectively prevent, detect and correct irregularities, fraud, corruption and conflicts of interest, organised crime and money laundering as well as to effectively investigate and prosecute criminal offences affecting the funds under the Facility,;

    (j) whether the Reform Agenda effectively reflects the input of relevant stakeholders, including Moldova’s parliament, local and regional representative bodies and authorities, social partners and civil society organisations.

    5. For the purpose of the assessment of the Reform Agenda submitted by Moldova, the Commission may be assisted by independent experts.

    Article 13

    Commission Implementing Decision

    1. In case of positive assessment, after informing the European Parliament and the Council, the Commission shall approve by means of an implementing decision the Reform Agenda submitted by Moldova, in accordance with Article 12 or, where applicable, of the amended Agenda submitted in accordance with Article 14. The provisions of Article 25(2) shall apply to the adoption of that implementing decision.

    2. The Commission implementing decision, referred to in paragraph 1, shall set out the reforms to be implemented by Moldova concerned, the investment areas to be supported and the payment conditions stemming from the Reform Agenda, including the timetable.

    3. The Commission implementing decision, referred to in paragraph 1, shall also lay down:

    (a) the indicative amount of overall funds available to Moldova against fulfilment of payment conditions, as referred in Article 10(1), and the scheduled instalments to be released, including pre-financing, structured in accordance with Article 11, once Moldova has achieved satisfactory fulfilment of the relevant payment conditions in the form of qualitative and quantitative steps identified in relation to the implementation of the Reform Agenda;

    (b) the breakdown by instalment of financing between loan support and non-repayable support;

    (c) the time limit by which the final payment conditions for the reforms must be completed;

    (d) the arrangements and timetable for the monitoring, reporting and implementation of the Reform Agenda, including, where appropriate, through democratic scrutiny as referred to in Article 4 as well as, where relevant, measures necessary for complying with Article 23.

    (e) the indicators referred to in Article 11(2) for assessing progress towards the achievement of the general and specific objectives set out in Article 3.

    Article 14

     Amendments to the Reform Agenda

    1. Where the Reform Agenda, including relevant payment conditions, is no longer achievable by Moldova, either partially or totally, because of objective circumstances, Moldova may propose an amended Reform Agenda. In that case, Moldova may make a reasoned request to the Commission to amend its implementing decision referred to in Article 13(1).

    2. The Commission, after informing the European Parliament and the Council, may amend the implementing decision, in particular to take into account a change of the amounts available in line with the principles under Article 19.

    3. Where the Commission considers that the reasons put forward by Moldova justify an amendment to its Reform Agenda, the Commission shall assess the amended Agenda in accordance with Article 12 and may amend the implementing decision referred to in Article 13(1) without undue delay.

    4. In an amendment, the Commission may accept timelines for payment conditions extending until 31 December 2028.

    Article 15

    Loan agreement, borrowing and lending operations

    1. In order to finance the support under the Facility in the form of loans, the Commission shall be empowered on behalf of the Union to borrow the necessary funds on the capital markets or from financial institutions in accordance with Article 224 of Regulation (EU, Euratom) 2024/2509.

    2. The Commission shall enter into a loan agreement with Moldova. The loan agreement shall lay down the maximum loan amount, the availability period and the detailed terms and conditions of the support under the Facility in the form of loans. The loans shall have maximum duration of 40 years from the date of the signature of the loan agreement. The loan agreement shall contain the amount of pre-financing and rules on clearing of pre-financing.

    In addition to and by way of derogation from Article 220(5) of the Financial Regulation, the loan agreement shall contain the amount of pre-financing and rules on clearing of pre-financing.

    2a  The Commission shall provide the European Parliament and the Council, simultaneously, with the following information:

    (a) the amount of the loan in EUR;

    (b) the average maturity of the loan;

    (c) the pricing formula, and the availability period of the loan;

    (d) the maximum number of instalments and a clear and precise repayment schedule.

    3. The loan agreement shall be made available, simultaneously and without delay, to the European Parliament and the Council.

    Article 16

    Provisioning

    1. Provisioning for the loans shall be constituted at the rate of 9 % from the envelope allocated to the emerging challenges and priorities cushion under Article 6(3) of Regulation (EU) 2021/947 and shall be used as part of provisions supporting similar risks.

    2. By way of derogation from Article 211 (2), last sentence, of the Financial Regulation, the provisioning shall be paid progressively and fully constituted at the latest when the loans are fully disbursed.

    3.  The provisioning rate shall be reviewed at least every three years from the date of application of this Regulation. The Commission is empowered to adopt delegated acts in accordance with Article xx [on exercise of the delegation] of this Regulation to amend the provisioning rates, following the principles laid down in Article 214(2) of Regulation (EU) 2024/2509.


    Article 17

    Pre-financing

    1. Following the submission of the Reform Agenda to the Commission, Moldova may request the release of a pre-financing of up to 20 % of the total amount foreseen under this Facility in accordance with Article 6(1), after deduction of complementary support, including support to civil society organisations and technical assistance, and provisioning for loans. Financing under this Article may be granted in addition to and during the same period of exceptional bridge financing granted under Article 17a.

    2. The Commission may release the requested pre-financing after the adoption of its implementing decision referred to in Article 13 and the entry into force of the Facility Agreement and of the loan agreement referred to in Articles 8 and 15 respectively. The funds shall be released in accordance with Article 19(3), first sentence, and subject to the respect of the preconditions set out in Article 5.

    3. The Commission shall decide on the timeframe for the disbursement of the pre-financing, which may be disbursed in one or more tranches.

    Article 17a

    Exceptional bridge financing


    1. Without prejudice to Article 17, if the Facility Agreement is not signed or the Reform

    Agenda is not adopted by 1 May 2025, the Commission may decide to provide limited, exceptional support to Moldova in the form of loans for a period of up to 4 months starting from [the date of entry into force of the Regulation], subject to satisfactory progress on the preparation of the Reform Agenda, subject to conditions to be agreed in a Memorandum of Understanding (MoU) between the Commission and Moldova, to the respect of the precondition set out in Article 5(1), to compliance with Article 6 and to available funding.


    2.   The MoU shall in particular establish policy conditions, indicative financial planning and the reporting requirements, proportionate to the duration of the financing. The policy conditions shall include a commitment to the principles of sound financial management with a focus on anti-corruption and anti-money laundering.


      The MoU shall be adopted and amended by means of implementing acts. Those implementing acts shall be adopted in accordance with the examination procedure referred to in Article 27.


    3.  The amount of support referred to in paragraph 1 shall not exceed EUR 50 000 000. The Commission shall enter into a loan agreement with Moldova, which shall comply as appropriate with Article 15.

    Article 18

    Implementation of investment projects under the Neighbourhood Investment Platform

    1. In order to benefit from the leverage of Union financial support to attract additional investment, investments supporting the Reform Agenda shall be implemented in cooperation with international financial institutions in the form of investment projects approved under the Neighbourhood Investment Platform.

    2. Following satisfactory fulfilment of payment conditions, the Commission will adopt a decision authorising a release of funds, as referred to in Article 19(3). This decision shall, in accordance with Article 6(1), set the amount of funds to be made available in the form of non-repayable support provided by the Union for projects approved under the NIP, and the amount of financial assistance in the form of loan support to be released to Moldova. This decision shall also set out, in accordance with the ratio set in the Facility Agreement as referred to in Article 8(5)(c), the share of this loan support to be made available by Moldova as co-financing for projects approved under the NIP.

    Article 19

    Assessment of the fulfilment of payment conditions, withholding and reduction of funds, rules on payments

    1. Twice per year, Moldova shall submit a duly justified request for the release of funds at the latest two months after the timeline set in the Commission Implementing Decision in respect of fulfilled payment conditions related to the quantitative and qualitative steps as set out in the Reform Agenda.

    2. The Commission shall assess without undue delay whether Moldova has met the preconditions set out in Article 5 and the principles for financing set out in Article 10(3) and achieved satisfactory fulfilment of the payment conditions set out in the Commission implementing decision referred to in Article 13. In case the Commission finds that payment conditions for which it had previously paid have been reversed by Moldova, the Commission will reduce future disbursements by an equivalent amount. The Commission may be assisted by experts, including experts from Member States. In the event that a request for the release of funds or a request for payment includes a step related to Chapter 32, referred to in Article 19(2), the Commission may not adopt a decision authorizing the release of funds unless it assesses such step positively.

    3. Where the Commission makes a positive assessment of the satisfactory fulfilment of all applicable conditions, it shall adopt without undue delay a decision authorising the release of funds corresponding to those conditions. In respect of those amounts, the decision shall constitute the condition referred to in Article 10.

    4. Where the Commission makes a negative assessment of the fulfilment of any conditions as per the timetable, the release of funds corresponding to such conditions shall be withheld. The withheld amounts shall be released only when Moldova has duly justified, as part of the subsequent request for release of funds, that it has taken the necessary measures to ensure satisfactory fulfilment of the corresponding conditions.

    5. Where the Commission concludes that Moldova has not taken the necessary measures within a period of 12 months from the initial negative assessment referred to in paragraph 4, the Commission shall reduce the amount of the non-repayable financial support and of the loan proportionately to the part corresponding to the relevant payment conditions. During the first year of implementation, a deadline of 24 months shall apply, calculated from the initial negative assessment referred to in paragraph 4. Moldova may present its observations within two months from the communication to them of the Commission’s conclusions.

    6. Any amount corresponding to payment conditions that have not been fulfilled by 31 December 2028 shall not be due to Moldova and shall be decommitted, or cancelled from the available amount of loan support, as appropriate.

    7. The Commission may reduce the amount of the non-repayable financial support and recover from Moldova, including by offsetting, any amount spent to achieve the objectives of the Facility, or to reduce the amount of the loan to be disbursed to Moldova or request early repayment of the loan in accordance with the loan agreement, in the event of funds unduly paid, identified cases of, or serious concerns in relation to, irregularities, fraud, corruption and conflicts of interest affecting the financial interests of the Union that have not been corrected by Moldova, or of a reversal of qualitative or quantitative steps or in cases it is found, after the payment has taken place, that steps were not satisfactorily fulfilled, or of a serious breach of an obligation resulting from the Facility Agreements or from the loan agreements-, including on the basis of information provided by OLAF or of the Court of Auditors’ reports. The Commission shall inform the European Parliament and the Council prior to taking any decision of such reductions.

    8. By way of derogation from Article 116(2) of the Financial Regulation, the payment deadline as referred to in Article 116(1), point (a), of the Financial Regulation shall start running from the date of the communication of the decision authorising the disbursement to Moldova pursuant to paragraph 3 of this Article.

    9. Article 116(5) of the Financial Regulation shall not apply to payments made as financial assistance, channelled directly to Moldova’s treasury pursuant to this Article and to Article 23 of this Regulation.

    10. Payments of the non-repayable financial support and of the loans under this Article shall be made in accordance with the budget appropriations, as set in the annual budgetary procedure, and subject to the available funding, respectively. Funds shall be paid in instalments. An instalment may be paid in one or more tranches.

    11. The amounts shall be paid following the decision referred to in paragraph 3 in accordance with the loan agreement.

    12. Payment of any amount of the support in the form of loans shall be subject to the submission by Moldova of a request for payment in the form set out in the loan agreement, , and in accordance with the provisions set out in the Facility Agreement. This shall not apply to payment of pre-financing.


    Article 20

    Transparency with regard to persons and entities receiving funding for the implementation of the Reform Agenda

    1. Moldova shall publish up-to-date data on final recipients receiving amounts of funding exceeding the equivalent of EUR 50 000 cumulatively over the period of three years for the implementation of reforms and investments under this Facility.

    2. For final recipients referred to in paragraph 1, the following information shall be published in a machine- readable format on a webpage, in order of total funds received, having due regard to the requirements of confidentiality and security, in particular the protection of personal data:

    (a) in the case of a legal person, the recipient’s full legal name and VAT identification number or tax identification number, where available, or another unique identifier established by the legislation applicable to the legal person;

    (b) in the case of a natural person, the first and last name or names of the recipient;

    (c) the amount received by the recipient and the reforms and investments under the Moldova Facility that this amount contributes to implementing.

    3. The information referred to in paragraph 2 shall not be published where disclosure risks threatening the rights and freedoms of the final recipients concerned or seriously harming their commercial interests. Such information shall be made available to the Commission.

    4. Moldova shall transmit electronically to the Commission at least once a year the data on the final recipients referred to in paragraph 1 of this Article, in a machine-readable format to be defined in the Facility Agreement, as referred to in Article 8(5)(l).


    CHAPTER IV

    Protection of financial interests of the Union


    Article 21

     Protection of the financial interests of the Union

    1. In implementing the Facility, the Commission and Moldova shall take all the appropriate measures to protect the financial interests of the Union, taking into account the principle of proportionality and the specific conditions under which the Facility will operate, the preconditions set out in Article 5(1) and conditions set out in the specific Facility Agreements, in particular regarding the prevention, detection and correction of fraud, corruption, conflicts of interest and irregularities as well as the investigation and prosecution of offences affecting the funds provided under the Facility. Moldova shall commit to progressing towards effective and efficient management and control systems and ensure that amounts wrongly paid or incorrectly used can be recovered.

    2. The Facility Agreement shall provide for the following obligations of Moldova:

    (a) to regularly check that the financing provided has been used in accordance with the applicable rules, in particular regarding the prevention, detection and correction of fraud, corruption, conflicts of interest and irregularities;

    (b) to protect whistleblowers;

    (c) to take appropriate measures to prevent, detect and correct fraud, corruption, conflicts of interest and irregularities as well as to investigate and prosecute criminal offences affecting the financial interests of the Union, to detect and avoid double funding and to take legal actions to recover funds that have been misappropriated, including in relation to any measure for the implementation of reforms and investment projects or programmes under the Reform Agenda and to take appropriate measures to treat mutual legal assistance requests by EPPO and Member States’ competent authorities concerning criminal offences affecting the funds under the Facility, where applicable and without delay;

    (d) for the purpose of paragraph 1, in particular for checks on the use of funds in relation to the implementation of reforms in the Reform Agenda, to ensure the collection of, and access to, in compliance with Union data protection principles and with applicable data protection rules, adequate data on persons and entities receiving funding, including beneficial ownership information, for the implementation of measures of the Reform Agenda under Chapter III;

    (e) to expressly authorise the Commission, OLAF, the Court of Auditors and, where applicable, EPPO to exert their rights as provided for in Article 129 of Regulation (EU, Euratom) 2024/2509.

    (ea) to include all information related to project implementation, in particular concerning performance and financial implementation, and final recipients in an interoperable information system provided by the Commission as laid down under Article 36(2)(d) of Regulation (EU, Euratom) 2024/2509.

    3. The Facility Agreement shall also provide for the right of the Commission to reduce proportionately the amount of the non-repayable financial support provided under the Facility and to recover from Moldova, including by offsetting, any amount spent to achieve the objectives of the Facility and to reduce the amount of the loan to be disbursed to the Beneficiary or request early repayment of the loan in accordance with the loan agreement, in the event of funds unduly paid, identified cases of, or serious concerns in relation to, irregularities, fraud, corruption and conflicts of interest affecting the financial interests of the Union that have not been corrected by Moldova, or in cases it is found, after the payment has taken place, that steps were not satisfactorily fulfilled, or of a serious breach of an obligation resulting from the Facility Agreement or from the loan agreement When deciding on the amount of the recovery and reduction, or the amount to be repaid early, the Commission shall respect the principle of proportionality and shall take into account the seriousness of the irregularity, fraud, corruption or conflict of interest affecting the financial interests of the Union, or of a breach of an obligation. Moldova shall be given the opportunity to present its observations before the reduction is made or early repayment is requested.

    4. Persons and entities implementing funds under the Facility shall report any suspected cases of fraud, corruption, conflicts of interest and irregularities affecting financial interests of the Union without delay, to the Commission and to OLAF.


    Article 22

    Role of Moldova’s internal systems and audit authority

    1. For the part of the Facility funding made available as financial assistance, the Commission can rely on the audit authorities established by Moldova for the purpose of controlling public expenditure. As appropriate, the Commission shall also rely on further democratic scrutiny as referred to in Article 4(9).

    2. The Reform Agenda shall prioritise in the first years of their implementation reforms related to negotiation Chapter 32, particularly on public financial management and internal control, as well as on the fight against fraud, together with Chapters 23 and 24, particularly when it comes to justice, corruption and organised crime and Chapter 8, particularly on State aid control.

    3. Moldova shall report any irregularities, including fraud, which have been the subject of a primary administrative or judicial finding, without delay, to the Commission and shall keep the Commission informed of the progress of any administrative and legal proceedings in relation to such irregularities. Such reporting shall be done by electronic means, using the Irregularity Management System, established by the Commission.

    4. The entities referred to in paragraph 1 shall maintain regular dialogue with the Court of Auditors, OLAF and, where appropriate, EPPO.

    5. The Commission may carry out detailed systems reviews of Moldova’s budget implementation based on a risk-assessment and dialogue with audit authorities, and issue recommendations for improvements in the systems.

    6. The Commission may adopt recommendations to Moldova on all cases where in its views competent authorities have not taken the necessary steps to prevent, detect and correct fraud, corruption, conflicts of interest and irregularities that have affected or seriously risk affecting the sound financial management of the expenditure financed under the Facility and in all cases where it identifies weaknesses affecting the design and functioning of the control system put in place by the those authorities. Moldova concerned shall implement such recommendations or provide a justification on why it has not done so.


    CHAPTER V

    MONITORING, REPORTING AND EVALUATION


    Article 23

    Monitoring and reporting

    1. The Commission shall monitor the implementation of the Facility and assess the achievement of the objectives set out in Article 3. The monitoring of implementation shall be targeted and proportionate to the activities carried out under the Facility Agreement, and shall be without prejudice to the reporting requirements set out under Regulation (EU) 2021/947. The indicators referred to in Article 11(2) shall be expected to contribute to the Commission’s monitoring of the Facility.

    2. The Facility Agreement referred to in Article 8 shall set out rules and modalities for Moldova to report to the Commission for the purpose of paragraph 1 of this Article.

    3. The Commission shall provide an annual report to the European Parliament and the Council on progress towards the achievement of the objectives of this Regulation. The annual report shall be complemented by presentations on the state of play of the implementation of the Facility twice per year.

    4. The Commission shall provide the annual report referred to in paragraph 3 to the Committee referred to in Article 27(1).

    5. The Commission shall report on the progress of the implementation of the Reform Agenda of Moldova in the context of the scoreboard established under Regulation (EU) 2024/1449.


    Article 24

    Facility scoreboard

    6. The Commission shall establish display the progress of the implementation of the Reform Agenda in the Facility scoreboard, established under Regulation (EU) 2024/1449.

    Article 25


    Evaluation of the Facility

    1. After 31 December 2027 and by 31 December 2031 at the latest, the Commission shall carry out an independent ex-post evaluation of the Regulation. That ex-post evaluation shall assess the Union contribution to the achievement of the objectives of this Regulation.

    2. The ex-post evaluation shall make use of the good practice principles of the OECD Development Assistance Committee, seeking to ascertain whether the objectives have been met and to formulate recommendations with a view to improving future actions.

    3. The Commission shall communicate the findings and conclusions of the ex-post evaluation accompanied by its observations and follow-up, to the European Parliament, the Council and the Member States. That ex-post evaluation may be discussed at the request of the European Parliament, the Council or the Member States. The results shall feed into the preparation of future programmes and actions and resource allocation. That ex-post evaluation and follow-up shall be made publicly available.

    4. The Commission shall, to an appropriate extent, associate all relevant stakeholders, including Moldova, social partners, civil society organisations, in the evaluation process of the Union’s funding provided under this Regulation, and may, where appropriate, seek to undertake joint evaluations with the Member States and other partners with close involvement of Moldova.


    Article 26

    Reporting by Moldova in the context of the Economic and Financial Dialogue

    1. The beneficiary shall report once a year in the context of the Economic and Financial Dialogue on the progress made in the achievement of the reform-related part of its Reform Agenda.


    Article 26a


    Parliamentary oversight and scrutiny over the Facility


    1. The Commission shall report to the competent committees of the European Parliament on the state of progress in the implementation of the Facility and the Reform Agenda. The Commission shall provide the European Parliament with written information on:


    (a) the state of progress in the implementation of the Facility, in particular the Reform Agenda and related investments and reforms, as well as the Facility Agreement;

    (b) the assessment of the Reform Agenda, and any amendments thereof;

    (c) the main findings of the report referred to in Article 23(3);

    (d) payment, withholding and reduction procedures, where applicable, including any observation presented to ensure a satisfactory fulfilment of the conditions;

    (e) the withholding and suspension of payments as well as the reduction of funds, including any observation presented and remedial measures taken by the beneficiary to ensure a satisfactory fulfilment of the payment conditions;

    (f) any other relevant elements in relation to the implementation of the Facility.

    2.  The regular dialogue between the European Parliament and the Commission shall take place at least once a year, in addition to ad-hoc meetings responding to sudden developments in the country. Ahead of each dialogue, the Commission shall provide the Parliament with information referred to in paragraph 1. The Facility scoreboard referred to in Article 24 may serve as a basis for the dialogue.

    3.  The European Parliament may express its views in resolutions as regards the matters referred to in paragraph 1 and the Commission shall take those views into account.


    CHAPTER VI

    FINAL PROVISIONS


    Article 27

    Committee procedure

    1. The Commission shall be assisted by the Committee, established by the Regulation (EU) 2021/947.

    2. Where reference is made to this paragraph, Article 5 of Regulation (EU) No 182/2011 shall apply.

    3. For implementing acts referred to in Articles 13(1) and 14(2), where the committee delivers no opinion, the Commission shall not adopt the draft implementing act and Article 5(4), third subparagraph, of Regulation (EU) No 182/2011 shall apply.


    Article 28

    Information, communication and publicity

    1. Without prejudice to the requirements set out under Regulation (EU) 2021/947, the Commission shall engage in communication activities to ensure the visibility of the Union funding for the financial support envisaged in the Reform Agenda, including through joint communication activities with Moldova. The Commission shall ensure that support under the Facility is communicated and acknowledged through a funding statement. Actions financed under the Facility shall be carried out in accordance with communication and visibility requirements in Union-financed external actions and in other relevant guidelines.

    2. The recipient of Union funding shall actively acknowledge the origin and ensure the visibility of the Union funding, including, where applicable, by displaying the emblem of the Union and an appropriate funding statement that reads ‘funded by the European Union’, in particular when promoting the actions and their results, by providing coherent, effective and proportionate targeted information to multiple audiences, including the media and the public.

    3. Information, communication and publicity shall be provided in accessible format.

    Article 29

    Entry into force

    This Regulation shall enter into force on the day following that of its publication in the Official Journal of the European Union.

    This Regulation shall be binding in its entirety and directly applicable in all Member States.

    Done at Brussels,

    For the European Parliament For the Council

    The President The President
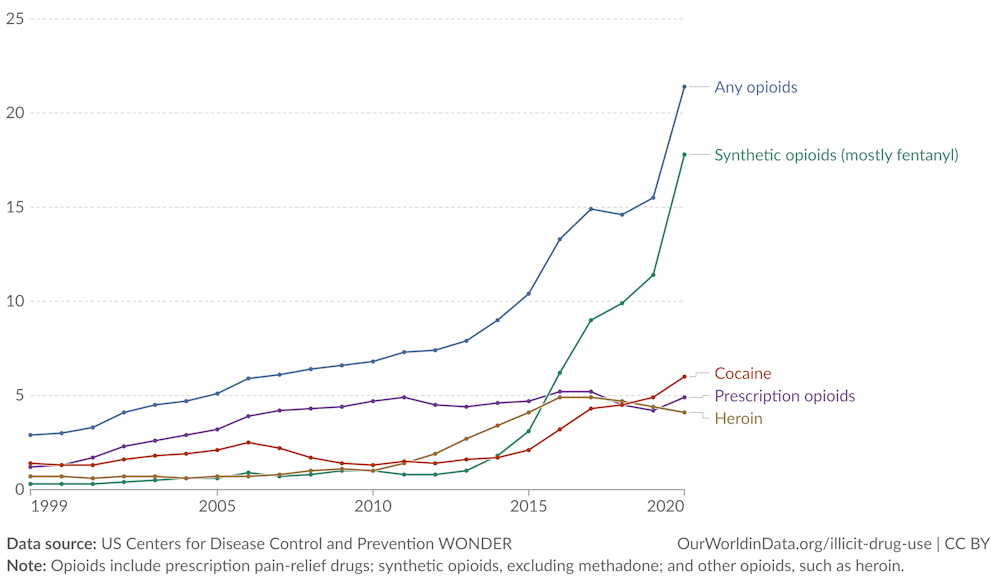


    MIL OSI Europe News

  • MIL-OSI Europe: Press release – “Europe must be responsible for its own security”, Metsola tells EU leaders

    Source: European Parliament

    At the informal European Council meeting on defence, the European Parliament President Metsola outlined her vision on how Europe can and must strengthen its own security and defence.

    “More action, more financing and more cooperation”, must be the EU’s goals, she argued.

    First, we need to do more to protect Europe.”

    “Russia can still produce more weapons in three months than we can in twelve. We need to do more, much more, to ramp up defence production and increase our defence industrial readiness. We can do all this in a way that respects the constitutional specificities of Member States. The best investment in European security is investing in the security of Ukraine.”

    “Second, we need to do more to finance this protection.”

    “Investing in security, is not just about protection – it is about boosting European competitiveness, driving growth, creating quality high-skilled jobs and powering everyday breakthroughs that improve how we live, work and connect.

    “Public funding can take us far but we know it will not be enough. This makes mobilising private capital essential. When it comes to the EIB’s mandate, the European Parliament has long emphasised the need to maximise its capacity to leverage private funding for the security and defence sector.”

    “The real incentive lies in addressing fragmentation within our markets. Different rules, standards, and systems are putting up barriers and risk holding us back. It makes no sense for Europe to have 178 different weapons systems, when the United States has 30.”

    “Third, we need to coordinate better.”

    “Fragmentation costs us billions: between 25 and 75 billion Euro are lost due to duplication and inefficiencies. The answer to this is staring us right in the face. Now is the time to move forward with a single market for defence.”

    “Defence – Trade – Political reality. The expectation on us is high. We must be ready to respond. Effectively, robustly – even drastically. Europe must be responsible for its own security. No one else will do this for us.”

    Read the full speech

    MIL OSI Europe News

  • MIL-OSI Europe: RECOMMENDATION on the draft Council decision on the renewal of the Agreement on cooperation in science and technology between the European Community and Ukraine – A10-0007/2025

    Source: European Parliament

    DRAFT EUROPEAN PARLIAMENT LEGISLATIVE RESOLUTION

    on the draft Council decision on the renewal of the Agreement on cooperation in science and technology between the European Community and Ukraine

    (COM(2024)0438 – C10‑0196/2024 – 2024/0240(NLE))

    (Consent)

    The European Parliament,

     having regard to the draft Council decision (14848/2024),

     having regard to the Council Decision 2003/96/EC of 6 February 2003 concerning the conclusion of the Agreement for scientific and technological cooperation between the European Community and Ukraine[1],

     having regard to the request for consent submitted by the Council in accordance with Article 186 and Article 218(6), second subparagraph, point (a)(v) of the Treaty on the Functioning of the European Union (C10‑0196/2024),

     having regard to Rule 107(1) and (4), and Rule 117(7) of its Rules of Procedure,

     having regard to the recommendation of the Committee on Industry, Research and Energy (A10-0007/2025),

    1. Gives its consent to the renewal of the agreement;

    2. Instructs its President to forward its position to the Council, the Commission and the governments and parliaments of the Member States and of Ukraine.

    EXPLANATORY STATEMENT

    Ukraine has a long tradition of science and technology excellence and despite the difficulties of the last years and Russia’s unlawful and unprovoked war of aggression, Ukraine still has first class science and scientists, and remains an important science, technology and innovation (STI) actor in the neighbourhood of the Union. Cooperation between the Union and Ukraine has traditionally been very active notably in the fields of advanced/new materials, IT-technology, physics and astronomy, engineering, agricultural technology, nanotechnology, biotechnology and their applications across various sectors such as aviation, energy, and biomedicine, in particular immunotherapies for cancer.


    The ‘Agreement on cooperation in science and technology between the European Community and Ukraine’ was signed in Copenhagen on 4 July 2002 and was concluded originally until 31 December 2002. Article 12 point (b) of the Agreement provides for a possibility of renewal by common agreement between the Parties for additional periods of five years. The Agreement has been renewed four times: in 2003, 2011, 2015 and 2020.


    The renewal of the Agreement for an additional period of five years is in the mutual interest of both Parties to the Agreement in order to continue facilitating cooperation between the EU and Ukraine in common science and technology (S&T) priority areas leading to mutual benefits as laid out in Article 4 of the Agreement.


    The substance of the proposed decision is to extend the existing Agreement. It will in all other regards be identical to that of the content of the current Agreement.


    The content of the Agreement will remain unchanged and will not create new or additional rights and obligations for either of the Parties, but instead it will extend in time the legal regime already existing between the Parties in the field of S&T cooperation.


    For the reasons stated above, the Rapporteur believes that it is in the Union’s interest to renew the ‘Agreement on cooperation in science and technology between the European Community and Ukraine’ for a new period of five years.


    ANNEX: ENTITIES OR PERSONS FROM WHOM THE RAPPORTEUR HAS RECEIVED INPUT

    The rapporteur declares under his exclusive responsibility that he did not receive input from any entity or person to be mentioned in this Annex pursuant to Article 8 of Annex I to the Rules of Procedure.

    PROCEDURE – COMMITTEE RESPONSIBLE

    Title

    Renewal of the Agreement on cooperation in science and technology between the European Community and Ukraine

    References

    14848/2024 – C10-0196/2024 – 2024/0240(NLE)

    Date of consultation or request for consent

    20.11.2024


    Committee(s) responsible

    ITRE


    Rapporteurs

     Date appointed

    Borys Budka

    3.12.2024


    Simplified procedure – date of decision

    3.12.2024

    Date adopted

    29.1.2025


    Result of final vote

    +:

    –:

    0:

    77

    1

    0

    Members present for the final vote

    Wouter Beke, Hildegard Bentele, Michael Bloss, Paolo Borchia, Borys Budka, João Cotrim De Figueiredo, Raúl de la Hoz Quintano, Elena Donazzan, Matthias Ecke, Christian Ehler, Sofie Eriksson, Jan Farský, Lina Gálvez, Jens Geier, Nicolás González Casares, Giorgio Gori, Bart Groothuis, Elisabetta Gualmini, András Gyürk, Niels Flemming Hansen, Eero Heinäluoma, Ivars Ijabs, Diana Iovanovici Şoşoacă, Fernand Kartheiser, Seán Kelly, Rudi Kennes, Sarah Knafo, Ondřej Knotek, Michał Kobosko, Ondřej Krutílek, Eszter Lakos, Isabella Lövin, Yannis Maniatis, Sara Matthieu, Eva Maydell, Marina Mesure, Jana Nagyová, Dan Nica, Angelika Niebler, Ville Niinistö, Mirosława Nykiel, Daniel Obajtek, Thomas Pellerin-Carlin, Tsvetelina Penkova, Virgil-Daniel Popescu, Jüri Ratas, Julie Rechagneux, Aura Salla, Jussi Saramo, Paulius Saudargas, Benedetta Scuderi, Anna Stürgkh, Marcin Sypniewski, Beata Szydło, Dario Tamburrano, Matej Tonin, Isabella Tovaglieri, Filip Turek, Yvan Verougstraete, Mariateresa Vivaldini, Andrea Wechsler, Angelika Winzig, Auke Zijlstra

    Substitutes present for the final vote

    René Aust, Per Clausen, Pietro Fiocchi, Hanna Gedin, Radan Kanev, Rihards Kols, Marion Maréchal, Jutta Paulus, Massimiliano Salini, Davor Ivo Stier, Dimitris Tsiodras, Brigitte van den Berg, Marion Walsmann

    Members under Rule 216(7) present for the final vote

    Raffaele Topo, Marianne Vind

    Date tabled

    31.1.2025


    MIL OSI Europe News

  • MIL-OSI United Kingdom: PM meeting with Secretary General of NATO Mark Rutte: 3 February 2025

    Source: United Kingdom – Executive Government & Departments

    The Prime Minister met NATO Secretary General Mark Rutte in Brussels this afternoon. 

    The Prime Minister met NATO Secretary General Mark Rutte in Brussels this afternoon. 

    The leaders had a constructive discussion about the scale of the defence and security challenge facing Europe as a result of Putin’s relentless campaign of destruction and sabotage.

    The Prime Minister restated his unwavering commitment to NATO as the cornerstone of our security. 

    The NATO Secretary General commended the UK’s ongoing contribution to Ukraine’s fight, and both agreed that all allies need to step up and shoulder more of the burden to keep the pressure on Putin.

    The Prime Minister updated the NATO Secretary General on his recent visit to Ukraine, commending the ongoing bravery of the soldiers risking their lives to defend their sovereignty. 

    Ahead of his attendance at the Informal European Council meeting this evening, the Prime Minister updated on his desire to see a stronger UK-EU security partnership to tackle these threats, which will increase co-operation and bolster NATO further. 

    The two leaders agreed to stay in close contact.

    Updates to this page

    Published 3 February 2025

    MIL OSI United Kingdom

  • MIL-OSI United Kingdom: Press release: PM meeting with Secretary General of NATO Mark Rutte: 3 February 2025

    Source: United Kingdom – Prime Minister’s Office 10 Downing Street

    The Prime Minister met NATO Secretary General Mark Rutte in Brussels this afternoon. 

    The Prime Minister met NATO Secretary General Mark Rutte in Brussels this afternoon. 

    The leaders had a constructive discussion about the scale of the defence and security challenge facing Europe as a result of Putin’s relentless campaign of destruction and sabotage.

    The Prime Minister restated his unwavering commitment to NATO as the cornerstone of our security. 

    The NATO Secretary General commended the UK’s ongoing contribution to Ukraine’s fight, and both agreed that all allies need to step up and shoulder more of the burden to keep the pressure on Putin.

    The Prime Minister updated the NATO Secretary General on his recent visit to Ukraine, commending the ongoing bravery of the soldiers risking their lives to defend their sovereignty. 

    Ahead of his attendance at the Informal European Council meeting this evening, the Prime Minister updated on his desire to see a stronger UK-EU security partnership to tackle these threats, which will increase co-operation and bolster NATO further. 

    The two leaders agreed to stay in close contact.

    Updates to this page

    Published 3 February 2025

    MIL OSI United Kingdom

  • MIL-OSI Global: Addicted: how the world got hooked on illicit drugs – and why we need to view this as a global threat like climate change

    Source: The Conversation – UK – By Ian Hamilton, Honorary Fellow, Department of Health Sciences, University of York

    Alex Solyanik/Shutterstock

    It has taken decades for some to accept the devastating effects of climate change on our planet. Despite scientific evidence that was available years ago, many people were reluctant to make the connection between increasing use of fossil fuels, rising global temperatures and devastating weather events.

    A key reason for this reluctance is the dislocation of cause and effect, both in time and geography. And here there are clear parallels with another deadly human activity that is causing increasing levels of suffering across the planet: the production, trafficking and consumption of illicit drugs. Here are some troubling “highlights” from the UN’s latest World Drugs Report:

    Cocaine production is reaching record highs, with production climbing in Latin America coupled with drug use and markets expanding in Europe, Africa and Asia.

    Synthetic drugs are also inflicting great harm on people and communities, caused by an increase in methamphetamine trafficking in south-west Asia, the near and Middle East and south-eastern Europe, and fentanyl overdoses in North America.

    Meanwhile, the opium ban imposed by the de facto authorities in Afghanistan is having a significant impact on farmers’ livelihoods and incomes, necessitating a sustainable humanitarian response.

    The report notes how organised criminal groups are “exploiting instability and gaps in the rule of law” to expand their trafficking operations, “while damaging fragile ecosystems and perpetuating other forms of organised crime such as human trafficking”.


    Illicit drug use is damaging large parts of the world socially, politically and environmentally. Patterns of supply and demand are changing rapidly. In our new longform series Addicted, leading drug experts bring you the latest insights on drug use and production as we ask: is it time to declare a planetary emergency?


    At every stage of the process of producing drugs such as cocaine, there are not only societal impacts but environmental ones too. An example of the interconnected relationship between climate change and drugs is demonstrated in the use of land.

    Demand for cocaine has grown rapidly across many western countries, and meeting this can only be met by changing how land is used. Forests are cleared in South America to make way for growing coca plants. The refinement of coca into cocaine involves toxic chemicals that pollute the soil and nearby watercourses. This in turn compromises those living in these areas as access to clean water and fertile land is reduced.

    Until this is reversed, these local communities will not be able to cultivate the land to earn an income or rely on water sources to live. And each year, some of their number will add to the hundreds of thousands of people around the world who die, directly or indirectly, as a result of illicit drug use.

    People in the world with drug use disorders (1990-2021)


    Our World in Data, CC BY

    Having spent most of my career researching the human toll of drug use at almost every stage of the supply and consumption chain, I believe a complete shift in the way we think about the world’s drug problem is required.

    We already have many years of evidence of the ways that drugs – both natural and (increasingly) synthetic – are destabilising countries’ legal and political institutions, devastating entire communities, and destroying millions of lives. My question is, as with climate change, why are we so slow to recognise the existential threat that drug use poses to humanity?

    The disconnect between users and producers

    For decades, problems with drugs have been viewed as a mainly western issue, affecting Europe, North America and Australasia in terms of drug taking. This perception was fostered in part by US president Richard Nixon’s “war on drugs” announcement in June 1971, when he declared drug abuse to be “public enemy number one”.

    This western-centric focus has come at a cost – we still have little data and information about drug use and problems in Africa, for example. But we are beginning to see how far drugs and their associated devastation has reached beyond traditional western borders.

    Deaths attributed to illicit drug use (2021):


    Our World in Data, CC BY

    Illicit drug use has increased by 20% over the past decade, only partly due to population growth. Almost 300 million people are estimated to consume illicit drugs regularly, with the three most popular being cannabis (228 million users), opioids (60 million) and cocaine (23 million). According to the UN report:

    The range of drugs available to consumers has expanded, making patterns of use increasingly complex and polydrug use a common feature in most drug markets. One in 81 people (64 million) worldwide were suffering from a drug use disorder in 2022, an increase of 3% compared with 2018.

    There are multiple harmful consequences of drug use. The largest global burden of disease continues to be attributed to opioids, use of which appears to have remained stable at the global level since 2019, in contrast to other drugs.

    In the same way that climate change has threatened whole populations, so too have drugs. Yet many of us remain disconnected from how they are produced and distributed – and the misery they cause throughout the supply chain, all over the world.

    The production of cocaine, for example, is associated with violence and exploitation at every stage of the manufacturing process. Death threats to farmers and unwilling traffickers have all increased in parallel with the growing demand for cocaine in the US and Europe.

    Global drug use disorder deaths by substance (2000-21):


    Our World in Data, CC BY

    Organised crime groups not only supply and distribute drugs but also trade in people, whether for the commercial sex trade or other forms of modern slavery. This makes sense as the infrastructure and contacts to move drugs are similar to those used to move humans across borders and even continents. Yet many cocaine users are oblivious – wilfully or otherwise – of the violence associated with how this drug is supplied to them. As the UK National Crime Agency points out:

    Reducing demand is another critical factor in reducing the supply of illegal drugs. Many people see recreational drug use as a victimless crime. The reality is that the production of illegal drugs for western markets has a devastating impact in source countries in terms of violence, exploitation of vulnerable and indigenous people and environmental destruction.

    While some of the suffering associated with the production of drugs like cocaine makes the headlines, it’s often overshadowed by the glamorisation of criminal drug gangs in films and on TV. To the extent that people worry about the impact of drugs, it’s usually focused on those in our immediate communities, such as people dependent on heroin who are sleeping rough and vulnerable to exploitation. But there have already been other victims before the drug reaches our streets.

    Shifts in the global supply chain

    Tracking heroin routes demonstrates the way that drug supply is an international effort which affects every community on its journey, from the Afghan farmer to officials who are bribed so the drug can cross borders or be let through ports without being seized, to the person injecting or smoking the finished product.

    Much of Europe’s heroin is produced in Afghanistan by small farming operations growing opium, which is then transformed into the drug. Most Afghan farmers are simply surviving growing the crop, and don’t reap significant wealth from their harvest. It is those supplying and distributing the opium as heroin who can make serious money from it.

    Meanwhile, following the return of the Taliban to power in Afghanistan in August 2021, those farmers’ livelihoods have faced a new threat.

    The Taliban is ideologically opposed to the production of opium. Soon after assuming control, its leaders issued a decree banning farmers from growing opium. They have enforced this by destroying crops when farmers have ignored the ban – although there is still believed to be a significant stockpile of heroin in the country, meaning that as yet, there has not been a big impact on supply to Europe and the UK. But this could change amid the emergence of more deadly synthetic alternatives, including nitazenes and other new synthetic opioids.

    Heroin trafficking flows based on reported seizures (2019-22):


    UN World Drug Report, CC BY

    Either way, the drug gangs who traffic heroin won’t worry about the opium farmers’ wellbeing. As so often happens with changes in the availability of illicit drugs, when there is a shortage, these groups prove adaptable and nimble at providing alternatives quickly.

    While gathering intelligence about organised crime gangs is difficult and potentially dangerous, the European Union Drugs Agency (EUDA) has provided some insights about who these groups are and how they operate. The Netherlands remains an important hub for the distribution of heroin, with several Dutch criminal groups involved in importing and distributing heroin from Afghanistan.

    But others are involved too: the EUDA’s intelligence shows that criminal networks with members from Kurdish background are central to the wholesale supply and have control over many parts of the supply chain. These professional, well-organised groups have established legal businesses throughout the route of supply that facilitate their illicit activities – largely along the Balkan route with hubs in Europe.

    Intermediate & final recipients of heroin shipments (2019-22):


    UN World Drug Report, CC BY

    Unlike these organised crime gangs, governments and law enforcement appear to respond to emerging threats slowly and lack the flexibility and ingenuity that the gangs repeatedly demonstrate.

    As drug detection techniques have improved, organised crime has shown how inventive it can be. Taking advantage of the COVID-19 pandemic, dealers used consignments of surgical masks to conceal large quantities of cocaine being trafficked to China and Hong Kong from South America.

    And as western markets for cocaine become saturated, organised crime gangs have exploited new markets in Asia, where cocaine seizures, a proxy for use of cocaine, have increased. But the shifting landscape is also reflected in changes in consumption, with use of the synthetic stimulant methamphetamine growing rapidly in Asia – reflected in record levels of seizures in the region in 2023.

    Main methamphetamine trafficking flows (2019-22):


    UN World Drug Report, CC BY

    For the organised crime gangs, production and supply of synthetic drugs is in many ways easier, as it is not reliant on an agricultural crop in the way that heroin and cocaine are and can be manufactured locally. This reduces the distribution logistics and distance needed for an effective supply chain. According to the UN Office on Drugs and Crime, organised crime gangs are exploiting gaps in law enforcement and state governance to both traffic large volumes of drugs and expand their production in the region.

    Where there is destabilisation, there is opportunity for those who seek to profit from drug addiction. In Syria, Russia and Ukraine, war has made some people very rich.

    Syria and Russia: the new drug hotspots

    The wars in Syria and Ukraine bear testament to the way drugs provide solutions to people who are experiencing the worst of times – and to governments that are ready to exploit evolving situations.

    As the war in Syria progressed, the Bashar Al-Assad regime actively developed a strategy to dominate the captagon market in the Middle East and North Africa. First produced in the 1960s in Germany to treat conditions such as attention deficit disorders and narcolepsy and other conditions, captagon is a stimulant that staves off hunger and sleep, making it ideal for military use – particularly in countries where food supplies are inconsistent. It has been referred to as the “drug of jihad” used by Islamic fighters in the region.

    As the war progressed in Syria, the country and its leader became increasingly isolated, its economy crashed creating the perfect conditions to develop the trade in captagon. Rather than drug production leading to the collapse of law and order, it was the other way round.

    Isolated by the west and with a historically strained relationship with its neighbours including Saudi Arabia, the Assad regime – under the guidance, reportedly, of Assad’s brother Maher al-Assad– ruthlessly positioned itself as the world’s main producer and distributor of this drug, then used this position to leverage its influence and try to reintegrate into the Arab world.

    Video by TRT World.

    Captagon also provided much-needed revenue for the Assad regime. The drug was estimated to be worth US$5.7 billion annually to the Syrian economy – at a time when western governments have placed severe sanctions on the country, restricting its ability to raise revenue. Saudi Arabia was one of the main countries being supplied captagon by Syria. Until the fall of Assad, it was the senior leadership in Syria that controlled the supply and distribution of the drug – giving rise to the label “the world’s largest narco state”.

    The Assad government achieved this position by making captagon good value – a viable alternative to alcohol in terms of price and for those who don’t drink. Exploiting many of its own citizens, the regime encouraged individuals and businesses to participate in manufacturing and distributing the drug.

    The fall of Assad and his hurried escape to Russia left the rebel fighters to pick up vast hauls of captagon and other drug ingredients. “We found a large number of devices that were stuffed with packages of captagon pills meant to be smuggled out of the country. It’s a huge quantity,” one fighter belonging to the Hayat Tahrir al-Sham (HTS) group told the Guardian. What this will do to drug production and supply in the region is unclear.


    Read more:
    What is the drug captagon and how is it linked to Syria’s fallen Assad regime?


    While the latest UN World Drug Report highlights “a rapid increase in both the scale and sophistication of drug trafficking operations in the region over the past decade”, it goes on to highlight that “one of the most striking changes worldwide in drug trafficking and drug use over the past decade has taken place in Central Asia, Transcaucasia [Armenia, Azerbaijan and Georgia] and eastern Europe”, where there has been a shift “away from opiates, mostly originating in Afghanistan – towards the use of synthetic stimulants, notably cathinones … There is hardly any other region where cathinones play such a significant role.”

    This is part of “a groundbreaking shift in the global drug trade, pioneered in Russia and now spreading globally,” according to the Global Initiative Against Transnational Organized Crime. This shift is changing the nature of drug sales, using “darknet markets and cryptocurrency for anonymous transactions, allowing buyers to retrieve drugs from hidden physical locations or ‘dead drops’, rather than direct exchanges.”

    The rise of Russia’s dead drop drug trade stems from several unique national factors: restrictive anti-drug policies, strained western trade relations, and a strong technological foundation. Enabled by these conditions, the dead drop model has reshaped how drugs are distributed in Russia.

    Drug transactions now involve no face-to-face interactions; instead, orders are placed online, paid for with cryptocurrency, and retrieved from secret locations across cities within hours. This system, offering convenience and anonymity, has seen synthetic drugs – especially synthetic cathinones like mephedrone – overtake traditional imported substances like cocaine and heroin in Russia … These potent synthetic drugs are cheap, easy to manufacture, and readily distributed through Russia’s vast delivery networks.

    The report notes that this shift in drug distribution has been accompanied by rising levels of violence including punishment beatings, and a public health crisis.

    Podcast by the Global Initiative Against Transnational Organized Crime.

    Yet officially, there is very little reliable data about drug use in Russia. Under the premiership of Vladimir Putin, Russia has no sympathy with those who are dependent, viewing them as weak and without value. And its invasion of Ukraine three years ago has had ramifications for Ukraine’s users too.

    Prior to the war, Ukraine had demonstrated an increasingly progressive policy towards those who had problems with drugs, establishing treatment centers and encouraging access to treatment. Since Russia invaded Ukraine in February 2022, this strategy has been severely set back, with many people who need access to substitute treatments such as methadone unable to secure consistent supply of these drugs.

    Another global blind spot is China, where, like Russia, little is known about the extent or type of problems that drugs are causing. Both regimes are ideologically opposed to recreational or problem drug use and, as far as we know, there is no state-funded rehabilitation provided in either country; the approach is to criminalise people rather than offer health-based interventions.

    We shouldn’t be too critical as many western countries, including the UK, also need to pivot from a criminal approach to drug problems towards a health-focused one. Portugal made such a policy change several years ago, recognising that people who develop problems with drugs such as dependency need help rather than punishment.

    This radical shift in thinking has made a significant change to the way those using drugs are treated, in the main offered help and specialist support rather than being arrested and sent to jail, only to be released and then repeat the same cycle of drug use, arrest and prison.

    The evidence of this policy change is impressive: not only have drug-related deaths fallen, but population-level drug use is among the lowest in Europe. Nowhere is this policy shift more urgent than the US.

    North America: epicentre of the opioid crisis

    In the US, the synthetic opioids fentanyl and oxycodone have contributed to more than 100,000 fatal overdoses each year since 2021. While there are signs this deaths toll is at last beginning to fall, the harm and pain of addiction and overdose affects every strata of American society – as shown in moving portrayals of America’s opioid crisis such as Painkiller and Dopesick. Most fatalities are caused by respiratory depression where breathing is significantly slowed or stops altogether.

    Official trailer for Painkiller (Netflix)

    Fentanyl is an analgesic drug that is 50-100 times more potent than heroin or morphine. Where China used to be the principal manufacturer and supplier of fentanyl to the US, Mexico is now the primary source. In December 2024, Mexican authorities announced “the largest mass seizure of fentanyl pills ever made” – amounting to more than 20 million doses of fentanyl pills worth nearly US$400 million. The pills were found in Mexico’s Sinaloa state, home of the Sinaloa drug cartel and a hub of fentanyl production,

    “This is what makes us rich,” one fentanyl cook recently told the New York Times. He was scathing about the idea that Donald Trump would be able to stamp out the supply of fentanyl from Mexico to the US by threatening Mexico’s government with tariffs. “Drug trafficking is the main economy here.”

    However, the introduction of synthetic opioids to the US came not via organised crime but through a deliberate strategy of the pharmaceutical industry. Upon launching its prescription opioid painkiller OxyContin (a brand name for oxycodone) in 1996, Perdue Pharma, owned by the Sackler family, devised a plan to increase prescriptions of the drug by incentivizing and rewarding doctors to give these drugs to their patients. On a business level, this was a success; on a human level, it has been a disaster.

    As patients quickly developed tolerance to drugs such as OxyContin, they had to take higher doses to avoid withdrawal symptoms or the positive feelings it gave them. Taking more of these opiates increases the risk of accidental overdose, many of which proved to be fatal. It has also driven those dependent on drugs to the black market, and into the hands of organised drug gangs, as they seek the drugs in greater quantities.

    US overdose death rates by drug type (1999-2020):


    Our World in Data, CC BY

    Dependency on fentanyl and other opioids is all-consuming. When not using these drugs, people are entirely focused on ensuring sufficient supply of the next dose. This includes funding supply which can take people to places they thought they would never be, for example breaking the law, shoplifting or getting involved in commercial sex to make enough money to buy drugs.

    Synthetic opiates like OxyContin and fentanyl have proved to be classless, ageless and sex blind. The first-hand experience of addiction and fatalities have radically altered the way many Americans think about drugs and the problems they cause. Canada, too, is suffering a major crisis.

    Compounding this tragedy is the failure of the state to provide interventions and treatment that could have reduced fatal and non-fatal overdoses. It is only now that evidence-based interventions are beginning to be made widely available, such as access to Naloxone – a drug that can reverse the effects of opiates and potentially save a life.

    Of course, it isn’t just hospitals and health professionals that are challenged by the results of widespread use of opioids, but public services like the police and fire service. In some areas of the US, there have been so many daily overdoses that every service was called on to try and deal with it. Local mayors have made it a priority to train police and fire personnel to be trained as first responders, such is the scale of the problem.

    But it is not just in North America that we see the failure of politicians and the state to act when faced with growing problems with drugs. In the UK, where record numbers are dying because of using drugs such as heroin, the government has not invested in overdose prevention strategies. At a time when fatal overdoses increase year on year, budgets for specialist treatment have been reduced. It remains to be seen what the recently elected Labour government will do, if anything, to tackle the tragic rise in drug related fatalities.

    Death rates from opioid use disorders (2021):


    Our World in Data, CC BY

    What connects both examples from the US and UK is the attitude and perception of drug use many of us have. Drug use and the heavy use of prescription painkillers is still heavily stigmatised. Many of us still view this as something individuals bring on themselves or have a choice about.

    So, if we don’t care about what happens to people who develop problems with drugs, why should our elected representatives? In part, it is our bigotry that is enabling the lack of timely intervention, despite us possessing the knowledge and evidence of how drug harms can be minimised.

    Latin America: breakdown of the rule of law

    Under the last Conservative government, the UK Home Office asserted that people who used cocaine recreationally are supporting violence not only in the UK but in the countries that produce its raw ingredients. It’s not clear if this has made any difference to those using cocaine in the UK – personally, I doubt many people consider or are aware of how cocaine is produced or its provenance.

    Perhaps if those using cocaine, mainly in western countries, realised the extent of violence and suffering that cocaine manufacture causes they might think again. Latin America has suffered enormously, with few countries there not touched in some way by the violence and breakdown of law associated with drug production and supply. According to the latest UN World Drugs Report:

    Global cocaine supply reached a record high in 2022, with more than 2,700 tons of cocaine produced that year, 20% more than in the previous year … The impact of increased cocaine trafficking has been felt in Ecuador in particular, which has seen a wave of lethal violence in recent years linked to both local and transnational crime groups, most notably from Mexico and the Balkan countries.

    Cocaine seizures and homicide rates increased five-fold between 2019 and 2022 in Ecuador, with the highest such rates reported in the coastal areas used for trafficking the drug to major destination markets in North America and Europe.

    Cocaine trafficking flows based on reported seizures (2019-22):


    UN World Drug Report, CC BY

    As with opium production in Afghanistan, it is small-scale farmers in Colombia, Peru and Bolivia that grow the coca plant that will be turned into cocaine. Like their Afghan counterparts, they grow coca as it is more profitable than alternatives such as coffee. While it may be profitable in the short term, there are greater costs to them and their society.

    Cocaine production brings with it violence as those further up the drug production chain try to control its trade. Few parts of these societies are unscathed, from bribing local politicians through to whole regions that are controlled by organised crime. Keeping control means that the use of firearms and violence increases. Against this backdrop, it is unsurprising that basic health and social services suffer.

    So, while a coca grower may have more money, every other aspect of their life is negatively impacted. Whether it is regional or state institutions, both are compromised by the drug trade and those that control it. While this may not lead to the total collapse of law and order, it does create injustice and distorts the rule of law in many areas of Latin America and the Caribbean, where competition between gangs has also resulted in an increase in homicides.

    The impact is on all sectors of society, now and into the future. For example, while historically the role of women has been largely underrepresented in research and drug policy, the UN report recognises that this is changing:

    As women increasingly participate in economic activities, the role that women play in the drug phenomenon may become increasingly important. For example, a shift away from plant-based drug production may affect many women in rural households involved in opium poppy and coca bush cultivation.

    The UN also identifies the specific risk to young people and the drugs trade, highlighting:

    Long-term efforts to dismantle drug economies must provide socioeconomic opportunities and alternatives, which go beyond merely replacing illicit crops or incomes and instead address the root structural causes behind illicit crop cultivation, such as poverty, underdevelopment, and insecurity. They must also target the factors driving the recruitment of young people into the drug trade, who are at particular risk of synthetic drug use.

    Meanwhile, demand for treatment in Europe due to problems with cocaine has risen significantly in recent years, since 2011 there has been an 80% increase in treatment presentations. This reflects the growing number of people using cocaine and the rise in purity of the drug.

    Death rates from cocaine use disorders (2021):


    Our World in Data, CC BY

    Change is possible

    Amid what may seem to be a story of unrelenting despair and hopelessness, there are local initiatives and even a few state-wide policies that provide optimism that change is possible.

    In my roles both as clinician and scientist, I’ve often been amazed by how ingenious people can be when faced with the apparently impossible. For example, the way some people use heroin to dampen their psychotic symptoms, such as auditory and visual hallucinations – or the development of Naloxone, a drug that can temporarily reverse the effects of opioids, providing a short window for emergency services to treat people who have overdosed.

    Early in my career, I witnessed the emergence of HIV in the UK in the 1980s. The speed at which this disease spread was not matched by our ability to treat it. Our response to HIV was undoubtedly hampered by prejudice and stigma towards marginalised groups in society, namely gay men and those using drugs (particularly injecting them).

    However, unexpectedly and courageously, the Conservative government recognised those who were most at risk of contracting HIV, and organised a package of measures to contain the spread of infection. One part of this was a media campaign based on public health messaging designed to reduce the risk of contracting the disease. But the government also invested in treatment for those who had been infected and engaged with people at high risk, such as those intravenously injecting drugs.


    Read more:
    Drug consumption facilities: they’ve been around since 1986 and now Scotland has one – but do they work?


    I worked in specialist HIV clinics for those using drugs. At the time, methadone and diamorphine were provided as an alternative to heroin. Regulations and protocols that restricted the prescribing of these medical opioids were eased, so we could ensure patients attending these clinics were given sufficient oral and injectable opioids that they didn’t need to source street heroin.

    This meant they had access to medical grade opioids and, crucially, were given regular supplies of sterile injecting equipment. It was this that reduced the risk of contracting HIV, as some people would share injecting equipment when using heroin.

    This impressive policy ran counter to the Conservative party’s ideology at the time, which was to punish rather than help those using drugs like heroin. It showed me how, even with traditional mindsets, it is possible to shift policy thinking in the face of a health crisis. And make no mistake, the global drug problem is an ongoing health crisis. Today, the UN points to the risks that intravenous users of drugs still face:

    An estimated 13.9 million people injected drugs in 2022, with the largest number living in North America and East and South-East Asia … The relative risk of acquiring HIV is 14 times higher for those who inject drugs than in the wider population globally.

    There are, though, signs of positive change in the way some countries and regions are changing their drug policies. Scotland recently opened a drug consumption facility in Glasgow – a safe place for people to use their drugs, usually injecting drugs like heroin. Such spaces provide access to sterile injecting equipment, reducing the risk of blood-borne infections such as HIV or Hepatitis. At the same time, they offer the opportunity to engage with people who have not accessed traditional health services.


    Read more:
    Why Colombia sees legalising drugs as the way forward. Here’s what’s being proposed


    Portugal, as mentioned earlier, has made substantial changes to the way it approaches drug use and the problems associated with it. This policy shift since 2000 has saved lives and brought a more humane way of treating people who develop problems with drugs.

    Contrast this with the wasted effort and resources ploughed into the war on drugs – initiated by Nixon and followed by so many western governments ever since. My plea to policymakers is simple: employ the same evidence-based science you use for health issues towards drugs and problem drug use.

    Science and research can help in many ways, if given the chance. Some of it might seem radical, like providing safe drug consumption spaces. Some of it is more mundane, but vital – like tackling inequality, a clear driver of problem drug use across the world.

    But while we often look to politicians to take the lead on change, it is people – us – that really hold the solution. By far the greatest threat to people and society from drugs is ignorance and bigotry. So many lives have been lost to drugs because of shame, either as a driver of drug use or a barrier to seeking help.

    Beliefs are notoriously difficult to shift. As with climate change, the most powerful driver of change is personal experience. We know that when a family or community is affected by a drug overdose, their beliefs and perceptions change. But this is not the way any of us should want to see change happen.


    For you: more from our Insights series:

    To hear about new Insights articles, join the hundreds of thousands of people who value The Conversation’s evidence-based news. Subscribe to our newsletter.

    Ian Hamilton does not work for, consult, own shares in or receive funding from any company or organisation that would benefit from this article, and has disclosed no relevant affiliations beyond their academic appointment.

    ref. Addicted: how the world got hooked on illicit drugs – and why we need to view this as a global threat like climate change – https://theconversation.com/addicted-how-the-world-got-hooked-on-illicit-drugs-and-why-we-need-to-view-this-as-a-global-threat-like-climate-change-248401

    MIL OSI – Global Reports

  • MIL-OSI Global: North Korea: Kim Jong-un is sending a second wave of soldiers to Ukraine – here’s why

    Source: The Conversation – UK – By Jennifer Mathers, Senior Lecturer in International Politics, Aberystwyth University

    North Korea is believed to be preparing to send another group of soldiers to come to Vladimir Putin’s aid in the war in Ukraine, despite heavy combat losses already suffered by troops from the east Asian country.

    When Ukrainian forces crossed the border into the Kursk region of Russia in August 2024, Ukraine’s military commanders hoped that their surprise move would force Moscow to withdraw troops from eastern Ukraine to defend Russia’s own territory. Kyiv did not expect its troops to end up fighting North Koreans.

    Neither Moscow nor Pyongyang have officially confirmed that North Korean troops are fighting side by side with Russians. But South Korean intelligence has been reporting on their presence since October 2024, when approximately 1,500 North Korean special forces were observed to have arrived in Russia’s far eastern city of Vladivostok, initially for training.

    This group was later joined by another 10,000 or so of their comrades (some of whom are also believed to be from North Korean special forces units). They were transported nearly 7,000 kilometres across Russia to reach the combat zone.

    North Korean soldiers were first spotted fighting in the Kursk region alongside Russian forces in early December, according to the Ukrainian president, Volodymyr Zelensky. By mid-January more than 40% of the North Koreans are believed to have been killed, injured, missing or captured – with as many as 1,000 thought to have been killed. There are some reports that North Korean troops are now being pulled by from the front lines due to those losses, potentially for extra training.

    North Korea, an isolated dictatorship with few allies, is one of Russia’s most reliable suppliers of weapons, including missiles and millions of rounds of ammunition that Russia needs to continue to fight its war against Ukraine. North Korea, however, would seem to have little reason to send its own people to risk their lives in that conflict. But North Korean soldiers appear to be at the heart of a deal struck by North Korea’s supreme leader Kim Jong-un and Russian president Vladimir Putin.

    What does Putin want?

    For Putin the gains are clear. His campaign in Ukraine has received a much-needed influx of trained soldiers to shore up efforts to retake Russian territory occupied by Ukrainian forces.

    Although the numbers of North Korean troops are relatively small, their strategic deployment allows Russia to push the Ukrainians back without diverting any of its forces from their offensive operations in eastern Ukraine. Expectations are high that Donald Trump’s return to the White House could mean an end to the war – or at least a pause – sooner rather than later. This gives Putin an incentive to occupy as much Ukrainian territory as possible ahead of a ceasefire, when occupied areas are likely to form the basis of territorial settlements.

    The suggestion that Russia is not capable of maintaining its position in Ukraine and also defending its own territory without the addition of foreign troops is very revealing.

    Moscow is struggling to recruit enough of its own citizens to fight in Ukraine. This is despite offering salaries and benefits packages to prospective soldiers that are beyond generous. The lack of resistance to Kyiv’s summer incursion into Russian territory made it clear that Russia is relying upon barely trained conscripts – that is, teenage boys doing their one year of compulsory military service – to defend its borders rather than professional soldiers. And while Russia has regained control of a substantial proportion – perhaps more than 60% – of the area seized by Ukraine in the summer, this has taken nearly six months to accomplish.

    What does Kim Jong-un want?

    For Kim Jong-un, sending his soldiers to fight with Russia provides his troops with valuable experience of combat in a conflict that is rapidly defining how war will be waged in the future.

    Since the end of the Korean War (1950-53), Pyongyang has placed a high priority on maintaining a large and heavily armed standing army. After training, North Korean soldiers are mostly used for patrolling the de-militarized zone that marks its border with South Korea. Participating in Russia’s war against Ukraine provides the North Korean military with its first experience of combat in more than 70 years.

    North Korean soldiers captured in Ukraine.

    Observations from Ukrainian soldiers suggest the North Korean soldiers are courageous and determined fighters but with no experience of actual combat. The Ukrainians have described the North Koreans as relying on strategies typical of the second world war – for example advancing in large groups on foot, where they provide easy targets for artillery and drone strikes. They were also apparently bemused by the appearance of drones on the battlefield and had no idea that these objects could deliver lethal attacks.

    This degree of inexperience, together with Russia’s tactic of using the North Koreans to draw the fire of the Ukrainians and clear the way for the Russians to advance, is believed to be the reason for such high losses so soon after their deployment.

    In January the Ukrainians managed to capture two North Koreans and question them, which has provided the clearest picture so far of their experiences of fighting with the Russian armed forces. The North Korean soldiers both had false identity papers with Russian names, which is consistent with official denials of their presence. The men, who do not speak any foreign languages and had to be questioned through an interpreter, said that they had both been soldiers for several years. This supports the Ukrainians’ impression that the North Koreans are trained and disciplined. Both prisoners, however, reportedly believed they were being sent to Russia to participate in training exercises, not to fight in a war.

    Considering the heavy losses and the brutal treatment that North Korean troops have already suffered, Kim Jong-un might be expected to seek the speedy return of his soldiers rather than preparing to send more of their comrades to fight with Russia. But high casualties on the battlefield seems to be a price that North Korea’s president is willing to pay for combat experience that might give his army an edge in any future war that he fights on his own behalf.

    Jennifer Mathers does not work for, consult, own shares in or receive funding from any company or organisation that would benefit from this article, and has disclosed no relevant affiliations beyond their academic appointment.

    ref. North Korea: Kim Jong-un is sending a second wave of soldiers to Ukraine – here’s why – https://theconversation.com/north-korea-kim-jong-un-is-sending-a-second-wave-of-soldiers-to-ukraine-heres-why-248339

    MIL OSI – Global Reports

  • MIL-OSI Global: The way UK inflation is worked out is changing – and it will matter for everyone

    Source: The Conversation – UK – By Marcel Lukas, Senior Lecturer in Banking and Finance and Director of Executive Education, University of St Andrews

    1000 Words/Shutterstock

    Visit a supermarket in 2025 and you’ll see that a tub of Lurpak butter can cost £5.70. It may strike you that this represents a staggering increase from £3.65 just three years ago, so instead of paying the premium, you reach for the supermarket’s own brand at £3.80.

    This kind of switch, multiplied across millions of shopping baskets, represents a massive shift in consumer behaviour that has been largely invisible to official statistics. But that’s changing, as the UK embarks on its biggest revolution in measuring living costs since the second world war.

    The Office for National Statistics (ONS) is transforming the way it tracks inflation, moving from painstakingly checking prices to analysing millions of real purchases through supermarket scanners. Consider olive oil, the price of which surged by 47% in a year, or milk, which jumped by more than 25%. While official statistics captured these price rises, they couldn’t track how households adapted – whether by switching to cheaper alternatives, buying less, or cutting back elsewhere. This was a blind spot in our understanding of consumer behaviour.

    Currently, price collectors visit stores across the country each month, checking the prices of about 25,000 products. It’s like taking a snapshot of what’s on the shelves at a particular moment. But this system, designed decades ago, often misses the real impact of inflation on different household types in things like choosing different products or switching stores.

    This is crucial for understanding the real impact of inflation on lower-income households. These families often have less flexibility in their budgets and must make more dramatic changes to their shopping habits when prices rise. During recent periods of high inflation, many on low incomes found that official figures didn’t match their experience, which was of even higher inflation than the headline rates. And there’s a good reason why.

    Inflation statistics aren’t just academic exercises. They drive decisions that affect every aspect of our financial lives. The Bank of England uses them to set interest rates, which in turn influence mortgage payments and savings returns. Employers use them in wage negotiations. Government uses them to adjust benefits, state pensions and tax thresholds. Even commercial contracts, including mobile phone bills and rail fares, are often linked to inflation rates.

    When these numbers don’t accurately reflect price pressures, it can have serious consequences. If official figures underestimate the inflation experienced by lower-income households, benefit increases might not keep pace with their actual cost increases. Similarly, if wages don’t rise in line with real living costs, workers effectively experience a pay cut.

    The scanner data revolution

    The ONS’s new approach, to be introduced next year, will analyse around 300 million price points from supermarket scanners, covering about half of all grocery transactions in the UK. Instead of just seeing what’s on the shelf, they’ll know exactly what prices people are paying at checkouts across the country.

    This massive increase in data points – from 25,000 to 300 million – will allow for a more nuanced understanding of consumer behaviour.

    The change will also enable quicker identification of emerging price trends. After the start of the COVID pandemic and the Ukraine war, prices of certain goods changed rapidly. Scanner data could help spot these changes faster, allowing for more timely policy responses. It might also reveal regional variations in price pressures.

    Take the 2023 surge in food prices – while overall food inflation hit 19%, the impact varied dramatically across households. Current statistics would not capture lower-income families switching from fresh to frozen vegetables, or from branded to value ranges.

    In times of cost pressures, shoppers may switch from fresh produce to frozen.
    sirtravelalot/Shutterstock

    With scanner data, policymakers could spot these trends quickly and respond more precisely – perhaps by adjusting benefit payments or targeting support to specific households when essential food costs spike. Instead of waiting for quarterly surveys to reveal hardship, they will be able to see in real time how different groups are coping with price pressures.

    The ONS recently said full implementation will come in 2026, a year later than planned. While it will have the technical capability ready by March 2025, it is opting for a year of parallel running to ensure accuracy. This approach reflects how crucial these statistics are for the economy.

    It has already modernised other areas of price collection, including incorporating 40 million train fare data points and 300,000 used car prices. But grocery prices, being central to household budgets and varying significantly across different income groups, require extra attention.

    The change is coming at a crucial time. Recent years have shown how rapidly economic conditions can change and how differently these changes can affect various segments of society. The pandemic, Brexit adjustments, and global supply chain disruptions have all contributed to price pressures.

    For consumers, while the changes won’t directly lower prices, they could lead to more appropriate responses from the Bank of England, government and employers. Most importantly, it could ensure that official inflation figures better reflect the reality of the weekly shop, particularly during times of economic stress.

    The transformation of inflation statistics might seem like a technical detail, but its implications reach far beyond government offices and economic reports. It’s about ensuring that the official measures of living costs better reflect the reality experienced by millions of households across the UK. In this challenging economic environment, that’s something worth getting right.

    Marcel Lukas receives funding from the British Academy. He is the Director of Executive Education at the University of St Andrews and Fellow of the ONS. The presented views are his own and do not represent the ONS.

    ref. The way UK inflation is worked out is changing – and it will matter for everyone – https://theconversation.com/the-way-uk-inflation-is-worked-out-is-changing-and-it-will-matter-for-everyone-248514

    MIL OSI – Global Reports

  • MIL-OSI United Kingdom: Prime Minister’s remarks in Brussels: 3 February 2025

    Source: United Kingdom – Executive Government & Departments

    Prime Minister Keir Starmer’s remarks in Brussels.

    Thank you, Mark – it’s very good to be here.

    I should say it’s very good to be back here.

    And as you know, the UK’s commitment to NATO is stronger than ever –

    Because the need for NATO is clearer than ever.

    We’ve had a very good and productive discussion today…

    On how we can meet the rising threats that Russia poses across our continent…

    Including the situation, of course, in Ukraine.

    A couple of weeks ago, as you know, I was in Kyiv…

    I saw residential buildings, destroyed just days before.

    I met soldiers in the ICU…

    Recovering from really terrible burns.

    And I met children, whose parents are out there now…

    On the frontline.

    And, it’s yet another reminder…

    That this is a not a war not just in Ukraine…

    It’s a war on Ukraine…

    Against those children and their future.

    That’s why – together –

    We stand with them.

    We are all working to end this war…

    But let’s be absolutely clear –

    Peace will come through strength.

    And we must do all we can now to support Ukraine’s defence…

    And that means stabilising the front line…

    Providing the kit and the training they need.

    And that’s why, this year…

    The UK will give more military support to Ukraine than ever

    before.

    We need to see all allies stepping up – particularly in Europe.

    President Trump has threatened more sanctions on Russia…

    And it’s clear that that’s got Putin rattled.

    We know that he’s worried about the state of the Russian economy.

    So I’m here to work with our European partners on keeping up the

    pressure…

    Targeting the energy revenues and the companies supplying his

    missile factories…

    To crush Putin’s war machine.

    Because ultimately –

    Alongside our military support…

    That is what will bring peace closer.

    And we must keep working together to bolster NATO.

    And as you say, things that would have provoked utter outrage, just a few years

    ago…

    Have now become almost commonplace:

    Russian spy ships loitering off the British coast…

    A campaign of sabotage across Europe…

    Cyber-attacks, election interference, and attempted assassinations.

    Russia is seeking to destabilise our continent – target our values.

    So we should still be outraged.

    And we must harden European’s defence.

    In the UK we are proud to be a leading NATO ally…

    Part of the Forward Land Forces…            

    Helping to police our skies and patrol our seas.

    Our defence spending is of course 2.3% of GDP now…

    And we are working hard work to set the path to 2.5%…

    And NATO plans and requirements…

    As well as the principle of “NATO First”…

    Will be at the heart of our Strategic Defence Review this year.

    Across Europe, we must shoulder more of the burden now –

    Because it is our burden to carry.

    Now that’s what I’ll be discussing at the EU Council this evening.

    We want to deliver an ambitious UK-EU Security partnership…

    To bolster NATO…

    Covering military technology and R&D…

    Improving the mobility of forces across Europe…

    Protecting our critical infrastructure…

    And deepening our industrial collaboration to increase defence production.

    We can’t be commentators when it comes to matters of peace on

    our continent.

    We must lead. 

    And that is what I’m determined to do.

    Thank you so much Mark.

    Updates to this page

    Published 3 February 2025

    MIL OSI United Kingdom

  • MIL-OSI United Kingdom: Speech: Prime Minister’s remarks in Brussels: 3 February 2025

    Source: United Kingdom – Prime Minister’s Office 10 Downing Street

    Prime Minister Keir Starmer’s remarks in Brussels.

    Thank you, Mark – it’s very good to be here.

    I should say it’s very good to be back here.

    And as you know, the UK’s commitment to NATO is stronger than ever –

    Because the need for NATO is clearer than ever.

    We’ve had a very good and productive discussion today…

    On how we can meet the rising threats that Russia poses across our continent…

    Including the situation, of course, in Ukraine.

    A couple of weeks ago, as you know, I was in Kyiv…

    I saw residential buildings, destroyed just days before.

    I met soldiers in the ICU…

    Recovering from really terrible burns.

    And I met children, whose parents are out there now…

    On the frontline.

    And, it’s yet another reminder…

    That this is a not a war not just in Ukraine…

    It’s a war on Ukraine…

    Against those children and their future.

    That’s why – together –

    We stand with them.

    We are all working to end this war…

    But let’s be absolutely clear –

    Peace will come through strength.

    And we must do all we can now to support Ukraine’s defence…

    And that means stabilising the front line…

    Providing the kit and the training they need.

    And that’s why, this year…

    The UK will give more military support to Ukraine than ever

    before.

    We need to see all allies stepping up – particularly in Europe.

    President Trump has threatened more sanctions on Russia…

    And it’s clear that that’s got Putin rattled.

    We know that he’s worried about the state of the Russian economy.

    So I’m here to work with our European partners on keeping up the

    pressure…

    Targeting the energy revenues and the companies supplying his

    missile factories…

    To crush Putin’s war machine.

    Because ultimately –

    Alongside our military support…

    That is what will bring peace closer.

    And we must keep working together to bolster NATO.

    And as you say, things that would have provoked utter outrage, just a few years

    ago…

    Have now become almost commonplace:

    Russian spy ships loitering off the British coast…

    A campaign of sabotage across Europe…

    Cyber-attacks, election interference, and attempted assassinations.

    Russia is seeking to destabilise our continent – target our values.

    So we should still be outraged.

    And we must harden European’s defence.

    In the UK we are proud to be a leading NATO ally…

    Part of the Forward Land Forces…            

    Helping to police our skies and patrol our seas.

    Our defence spending is of course 2.3% of GDP now…

    And we are working hard work to set the path to 2.5%…

    And NATO plans and requirements…

    As well as the principle of “NATO First”…

    Will be at the heart of our Strategic Defence Review this year.

    Across Europe, we must shoulder more of the burden now –

    Because it is our burden to carry.

    Now that’s what I’ll be discussing at the EU Council this evening.

    We want to deliver an ambitious UK-EU Security partnership…

    To bolster NATO…

    Covering military technology and R&D…

    Improving the mobility of forces across Europe…

    Protecting our critical infrastructure…

    And deepening our industrial collaboration to increase defence production.

    We can’t be commentators when it comes to matters of peace on

    our continent.

    We must lead. 

    And that is what I’m determined to do.

    Thank you so much Mark.

    Updates to this page

    Published 3 February 2025

    MIL OSI United Kingdom

  • MIL-OSI USA: Readout of Secretary of Defense Pete Hegseth’s Call With the United Kingdom’s Secretary of State for Defence John Healey

    Source: United States Department of Defense

    Pentagon Spokesman John Ullyot provided the following readout:

    On January 31, Secretary of Defense Pete Hegseth held a call with his United Kingdom counterpart, Secretary of State for Defence John Healey. The two Secretaries committed to continuing the especially close coordination between the United Kingdom and the United States on defense issues, including our Warfighters deployed shoulder to shoulder to secure our shared interests. The two leaders discussed the need to increase Allied defense investment and industrial base capacity to strengthen NATO, as well as the situation in Ukraine and other pressing security issues.

    MIL OSI USA News

  • MIL-OSI: Outbrain Completes the Acquisition of Teads

    Source: GlobeNewswire (MIL-OSI)

    Highlights:

    • The combination will merge two open internet category leaders to create a unified omnichannel platform that delivers outcomes from branding to performance across all screens, including CTV, mobile and web. The new company will operate under the name Teads.
    • The union creates one of the largest open internet companies, with combined advertising spend of approximately $1.7 billion (FY24), reaching 2.2 billion consumers.
    • The company will unite two of the richest contextual and interest data sets on the open internet, powering an advanced AI prediction engine to optimize advertiser outcomes.
    • Outbrain CEO, David Kostman, will serve as CEO of the combined company, with Jeremy Arditi and Bertrand Quesada, former Teads CEOs, assuming the roles of Co-President, Chief Business Officer of the Americas and International respectively.
    • The two companies are preliminarily reporting a combined Ex-TAC Gross Profit of $623 million and Adjusted EBITDA of $230 million in 2024 including $65-75 million of estimated synergies1.
    • Transaction value of approximately $900 million, comprised of $625 million in cash and 43.75 million Outbrain shares.
    • Altice, selling shareholder of Teads, will nominate two out of a total of 10 board members.
    • Outbrain is providing selected preliminary results for the fourth quarter, in line with previously issued guidance in Outbrain’s November 2024 earnings call, and selected preliminary results for Teads and the combined company.

    NEW YORK, Feb. 03, 2025 (GLOBE NEWSWIRE) — Outbrain Inc. (NASDAQ: OB) today announced the closing of its acquisition of Teads, following receipt of all necessary regulatory approvals. The two companies will merge their respective branding and performance offerings to create the omnichannel outcomes platform for the open internet, and will operate under the name Teads.

    The new Teads will create one of the largest optimized supply paths on the premium open internet, with a focus on connecting curated, exclusive media environments with elevated, data-driven creative experiences. The combined company offering will be strengthened by Outbrain’s proprietary predictive technology and AI optimization. It will provide a solution for marketers to leverage a single partner to deliver concrete outcomes at every step of the marketing funnel— offering unique ways to combine advertising solutions from awareness to sales. The company’s combined data set will power expanded contextual, audience and purchase-based targeting capabilities, connecting CTV experiences to digital moments to drive measurable outcomes.

    “I am extremely excited about this new chapter in our journey. This transformative merger creates a company that directly addresses a large gap in the advertising industry: a scaled end-to-end platform that can drive outcomes, from branding to consideration to purchase, across screens,” said CEO, David Kostman.

    “Together, we are creating an extraordinary new company, combining the best of both organizations’ deep expertise in omnichannel video branding solutions and performance advertising. The new Teads’ mission is to drive lasting value with an offering that invites marketers to expect better outcomes, media owners to expect sustainable value, and consumers to expect elevated experiences. I want to thank the teams of both Outbrain and Teads, who have pioneered major advertising categories, and have built leading global companies over more than a decade. It is their innovation and commitment that have brought us to this moment and will propel us to new heights,” added Kostman.

    Co-President & Chief Business Officer, Jeremy Arditi, added: “We’re committed to creating a solution that will harness the untapped opportunity of the open internet, and allow all of its constituents to thrive. We believe that by prioritizing beautiful creative experiences, trust and transparency in media, and delivery of meaningful outcomes, we can create a stronger ecosystem that provides value for all.”

    “The merger between Teads and Outbrain makes a lot of sense strategically. We look forward to exploring the new possibilities this provides us with to reach our audiences in a new and interesting way, to deliver full funnel solutions and better business outcomes,” said Sital Banerjee, Global Head of Integrated Media, Performance Marketing, and BMI Management at Lipton Teas and Infusions.

    Key Combined Strengths

    With the completion of the combination, the new Teads will offer clients and partners:

    • Exceptional reach at great scale, across exclusive environments
      • 96 percent open internet audience reach*
      • Number one most direct supply path, as rated by Jounce**
      • Direct access to 10,000 media environment
      • Connected to the top 4 OEMs and several of the top Streaming Apps unlocking access to 50bn CTV Monthly Ad Opportunities, including unique CTV homescreen inventory
      • Proprietary code-on-page relationships with premium editorial properties globally, providing access to incremental inventory and yielding extensive audience interest and engagement insights
    • Creatives built for outcomes
      • Data-driven, beautiful creative solutions designed to connect brand moments across the marketing funnel — from CTV to editorial and beyond
      • Proven impact from unique experiences, with 74 percent higher attention for unique CTV native creative
      • Strategic Joint Business Partnerships with more than 50 of the world’s most premium brands
    • AI-powered predictive technology
      • Proprietary prediction engine, cultivated over 18+ years to drive performance outcomes, making 1 billion predictions each minute
      • 4 billion signals processed each minute via AI and machine learning
      • 50 live AI models
    • Expansive omnichannel graph, expanded on the Teads Omnichannel Graph foundation
      • The Teads Omnichannel Graph (OG), a proprietary tool extending contextual and audience-targeting capabilities into the CTV environment, will be further expanded by Outbrain engagement, interest, and conversion data
      • Extensive data signals feeding an understanding of audiences across screens, including:
        • 130,000 articles scanned per minute
        • 500,000 CTV programs enriched with data per month
        • 1 billion engagement and contextual signals processed each minute

    *According to Comscore, Media Metrix, Key Metrix, US, December 2024 for Teads.
    **According to 2024 Jounce SPO analyses, specific to Teads platform.

    Transaction Details

    Outbrain, Altice and Teads have amended the previously announced share purchase agreement, dated August 1, 2024. Under the terms of the revised agreement, Outbrain will be paying a total consideration of approximately $900 million, consisting of $625 million upfront cash and 43.75 million shares of common stock of Outbrain (valued at approximately $263 million based on the closing price of Outbrain’s common stock as of January 31, 2025, of $6.01).

    Under the revised terms, there is no deferred cash payment or convertible preferred equity component. The revised terms have meaningfully reduced the level of required debt financing and simplified the transaction structure.

    Outbrain intends to finance the transaction with existing cash resources and $625 million in committed debt financing from Goldman Sachs Bank USA, Jefferies Finance LLC and Mizuho Bank, Ltd., subject to customary funding conditions. Outbrain will also issue to Altice 43.75 million shares of common stock. Altice will nominate two directors to the board of Outbrain and will be bound by a stockholder agreement with Outbrain containing arrangements and restrictions concerning voting and disposition of the shares issued to Altice.

    Financial Highlights

    Preliminary Estimated Unaudited Financial Information for the Quarter and Year Ended December 31, 2024

    Today Outbrain is furnishing on Form 8-K selected preliminary estimated unaudited financial information for each of Outbrain and Teads on a standalone basis and on a combined company basis for the quarter and year ended December 31, 2024. Excerpts of such financial information can be found below. You are encouraged to refer to the Form 8-K and other documents filed or furnished by Outbrain with the SEC through the website maintained by the SEC at www.sec.gov.

    The Company previously announced its expectation to achieve $50 – 60 million of annual revenue and cost synergies in the second full year following completion of the acquisition, with further opportunities for expanded synergies in the following years. The Company now expects to realize approximately $65 – 75 million of annual synergies in FY 2026 with further opportunities for expanded synergies in the following years. Of this amount, approximately $60 million relates to cost synergies, including approximately $45 million of compensation related expenses. The Company plans to action approximately 70% of the compensation related expense savings during the first month post-closing. The upsize in expected synergies follows a robust integration planning process, enabling a larger and more rapid synergy capture.

    Outbrain is providing selected preliminary results for the fourth quarter and full year 2024, as follows:

    • Ex-TAC gross profit of $68.3 million for Q4 2024, and $236.1 million for FY 2024
    • Adjusted EBITDA of $17.0 million for Q4 2024, and $37.3 million for FY 2024

    For Teads, we are providing the following selected preliminary results for the fourth quarter and full year 2024, as follows:

    • Ex-TAC gross profit of $119.9 million for Q4 2024, and $386.6 million for FY 2024
    • Adjusted EBITDA of $52.2 million for Q4 2024, and $122.7 million for FY 2024

    The two companies are preliminarily reporting a combined Ex-TAC Gross Profit of approximately $623 million and Adjusted EBITDA of approximately $230 million in 2024, including $65-75 million of estimated synergies2.

    Conference Call and Webcast:
    Outbrain will host an investor conference call this morning, Monday, February 3rd at 9:00 am ET. Interested parties are invited to listen to the conference call which can be accessed live by phone by dialing 1-877-497-9071 or for international callers, 1-201-689-8727. A replay will be available two hours after the call and can be accessed by dialing 1-877-660-6853, or for international callers, 1-201-612-7415. The passcode for the live call and the replay is 13751603. The replay will be available until February 17, 2025. Interested investors and other parties may also listen to a simultaneous webcast of the conference call by logging onto the Investors Relations section of the Company’s website at https://investors.outbrain.com. The online replay will be available for a limited time shortly following the call.

    Cautionary Note About Forward-Looking Statements
    This press release contains forward-looking statements within the meaning of the U.S. federal securities laws and the Private Securities Litigation Reform Act of 1995, which statements involve substantial risks and uncertainties. These statements are based on current expectations, estimates, forecasts and projections about the industries in which Outbrain and Teads operate, and beliefs and assumptions of Outbrain’s management. Forward-looking statements may include, without limitation, statements regarding possible or assumed future results of our business, financial condition, results of operations, liquidity, plans and objectives, expected synergies and statements of a general economic or industry-specific nature. You can generally identify forward-looking statements because they contain words such as “may,” “will,” “should,” “expects,” “plans,” “anticipates,” “could,” “intends,” “target,” “projects,” “contemplates,” “believes,” “estimates,” “predicts,” “foresee,” “potential” or “continue” or the negative of these terms or other similar expressions that concern our expectations, strategy, plans or intentions, or are not statements of historical fact. The outcome of the events described in these forward-looking statements is subject to risks, uncertainties and other factors including, but not limited to: risks that the acquisition disrupts current plans and operations or diverts management’s attention from its ongoing business; the initiation or outcome of any legal proceedings that may be instituted against Outbrain or Teads, or their respective directors or officers, related to the acquisition; unexpected costs, charges or expenses resulting from the acquisition; the ability of Outbrain to successfully integrate Teads’ operations, technologies and employees; the ability to realize anticipated benefits and synergies of the acquisition, including the expectation of enhancements to Outbrain’s services, greater revenue or growth opportunities, operating efficiencies and cost savings; overall advertising demand and traffic generated by Outbrain and the combined company’s media partners; factors that affect advertising demand and spending, such as the continuation or worsening of unfavorable economic or business conditions or downturns, instability or volatility in financial markets, and other events or factors outside of Outbrain and the combined company’s control, such as U.S. and global recession concerns; geopolitical concerns, including the ongoing war between Ukraine-Russia and conditions in Israel and the Middle East; supply chain issues; inflationary pressures; labor market volatility; bank closures or disruptions; the impact of challenging economic conditions; political and policy uncertainties; and other factors that have and may further impact advertisers’ ability to pay; Outbrain and the combined company’s ability to continue to innovate, and adoption by Outbrain and the combined company’s advertisers and media partners of expanding solutions; the success of Outbrain and the combined company’s sales and marketing investments, which may require significant investments and may involve long sales cycles; Outbrain and the combined company’s ability to grow their business and manage growth effectively; the ability to compete effectively against current and future competitors; the loss or decline of one or more large media partners, and Outbrain and the combined company’s ability to expand advertiser and media partner relationships; conditions in Israel, including the ongoing war between Israel and Hamas and other terrorist organizations, may limit Outbrain and the combined company’s ability to market, support and innovate their products due to the impact on employees as well as advertisers and advertising markets; Outbrain and the combined company’s ability to maintain revenues or profitability despite quarterly fluctuations in results, whether due to seasonality, large cyclical events or other causes; the risk that research and development efforts may not meet the demands of a rapidly evolving technology market; any failure of Outbrain or the combined company’s recommendation engine to accurately predict attention or engagement, any deterioration in the quality of Outbrain or the combined company’s recommendations or failure to present interesting content to users or other factors which may cause us to experience a decline in user engagement or loss of media partners; limits on Outbrain and the combined company’s ability to collect, use and disclose data to deliver advertisements; Outbrain and the combined company’s ability to extend their reach into evolving digital media platforms; Outbrain and the combined company’s ability to maintain and scale their technology platform; the ability to meet demands on our infrastructure and resources due to future growth or otherwise; the failure or the failure of third parties to protect Outbrain and the combined company’s sites, networks and systems against security breaches, or otherwise to protect the confidential information of Outbrain and the combined company; outages or disruptions that impact Outbrain or the combined company or their service providers, resulting from cyber incidents, or failures or loss of our infrastructure; significant fluctuations in currency exchange rates; political and regulatory risks in the various markets in which Outbrain and the combined company operate; the challenges of compliance with differing and changing regulatory requirements; the timing and execution of any cost-saving measures and the impact on Outbrain and the combined company’s business or strategy; and the other risk factors and additional information described in the section entitled “Risk Factors”, and under the heading “Risk Factors” in Item 1A of Outbrain’s Annual Report on Form 10-K filed with the SEC on March 8, 2024 for the year ended December 31, 2023, Outbrain’s Form 10-Q filed with the SEC on August 8, 2024 for the period ended June 30, 2024, Outbrain’s Form 10-Q filed with the SEC on November 7, 2024 for the period ended September 30, 2024 and in subsequent reports filed with the SEC.

    Accordingly, you should not rely upon forward-looking statements as an indication of future performance. Outbrain cannot assure you that the results, events and circumstances reflected in the forward-looking statements will be achieved or will occur, and actual results, events or circumstances could differ materially from those projected in the forward-looking statements. The forward-looking statements made in this press release relate only to events as of the date on which the statements are made. Outbrain and the combined company may not actually achieve the plans, intentions or expectations disclosed in the forward-looking statements and you should not place undue reliance on the forward-looking statements. Outbrain undertakes no obligation, and does not assume any obligation, to update any forward-looking statements, whether as a result of new information, future events or circumstances after the date on which the statements are made or to reflect the occurrence of unanticipated events or otherwise, except as required by law.

    About The Combined Company
    Outbrain Inc. (Nasdaq: OB) and Teads combined on February 3, 2025 and are operating under the new Teads brand. The new Teads is the omnichannel outcomes platform for the open internet, driving full-funnel results for marketers across premium media. With a focus on meaningful business outcomes, the combined company ensures value is driven with every media dollar by leveraging predictive AI technology to connect quality media, beautiful brand creative, and context-driven addressability and measurement. One of the most scaled advertising platforms on the open internet, the new Teads is directly partnered with more than 10,000 publishers and 20,000 advertisers globally. The company is headquartered in New York, with a global team of nearly 1,800 people in 36 countries.

    For more information, visit https://thenewteads.com/.

    Media Contact

    press@outbrain.com

    Investor Relations Contact

    IR@outbrain.com
    (332) 205-8999

    Non-GAAP Reconciliations

    The following table presents the reconciliation of Gross profit to Ex-TAC gross profit, for the periods presented:

        Three Months Ended December 31, 2024   Year Ended December 31, 2024
        Outbrain   Teads   Combined   Outbrain   Teads   Combined
    Revenue   $ 234,586     $ 188,953     $ 423,539     $ 889,875     $ 617,435     $ 1,507,310  
    Traffic acquisition costs     (166,247 )     (69,091 )     (235,338 )     (653,731 )     (230,831 )     (884,562 )
    Other cost of revenue (a)     (12,277 )     (26,441 )     (38,718 )     (44,042 )     (106,414 )     (150,456 )
    Gross profit     56,062       93,421       149,483       192,102       280,190       472,292  
    Other cost of revenue (a)     12,277       26,441       38,718       44,042       106,414       150,456  
    Ex-TAC Gross Profit   $ 68,339     $ 119,862     $ 188,201     $ 236,144     $ 386,604     $ 622,748  

    ___________
    (a) Other cost of revenue for Teads is subject to accounting policy harmonization.

    The following table presents the reconciliation of net income (loss) to Adjusted EBITDA, for the periods presented:

        Three Months Ended December 31, 2024   Year Ended December 31, 2024
        Outbrain   Teads   Combined   Outbrain   Teads   Combined
    Net (loss) income   $ (167 )   $ 69,613     $ 69,446     $ (711 )   $ 89,318     $ 88,607  
    Interest expense/financial costs     699     $ 116       815       3,649       1,176       4,825  
    Interest income and other income, net     (1,522 )   $       (1,522 )     (9,209 )           (9,209 )
    Gain related to convertible debt                       (8,782 )           (8,782 )
    Other financial income and (expenses)           (13,973 )     (13,973 )           (26,404 )     (26,404 )
    Provision for income taxes     3,525       16,143       19,668       2,415       38,256       40,671  
    Depreciation and amortization     4,985       3,027       8,012       19,479       12,834       32,313  
    Share-based compensation     3,974       (28,089 )     (24,115 )     15,461             15,461  
    Severance costs           393       393       742       1,593       2,335  
    Merger and acquisition costs     5,469       4,930       10,399       14,256       5,890       20,146  
    Adjusted EBITDA, excluding synergies   $ 16,963     $ 52,160     $ 69,123     $ 37,300     $ 122,663     $ 159,963  
    The Company expects to realize approximately $65 – 75 million of annual synergies in the second full year following completion of the Acquisition. (midpoint)                         70,000  
    Combined company Adjusted EBITDA (incl. synergies)                       $ 229,963  

    1Represents estimated full year 2026 Adjusted EBITDA synergies, with further opportunities for expanded synergies in the following years. Ex-TAC Gross Profit and Adjusted EBITDA are non-GAAP financial measures. See “Non-GAAP Reconciliations” below.
    2Represents estimated full year 2026 Adjusted EBITDA synergies, with further opportunities for expanded synergies in the following years

    The MIL Network

  • MIL-OSI Europe: Government expands opportunities for Swedish businesses to help support Ukraine’s reconstruction

    Source: Government of Sweden

    Government expands opportunities for Swedish businesses to help support Ukraine’s reconstruction – Government.se

    Please enable javascript in your browser

    Press release from Ministry for Foreign Affairs

    Published

    The Government has amended the conditions and expanded the framework for special export credit guarantees for doing business with Ukraine. The aim is to enable more businesses to export to Ukraine and thus contribute to the country’s sustainable reconstruction. It should now also be possible to offer guarantees with longer maturities, higher coverage and that cover services. The amendments to the regulation took effect on 1 February. The Government has also expanded the existing framework of SEK 333 million to SEK 555 million. In total, guarantees can be offered to a maximum of SEK 888 million.

    “Swedish businesses both want and are able to contribute more to Ukraine’s reconstruction, but they need support that mitigates the risk. The aim of amending the conditions is to make it easier and safer for Swedish companies to export to Ukraine. This is an important step in Sweden’s contribution to the country’s reconstruction,” explains Minister for International Development Cooperation and Foreign Trade Benjamin Dousa.

    The regulation on special export credit guarantees for Ukraine came into force on 1 April 2024. This means that exporting companies can apply for special export credit guarantees through the Swedish Export Credit Agency to do business that helps support economic and social development and welfare in Ukraine. In 2024, SEK 333 million was set aside for these special export credit guarantees for Ukraine, with this amount subsequently raised in 2025 to SEK 888 million.

    The amendments to the regulation will make it even easier for more companies to export to Ukraine. The maximum maturity of the guarantees has been adjusted from three to four years, with coverage expanded from 80 per cent to a maximum of 95 per cent. The amount that can be granted to businesses that form part of the same group has now been raised from SEK 100 million to SEK 300 million.

    Press contact

    MIL OSI Europe News